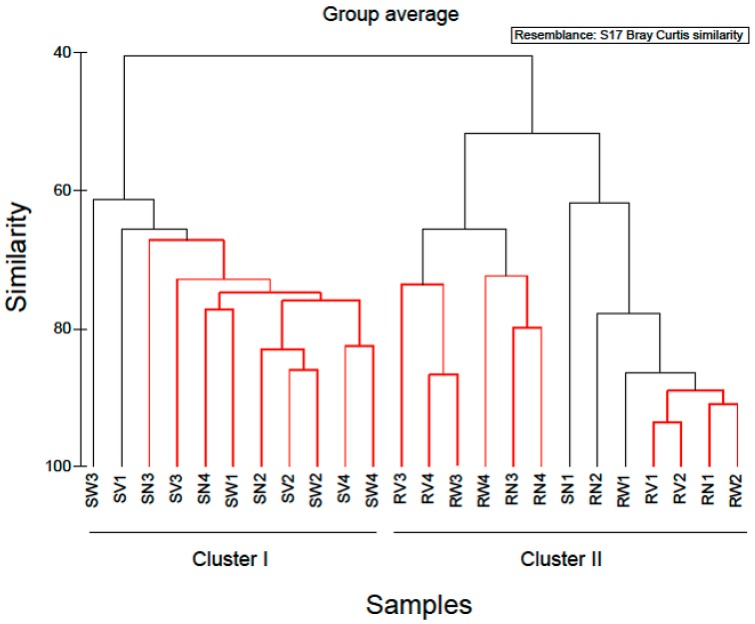
Figure 4.
Cluster diagram based on Bray-Curtis dissimilarities calculated based on the non-transformed number of reads of OTUs found during the study. Red clades in the dendrogram indicate significant bifurcations, based on the SIMPROF significance test. The labels SN, SW, SV represent samples from RTE spinach salad without any treatment and with water and vinegar treatment, respectively. The labels RN, RW, RV represent samples from RTE rocket salad without any treatment and with water and vinegar treatment, respectively.

