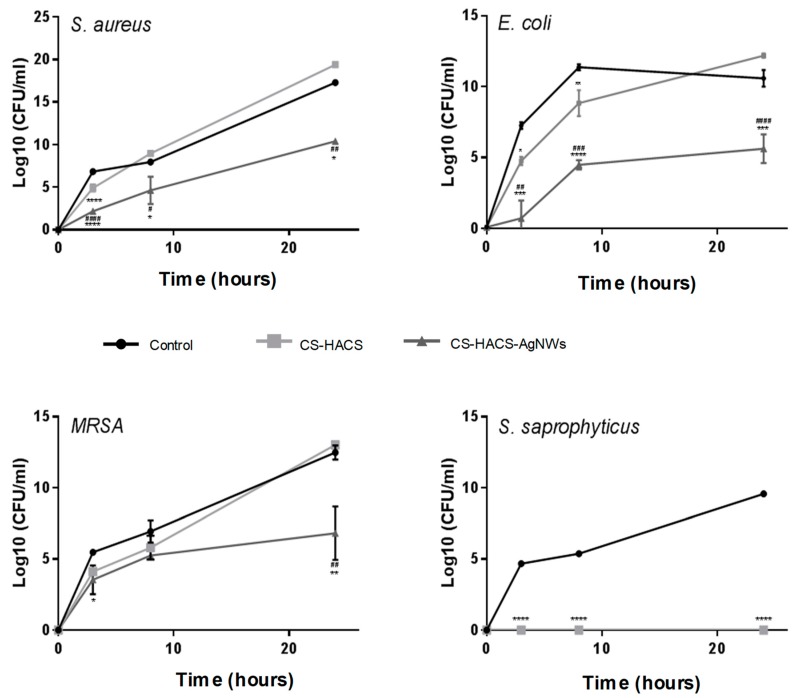
Figure 7.
Growth of S. aureus, E. coli, MRSA and S. saprophyticus in suspensions containing CS-HACS (light grey), CS-HACS-AgNWs (dark grey) and LB only (black). Results are reported as mean ± SD. One-way ANOVA was performed between different samples, when significant a Tukey’s post-hoc multicomparison test was performed, results are reported on the graph. * represents the statistical difference between scaffolds and bacterial suspensions (* p < 0.05, ** p < 0.01; *** p < 0.001 and **** p < 0.0001) while # represents the statistical difference between CS-HACS and CS-HACS-AgNWs scaffolds (# p < 0.05, ## p < 0.01; ### p < 0.001 and #### p < 0.0001).

