

Abstract
Background
Obesity and insulin resistance are characterized by metabolic inflexibility, a condition described as an inability to switch from fat oxidation during fasting to carbohydrate oxidation during hyperinsulinemia. The purpose of this study was to examine predictors of metabolic flexibility in 103 obese (37–59% fat), sedentary (VO2max: 19.4 ± 0.5 ml/kg/min), postmenopausal (45–76 years) women, and changes in metabolic flexibility with exercise and weight loss interventions.
Methods
Insulin sensitivity (M) and metabolic flexibility via an 80 mU/m2/min hyperinsulinemic–euglycemic clamp, VO2max, and body composition were measured. Metabolic flexibility was measured after 6-months aerobic training + weight loss (AEX + WL: n = 43) or weight loss (WL: n = 31). Basal and insulin-stimulated vastus lateralis skeletal muscle samples were available from a subset of these women (n = 45).
Results
Metabolic flexibility correlated inversely with glucose120 min of OGTT, fasting insulin, and the percent change (insulin–basal) in lipoprotein lipase (LPL) activity and positively with M, but not with VO2max, total body fat, visceral fat, or subcutaneous abdominal fat. Skeletal muscle acyl-CoA synthase and citrate synthase activities decreased during hyperinsulinemia. Metabolic flexibility increased after AEX + WL but not WL, and the percent change in metabolic flexibility was inversely related to the percent change in insulin’s effect on LPL activity.
Conclusion
Metabolic flexibility is related to insulin sensitivity and insulin’s action on LPL. Furthermore, metabolic flexibility and insulin suppression of skeletal muscle LPL activity increase with AEX + WL in overweight and obese, sedentary older women.
Introduction
Over half of all middle-aged and older women are either overweight or obese [1], conditions which are associated with type 2 diabetes [2]. This increases the risk for impaired glucose tolerance and diabetes in postmenopausal women compared to younger women [3]. Metabolic flexibility is a condition described as the ability to switch from fat utilization during fasting to carbohydrate utilization during hyperinsulinemia [4]. It is impaired in obese compared to lean subjects [5], and in subjects with a family history of diabetes [6]. Metabolic flexibility is also lower in men and women with type 2 diabetes than people without diabetes [7]. Knowledge of the cellular mechanisms affecting metabolic flexibility in older obese women without diabetes could potentially lead to preventive therapies.
Insulin resistance and mitochodrial dysfunction lead to the inability to modify fuel utilization [8]. Ectopic lipid accumulation leads to lipotoxicity, which contributes to impaired insulin signaling and insulin resistance [9]. Obesity-associated inflammation and the activity of skeletal muscle fatty acid enzymes affect fuel utilization. Inflammation can contribute to obesity-associated insulin resistance [10] and mitochondrial defects [11]. Skeletal muscle enzymes involved in fatty acid metabolism may contribute to switching fuel sources during hyperinsulinemia such as lipoprotein lipase (LPL), acyl-CoA synthase (ACS), carnitine palmitoyltransferase-1 (CPT-1), β-hydroxy acyl-CoA dehydrogenase (β-HAD), and citrate synthase (CS). We recently reported that basal (fasting) skeletal muscle LPL activity was lower, and the ratio of adipose tissue (abdominal and gluteal) to muscle LPL activity higher in overweight and obese postmenopausal women with impaired glucose tolerance compared to women with normal glucose tolerance [12]. These variables improved after 6-month aerobic exercise + weight loss (AEX = aerobic exercise training + WL), but not weight loss (WL) alone, in the women regardless of glucose tolerance status. Similarly, a 4 month AEX intervention increased activities of enzymes involved in fatty acid oxidation, whereas WL alone did not, in older overweight and obese men and women [13].
Mitochondrial dysfunction and insulin resistance are hall-marks of aging [14, 15]. Therefore, we hypothesized that impaired insulin suppression of skeletal muscle LPL, ACS, CPT-1, β-HAD, and CS enzyme activity would be associated with metabolic inflexibility in postmenopausal women. We and others have shown that WL, WL + AEX, and AEX all improve insulin sensitivity (IS) in older obese individuals [13, 16]. However, only AEX with or w/o WL increases mitochondrial function in older obese individuals [12, 13]. We also hypothesize that metabolic flexibility and insulin suppression of muscle LPL, ACS, CPT-1, β-HAD, and CS will improve with exercise training + weight loss, and not following WL alone. The aims of this study are to examine how these factors influence metabolic flexibility as measured during controlled conditions of hyperinsulinemic–euglycemic clamps in older, overweight and obese women, and to determine the effects of 6 months of AEX + WL and WL on metabolic flexibility from our previously published study of women [16] and insulin suppression of enzymes involved in fatty acid metabolism.
Subjects and methods
Subjects
All subjects were healthy, overweight and obese (BMI > 25 kg/ m2; range: 25–47 kg/m2) African American (n = 37) and Caucasian (n = 66) women between the ages of 45–76 years (n = 103). Women were postmenopausal and had not menstruated for at least 1 year. Only women who were weight-stable (<2 kg weight change in past year) and sedentary (<20 min of aerobic exercise 2× per week) were recruited. Subjects were screened by medical history questionnaire, physical examination, and fasting blood profile. Individuals with untreated hypertension or hyperlipidemia were referred to their doctor for therapy and entered the study if they were treated with an antihypertensive or lipid-lowering drug that did not affect glucose metabolism. Subjects were non-smokers, showed no evidence of cancer, liver, renal or hematological disease, or other medical disorders and underwent a Bruce-graded treadmill test to exclude those with asymptomatic coronary artery disease. There were 103 women who completed a glucose clamp and had metabolic flexibility data. Of these, 74 women completed either a weight loss (n = 31) or aerobic exercise + weight loss program (n = 43) (see below). The Institutional Review Board of the University of Maryland approved all methods and procedures. Each participant provided written informed consent to participate in the study.
Procedures
Subjects received instruction in maintaining a weight-stable, Therapeutic Lifestyle Changes (TLC) diet [17], by a Registered Dietitian (RD) 1 day/week for 6–8 weeks, prior to testing. Subjects were weight-stable on the TLC diet prior to testing,
VO2max
VO2max was measured using a continuous treadmill test protocol [16].
Body composition
Height (cm) and weight (kg) were measured to calculate BMI. Fat mass, lean tissue mass and bone mineral content (fat-free mass = lean + bone) were determined by dual-energy X-ray absorptiometry (Prodigy, LUNAR Radiation Corp., Madison, WI). Standard definitions of android and gynoid regions, as defined by the Lunar software, were used. Briefly, the android region is the area around the waist between the mid-point of the lumbar spine and the top of the pelvis and the gynoid region is between the head of the femur and mid-thigh [18]. A single computed tomography (Siemens Somatom Sensation 64 Scanner, Fairfield, CT) scan at L4-L5 region was used to determine visceral adipose tissue area, subcutaneous adipose tissue area, and analyzed using Medical Image Processing, Analysis and Visualization, version 7.0.0 (NIH Center for Information Technology, Bethesda, MD). A second scan at the mid-thigh was used to quantify intramuscular fat area (low density lean tissue), subcutaneous fat, and muscle attenuation [16]; values of the right leg were used in the statistical analyses. Eight women did not undergo CT scans and an additional 14 women do not have subcutaneous abdominal fat data because the field of view was too small.
Fasting blood for plasma cytokines and oral glucose tolerance test (OGTT)
After a 12 h overnight fast, the women had a blood draw in which samples were collected in heparinized syringes, placed in prechilled test tubes containing 1.5 mg EDTA/ml blood, centrifuged at 4 °C and stored at −80 °C until analysis. Plasma for CRP was measured in duplicate and samples for Il-1β, IL-8, IL-6, and TNF-α were measured in triplicate with coefficient of variation (CV) < 10% by electrochemiluminescence using a multi-spot microplate (SECTOR Imager-2400, Meso Scale Discovery, Gaithersburg, MD). For the OGTT, blood samples were drawn before and at 30-min intervals for 2 h after ingestion of 75 g glucose. Plasma glucose concentrations were measured using the glucose oxidase method (2300 STAT Plus, YSI, Yellow Springs, OH). Plasma insulin was measured in duplicate by radioimmunoassay (RIA) (Millipore, St. Charles, MO). The women were defined by glucose tolerance status [19].
Hyperinsulinemic–euglycemic clamps, muscle biopsies, and indirect calorimetry
All subjects were weight stabilized (±2%) for at least 2 weeks prior to metabolic testing and were provided all meals as a eucaloric diet for 2 days before the clamp by a RD to control nutrient intake. All testing was performed in the morning after a 12-h overnight fast. Whole-body insulin sensitivity (M) was measured using a 180 min 80 mU/m2/min (HumulinR, Eli Lilly Co., Indianapolis, IN) hyperinsulinemic–euglycemic clamp [20, 21]. Plasma glucose during each clamp period was 5.0 ± 0.04 mmol/l, which was 96 ± 0.4% of the desired goal with a coefficient of variation of 6.3 ± 0.2% in all 103 clamps. Plasma insulin concentrations during 120–180 min of the hyperinsulinemic–euglycemic clamps were 1101 ± 18 pmol/l. M was calculated from the amount of glucose infused after correction for glucose equivalent space (glucose space correction) and expressed per kg body weight and per kg FFM. Prior to the start of the clamp and at 120-min during the clamp, a vastus lateralis muscle biopsy was taken under local anesthesia (n = 45). Twenty-four hour urine collections were collected the day prior to the clamp. Continuous indirect calorimetry was performed prior to and during the last 30 min of the insulin infusion by the open circuit dilution technique using a SensorMedics DeltaTrac cart (Yorba Linda, CA). Metabolic flexibility was calculated as difference in respiratory quotient from basal and during the clamp and represents the ability of the body to switch from fat oxidation to carbohydrate oxidation in response to hyperinsulinemia during a hyperinsulinemic–euglycemic clamp [4].
Skeletal muscle analyses
The muscle samples were lyophilized for 48 h and then dissected free of obvious connective tissue, fat and blood. LPL, ACS, CPT-1, β-HAD, and CS activities were measured as described [12, 22–25].
AEX + WL and WL interventions
From our previously published study in these women [16], we calculated metabolic flexibility before and after 6 months of AEX + WL (n = 43) and WL (n = 31). Body composition, hyperinsulinemic–euglycemic clamp results, and basal skeletal muscle enzyme activities were previously published but not metabolic flexibility or changes in enzyme activities during hyperinsulinemia. All women in AEX + WL and WL groups attended weekly weight loss classes led by a RD for instruction in the principles of hypocaloric diet according to TLC guidelines. Diets were monitored by 7-day food records (or 24 h recalls) using the American Diabetes Association exchange list system. Women were instructed to restrict their energy intake by 500 kcal/d. In addition to the weight loss classes, women in AEX + WL also exercised on a treadmill three times per week at our facility. Each exercise session included a 5- to 10-min stretching and warm-up phase and a 5-to 10-min cool-down phase. Duration of exercise progressed to 45–50 min followed by a progression of intensity to >60% VO2max and up to 70–80% VO2max for the 6 months [16].
Data analysis
Descriptive means were calculated on variables. Unpaired t-tests were used to test differences by race. Pearson correlations and partial correlations were used to assess relationships between key variables. The effect of the intervention (WL vs. AEX + WL) was compared using ANOVA. For enzyme activities, there were no race, glucose tolerance or race × glucose tolerance interactions. Statistical significance was set at a two-tailed P < 0.05. Data were analyzed using SPSS (SPSS Inc., Chicago); results are expressed as mean ± SEM.
Results
Descriptive characteristics are presented in Table 1. The age of the women spanned two decades and fitness was generally low. As a group, 70% had normal glucose tolerance and 30% had impaired glucose tolerance. respiratory quotient (RQ) increased from the fasted state to the insulin-stimulated state (0.79 vs. 0.87, P < 0.0001). The total group was first divided to test differences by race. The African American women were heavier (93 ± 2 vs. 85 ± 2 kg, P < 0.05), had a higher BMI (34.6 ± 0.9 vs. 31.4 ± 0.6 kg/m2, P < 0.01) and lean body mass (45.5 ± 1.0 vs. 43.0 ± 0.6 kg, P < 0.05) than Caucasian women but percent body fat (47.9 ± 0.8 vs. 46.8 ± 0.6%) and visceral fat (147 ± 11 vs. 151 ± 8 cm2) were not different. Both subcutaneous abdominal fat (501 ± 27 vs. 402 ± 15 cm2, P < 0.01) and intramuscular fat (23.2 ± 1.2 vs. 18.8 ± 0.9 cm2, P < 0.01) were higher in African American than Caucasian women. There were no differences in VO2max (18.1 ± 0.9 vs. 20.0 ± 0.6 ml/kg/ min), M (63.6 ± 3.4 vs. 65.0 ± 2.2 μmol/kgFFM/min), or metabolic flexibility (0.090 ± 0.010 vs. 0.083 ± 0.006) between African American and Caucasian women, so both groups were combined in the remaining analyses for metabolic flexibility.
Table 1.
Physical and metabolic characteristics
| X ± SEM | |
|---|---|
| Age (year) | 59 ± 1 (n = 103) |
| Weight (kg) | 87.9 ± 1.4 (n = 103) |
| BMI (kg/m2) | 32.6 ± 0.5 (n = 103) |
| VO2max (ml/kg/min) | 19.4 ± 0.50 (n = 88) |
| Percent body fat | 47.2 ± 0.5 (n = 103) |
| Fat mass (kg) | 42.3 ± 1.0 (n = 103) |
| Fat-free mass (kg) | 46.4 ± 0.5 (n = 103) |
| Android fat mass (kg) | 35.4 ± 1.4 (n = 67) |
| Gynoid fat mass (kg) | 75.9 ± 2.2 (n = 67) |
| Android lean mass (kg) | 29.8 ± 0.6 (n = 67) |
| Gynoid lean mass (kg) | 61.8 12.6 (n = 67) |
| Visceral fat area (cm2) | 149.9 ± 6.3 (n = 95) |
| Subcutaneous abdominal fat area (cm2) | 440.0 ± 14.9 (n = 81) |
| Mid-thigh muscle area (cm2) | 73.2 ± 1.6 (n = 95) |
| Mid-thigh intramuscular fat area (cm2) | 20.4 ± 0.8 (n = 95) |
| Fasting plasma glucose (mmol/l) | 5.24 ± 0.05 (n = 102) |
| Glucose @120 min of OGTT (mmol/l) | 6.74 ± 0.18 (n = 101) |
| Fasting plasma insulin (pmol/l) | 87 ± 5 (n = 98) |
| C-reactive protein (ng/l) | 5.41 ± 0.82 (n = 60) |
| IL-1β (ng/ml) | 1.24 ± 0.11 (n = 74) |
| IL-6 (ng/ml) | 5.52 ± 0.66 (n = 74) |
| IL-8 (ng/ml) | 7.41 ± 1.41 (n = 74) |
| TNFα (ng/ml) | 9.17 ± 0.36 (n = 74) |
| M (mg/kg/min) | 6.1 ± 0.2 (n = 103) |
| M (μmol/kgFFM/min) | 64.5 ± 1.8 (n = 103) |
| Metabolic flexibility | 0.086 ± 0.005 (n = 103) |
Data are means SEM
Carbohydrate and lipid oxidation
Fuel utilization changed during the glucose clamp. Fat oxidation decreased 44% during the clamp (basal vs. insulin-stimulated 7.86 ± 0.27 vs. 4.38 ± 0.39 μmol/kgFFM/ min, n = 103, P < 0.0001) and carbohydrate oxidation increased 48% during the clamp (7.34 ± 0.57 vs. 18.24 ± 0.92, μmol/kgFFM/min, n = 103, P < 0.0001).
Fitness, obesity, and insulin sensitivity
Metabolic flexibility was not related to VO2max, total body fat, visceral fat, subcutaneous abdominal fat, android or gynoid fat mass, or mid-thigh low density lean tissue. Metabolic flexibility was negatively related to glucose120 min of OGTT (r = −0.27, P < 0.01), fasting insulin (r = −0.26, P < 0.01), and fat oxidation during the clamp (r = −0.72, P < 0.0001); whereas, it was positively related to carbohydrate oxidation during the clamp (r = 0.69, P < 0.0001), M (r = 0.45, P < 0.0001, Fig. 1), and M/I (r = 0.38, P < 0.0001). Metabolic flexibility was not significantly related to fasting glucose or insulin120 min of OGTT. In a multiple regression model with fasting insulin, glucose120 min, and M, M remained the significant predictor of metabolic flexibility (r2 = 0.21, P = 0.0001). Metabolic flexibility was negatively related to plasma IL-6 (r = −0.28, P < 0.05, n = 74) but not to plasma levels of CRP, Il-1β, IL-8, and TNF-α (data not shown).
Fig. 1.

Relationship of insulin sensitivity to metabolic flexibility in African American (closed circles) and Caucasian (open circles) postmenopausal women (r = 0.45, P < 0.0001, n = 103)
Skeletal muscle enzyme response to insulin
At baseline, insulin decreased ACS and CS activities during the clamp (P < 0.05, Fig. 2) but did not significantly change LPL, CPT-1, or β-HAD (Fig. 2). The change (insulin–basal) in ACS was related to the change in CS activity (r = 0.51, P < 0.001, n = 45). Metabolic flexibility was inversely related to the percent change (insulin–basal) in LPL activity (r = −0.36, P < 0.05, n = 35) such that the women with the highest metabolic flexibility had the greatest decrease in LPL activity during the hyperinsulinemic–euglycemic clamp (Fig. 3).
Fig. 2.
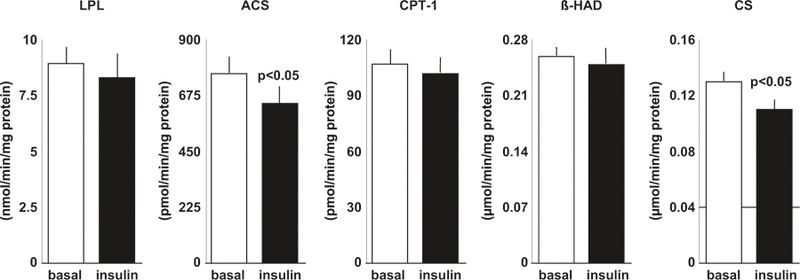
Skeletal muscle enzyme activities of LPL, ACS, CPT-1, β-HAD, and CS during basal and insulin conditions during a hyperinsulinemic-euglycemic clamp in postmenopausal women
Fig. 3.
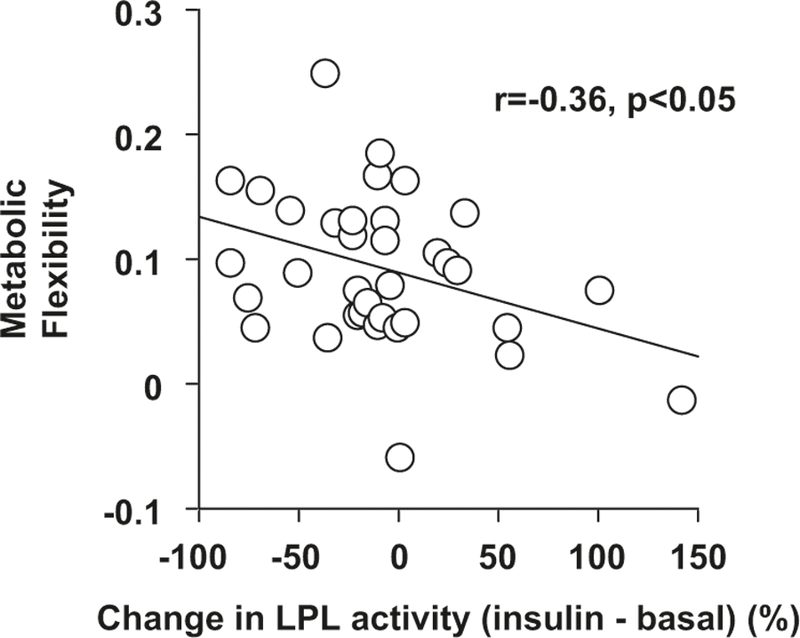
The relationship between the percent change (insulin – basal) in LPL activity and metabolic flexibility in postmenopausal women at baseline (r = –0.36, P < 0.05, n = 35)
Effects of AEX + WL and WL
Utilizing the clamp data [16], we were able to calculate metabolic flexibility changes in 43 women after AEX + WL and 31 women after WL. In brief, there was a loss of body weight in both groups of ~8% (P < 0.0001), whereas VO2max increased 11% after AEX + WL (P < 0.0001) but did not significantly change after WL. Android fat and lean mass decreased after WL (3.9 ± 0.2 vs. 3.4 ± 0.2 kg, P < 0.001 and 3.1 ± 0.9 vs. 2.9 ± 0.9 kg, P < 0.01) and AEX + WL (3.2 ± 0.2 vs. 2.6 ± 0.2 kg, P < 0.001 and 2.9 ± 0.8 vs. 2.8 ± 0.7 kg, P < 0.05). Gynoid fat and lean mass decreased after WL (7.9 ± 0.3 vs. 6.9 ± 0.3 kg and 6.3 ± 0.2 vs. 5.9 ± 0.2 kg, both P < 0.001) and AEX + WL (7.3 ± 0.3 vs. 6.1 ± 0.3 kg, P < 0.001 and 6.0 ± 0.2 vs. 5.9 ± 0.1 kg, P < 0.01). Metabolic flexibility increased 62 ± 24% (percent change one-way ANOVA, P = 0.01) after AEX + WL (0.090 ± 0.009 vs. 0.117 ± 0.016) but did not significantly change (6 ± 20%) after WL (0.087 ± 0.01 vs. 0.083 ± 0.008, P = 0.8). In the entire group, changes in body weight (r = −0.24, P < 0.05), android fat mass (r = −0.40, P < 0.005), gynoid fat mass (r = −0.34, P < 0.05), and insulin sensitivity (M) (r = 0.26, P < 0.05) were related to changes in metabolic flexibility.
Following the interventions, the effect of insulin to suppress LPL activity was different between AEX + WL and WL (P < 0.01, Fig. 4). As the effect of insulin suppression on the other enzymes did not differ by intervention, the WL and AEX + WL data were combined and differences between pre vs. post-intervention basal vs. insulin enzyme activity for ACS, CPT-1, β-HAD, and CS were tested. There were no significant changes in the effect of insulin before and after the interventions (insulin–basal pre vs. insulin–basal post) in ACS (−121 ± 51 vs. −106 ± 72), CPT (−6 ± 7 vs. −8 ± 8), β-HAD (−0.002 ± 0.01 vs. −0.032 ± 0.02) and CS (−0.018 ± 0.008 vs. −0.011 ± 0.01). The percent change in metabolic flexibility in response to intervention was inversely related to the percent change in insulin’s effect to suppress LPL activity (r = −0.47, P < 0.01, n = 30) (Fig. 5) such that the women with the greatest increase in metabolic flexibility in response to the intervention had the greatest change in insulin suppression of LPL activity during the hyperinsulinemic–euglycemic clamp.
Fig. 4.

The effects of weight loss (WL) and aerobic exercise + weight loss (AEX + WL) on the change (post-pre) in insulin’s effect on skeletal muscle LPL activity (P < 0.01)
Fig. 5.

The relationship between the percent change in metabolic flexibility after the interventions and the percent change in skeletal muscle LPL activity (insulin – basal) after the interventions (r = –0.47, P < 0.01, n = 30)
Conclusions
This investigation studied the predictors of metabolic flexibility in a large sample of obese postmenopausal women. Findings implicate insulin sensitivity and glucose tolerance as important contributors to metabolic flexibility in older overweight and obese women. Skeletal muscle LPL activity during basal and hyperinsulinemic conditions of the glucose clamp influences metabolic flexibility. Furthermore, aerobic exercise training with weight loss increases metabolic flexibility and improves insulin-suppression of LPL in these women.
Our findings indicate that metabolic flexibility is not related to total fat, abdominal obesity (android fat mass, visceral, and subcutaneous fat), lower body obesity (gynoid fat mass), or low density lean tissue (intramuscular fat) which suggests that within a group of relatively homogenous overweight and obese women, body fat is not a determinant of the transition from fat to carbohydrate fuel utilization during hyperinsulinemia. Likewise, we do not find a relationship between VO2max and metabolic flexibility, which may be partially attributed to the relatively homogenous study group and low fitness of the women. We further assessed this by combining this group of sedentary postmenopausal women with a sample (n = 23) of middle-aged and older women athletes and healthy normal BMI controls previously studied [26, 27], and observed a significant correlation between metabolic flexibility and VO2max (r = 0.30, P < 0.005). Moreover, adding this group of women to our current sample, we also observed that BMI, percent body fat, total body fat mass, and visceral fat negatively correlated with the change in RQ or metabolic flexibility (r’s range: −0.20 to −0.25, P’s < 0.05). This would corroborate findings that increased body fat is an important constituent of reduced metabolic flexibility in young healthy men [28]. Likewise, metabolic flexibility is lower in overweight and obese compared to lean young (~25 years of age) women [29]. Together these studies would suggest that obesity and regional fat distribution are linked to metabolic flexibility.
We believe this is the first report of metabolic flexibility in exclusively postmenopausal women. The majority of our study sample had normal glucose tolerance (NGT) and none had diabetes. When we control for age and BMI, insulin sensitivity remains a significant predictor of metabolic flexibility. Metabolic inflexibility is observed in men with impaired fasting glucose and impaired glucose tolerance (IGT) compared to men with normal glucose tolerance NGT [30], and differences remain after statistically adjusting for BMI and insulin sensitivity [30]. Although this would suggest that metabolic inflexibility exists independent of insulin resistance, this is not the case in patients with type 2 diabetes [31]. Similar to our findings, others have reported that insulin sensitivity is a significant independent contributor to metabolic flexibility [7].
We also observed that concentrations of IL-6 were negatively associated with metabolic flexibility but not levels of CRP, Il-1β, IL-8, and TNF-α. However, one study showed that soluble TNF-α receptors (sTNFR1 and sTNFR2) were negatively associated with glucose and lipid oxidation and metabolic flexibility during hyperinsulinemia in lean and obese subjects [32]. It is plausible that tissue-specific inflammation may be a better marker of metabolic inflexibility than systemic inflammation. Future studies could be directed at answering this question.
We examined skeletal muscle enzymes which have important roles in lipid metabolism to understand whether their activity is acutely modified in response to insulin and whether these modifications were determinants of metabolic flexibility during hyperinsulinemia. There are a limited number of studies that have examined changes in one or more of these enzymes with in vivo insulin infusion. Farese et al. [33] reported that skeletal muscle LPL activity decreased 14%, and gluteal adipose tissue LPL activity increased threefold following 3 h of a hyperinsulinemic–euglycemic clamp in eight normal-weight subjects. In a study of young healthy subjects, older subjects with type 2 diabetes, and older control subjects, skeletal muscle LPL activity did not change after 4 h of a hyperinsulinemic–euglycemic clamp, whereas abdominal adipose tissue LPL activity increased 1.4-fold in the young subjects [34]. Our results in older postmenopausal women are in agreement in that skeletal muscle LPL did not change significantly during 2 h of hyperinsulinemia. Although the change in LPL with insulin was not significant, our finding that insulin suppression of LPL was related to metabolic flexibility suggests a potential mechanism for the reduction in lipid oxidation and increase in carbohydrate oxidation during hyperinsulinemia. In a study of individuals with type 2 diabetes (n = 8) and lean (n = 7) and obese (n = 6) control subjects, CS was not affected following a 5 h hyperinsulinemic clamp [35]. Yet, we showed a significant decrease in both CS and ACS activities following 2 h of hyperinsulinemia. Because our sample size was more than double (45 vs. 22), this may explain why we observed a significant change in CS activity after only 2 h of hyperinsulinemia. Although insulin suppression of ACS was not related to metabolic flexibility, the observed decrease in ACS activity with insulin suggests that either or both of the two actions of ACS, fatty acid oxidation or triglyceride synthesis are suppressed during hyperinsulinemia of the glucose clamp. The decreases in ACS and CS activity following hyperinsulinemia were strongly correlated in the postmenopausal women suggesting suppression of oxidation of acetyl-CoA derived from fatty acids during the euglycemic clamp.
In studies examining factors that influence metabolic flexibility, in young healthy men, those with smaller adipocytes were more metabolically flexible [28]. Other potential contributing factors to metabolic flexibility include the ability of insulin to suppress non-esterified fatty acids during an insulin infusion, mRNA levels of chemokine genes and macrophage markers in adipose tissue, and circulating adiponectin levels [28]. The positive association between adiponectin and metabolic flexibility was later confirmed in lean and overweight/obese normal glucose tolerant subjects [32]. Only one investigation examined the influence of race to the change in RQ with the use of the glucose clamp [7]. M and metabolic flexibility did not differ between our African American and Caucasian women. Thus, results of Stull et al. [7] are inconsistent with ours as they demonstrated that race was a small contributing factor along with diabetes status in men and women across the age spectrum (18–73 years). It may be difficult to directly compare with our study as we studied only older women and the insulin levels during the clamps were different (80 mU/m2/min vs. their higher insulin levels during 120 mU/ m2/min clamps). As M and metabolic flexibility are different in men without diabetes than those with diabetes [7] and men are more insulin-resistant than women [36], gender and insulin resistance may also confound the comparison between our studies.
Given the relationship between metabolic inflexibility and insulin resistance, it is important to understand whether it is modifiable. A short-term (3-weeks) high-fat diet reduced metabolic flexibility due to a lower glucose oxidation during insulin stimulation [37]. The authors suggest that this might be a physiological adaptation to replenish glycogen stores and hence glucose is not available for oxidation [37]. Exercise training improves peripheral insulin sensitivity, which is associated with enhanced metabolic flexibility in adults with impaired fasting glucose and impaired glucose tolerance [38]. Twelve weeks of exercise training also increases the capacity to store intramyocellular lipid and improves mitochondrial function and metabolic flexibility in men with type 2 diabetes [39]. However, exercise training does not appear to affect metabolic flexibility in normal glucose tolerant healthy controls [39]. We recently reported that insulin activation of glycogen synthase increases after AEX + WL in postmenopausal women with IGT and not NGT [16]. We examined metabolic flexibility in these women and found that metabolic flexibility did not significantly change after weight loss alone but increased after AEX + WL, which is related to improvements in insulin sensitivity. In addition, reductions in upper and lower body obesity as determined by android and gynoid fat mass were related to increased metabolic flexibility. Furthermore, insulin’s effect to suppress skeletal muscle LPL is related to improvements in metabolic flexibility with the exercise intervention suggesting that changes in the regulation of LPL may have a role in the ability of the body to appropriately switch fuel use with exercise and weight loss. This finding in addition to our recent report of a significant decrease in the activity ratios of both gluteal and abdominal adipose tissue to skeletal muscle LPL following aerobic exercise training + weight loss [12] suggest that LPL activity could potentially be a marker of metabolic flexibility in overweight and obese postmenopausal women. Thus, our results would advocate that metabolic flexibility is modifiable by lifestyle modification.
Our findings implicate insulin resistance, glucose intolerance, and the lack of change in LPL with hyperinsulinemia in the metabolic inflexibility in older overweight and obese women. Our results further suggest that exercise training may be necessary to improve metabolic flexibility and that women with the greatest change in insulin effect on LPL had greater improvements in metabolic flexibility. Future research could focus on other molecular mechanisms involved including metabolomics and lipidomics of skeletal muscle and the development of strategies to prevent metabolic inflexibility in postmenopausal women.
Acknowledgements
Our appreciation is extended to the women who participated in this study. We are grateful to Andrew P. Goldberg, M. D., the medical team, nurses, laboratory technicians, and exercise physiologists of the Division of Gerontology and Geriatric Medicine and GRECC, for their assistance to this project. This study was supported by VA Senior Research Career Scientist Award from the United States (U.S., Department of Veterans Affairs (Rehabilitation Research and Development Service) to AS Ryan, and resources of VA Medical Center Baltimore Geriatric Research, Education and Clinical Center (GRECC). This study was supported by NIH grants RO1-AG19310, R01 AG20116, P30-AG028747, and P30 DK072488.
Footnotes
Disclaimer
Publisher's Disclaimer: This is an original submission and is not being submitted for publication elsewhere.
Compliance with ethical standards
Conflict of interest The authors declare that they have no conflict of interest.
References
- 1.Ogden CL, Carroll MD, Curtin LR, McDowell MA, Tabak CJ, Flegal KM. Prevalence of overweight and obesity in the United States, 1999–2004. JAMA 2006;295:1549–55. [DOI] [PubMed] [Google Scholar]
- 2.Mokdad AH, Stroup DF, Giles WH. Public health surveillance for behavioral risk factors in a changing environment. Recommendations from the Behavioral Risk Factor Surveillance Team. MMWR Recomm Rep 2003;52:1–12. [PubMed] [Google Scholar]
- 3.Cowie CC, Rust KF, Byrd-Holt DD, Eberhardt MS, Flegal KM, Engelgau MM, et al. Prevalence of diabetes and impaired fasting glucose in adults in the U.S. population: National Health And Nutrition Examination Survey 1999–2002. Diabetes Care 2006;29:1263–8. [DOI] [PubMed] [Google Scholar]
- 4.Kelley DE, Mandarino LJ. Fuel selection in human skeletal muscle in insulin resistance: a reexamination. Diabetes 2000;49:677–83. [DOI] [PubMed] [Google Scholar]
- 5.Colberg SR, Simoneau JA, Thaete FL, Kelley DE. Skeletal muscle utilization of free fatty acids in women with visceral obesity. J Clin Invest 1995;95:1846–53. [DOI] [PMC free article] [PubMed] [Google Scholar]
- 6.Ukropcova B, Sereda O, de Jonge L, Bogacka I, Nguyen T, Xie H, et al. Family history of diabetes links impaired substrate switching and reduced mitochondrial content in skeletal muscle. Diabetes 2007;56:720–7. [DOI] [PubMed] [Google Scholar]
- 7.Stull AJ, Galgani JE, Johnson WD, Cefalu WT. The contribution of race and diabetes status to metabolic flexibility in humans. Metabolism 2010;59:1358–64. [DOI] [PMC free article] [PubMed] [Google Scholar]
- 8.Galgani JE, Moro C, Ravussin E. Metabolic flexibility and insulin resistance. Am J Physiol Endocrinol Metab 2008;295:E1009–17. [DOI] [PMC free article] [PubMed] [Google Scholar]
- 9.Boren J, Taskinen MR, Olofsson SO, Levin M. Ectopic lipid storage and insulin resistance: a harmful relationship. J Intern Med 2013;274:25–40. [DOI] [PubMed] [Google Scholar]
- 10.Esser N, Legrand-Poels S, Piette J, Scheen AJ, Paquot N. Inflammation as a link between obesity, metabolic syndrome and type 2 diabetes. Diabetes Res Clin Pract 2014;105:141–50. [DOI] [PubMed] [Google Scholar]
- 11.Hernandez-Aguilera A, Rull A, Rodriguez-Gallego E, Riera-Borrull M, Luciano-Mateo F, Camps J, et al. Mitochondrial dysfunction: a basic mechanism in inflammation-related non-communicable diseases and therapeutic opportunities. Mediat Inflamm 2013;2013:135698. [DOI] [PMC free article] [PubMed] [Google Scholar]
- 12.Ortmeyer HK, Goldberg AP, Ryan AS. Exercise with weight loss improves adipose tissue and skeletal muscle markers of fatty acid metabolism in postmenopausal women. Obesity 2017;25: 1246–53. [DOI] [PMC free article] [PubMed] [Google Scholar]
- 13.Menshikova EV, Ritov VB, Dube JJ, Amati F, Stefanovic-Racic M, Toledo FGS, et al. Calorie restriction-induced weight loss and exercise have differential effects on skeletal muscle mitochondria despite similar effects on insulin sensitivity. J Gerontol A Biol Sci Med Sci 2017;73:81–87. [DOI] [PMC free article] [PubMed] [Google Scholar]
- 14.Petersen KF, Befroy D, Dufour S, Dziura J, Ariyan C, Rothman DL, et al. Mitochondrial dysfunction in the elderly: possible role in insulin resistance. Science 2003;300:1140–2. [DOI] [PMC free article] [PubMed] [Google Scholar]
- 15.Johnson ML, Robinson MM, Nair KS. Skeletal muscle aging and the mitochondrion. Trends Endocrinol Metab 2013;24:247–56. [DOI] [PMC free article] [PubMed] [Google Scholar]
- 16.Ryan AS, Ortmeyer HK, Sorkin JD. Exercise with calorie restriction improves insulin sensitivity and glycogen synthase activity in obese postmenopausal women with impaired glucose tolerance. Am J Physiol Endocrinol Metab 2012;302:E145–52. [DOI] [PMC free article] [PubMed] [Google Scholar]
- 17.Lichtenstein AH, Appel LJ, Brands M, Carnethon M, Daniels S, Franch HA, et al. Summary of American Heart Association Diet and lifestyle recommendations revision 2006. Arterioscler Thromb Vasc Biol 2006;26:2186–91. [DOI] [PubMed] [Google Scholar]
- 18.National Health and Nutrition Examination Survey. Dual energy X-ray absorptiometry–android/gynoid measurements 2013. 03/10/ 2015. http://wwwn.cdc.gov/nchs/nhanes/2005-2006/DXXAG_D.htm.
- 19.American Diabetes Association. Diagnosis and classification of diabetes mellitus. Diabetes Care 2009;32(Suppl 1):S62–7. [DOI] [PMC free article] [PubMed] [Google Scholar]
- 20.DeFronzo RA, Tobin JD, Andres R. Glucose clamp technique: a method for quantifying insulin secretion and resistance. Am J Physiol. 1979;237:E214–E223. [DOI] [PubMed] [Google Scholar]
- 21.McGuire EA, Helderman JH, Tobin JD, Andres R, Berman M. Effects of arterial versus venous sampling on analysis of glucose kinetics in man. J Appl Physiol 1976;41:565–73. [DOI] [PubMed] [Google Scholar]
- 22.Srere PA. Citrate synthase. Methods Enzymol 1969;8:3–5. [Google Scholar]
- 23.Lynen F, Wieland OH. ß-Ketoreductase. Methods Enzymol 1955;1:566–73. [Google Scholar]
- 24.Ortmeyer HK, Ryan AS, Hafer-Macko C, Oursler KK. Skeletal muscle cellular metabolism in older HIV-infected men. Physiol Rep 2016;4:e12794. [DOI] [PMC free article] [PubMed] [Google Scholar]
- 25.Mashek DG, Li LO, Coleman RA. Rat long-chain acyl-CoA synthetase mRNA, protein, and activity vary in tissue distribution and in response to diet. J Lipid Res 2006;47:2004–10. [DOI] [PubMed] [Google Scholar]
- 26.Ryan AS, Muller DC, Elahi D. Sequential hyperglycemic–euglycemic clamp to assess beta-cell and peripheral tissue: studies in female athletes. J Appl Physiol 2001;91:872–81. [DOI] [PubMed] [Google Scholar]
- 27.Ryan AS, Nicklas BJ. Age-related changes in fat deposition in mid-thigh muscle in women: relationships with metabolic cardiovascular disease risk factors. Int J Obes Relat Metab Disord 1999;23:126–32. [DOI] [PubMed] [Google Scholar]
- 28.Sparks LM, Ukropcova B, Smith J, Pasarica M, Hymel D, Xie H, et al. Relation of adipose tissue to metabolic flexibility. Diabetes Res Clin Pract 2009;83:32–43. [DOI] [PMC free article] [PubMed] [Google Scholar]
- 29.Adamska A, Karczewska-Kupczewska M, Nikolajuk A, Otziomek E, Gorska M, Kowalska I, et al. Normal metabolic flexibility despite insulin resistance women with polycystic ovary syndrome. Endocr J 2013;60:1107–13. [DOI] [PubMed] [Google Scholar]
- 30.Faerch K, Vaag A. Metabolic inflexibility is a common feature of impaired fasting glycaemia and impaired glucose tolerance. Acta Diabetol 2011;48:349–53. [DOI] [PubMed] [Google Scholar]
- 31.Galgani JE, Heilbronn LK, Azuma K, Kelley DE, Albu JB, Pi-Sunyer X, et al. Metabolic flexibility in response to glucose is not impaired in people with type 2 diabetes after controlling for glucose disposal rate. Diabetes 2008;57:841–5. [DOI] [PMC free article] [PubMed] [Google Scholar]
- 32.Adamska A, Nikolajuk A, Karczewska-Kupczewska M, Kowalska I, Otziomek E, Gorska M, et al. Relationships between serum adiponectin and soluble TNF-alpha receptors and glucose and lipid oxidation in lean and obese subjects. Acta Diabetol 2012;49:17–24. [DOI] [PMC free article] [PubMed] [Google Scholar]
- 33.Farese RV Jr., Yost TJ, Eckel RH. Tissue-specific regulation of lipoprotein lipase activity by insulin/glucose in normal-weight humans. Metabolism 1991;40:214–6. [DOI] [PubMed] [Google Scholar]
- 34.Ruge T, Sukonina V, Kroupa O, Makoveichuk E, Lundgren M, Svensson MK, et al. Effects of hyperinsulinemia on lipoprotein lipase, angiopoietin-like protein 4, and glycosylphosphatidylinositol-anchored high-density lipoprotein binding protein 1 in subjects with and without type 2 diabetes mellitus. Metabolism 2012;61:652–60. [DOI] [PubMed] [Google Scholar]
- 35.Kruszynska YT, Mulford MI, Baloga J, Yu JG, Olefsky JM. Regulation of skeletal muscle hexokinase II by insulin in non-diabetic and NIDDM subjects. Diabetes 1998;47:1107–13. [DOI] [PubMed] [Google Scholar]
- 36.Ryan AS, Katzel LI, Prior SJ, McLenithan JC, Goldberg AP, Ortmeyer HK. Aerobic exercise plus weight loss improves insulin sensitivity and increases skeletal muscle glycogen synthase activity in older men. J Gerontol A Biol Sci Med Sci 2013;69:790–8. [DOI] [PMC free article] [PubMed] [Google Scholar]
- 37.van Herpen NA, Schrauwen-Hinderling VB, Schaart G, Mensink RP, Schrauwen P. Three weeks on a high-fat diet increases intrahepatic lipid accumulation and decreases metabolic flexibility in healthy overweight men. J Clin Endocrinol Metab 2011;96: E691–5. [DOI] [PubMed] [Google Scholar]
- 38.Malin SK, Haus JM, Solomon TP, Blaszczak A, Kashyap SR, Kirwan JP. Insulin sensitivity and metabolic flexibility following exercise training among different obese insulin-resistant phenotypes. Am J Physiol Endocrinol Metab 2013;305:E1292–8. [DOI] [PMC free article] [PubMed] [Google Scholar]
- 39.Meex RC, Schrauwen-Hinderling VB, Moonen-Kornips E, Schaart G, Mensink M, Phielix E, et al. Restoration of muscle mitochondrial function and metabolic flexibility in type 2 diabetes by exercise training is paralleled by increased myocellular fat storage and improved insulin sensitivity. Diabetes 2010;59: 572–9. [DOI] [PMC free article] [PubMed] [Google Scholar]