

Summary
Ascochyta blight (AB) is one of the major biotic stresses known to limit the chickpea production worldwide. To dissect the complex mechanisms of AB resistance in chickpea, three approaches, namely, transcriptome, small RNA and degradome sequencing were used. The transcriptome sequencing of 20 samples including two resistant genotypes, two susceptible genotypes and one introgression line under control and stress conditions at two time points (3rd and 7th day post inoculation) identified a total of 6767 differentially expressed genes (DEGs). These DEGs were mainly related to pathogenesis‐related proteins, disease resistance genes like NBS‐LRR, cell wall biosynthesis and various secondary metabolite synthesis genes. The small RNA sequencing of the samples resulted in the identification of 651 miRNAs which included 478 known and 173 novel miRNAs. A total of 297 miRNAs were differentially expressed between different genotypes, conditions and time points. Using degradome sequencing and in silico approaches, 2131 targets were predicted for 629 miRNAs. The combined analysis of both small RNA and transcriptome datasets identified 12 miRNA‐mRNA interaction pairs that exhibited contrasting expression in resistant and susceptible genotypes and also, a subset of genes that might be post‐transcriptionally silenced during AB infection. The comprehensive integrated analysis in the study provides better insights into the transcriptome dynamics and regulatory network components associated with AB stress in chickpea and, also offers candidate genes for chickpea improvement.
Keywords: miRNA , differentially expressed genes, fungal stress, mRNA targets, Ascochyta blight resistance, miRNA‐mRNA , cleavage
Introduction
Chickpea (Cicer arietinum L.) is one of the most widely grown legume crops with an annual global production of ~12.09 million tons (FAO, 2016). It is a self‐pollinated, diploid annual crop grown mostly in arid and semi‐arid regions of the world. It is a rich source of proteins and essential amino acids for millions of people living in developing countries. Along with substantial nutritive value, like other legume crops, chickpea crop increases soil fertility by fixing atmospheric nitrogen. Owing to the high nutritional and commercial importance of chickpea, several research efforts have been carried out in recent past to increase its production. However, chickpea production is far below its demand and has not achieved its potential yield owing to major constraints in the form of several biotic stresses like Ascochyta blight, Fusarium wilt and abiotic stresses like drought, salinity, heat. Though earlier efforts have considerably enhanced chickpea productivity, there is still a need to take more rigorous steps towards chickpea improvement to meet its demand.
Ascochyta blight (AB), caused by fungus Ascochyta rabiei, is an important foliar disease of chickpea. AB is necrotrophic in nature and is rampant under cool and humid weather conditions. AB infection usually leads to necrotic lesions on leaves, stem breakage, pod abortion and eventually the plant death (Pande et al., 2005). The severity of the disease is manifested in the form of 100% yield loss under favorable conditions. The occurrence of AB has been reported from more than 40 countries across the globe (Sharma and Ghosh, 2016). The management of AB relies upon an integrated approach that includes intensive fungicide application, crop rotation strategies, seed treatment and use of resistant cultivars. However, the use of varieties resistant to AB remains the most cost‐effective and environmentally sustainable solution to tackle AB. The emergence of A. rabiei virulent isolates with low sensitivity towards fungicides further adds to the need for development of AB resistant chickpea cultivars (Sharma and Ghosh, 2016). With an objective to develop AB resistant cultivars through molecular breeding, a number of QTLs for AB resistance on various linkage groups have been reported (Li et al., 2017a; Sabbavarapu et al., 2013). Furthermore, seven introgression lines for two QTLs conferring resistance to AB (ABQTL‐I and ABQTL‐II) have been developed through marker‐assisted backcrossing (Varshney et al., 2014). However, to fasten the molecular breeding process and tackle the issue of possible evolution of AB pathogen(s), it is important to have the deeper knowledge of AB resistance mechanisms in chickpea.
Disease resistance is a complex phenomenon involving numerous mechanisms. When under stress, plants develop a myriad of mechanisms for sensing and adapting to the environmental changes through a network of genetic regulations. These genetic regulations include alteration in gene expression at both transcriptional and post‐transcriptional levels, resulting in changes in signal transduction pathways and other metabolic processes. Several approaches such as microarrays, EST sequencing and RNA sequencing (RNA‐seq) have been used to study these genetic regulations. However, RNA‐seq facilitates the transcript identification and gene expression quantification in a robust way and has been widely used to understand the transcriptional dynamics in plants. In the case of chickpea, several transcriptome studies have been undertaken to identify key abiotic stress‐responsive genes for tolerance to drought and salinity (Garg et al., 2016; Mashaki et al., 2018). In contrast, for identification of biotic stress‐responsive genes in chickpea, a few studies have been reported (Jain et al., 2015; Upasani et al., 2017). In case of AB stress mechanism, a few gene expression studies have been performed, mainly using 768‐features expression arrays (Coram and Pang, 2006; Mantri et al., 2010), however, a genome‐wide and comprehensive analysis of genes involved in AB resistance is not yet available.
It is well studied that epigenetic regulations in the form of small non‐coding RNAs are known to alter the gene expression. Small RNAs such as microRNAs (miRNAs) are 20–24 nucleotide (nt) endogenous non‐coding RNAs derived from single‐stranded stem‐loop precursors. In plants, miRNAs not only control the post‐transcriptional regulation of their targets but also interact with each other in regulatory networks affecting development and responses to biotic and abiotic stresses. miRNAs control the expression of genes in spatial and temporal‐specific manner in response to stress. A number of studies have suggested the importance of miRNAs in plant defense response (Kohli et al., 2014; Sarkar et al., 2017). Although miRNAs have been extensively studied in plants, their regulatory mechanism is still unclear on miRNA‐mediated response to biotic stress. For understanding the miRNA responses, the accurate and confident prediction of targets is indispensable. Plant miRNAs are known to have perfect or near‐perfect complementarity with their targets and can be predicted using both computational tools and sequencing approaches like degradome analysis. Recently, a few studies on the integrated analysis of mRNA and miRNA expression profiles have been published (Cao et al., 2017; Guo et al., 2017; Sarkar et al., 2017). For instance, an extensive interaction analysis of mRNA and miRNA uncovered the molecular interactions between pathogen Potato virus Y and tobacco (Guo et al., 2017). Similarly, another study identified important regulators of Alternaria‐stress response in tomato (Sarkar et al., 2017).
With an objective to get deeper insights into the AB resistance mechanisms in chickpea as well as to understand molecular interactions between A. rabiei and chickpea, the present study employed transcriptome, small RNA and degradome sequencing approaches using diverse chickpea genotypes including two susceptible genotypes, two resistant genotypes and an introgression line carrying two AB‐resistance QTLs. A comprehensive and integrated analysis of these different datasets have identified differentially expressed genes (DEGs), miRNAs, their targets and also delineated the interplay between all these components in chickpea in response to AB.
Results
Transcriptome sequencing
In the study, 20 samples representing two moderately resistant genotypes (ICCV 05530 and ILC 3279), two susceptible genotypes (C 214 and Pb 7) and one introgression line showing resistance to AB (BC3F6), under control (non‐inoculated) and stress (AB inoculated) conditions at two time points [3rd and 7th day post inoculation (dpi)] were sequenced. A total of 1350.1 million reads were generated from the paired‐end sequencing of these 20 samples. After the stringent quality filters, 96.7% (1305.2 million) of the reads representing high‐quality reads were processed for further analysis. These reads were mapped on the chickpea genome sequence. On an average, about 93% (1208.2 million) of the high‐quality reads were mapped to the chickpea genome. The sequencing data and mapping statistics reflect a very high‐quality transcriptome sequencing. The sample‐wise details of sequence data generated, filtered reads and reads mapped on the genome are given in Table 1. A reference‐guided assembly of the mapped reads using Cufflinks–Cuffmerge pipeline identified a total of 31 459 genes. For ease of understanding, the samples have been designated as genotype‐condition‐time point. For example, the sample ILC 3279‐C‐3d denotes genotype ILC 3279 in control condition at 3rd dpi and ILC 3279‐S‐7d denotes genotype ILC 3279 under stress condition at 7th dpi.
Table 1.
Summary of transcriptome and small RNA sequencing data generated for 20 samples using Illumina sequencing platform
| Sample | Transcriptome sequencing | Small RNA sequencing | |||||||||
|---|---|---|---|---|---|---|---|---|---|---|---|
| Raw reads | High‐quality reads (Q20) | Uniquely mapped reads | Raw reads | High‐quality reads (Q20) | Reads <18 or >35 nt | Repeat reads | rRNA reads | tRNA reads | snoRNA reads | miRNA reads | |
| BC3F6‐C‐3d | 60 749 026 | 58 307 286 | 53 925 123 | 34 541 167 | 33 788 438 | 5 580 073 | 18 940 014 | 3 231 640 | 410 549 | 13 629 | 704 514 |
| BC3F6‐C‐7d | 70 143 768 | 68 035 056 | 63 282 216 | 22 643 884 | 22 180 985 | 10 116 568 | 7 858 455 | 783 815 | 146 372 | 10 521 | 264 770 |
| BC3F6‐S‐3d | 67 510 428 | 65 028 960 | 59 715 937 | 26 974 790 | 26 301 095 | 1 229 051 | 16 089 121 | 2 925 903 | 303 676 | 23 025 | 706 916 |
| BC3F6‐S‐7d | 68 727 054 | 66 718 240 | 61 029 562 | 26 470 944 | 25 146 500 | 1 915 689 | 13 676 356 | 5 201 517 | 456 734 | 21 767 | 494 801 |
| C 214‐C‐3d | 61 050 574 | 59 154 326 | 55 109 324 | 22 854 828 | 22 225 437 | 1 522 720 | 10 067 883 | 3 250 766 | 1 422 273 | 10 490 | 337 310 |
| C 214‐C‐7d | 56 480 126 | 53 942 318 | 49 588 638 | 22 070 578 | 20 933 738 | 1 153 972 | 14 526 247 | 1 438 068 | 281 500 | 14 580 | 558 848 |
| C 214‐S‐3d | 71 989 730 | 69 824 680 | 64 680 734 | 28 023 898 | 27 680 554 | 3 747 207 | 17 484 491 | 1 874 295 | 274 061 | 10 887 | 795 241 |
| C 214‐S‐7d | 54 366 940 | 52 685 694 | 48 200 639 | 25 493 856 | 24 376 962 | 2 090 016 | 14 421 146 | 3 648 744 | 354 864 | 17 654 | 523 387 |
| ICCV 05530‐C‐3d | 62 478 856 | 60 571 968 | 56 135 229 | 23 472 528 | 23 065 108 | 1 379 015 | 14 068 233 | 2 474 119 | 345 157 | 7008 | 685 411 |
| ICCV 05530‐C‐7d | 61 582 488 | 59 373 280 | 55 193 397 | 26 808 926 | 26 211 017 | 1 954 666 | 16 533 251 | 2 406 505 | 389 040 | 10 385 | 793 820 |
| ICCV 05530‐S‐3d | 72 688 564 | 70 523 506 | 65 673 033 | 27 114 190 | 26 651 176 | 6 261 321 | 13 657 927 | 2 112 152 | 418 415 | 9621 | 549 230 |
| ICCV 05530‐S‐7d | 60 137 372 | 58 124 704 | 53 907 489 | 30 629 458 | 29 368 612 | 2 184 853 | 20 559 115 | 2 109 075 | 270 702 | 23 633 | 634 595 |
| ILC 3279‐C‐3d | 64 575 072 | 61 999 362 | 57 803 426 | 23 345 383 | 22 849 072 | 4 501 471 | 12 642 469 | 1 495 647 | 262 078 | 7346 | 589 180 |
| ILC 3279‐C‐7d | 76 446 674 | 73 443 334 | 68 266 373 | 27 087 841 | 26 408 530 | 1 382 123 | 15 514 413 | 4 573 745 | 1 159 799 | 26 461 | 464 350 |
| ILC 3279‐S‐3d | 72 895 320 | 70 857 522 | 66 052 608 | 26 789 897 | 26 341 109 | 3 771 272 | 16 144 324 | 2 702 064 | 420 439 | 11 167 | 530 720 |
| ILC 3279‐S‐7d | 89 086 896 | 86 289 642 | 80 162 092 | 34 242 425 | 32 843 585 | 2 712 995 | 21 536 934 | 2 320 354 | 564 990 | 43 003 | 615 380 |
| Pb 7‐C‐3d | 74 253 380 | 72 194 662 | 67 235 029 | 24 407 891 | 23 917 009 | 3 709 743 | 14 481 335 | 1 702 670 | 274 383 | 6709 | 446 905 |
| Pb 7‐C‐7d | 68 789 242 | 66 062 580 | 60 745 741 | 25 950 674 | 24 510 418 | 1 945 959 | 16 856 448 | 2 774 137 | 317 118 | 12 515 | 411 616 |
| Pb 7‐S‐3d | 63 411 320 | 61 656 214 | 56 936 881 | 23 748 014 | 23 308 958 | 985 519 | 16 104 515 | 2 059 807 | 207 396 | 16 776 | 500 210 |
| Pb 7‐S‐7d | 72 782 344 | 70 378 552 | 64 606 941 | 30 137 829 | 29 084 571 | 1 923 999 | 17 582 076 | 4 041 252 | 488 877 | 19 078 | 673 225 |
| Total | 1 350 145 174 | 1 305 171 886 | 1 208 250 412 | 532 809 001 | 517 192 874 | 60 068 232 | 308 744 753 | 53 126 275 | 8 768 423 | 316 255 | 11 280 429 |
Differential gene expression analysis
For studying the differential gene expression, the genes with very low expression values in all the samples were filtered out. A gene was considered to be expressed in a given sample if its FPKM ≥ 1, and the quantification status ‘OK’. Using these criteria, a total of 21 527 genes were found to be expressed in at least one of the samples. After filtering the lowly expressed genes, the fold change of each gene was calculated across 34 pairwise combinations using Cuffdiff. In total, 6767 genes were found to show significant differential expression between any two samples. The number of DEGs ranged from 284 (183 up‐regulated; 101 down‐regulated) between BC3F6‐C‐3d and Pb 7‐C‐3d to 2607 (953 up‐regulated; 1654 down‐regulated) between ICCV 05530‐S‐7d and C 214‐S‐7d (Figure 1a–c). Upon AB infection, the trend of down‐regulation was more intense at 3rd dpi in contrast to 7th dpi where the higher number of genes were found to be up‐regulated in each genotype (Figure 1a). Under control conditions, a significant number of DEGs were identified from different genotype combinations with the highest number of DEGs between ILC 3279 and Pb 7 (901 up‐regulated; 255 down‐regulated) at 3rd dpi and between ILC 3279 and C 214 (812 up‐regulated; 1290 down‐regulated) at 7th dpi (Figure 1b). Similarly, upon infection, the maximum DEGs were found between ILC 3279 and Pb 7 (811 up‐regulated; 581 down‐regulated) at 3rd dpi and between ICCV 05530 and C 214 (953 up‐regulated; 1654 down‐regulated) at 7th dpi (Figure 1c). Further, an overlap between different genotypes under control and stress conditions at both 3rd dpi and 7th dpi was analyzed. It was observed that a large fraction of DEGs was unique to each combination. A total of 1754 and 1903 DEGs exhibited genotype‐specific differential expression patterns under stress at 3rd dpi and 7th dpi, respectively. Under stress, at 3rd dpi, ILC 3279 exhibited highest number of genotype‐specific stress‐responsive DEGs (499) and lowest in ICCV 05530 (172). At 7th dpi, the maximum DEGs were specifically expressed in C 214 (605) and minimum in BC3F6 line (257) (Figure 1d and e). A total of 1355 genes were differentially expressed at both 3rd and 7th dpi in any of the genotype upon stress. Overall, these results indicate genotype‐ and stage‐ specific response upon fungal infection in chickpea.
Figure 1.
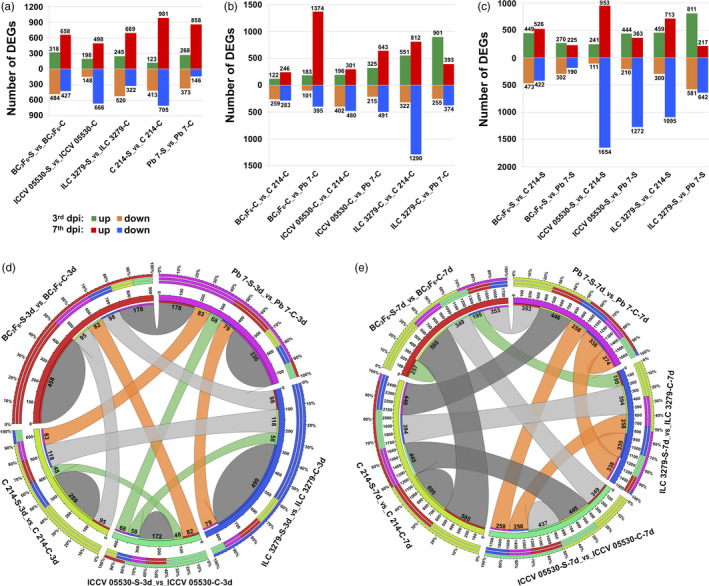
An overview of differentially expressed genes (DEGs) in various combinations of resistant (ICCV 05530, ILC 3279 and BC 3F6) and susceptible (C 214 and Pb 7) genotypes in response to Ascochyta blight (AB) infection. (a) Number of DEGs in each chickpea genotype at 3rd and 7th day post inoculation (dpi) under control and stress conditions are presented in the bar graph. The number of up‐ and down‐ regulated genes are depicted in the form of bars above and below the x‐axis, respectively; (b) Number of DEGs between different genotypes at both 3rd and 7th dpi under control conditions; (c) Number of DEGs between different genotypes at both 3rd and 7th dpi under stress conditions. Circos depicting overlapping and specific response of DEGs within AB related genotypes under control and stress conditions at (d) 3rd dpi and (e) 7th dpi. The number of genes showing specific and overlapping response is mentioned.
Out of 6767 significant DEGs, 5309 were annotated using blastx and the gene ontology (GO) terms were assigned to 4559 genes. For these 4559 genes, a total of 10 962 GO terms were obtained. It was seen that the GO terms for DEGs were uniformly assigned to each of the biological process (3632), molecular function (3744) and cellular component (3586) categories. GO enrichment analysis of DEGs revealed that under biological process category, oxidation‐reduction process (GO:0055114), regulation of transcription (GO:0006355), defense response to fungus (GO:0050832), response to chitin (GO:0010200), response to salicylic acid (GO:0009751), response to jasmonic acid (GO:0009753), response to abscisic acid (GO:0009737), ethylene‐activated signaling pathway (GO:0009873) and response to auxin (GO:0009733) were the most significantly enriched terms. The significantly enriched GO terms were further clustered to obtain the highly interconnected GO clusters (Figure 2a). Among molecular function category, ATP binding (GO:0005524), protein serine/threonine kinase activity (GO:0004674), oxidoreductase activity (GO:0016491), peroxidase activity (GO:0004601), hydrolase (GO:0016787) and monooxygenase activity (GO:0004497) were significantly over‐represented. In cellular component category, plant‐type cell wall (GO:0009505), apoplast (GO:0048046) and anchored component of membrane (GO:0031225) were the most enriched ones. Further, the pathway analysis of DEGs was carried out to understand their molecular mechanisms using KEGG database. The DEGs were found to represent a total of 134 pathways. The enrichment analysis suggested that under AB infection, metabolic pathways (ko01100), biosynthesis of secondary metabolites (ko01110), plant hormone signal transduction (ko04075) and plant‐pathogen interaction (ko04626) were among the most enriched pathways (Figure 2b). In the study, 891 transcription factor (TF) encoding genes belonging to 50 families were differentially expressed. Among these, bHLH (91), ERF (90), MYB (75), NAC (68) and WRKY (65) were the most over‐represented TF families. A significant number of other TF families like C2H2, bZIP and MADS were also found to show different expression patterns under stress conditions. The differential expression specificity of 10 most abundant TF families in all genotypes under stress condition was studied (Figure 2c). It was seen that at 7th dpi, the number of differentially expressed TF encoding genes were higher in all genotypes. A very limited number of TF families showed preferential differential expression pattern in different genotypes under stress. For instance, the number of differentially expressed WRKY members were relatively more in susceptible genotypes as compared to resistant ones.
Figure 2.
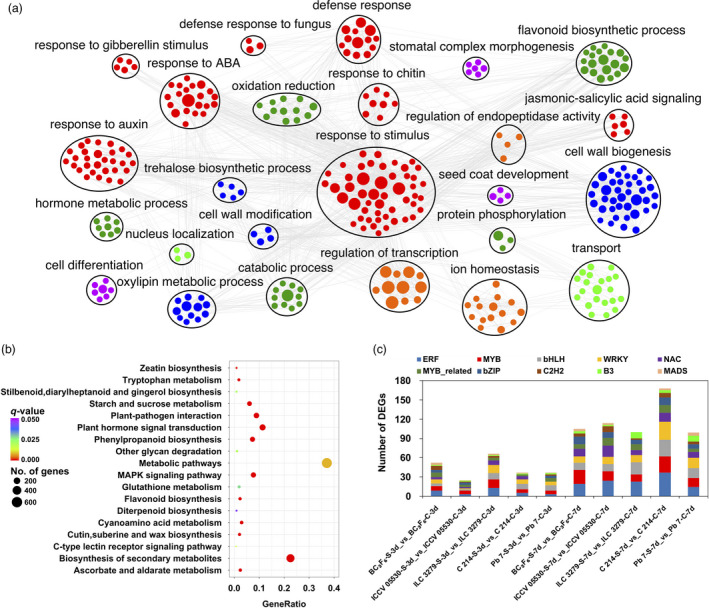
Annotation and pathway analysis of identified differentially expressed genes (DEGs). (a) Gene Ontology enrichment analysis of all identified DEGs; (b) Scatter plot of most enriched KEGG pathways of DEGs. Gene ratio represents the ratio of the number of DEGs in the pathway and total number of DEGs with pathway annotation; Q value represents corrected P‐value; (c) Number of genes from top 10 TF families showing differential expression patterns in each genotype under control and stress conditions.
For AB resistance, several QTLs have been reported until now (see Sagi et al., 2017). These QTLs were physically mapped on six chickpea pseudomolecules by using the markers flanking these QTLs. Out of the 6767 DEGs, 1138 co‐localized with 11 AB resistance QTLs. Among these co‐localized genes, 226 DEGs were novel. Maximum DEGs were located in QTLs reported by Sabbavarapu et al. (2013) which included QTL AB‐Q‐SR‐4‐1 (176) present on pseudomolecule Ca4, AB‐Q‐APR‐6‐1 (227) and AB‐Q‐APR‐6‐2 (37) located on Ca6. The genomic localization of AB resistance QTLs, DEGs, TFs and an overall expression of the DEGs in each genotype at both time points are illustrated in Figure 3.
Figure 3.
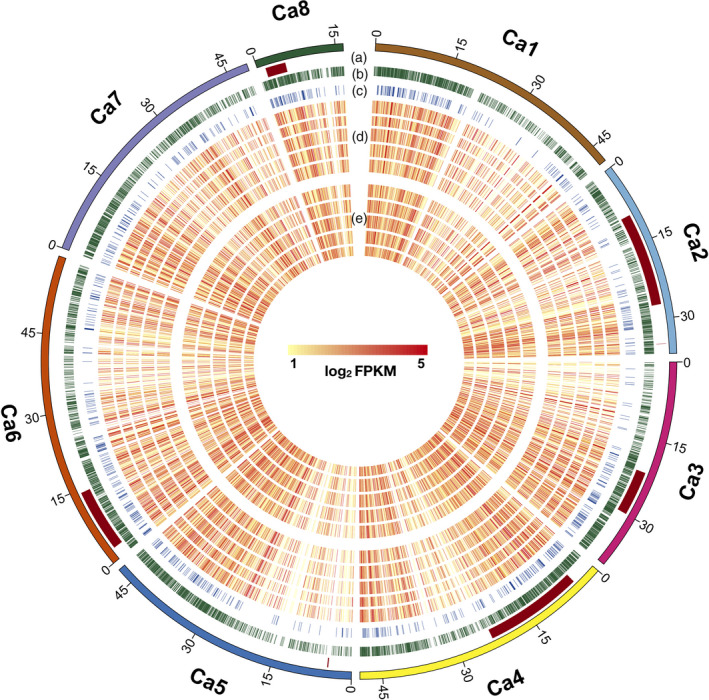
A circular plot showing genome‐wide distribution of Ascochyta blight (AB) resistance QTLs, differentially expressed genes (DEGs), transcription factors (TFs) and expression of genes at 3rd and 7th day post inoculation (dpi). Five different tracks (out to in) of the circular plot shows following: (a) AB resistance QTLs; (b) DEGs; (c) Differentially expressed TFs; (d) Expression of genes (log2 FPKM) in different genotypes at 3rd dpi (moving from out to in; ICCV 05530, ILC 3279, BC 3F6, C 214 and Pb 7); (e) Expression of genes (log2 FPKM) in different genotypes at 7th dpi (moving from out to in; ICCV 05530, ILC 3279, BC 3F6, C 214 and Pb 7).
Expression trends across the chickpea genotypes under control and stress conditions
Defense response involves substantial transcriptional reprogramming in plants. Using clustering analysis, we identified genes with similar expression trends across resistant (ILC 3279, ICCV 05530 and BC3F6) and susceptible genotypes (C 214 and Pb 7) at different time points. The DEGs were clustered into six major clusters on the basis of similar expression profiles (Figure 4). Under control conditions, a trend of up‐regulation was more profound in resistant genotypes. The Cluster I consisted of genes showing induced expression in resistant genotypes at either 3rd dpi or 7th dpi. The GO enrichment of these genes revealed that most of these genes were involved in response to salicylic acid, metabolic process, oxidation‐reduction process, flavonoid biosynthetic process and response to biotic stimulus. Interestingly, disease resistance genes like chitinases (Ca_04405), CC‐NBS‐LRR (Ca_08361) and dirigent protein (Ca_20726) were significant members of this cluster (Figure 4). Under control conditions, another cluster (Cluster II) was identified which showed repressed expression of genes in resistant genotypes at either 3rd or 7th dpi. These genes were mainly associated with response to auxin, catabolic process, oxidoreductase activity, heme binding and xylan acetylation. Auxin responsive elements, homeobox related and TFs like ERF (Ca_12975) and Dof (Ca_01331) were included in this cluster (Figure 4). Further, when chickpea plants were exposed to AB stress, a cluster (Cluster III) showing induced expression at both 3rd and 7th dpi in resistant genotypes was observed. This cluster mainly contained genes involved in pathogen recognition and defense response like leucine‐rich receptor‐like kinase, NBS‐LRR proteins, oxidation‐reduction process, cuticle development and fatty acid biosynthesis. Cluster IV included genes showing significant up‐regulation in resistant genotypes at 3rd dpi. It contained genes involved in defense response to fungus, chitin catabolic process, signal transduction, peroxidase activity and oxidation‐reduction process. A number of stress‐responsive genes like pathogenesis‐related (PR) proteins, chitinases, Kunitz‐type trypsin inhibitor, glutathione‐S‐transferase (GST), TIR‐NBS‐LRR, and dirigent proteins along with TFs like bHLH, WRKY and MYB were a major part of this cluster. It was observed that a gene coding for disease resistance response protein, DRRG49‐C (Ca_02987) exhibited an average log2 fold change of 5.5 across resistant genotypes compared to the susceptible genotypes. A significant number of the genes of this cluster were found to be considerably repressed at 7th dpi in resistant genotypes. These included several stress‐responsive genes like dirigent, syntaxin, COBRA, Kunitz‐type trypsin inhibitor and aquaporins. Cluster V consisted of genes showing up‐regulation at only 7th dpi in resistant genotypes. This cluster included genes related to cell wall biogenesis like cellulose synthase (Ca_08607), cell wall loosening like expansin and ion homeostasis including Nramp5 (Ca_25717). Cluster VI exhibited induced expression in susceptible genotypes at either 3rd or 7th dpi. The genes of this cluster were mainly involved in defense response, proteolysis, response to abscisic acid, response to salicylic acid, hydrolase activity, jasmonic acid and ethylene‐mediated signaling pathway, protein phosphorylation and leaf senescence. Genes like senescence‐associated protein (Ca_10582), accelerated cell death 11 (Ca_08010), desiccation‐related protein (Ca_08076), jasmonate O‐methyltransferase (Ca_04771), leucoanthocyanidin dioxygenase‐like protein (Ca_17705), pectinesterase (Ca_20384) and calcium‐transporting ATPase (Ca_12185) and TFs encoding for NAC, MYB and ERF were up‐regulated in susceptible genotypes (Figure 4). Interestingly, majority of the genes of this cluster like senescence‐associated and accelerated cell death proteins were repressed at 3rd dpi and induced at 7th dpi in susceptible genotypes.
Figure 4.
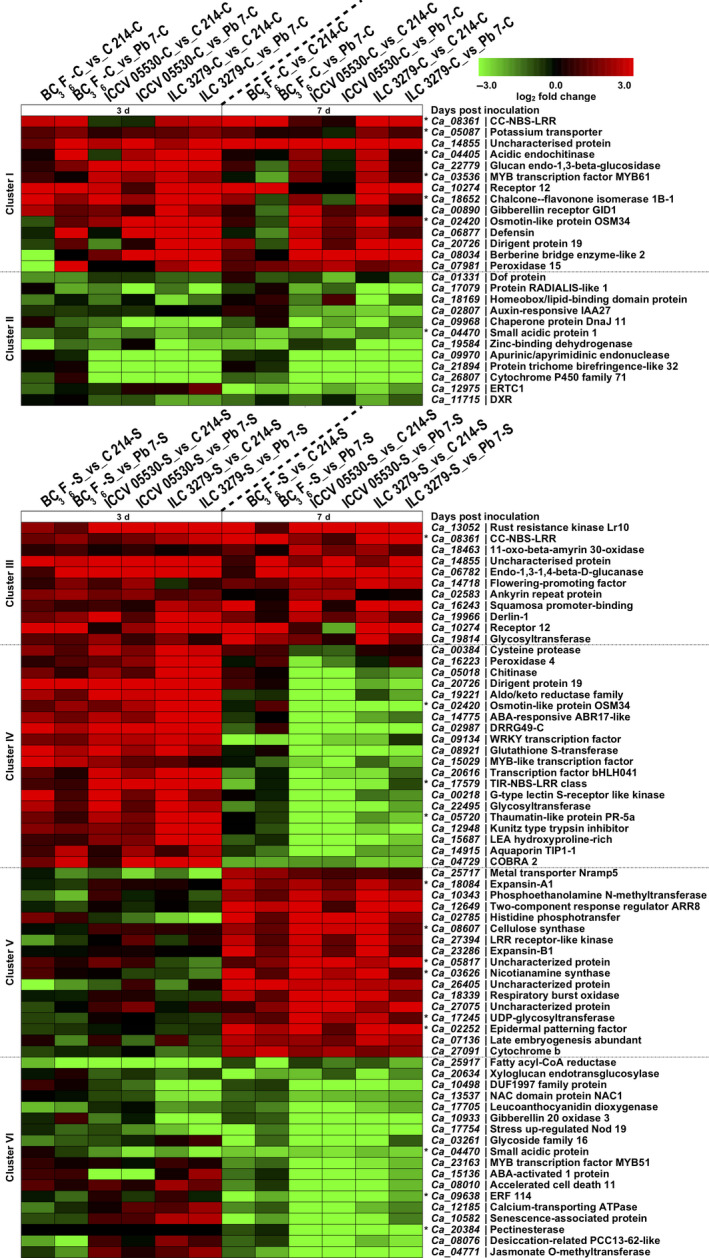
Clustering of expression profiles of differentially expressed genes (DEGs) under control and stress conditions. The clustering was performed on log2 fold change for each gene under different combinations. The genes showing similar expression trend have been grouped together into six clusters (Cluster I to Cluster VI) and selected representative genes from each cluster are depicted in the form of heat maps. Cluster I and II show the differential expression trend of genes between resistant (ICCV 05530, ILC 3279 and BC 3F6) and susceptible (C 214 and Pb 7) genotypes under control conditions. Cluster III to VI shows the differential expression trend of genes between resistant and susceptible genotypes under stress conditions. The asterisk (*) shows that the gene is present in one of the previously reported Ascochyta blight (AB) QTLs. The color scale at the top shows log2 fold change.
High‐throughput small RNA sequencing
For the identification of AB stress‐related miRNAs in chickpea, a total of 20 small RNA libraries were constructed and sequenced. A total of 532.8 million reads with an average of 26 million reads per sample were generated. After subsequent steps of filtering low quality reads and trimming, a set of 517.2 million high quality reads was retained for further analysis. Around 60 million reads with length <18 nt or >35 nt were discarded, followed by removal of reads mapping to repeats, ribosomal RNA (rRNA), transfer RNA (tRNA) and small nucleolar RNA (snoRNA) (Table 1). The length distribution of the unique small RNA reads indicated that 24 nt (51.2%) small RNAs were the most abundant class followed by 21 nt (7.9%), 23 nt (7.7%) and 22 nt small RNAs (6.1%) (Figure S1). The high representation of 24 nt small RNAs implies the abundant representation of endogenous siRNAs in all the samples analyzed, in concurrence with previous studies (Candar‐Cakir et al., 2016; Jain et al., 2014).
Identification of known and novel miRNAs
In order to identify conserved/known miRNAs in chickpea, the filtered reads were searched against the miRNAs of other plant species from miRBase. A total of 11.2 million reads were mapped to miRbase which resulted in the identification of 478 unique conserved miRNAs from all samples (Table S1). Along with conserved miRNAs, plants also harbor novel miRNAs that are species‐ or lineage‐ specific. Therefore, the reads which could not map to miRBase were subjected to novel miRNA prediction. A total of 4.2 million reads which mapped onto chickpea genome with no mismatch were subjected to processing by miRDeep‐P. In brief, the mapped reads were extended to obtain precursor sequences which were further folded into potential stem‐loop structures using Vienna package. The characteristic miRNA precursor secondary structures were filtered and processed. After the removal of miRNAs which do not meet the plant miRNA criteria and were represented by less than 10 reads in a sample, a final set of 173 unique novel miRNAs was obtained (Table S1).
The total number of miRNAs ranged from 339 in Pb 7‐C‐7d to 471 in BC3F6‐S‐3d. The length of identified miRNAs ranged from 20–24 nt, with 21 and 24 being the most abundant (Table S1). The 20–24 nt length of miRNAs is in agreement with the products of DCL cleavage activity (Reinhart et al., 2002). The nucleotide composition of the mature miRNA candidates was evaluated and it was seen that majority of 21 nt long miRNAs were characterized by a 5′‐uridine residue. The abundance of 5′‐uridine residue in 21 nt length miRNAs has been observed in many plant species and is a characteristic attribute of DCL1 cleavage and AGO1 association (Reinhart et al., 2002; Rajagopalan et al., 2006; Figure S2). The average GC content of chickpea miRNAs was found to be about 48% (Table S1). The GC content of chickpea miRNAs was similar to the GC content of Medicago (44%), Arabidopsis (45%), soybean (46%) and grapevine (50%). The similarity‐based clustering of identified miRNAs grouped them into 240 families. Among 240 families, miR166 was the largest family with 46 members followed by miR156 with 44 and miR171 with 33 members. Furthermore, five novel miRNAs were found to be clustered with conserved miRNAs (Table S1). These miRNAs might constitute the recently evolved members of conserved miRNA families.
Differentially expressed miRNAs during AB infection
To distinguish miRNAs that respond to AB, the identified miRNAs were studied for their expression patterns in all the libraries. The majority of the identified miRNAs were expressed in more than one sample. In the present study, 297 miRNAs showed significant differential expression patterns across different combinations. The majority of miRNAs showed a trend of down‐regulation under stress conditions. A significant number of miRNAs were differentially expressed in a genotype‐ and stage‐ specific manner. Under stress, around 25% of the differentially expressed miRNAs were genotype‐specific at 3rd dpi and nearly 44% miRNAs at 7th dpi. For example, miR156h‐3p was highly induced (average log2 fold change 4) at both 3rd and 7th dpi specifically in ILC 3279 genotype. Further, to interrogate the miRNAs involved in AB resistance, we looked into miRNAs that exhibited similar expression patterns in all resistant genotypes including introgression line by comparing resistant and susceptible genotypes under stress (Figure 5). In total, three novel miRNAs (nov_miR3a, nov_miR64, nov_miR171) showed up‐regulation at both the 3rd and 7th dpi in resistant genotypes. A total of seven miRNAs including miR3627b, miR2111l, miR2111‐3p, miR1507b, nov_miR123, miR166i‐5p and nov_miR81 were down‐regulated in resistant genotypes at both 3rd and 7th dpi. A trend of down‐regulation of miRNAs was more profound at 7th dpi. A total of 8 and 21 miRNAs were specifically down‐regulated at 3rd and 7th dpi, respectively, in resistant genotypes. Similarly, a set of 12 and 14 miRNAs were up‐regulated in resistant genotypes at 3rd and 7th dpi, respectively. Interestingly, few miRNAs like nov_miR85c, nov_miR66 and miR8005c were down‐regulated at 3rd dpi and up‐regulated at 7th dpi in resistant genotypes. In contrast, nov_miR4b, nov_miR58, nov_miR9, miR319l and miR167a were up‐regulated at 3rd dpi and down‐regulated at 7th dpi in resistant genotypes (Figure 5). A significant fraction of miRNAs showed similar trends in both resistant genotypes (ILC 3279 and ICCV 05530) but contrast expression pattern in introgression line. These miRNAs mainly included isoforms of miR398, miR390, miR4414 and many novel miRNAs like nov_miR126 and nov_miR131a.
Figure 5.
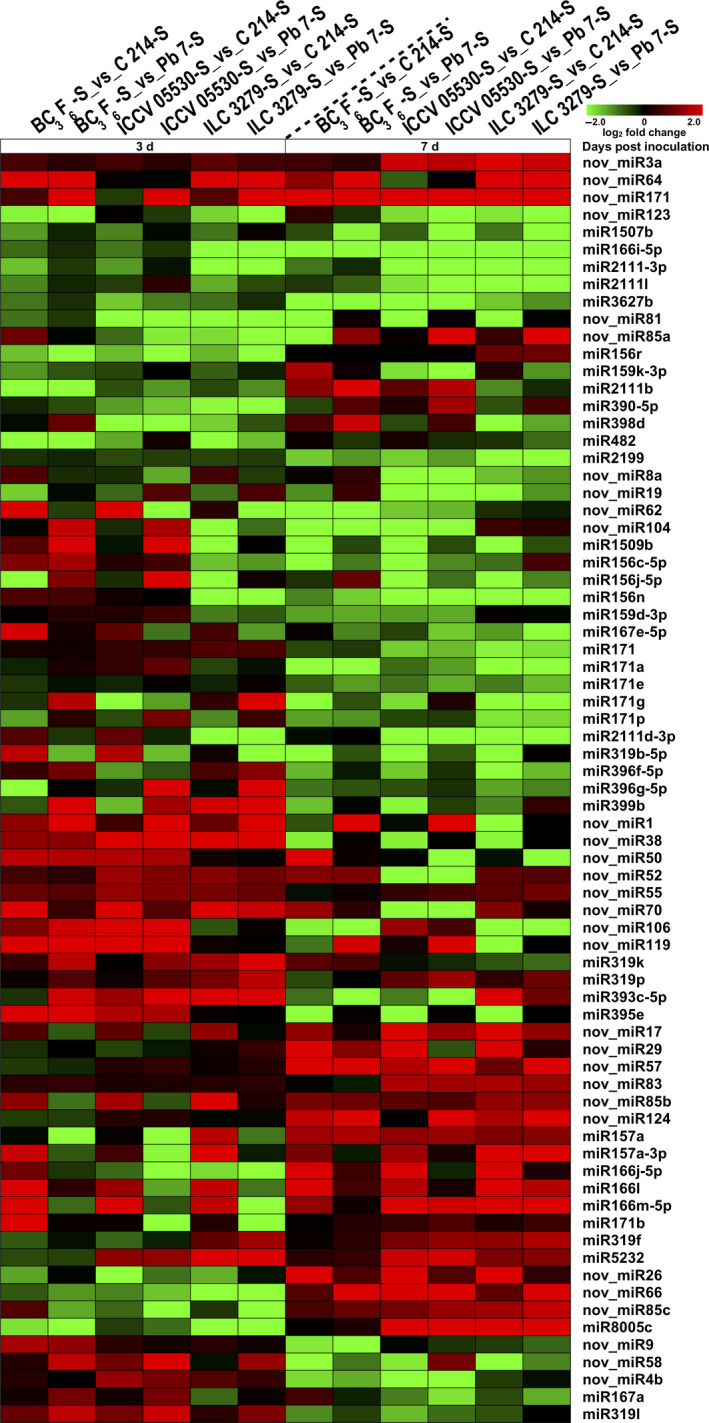
Differential expression of stress‐responsive conserved and novel miRNAs in Ascochyta blight resistant (ICCV 05530, ILC 3279 and BC 3F6) and susceptible (C 214 and Pb 7) genotypes are shown as a heatmap. The color scale at the top shows log2 fold change.
Target prediction via in silico and degradome approaches
Plant miRNAs usually have perfect or near‐perfect complementarity with their targets allowing the identification of targets using in silico tools. Using psRNATarget server, we could identify 1735 targets for a total of 593 (429 known and 164 novel) miRNAs. Further, using degradome sequencing, a total of 145.8 million sequence reads were generated with an average of 14.6 million reads per sample (Table S2). After consecutive steps of filtering, 134.4 million reads were obtained which were processed for identification of cleavage sites. For clarity, the samples have been designated as genotype‐condition. For instance, ILC 3279‐C represents genotype ILC 3279 under control conditions. An average of 179 non‐redundant targets with P‐value ≤ 0.05 and category ≤ 4 in each sample were identified. The maximum targets were identified for ILC 3279‐C (201) and minimum for Pb 7‐C (151). For each sample, the maximum cleavage sites belonged to category 0 (average 41.1%) and minimum to category 4 (average 12.7%) (Table S2). These cleavage sites were represented in the form of target plots (T‐plots). Using degradome sequencing, we could identify 552 targets for a total of 407 (324 known and 83 novel) miRNAs.
Through in silico and degradome analysis, a total of 2131 targets were identified for almost all (96.6%) miRNAs (Table S1). It was seen that the maximum targets were obtained for members of miR396 family (148), followed by miR167 (106) and miR156 (80). The annotation of the targets revealed that they mainly belong to TFs, phytohormones, stress‐responsive genes, disease resistance genes like NBS‐LRR, cellular enzymes like kinases, reductases and phosphatases. TF encoding mRNA transcripts also represented a considerable fraction of miRNA targets. In total, 192 TFs belonging to 35 families were identified as targets. The maximum targets were from MYB family (17.2%), followed by bHLH (7.8%) and ARF (6.8%). GO enrichment analysis was further performed to elucidate the potential role of miRNA targets in response to AB stress in chickpea. The targets were uniformly assigned to 1470 biological processes, 1477 cellular components and 1503 molecular functions. Among the most enriched biological processes were RNA modification (GO:0009451), plant‐type secondary cell wall biogenesis (GO:0009834), defense response (GO:0006952), response to jasmonic acid (GO:0009753), signal transduction (GO:0007165) and response to salicylic acid (GO:0009751). Among molecular functions, the most significant GO terms were endonuclease activity (GO:0004519), miRNA binding (GO:0035198), oxidoreductase activity (GO:0016722) and xylan O‐acetyltransferase activity (GO:1990538). In cellular component category, nucleus (GO:0005634), plasma membrane (GO:0005886) and mitochondrial inner membrane pre‐sequence translocase complex (GO:0005744) were the most over‐represented terms (Figure S3).
Further, KEGG annotation was carried out to explore the pathways in which the identified miRNA targets are involved. A total of 214 pathways were identified indicating the highly diverse functions of these targets. The most enriched pathways were the ones related to stress response including plant‐pathogen interaction, plant hormone signal transduction, biosynthesis of secondary metabolites and MAPK signaling pathway (Figure S4). Further, to investigate the association of AB responsive miRNAs with their targets, network analysis was performed using Cytoscape platform. For network construction, stress‐responsive miRNAs and genes involved in AB stress response were included. These stress‐responsive genes included genes encoding for PR proteins, glycosyltransferases (GT), Pentatricopeptide repeat proteins (PPR) and disease resistance genes like NBS‐LRR and Snakin. The network also included several TFs like NAC, ERF and ARF (Figure 6).
Figure 6.
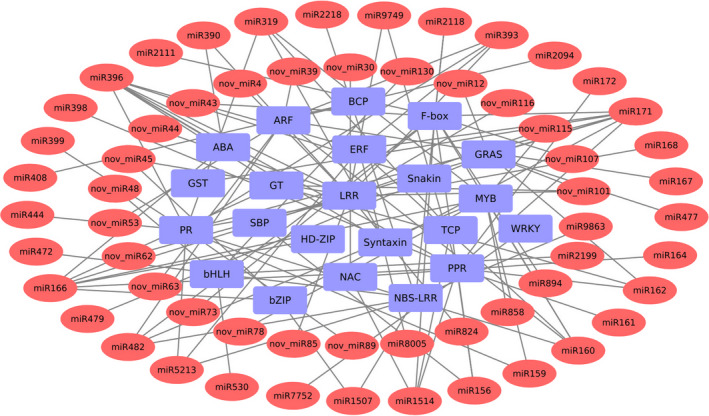
A network representing the relationships between miRNAs and their target genes associated with Ascochyta blight response. The red color eclipses represent the miRNAs and blue colored rectangles represent the target genes. ARF, auxin response factor; BCP, blue copper protein; GT, glycosyltransferase; NBS‐LRR, nucleotide‐binding site leucine‐rich repeat; PPR, pentatricopeptide repeat protein; PR, pathogenesis‐related proteins; and SBP, SQUAMOSA promoter binding protein.
Correlation analysis of miRNAs expression profiles and their target genes
Further, the expression of both AB responsive miRNAs (from small RNA‐seq) and their target genes (from RNA‐seq) were integrated to infer the mediatory role of miRNAs during AB infection. The correlation analysis of miRNA and their target mRNA expression profiles using Pearson correlation coefficient identified a total of 757 and 693 miRNA‐mRNA interaction pairs across all combinations under stress conditions at 3rd and 7th dpi, respectively. These interactions can be either coherent or non‐coherent. Coherent interactions are the ones in which the expression of target mRNA is more when the expression of miRNA is less and vice versa. In contrast, non‐coherent are the ones in which both miRNA and its target mRNA have the similar expression (Shkumatava et al., 2009). Out of 757 pairs, 371 were non‐coherent (positive correlation) and 386 pairs were coherent (negative correlation) at 3rd dpi (Figure 7a). Similarly, at 7th dpi, out of total 693 pairs, 357 were non‐coherent and 336 pairs were coherent (Figure 7b). We further analyzed coherent interactions in detail. At 3rd dpi, 386 coherent pairs consisting of 274 genes and 247 miRNAs were found. Similarly, at 7th dpi, 336 coherent pairs comprising of 262 genes and 232 miRNAs were identified. The higher number of genes as compared to the miRNAs targeting them support the findings that a single miRNA has the capability to cleave multiple targets.
Figure 7.
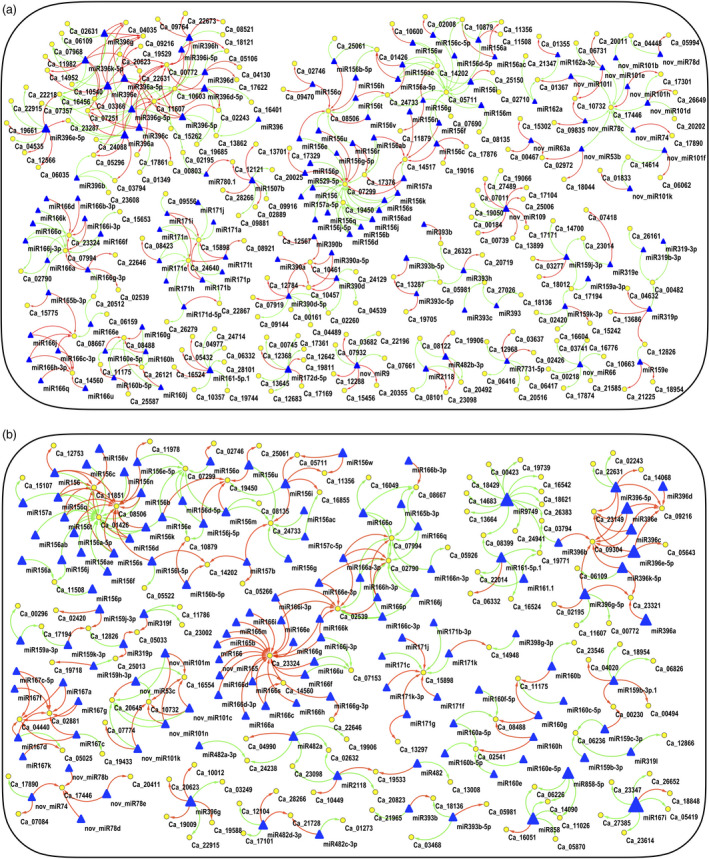
Integrated correlation networks of the identified miRNAs and their target genes in resistant (ICCV 05530, ILC 3279 and BC 3F6) and susceptible (C 214 and Pb 7) genotypes. The sub‐networks with ≥ five edges are shown. Triangles represent miRNAs; ellipses represent the target gene; red edges/lines represent positive correlation and green represents negative correlation (a) at 3rd day post inoculation (dpi); (b) 7th dpi.
From these coherent pairs, we could identify 12 pairs that exhibited contrasting expressions of both mRNA and miRNA across resistant (including BC3F6 line) and susceptible genotypes (Figure 8a). From these pairs, five and seven pairs were identified from 3rd and 7th dpi, respectively. It was seen that a higher number of miRNAs were down‐regulated and their corresponding targets were up‐regulated in resistant genotypes when compared with the susceptible genotypes. In all resistant genotypes, at 3rd dpi, three miRNAs, namely, miR159k‐3p, miR482b‐3p and miR156r were down‐regulated and their targets osmotin‐like protein, NBS‐LRR and Squamosa promoter binding like protein, respectively, were up‐regulated. Along with these known miRNAs, a novel miRNA, nov_miR66 targeting a G‐type lectin S‐receptor like Serine threonine kinase was also seen to exhibit the similar trend. In contrast, miR319l was up‐regulated and its target, a TCP transcription factor was down‐regulated in all resistant genotypes. At 7th dpi, three miRNAs including miR171b, miR5232 and miR157a were up‐regulated and their targets, an ERF gene, calcium‐transporting ATPase and senescence‐associated protein were down‐regulated in resistant genotypes. In contrast, four miRNAs, namely, miR162, miR167c, nov_miR101l and miR171 were down‐regulated and their targets, a Dicer like gene, Dof zinc finger, convicilin and a PPR protein were up‐regulated in resistant genotypes. Interestingly, at both the time points the disease resistance genes, such as, NBS‐LRR (3rd dpi), osmotin (3rd dpi) and PPR (7th dpi) protein were up‐regulated and the miRNAs targeting them were down‐regulated in resistant genotypes as compared to the susceptible genotypes (Figure 8a).
Figure 8.
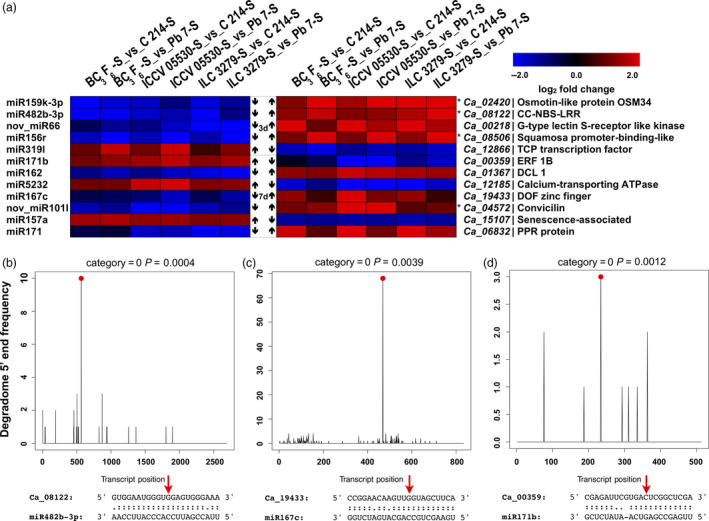
Expression profiles of important miRNA‐mRNA interaction pairs and their validation. (a) A combined view of the expression level of selected coherent pairs of differentially expressed miRNAs and their target genes in chickpea genotypes upon Ascochyta blight (AB) infection. The heat map on left indicates the miRNA expression and the heat map in right represent the corresponding target expression between resistant (ICCV 05530, ILC 3279 and BC 3F6) and susceptible (C 214 and Pb 7) genotypes. The asterisk (*) shows that the gene is present in one of the previously reported AB resistance QTLs. T‐plots and miRNA‐mRNA alignments validated by degradome sequencing where (b) miR482b‐3p cleaves NBS‐LRR (Ca_08122) gene; (c) miR167c cleaves Dof zinc finger (Ca_19433) gene; (d) miR171b cleaves ERF (Ca_00359) gene. The red dots and arrows represent the cleavage nucleotide positions on the target genes.
Out of these 12 miRNA‐mRNA pairs, five pairs were also validated by degradome sequencing. These pairs include miR482b‐3p: CC‐NBS‐LRR (Ca_08122), miR167c: Dof zinc finger protein (Ca_19433), miR171b: ERF (Ca_00359), miR157a: senescence‐associated protein (Ca_15107) and miR5232: calcium‐transporting ATPase (Ca_12185) (Figure 8b–d, Figure S5a and b). Four genes from these 12 pairs were localized in previously reported AB resistance QTLs. Ca_02420 was co‐localized with QTL on Ca8 by Anbessa et al. (2009), Ca_08122 on Ca3 by Tar'an et al. (2007), Ca_08506 on Ca6 and Ca_04572 on Ca4 by Sabbavarapu et al. (2013).
Validation of differential gene and miRNA expression
The quantitative reverse transcription‐polymerase chain reaction (qRT‐PCR) analysis was carried out to validate the expression patterns of genes and miRNAs obtained from RNA and small RNA sequencing. The expression of nine randomly selected genes and seven miRNAs was validated via qRT‐PCR in all 20 samples. The primer sequences used for both genes and miRNA validation are presented in Table S3. Similar expression trends of genes and miRNAs (up‐regulation or down‐regulation) were observed in qRT‐PCR analysis as that of high‐throughput sequencing for most of the samples. The means of the correlation coefficients of the qRT‐PCR experiments, and the sequencing results for the genes and miRNAs were 0.78 and 0.73, respectively. For individual genes, the correlation value varied from 0.71 to 0.85 and for miRNAs, it ranged from 0.70 to 0.77 (Figure S6). These results suggest a fine agreement between the results obtained through high‐throughput sequencing and qRT‐PCR.
Discussion
The availability of diverse germplasm and high‐throughput sequencing technologies provide a distinguished opportunity to understand the molecular basis of variability in stress response. In this study, three high‐throughput approaches, namely, transcriptomics, small RNA and degradome sequencing were used for better understanding of genetic and molecular mechanisms behind AB stress resistance in chickpea. We investigated four well‐characterized chickpea genotypes (ILC 3279, ICCV 05530, Pb 7 and C 214) and an introgression line (BC3F6) for their response to AB by combining the analyses from all the three approaches. Understanding the molecular basis of AB resistance can accelerate the development of stress‐resistant varieties in chickpea through both molecular breeding and genetic engineering approaches. Although, a few genes involved in AB response in chickpea have been reported (Coram and Pang, 2006; Leo et al., 2016), the molecular mechanism underlying AB resistance remains largely unknown. To understand the molecular response of plants to adapt to AB stress, we performed a comprehensive transcriptome analysis of the AB resistant and susceptible chickpea genotypes. The reference guided assembly generated a total of 31 459 genes, a number higher than the number of genes identified based on genome assembly (Varshney et al., 2013). This study identified 3190 novel genes, thus exhibiting the potential of RNA‐seq in the discovery of novel genes in the sequenced genomes as well. Similar results were also observed in other studies in chickpea (Garg et al., 2016; Kudapa et al., 2018). A total of 6767 genes showed differential expression pattern in different genotypes under different conditions at different time points. The differential expression pattern of genes in resistant and susceptible genotypes and various pathways involved enhanced our understanding about the AB response mechanism. The defense response of chickpea to AB is a multifaceted venture which begins with recognition of pathogen leading to activation of a number of genes that further results in modifications in host cell wall, changes in ion flux through plasma membrane, formation of reactive oxygen species (ROS), distinctive biochemical changes and induced expression of various PR proteins, chitinases, dirigent proteins and GSTs. The defense mechanism involves a number of TFs like MYB, WRKY, ERF and signal transduction by various phytohormones like abscisic acid, salicylic acid and jasmonic acid (Figure 9). We have identified several TF encoding genes that showed differential expression under stress conditions. Several studies have reported the crucial role of various TFs in biotic stress response via gene regulatory networks (Park et al., 2001; Wang et al., 2009). In our study, genes encoding for NAC were induced in susceptible genotypes. NAC genes (GhATAF1) have been previously reported to increase cotton plant susceptibility to the fungal pathogens Verticillium dahliae and Botrytis cinerea (He et al., 2016). In Arabidopsis, ATAF1 is known to negatively regulate defense responses against both necrotrophic fungal and bacterial pathogens by suppressing the action of PR proteins (Wang et al., 2009).
Figure 9.
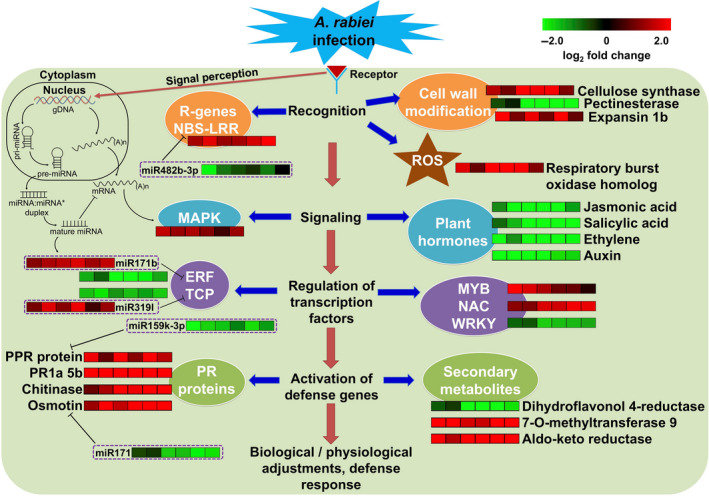
A hypothetical scheme showing summary of the cascades of various physiological and biochemical events incurred during the interaction of A. rabiei with chickpea in resistant genotypes. The heat maps indicate the up‐regulation (red) and down‐regulation (green) of gene/miRNA in resistant genotypes when compared with susceptible genotypes under stress conditions.
The formation of ROS, induction of PR proteins, biosynthesis of oxylipins and involvement of various phytohormone signaling pathways like abscisic acid, jasmonic acid mediated‐signaling pathways in AB response is supported by the GO enrichment analysis presented in the study. The ROS generated as a result of infection is known to be quenched by flavonoids such as flavanones and chalcones. The induced expression of chalcone‐flavanone isomerase, an important enzyme involved in the biosynthesis of chalcone at 3rd dpi in resistant genotypes as compared to susceptible genotypes was observed.
One of the most important class of defense genes is PR proteins which are known to exhibit antifungal activity against many plant pathogenic fungi such as, Phytophthora infestans, Phytophthora parasitica and Uromyces fabae (Matić et al., 2016). Another class of defense‐related genes, which are induced in plants under pathogen stress are peroxidases. Upon infection, peroxidases create a highly toxic environment by massive production of reactive oxygen and nitrogen species to prevent cellular diffusion of pathogens. In this study also, the resistant genotypes exhibited an increase in expression of various classes of PR proteins and peroxidases upon pathogen attack. Among the defense responsive genes, Snakin‐2, an antimicrobial peptide and DRRG49‐C were induced in resistant genotypes under stress conditions. These genes were also found to positively regulate defense responses against AB stress in previous studies (Coram and Pang, 2006; Mantri et al., 2010). Dirigent proteins are known to be involved in biosynthesis of lignan and are important for secondary metabolism and pathogen resistance (Li et al., 2017b). The induced expression of plant dirigent proteins in resistant genotypes as compared to susceptible genotypes might be an indication of their involvement in AB resistance. Aldo/keto reductase (AKR) is a large family known to be involved in plant defense and work by reducing aldehydes and ketones to their respective alcohols (Penning, 2004). AKRs were induced in resistant genotypes at 3rd dpi under stress indicating the important role of anti‐oxidation and detoxification in chickpea in response to AB (Figure 9). The up‐regulation of several defense responsive genes such as chitinase, osmotin and dirigent at 3rd dpi and their down‐regulation at 7th dpi in resistant genotypes might indicate that the resistant genotypes were able to combat infection by degrading the fungal cell walls and promoting lignan biosynthesis at an early stage of infection (3rd dpi). Similar results have also been reported in rice in response to fungal infection (Wang et al., 2014). The induced expression of senescence‐associated genes and genes related to ethylene and jasmonic acid signaling pathways in susceptible genotypes was observed at severe stress (7th dpi). The up‐regulation of gene coding for an allene oxide synthase which catalyzes the dehydration of the hydroperoxide to an unstable allene oxide in the jasmonic acid biosynthetic pathway was observed in susceptible genotypes. Various studies have suggested the role of ethylene and jasmonic acid in promoting leaf senescence (Kim et al., 2015). Also, it has been reported that jasmonic acid contributes to Fusarium graminearum susceptibility by attenuating the activation of SA signaling (Makandar et al., 2010). Thus, the higher expression of the jasmonic acid related genes in the susceptible genotypes, with respect to resistant genotypes, might contribute to their susceptibility. Interestingly, the induced expression of several defense‐responsive genes like NBS‐LRR and various PR proteins like chitinases and glucanases under control conditions suggest the possible existence of basic priming mechanism in resistant genotypes.
Since past few decades, the small non‐coding RNAs especially, the miRNAs have emerged as master modulators of gene expression at the post‐transcriptional level and are promising candidates for crop improvement (Tang and Chu, 2017). Using microarray and deep sequencing approaches, several stress‐responsive miRNAs have been identified in various crop plants (Candar‐Cakir et al., 2016; Guo et al., 2017). In chickpea also, a few studies reporting the genome‐wide discovery of miRNAs (Jain et al., 2014; Srivastava et al., 2015) and stress‐responsive miRNAs (Kohli et al., 2014) are available, but there is no study characterizing the role of miRNAs in AB resistance. In this study, we employed high‐throughput small RNA sequencing of a large number of samples under control and stress conditions to systematically study the effect of AB stress on different chickpea genotypes at different time points. By strictly adhering to criteria for annotation of plant miRNAs, the study identified a total of 651 miRNAs, of which 173 were novel. Several previous studies have reported that conserved/known miRNAs are important for various developmental processes, whereas the recently evolved or evolving novel miRNAs might be important for species‐specific gene regulatory functions (Srivastava et al., 2015; Sunkar et al., 2008). The features of identified miRNAs like length, GC content and the abundance of 5′‐uridine residue were in concordance with the previous studies (Jain et al., 2014; Kohli et al., 2014).
A total of 297 miRNAs demonstrated differential expression patterns in at least one sample/condition and it was seen that a significant number of novel miRNAs were also a part of these differentially expressed miRNAs. Despite the similarity, the members of same miRNA family respond differently to AB stress. It was seen that the different isoforms of the same miRNA family exhibited different expression patterns. For example, miR171 showed an up‐regulation at 3rd dpi and down‐regulation at 7th dpi under stress whereas its isoform miR171b showed the opposite trend of down‐regulation at 3rd dpi and up‐regulation at 7th dpi in resistant genotypes. Similar events were also reported in other plant species such as soybean where different members of miR396 family showed different expression patterns under stress (Fang et al., 2013). The function of miRNA can be inferred by accurately identifying their targets. The miRNA targets can be predicted both computationally and by the use of sequencing techniques like degradome sequencing which gives the pattern of RNA degradation. A very high number of targets (2131) were predicted for the identified miRNAs by using both these approaches. Interestingly, the GO enrichment analysis of these targets highlighted that these targets were mainly involved in regulating diverse developmental processes and various components of a fungal stress response. For instance, miR160 was seen to target auxin response factors which are important components of auxin signaling pathway involved in plant growth and development. Similarly, a member of miR482 and miR171 family was found to target NBS‐LRR and GST gene, respectively, both of which are involved in defense response.
The accumulation of miRNA, in general, leads to down‐regulation of their target genes and vice‐versa. The integrated analysis of the differentially expressed miRNAs and mRNAs revealed several AB responsive miRNAs. The up‐regulation of various stress‐responsive miRNAs like miR482b‐3p, miR159k‐3p, nov_miR66 and miR171 and the down‐regulation of their targets, NBS‐LRR, PR protein, serine‐threonine kinase and PPR protein, respectively, in susceptible genotypes compared to their resistant counterparts suggests that miRNA regulated resistance might be nurtured during AB infection. It is speculated that in susceptible genotypes, the disease resistance genes might have undergone post‐transcriptional silencing by their respective miRNAs and hence, were not able to combat infection. The degradome analysis also confirmed the cleavage of these genes by their respective miRNAs. The members of miR482 family were also found to target NBS‐LRR genes in previously reported studies (Shivaprasad et al., 2012; Zhu et al., 2013). In the present study, miR162 was found to target a Dicer‐like gene (Ca_01367) and it was observed that in susceptible genotypes, the expression of miR162 increased and the expression of its target decreased in response to AB infection. The decrease in the expression of Ca_01367 in susceptible genotypes under AB infection was also reported in a previous study (Garg et al., 2017). Under stress, the repressed expression of miR319l and the induced expression of its target TEOSINTE BRANCHED/CYCLOIDEA/PCF (TCP) was observed in susceptible genotypes (Figure 9). It has been previously reported that miR319l alters the expression of TCP which further modulates the expression of jasmonic acid biosynthesis genes, thus, positively regulating leaf senescence (Kim et al., 2015).
In summary, the present study is the first attempt to integrate mRNA and miRNA expression data along with degradome analysis to identify key regulatory miRNA‐target circuits in chickpea in response to AB. The study highlighted more extensive genotype‐specific response to AB stress than the response common to both the resistant and susceptible genotypes. The study identified a number of genes showing similar expression in two resistant genotypes, ICCV 05530 and ILC 3279 but different in BC3F6 line. The expression of these genes in BC3F6 line was similar to its recurrent parent C 214. The use of introgression line (BC3F6) in the study helped to pinpoint the genes which are most likely to be implicated in resistance. The genes showing similar expression pattern in all resistant genotypes including BC3F6 line could be considered as candidates which might play an important role in AB resistance. The study also highlighted that the similar set of genes exhibited different expression patterns at different stages of infection. The integrated analysis of miRNA and RNA sequencing identified 12 miRNA‐mRNA pairs which exhibited contrasting expression in resistant and susceptible genotypes and included genes like NBS‐LRR, PR proteins and miRNAs like miR482b‐3p and miR159k‐3p. Five out of these 12 pairs have been validated by degradome sequencing and few genes of these pairs are present in previously reported AB resistance QTLs. Overall, these genes and miRNAs give a clear indication of miRNA mediated stress response in chickpea in response to AB stress and can be considered as candidates for developing resistance in chickpea against AB using both breeding or genetic engineering approaches. The comprehensive datasets of differential expression patterns of genes and miRNAs in different chickpea genotypes present new insights into the resistance mechanism of chickpea to AB stress. These datasets will also serve as a valuable resource to investigate transcriptional reprogramming in chickpea in response to other fungal infections.
Materials and methods
Plant material, stress treatment and RNA extraction
A total of four chickpea genotypes and an introgression line with contrasting phenotype for AB stress (C 214 and Pb 7 – susceptible and ILC 3279, ICCV 05530 and BC3F6 – moderately resistant) were used in the study (Garg et al., 2017; Pande et al., 2011; Varshney et al., 2014). BC3F6 (ICCX‐100176‐470‐2‐7) line is an introgression line obtained by introgression of AB resistance QTLs (ABQTL‐I and ABQTL‐II) from ILC 3279 into genetic background of C 214, an elite chickpea cultivar (Varshney et al., 2014).
For the imposition of stress, seedling raising and inoculum preparation were performed as described earlier (Pande et al., 2011). Ten‐day‐old seedlings of above‐mentioned genotypes, acclimatized for 24 h to 20 ± 1 °C temperature and 12 h of photoperiod in controlled environment facility, were sprayed with the A. rabiei spore suspension of 5 × 10⁴ conidia/mL until runoff. The aerial tissues of seedlings were harvested on 3rd and 7th dpi in a set of three biological replicates each. Along with the AB inoculated samples, control (non‐inoculated) samples were also harvested from both the time points. From previous studies, it is known that early response of infection initiates at 24–48 h post inoculation and prevails until 7th dpi after which plants react defensively to the AB infection causing tissue decline (Pande et al., 2005; Sharma and Ghosh, 2016). Considering this, 3rd and 7th dpi were selected for the current study. The tissues were stored at −80 °C until RNA isolation. Total RNA from aerial tissues of seedlings was isolated using “NucleoSpin® RNA Plant” kit (Macherey‐Nagel, Düren, Germany) according to the manufacturer's instructions. The qualitative and quantitative assessment of these total RNA samples were conducted using Agilent 2100 Bioanalyzer (Agilent Technologies, Santa Clara, CA) and Nanodrop 8000 Spectrophotometer (Thermo Fisher Scientific, Waltham, MA). The total RNA from each tissue was used for library construction for transcriptome, small RNA and degradome sequencing. The library construction and sequencing were conducted by BGI‐Shenzhen, China.
Transcriptome sequencing and data pre‐processing
The high‐quality total RNA (RIN ≥ 8) was used for transcriptome library construction using TruSeq RNA Sample Prep Kit v2 (Illumina Inc., San Diego, CA) according to manufacturer's instructions. Briefly, mRNA was isolated from total RNA using oligo‐dT magnetic beads and fragmented, followed by cDNA synthesis using SuperScript II Reverse Transcriptase (Invitrogen, Carlsbad, CA). The cDNA fragments were amplified to generate transcriptome libraries which were sequenced on Illumina HiSeq 4000 platform using 100 bp paired‐end strategy. In total, 20 samples representing 5 genotypes (ILC 3279, ICCV 05530, C 214, Pb 7 and BC3F6) under control and AB stress conditions at two time points (3rd and 7th dpi) were subjected to transcriptome sequencing. The raw reads obtained from sequencing all these samples were processed to remove primer/adaptor contamination and low‐quality reads (>20% of the bases with a phred quality score < 10) using Trimmomatic v0.35 (Bolger et al., 2014).
Identification of DEGs and their co‐localization with QTLs
The filtered reads were mapped on the chickpea reference genome v1.0 (Varshney et al., 2013) using Tophat2 (Kim et al., 2013). The mapped reads from each sample were assembled using Cufflinks v2.2.1 (Trapnell et al., 2012) to generate reference‐guided assemblies which were further merged to generate a consensus assembly using Cuffmerge. The consensus assembly thus obtained was used for downstream analysis. The genes identified in the assembly were studied for their expression patterns across all samples using Cuffdiff. DEGs were identified between different samples under control (non‐inoculated) and AB inoculated conditions at different time points. A gene was considered to be differentially expressed between two samples if it exhibited log2 fold change value of ≥2 or ≤–2. For co‐localization studies, the information of the markers associated with AB resistance QTLs was retrieved from cool season food legume database. The sequence similarity search (blastn) using primer sequences of these markers as query against the reference genome was performed to obtain physical locations of markers. The blastn hits with 100% coverage of both query and subject were only selected. The co‐localization between the identified DEGs and physical positions of AB resistance QTLs was further analysed using Microsoft Excel.
Annotation and GO enrichment of DEGs
The putative functions of the identified DEGs were determined by subjecting the DEGs to blastx similarity searches (E‐value 1e‐05) against UniProtKB, Swiss‐Prot and NCBI non‐redundant protein database. The GO enrichment analysis to identify the over‐represented functional categories was carried out using R‐based GOseq package (Young et al., 2010). The GO terms with corrected P‐value ≤ 0.05 were considered to be significantly enriched for a given set of genes and were further clustered to view the most interconnected categories using Cytoscape. The DEGs were mapped to their respective pathways using KEGG Automatic Annotation Server (Moriya et al., 2007). Pathway enrichment analysis was done based on hypergeometric model (Boyle et al., 2004) with a significance threshold of P‐value 0.05.
Small RNA sequencing and data pre‐processing
Small RNA libraries were constructed using the Illumina TruSeq Small RNA Library Prep Kit (Illumina Inc., San Diego, CA) according to the manufacturer's instructions. In brief, 1 μg of total RNA from each sample was separated by polyacrylamide gel electrophoresis. RNA fragments of length 18–30 nt were enriched and were ligated to 3′ and 5′ adapter using T4 RNA ligase. The adaptor‐ligated RNA molecules were then subjected to cDNA synthesis, followed by amplification and sequencing on Illumina HiSeq 4000. The raw reads obtained from sequencing were processed for various quality controls which included removal of low‐quality reads, reads with adaptor, primer contamination and poly A tail using Trimmomatic v0.35. The reads shorter than 18 nt and longer than 35 nt were discarded. The clean reads from each sample were further screened against rRNA, tRNA, snoRNA and repeat sequences. After filtering, the redundant reads were processed into unique sequences with associated read counts for miRNA prediction.
Identification of known and novel miRNA
The filtered unique reads from each sample were mapped onto the plant miRNAs from miRBase (release 21; Kozomara and Griffiths‐Jones, 2014) for identification of conserved miRNAs. The alignment was done using Bowtie alignment tool v1.1.2 with two mismatches and the unaligned unique reads were further used for novel miRNA prediction. These remaining unique reads were mapped on chickpea genome using Bowtie with no mismatch and for aligned reads, putative precursor sequences of 250 bp were extracted. From the identified precursors, novel miRNAs were identified using miRDeep‐P, a probabilistic model‐based miRNA prediction software especially designed for plant miRNAs (Yang and Li, 2011). The novel prediction in miRDeep‐P revolves around the secondary structure, presence of 3′‐overhang, star miRNA evidence, less than six nucleotides difference between mature and star miRNA lengths, the Dicer cleavage site and the minimum free energy of the small RNA reads (Meyers et al., 2008). Further, on the basis of sequence similarity, the identified miRNAs were clustered into families using CD‐HIT (Fu et al., 2012) with 90% identity. Subsequently, the mRNA targets of identified miRNAs were predicted using psRNATarget server (Dai and Zhao, 2011) with default parameters.
Expression analysis of miRNAs
For determining the expression of identified miRNAs in each sample, R based DESeq2 (Love et al., 2014) package was used. A normalization factor calculated by DESeq2 was used to normalize the raw read counts of miRNA followed by identification of differentially expressed miRNA. A miRNA was considered to be significantly differentially expressed between the two samples if it exhibited a log2 fold change ≥1 or ≤−1 and a P‐value ≤ 0.05.
Degradome library construction and analysis
For degradome library construction, total RNA from 3rd and 7th dpi control and stress samples were pooled together to generate two libraries for each genotype, one representing control and other stress. For four genotypes and one introgression line, a total of 10 libraries were generated. The library construction was performed as previously described by German et al. (2008) with some modifications followed by sequencing. The raw reads (single‐end; 50 bp) were processed to remove low‐quality reads, reads with ‘N's and any reads with adaptor and primer contamination using Trimmomatic v0.35. The filtered reads were searched against all other non‐coding RNA sequences from Rfam except miRNA using Bowtie. The reads aligning to rRNAs, tRNAs, snoRNAs and repeats were removed. The clean reads thus obtained were mapped on the chickpea transcriptome (Varshney et al., 2013) with maximum one mismatch. The reads mapping to the sense strand of transcriptome were processed using CleaveLand v4.4 pipeline (Addo‐Quaye et al., 2009) to predict miRNA cleavage sites. The cleavage sites at 10th position relative to the aligned miRNA and with P‐value ≤ 0.05 were considered as significant. The identified sites were categorized into five categories (0–4) based on the read abundance at that position. Categories 0–3 have more than one read mapped at the cleavage site and category 4 has only one read. These different categories indicate the confidence level of prediction with category 0 with maximum confidence and category 4 with minimum confidence.
Validation of DEGs and miRNAs
For validation of the gene and miRNA expression obtained from high‐throughput sequencing, qRT‐PCR of randomly selected genes and miRNAs was performed. The qRT‐PCR analysis was carried out for 20 samples which included control (non‐inoculated) and AB inoculated samples of resistant (ILC 3279, ICCV 05530 and BC3F6) and susceptible (C 214 and Pb 7) genotypes at two time points (3rd and 7th dpi). The primers including miRNA‐specific stem‐loop RT, forward primers and universal reverse primer for the selected miRNAs were designed according to Kramer (2011). Further, the gene‐specific primers were designed using BatchPrimer3 v1.0 (You et al., 2008). The qRT‐PCR reactions were performed using SYBR green master‐mix in 96 well‐plates with three biological replicates and two technical replicates using Glyceraldehyde 3‐phosphate dehydrogenase (GAPDH) as the endogenous control. The PCR conditions used were as follows: 2 min at 50 °C, 10 min at 95 °C, and 40 cycles of 15 s at 95 °C and 1 min at 60 °C. The relative transcriptional levels in terms of fold‐change were determined using the 2−ΔΔCt method and Student's t‐test was used to calculate significance (Livak and Schmittgen, 2001).
Conflict of interest
The authors declare that they have no competing interests.
Supporting information
Figure S1 Length distribution of unique small RNAs in twenty small RNA libraries.
Figure S2 The 5′ nucleotide composition of identified miRNAs in chickpea and other species.
Figure S3 Gene ontology enrichment of miRNA targets.
Figure S4 Pathway annotation of targets using KEGG database.
Figure S5 T‐plots and miRNA‐mRNA alignments validated by degradome sequencing where (a) miR157a cleaves Senescence‐associated (Ca_15107) gene; (b) miR5232 cleaves calcium‐transporting ATPase (Ca_12185) gene.
Figure S6 Validation of high‐throughput sequencing through qRT‐PCR (a) RNA‐seq (b) Small RNA‐seq where ‘r’ is the correlation coefficient between high‐throughput sequencing data and qRT‐PCR data
Table S1 Details of identified miRNAs (known and novel), their targets and annotation.
Table S2 Statistics of degradome sequencing and splicing sites identified in each sample.
Table S3 List of primers used for qRT‐PCR experiments.
Acknowledgements
Vanika Garg acknowledges the award of Research Fellowship from Department of Science and Technology, Government of India. The authors are thankful to Mr. Jaipal Goud for technical assistance. Authors are also grateful to the Bill & Melinda Gates Foundation for partially supporting the study. This work has been undertaken as part of the CGIAR Research Program on Grain Legumes & Dryland Cereals. ICRISAT is a member of CGIAR Consortium.
Data availability
The sequencing data have been deposited in NCBI Sequence Read Archive (SRA, http://www.ncbi.nlm.nih.gov/sra) with the BioProject ID PRJNA479940.
References
- Addo‐Quaye, C. , Miller, W. and Axtell, M.J. (2009) CleaveLand: a pipeline for using degradome data to find cleaved small RNA targets. Bioinformatics, 25, 130–131. [DOI] [PMC free article] [PubMed] [Google Scholar]
- Anbessa, Y. , Taran, B. , Warkentin, T.D. , Tullu, A. and Vandenberg, A. (2009) Genetic analyses and conservation of QTL for ascochyta blight resistance in chickpea (Cicer arietinum L.). Theoret. Appl. Genet. 119, 757–765. [DOI] [PubMed] [Google Scholar]
- Bolger, A.M. , Lohse, M. and Usadel, B. (2014) Trimmomatic: a flexible trimmer for Illumina sequence data. Bioinformatics, 30, 2114–2120. [DOI] [PMC free article] [PubMed] [Google Scholar]
- Boyle, E.I. , Weng, S. , Gollub, J. , Jin, H. , Botstein, D. , Cherry, J.M. and Sherlock, G. (2004) GO:TermFinder‐open source software for accessing Gene Ontology information and finding significantly enriched Gene Ontology terms associated with a list of genes. Bioinformatics, 20, 3710–3715. [DOI] [PMC free article] [PubMed] [Google Scholar]
- Candar‐Cakir, B. , Arican, E. and Zhang, B. (2016) Small RNA and degradome deep sequencing reveals drought‐and tissue‐specific micrornas and their important roles in drought‐sensitive and drought‐tolerant tomato genotypes. Plant Biotechnol. J. 14, 1727–1746. [DOI] [PMC free article] [PubMed] [Google Scholar]
- Cao, A. , Jin, J. , Li, S. and Wang, J. (2017) Integrated analysis of mRNA and miRNA expression profiling in rice backcrossed progenies (BC2F12) with different plant height. PLoS ONE, 12, e0184106. [DOI] [PMC free article] [PubMed] [Google Scholar]
- Coram, T.E. and Pang, E.C. (2006) Expression profiling of chickpea genes differentially regulated during a resistance response to Ascochyta rabiei . Plant Biotechnol. J. 4, 647–666. [DOI] [PubMed] [Google Scholar]
- Dai, X. and Zhao, P.X. (2011) psRNATarget: a plant small RNA target analysis server. Nucleic Acids Res. 39, W155–W159. [DOI] [PMC free article] [PubMed] [Google Scholar]
- Fang, X. , Zhao, Y. , Ma, Q. , Huang, Y. , Wang, P. , Zhang, J. , Nian, H. et al. (2013) Identification and comparative analysis of cadmium tolerance‐associated miRNAs and their targets in two soybean genotypes. PLoS ONE, 8, e81471. [DOI] [PMC free article] [PubMed] [Google Scholar]
- FAO (2016) FAOSTAT, Food and Agriculture Organization of the United Nations. Available online at: http://faostat3.fao.org/.
- Fu, L. , Niu, B. , Zhu, Z. , Wu, S. and Li, W. (2012) CD‐HIT: accelerated for clustering the next‐generation sequencing data. Bioinformatics, 28, 3150–3152. [DOI] [PMC free article] [PubMed] [Google Scholar]
- Garg, R. , Shankar, R. , Thakkar, B. , Kudapa, H. , Krishnamurthy, L. , Mantri, N. , Varshney, R.K. et al. (2016) Transcriptome analyses reveal genotype‐ and developmental stage‐specific molecular responses to drought and salinity stresses in chickpea. Sci. Rep. 6, 19228. [DOI] [PMC free article] [PubMed] [Google Scholar]
- Garg, V. , Agarwal, G. , Pazhamala, L.T. , Nayak, S.N. , Kudapa, H. , Khan, A.W. , Doddamani, D. et al. (2017) Genome‐wide identification, characterization, and expression analysis of small RNA biogenesis purveyors reveal their role in regulation of biotic stress responses in three legume crops. Front. Plant Sci. 8, 488. [DOI] [PMC free article] [PubMed] [Google Scholar]
- German, M.A. , Pillay, M. , Jeong, D.H. , Hetawal, A. , Luo, S. , Janardhanan, P. , Kannan, V. et al. (2008) Global identification of microRNA‐target RNA pairs by parallel analysis of RNA ends. Nat. Biotechnol. 26, 941–946. [DOI] [PubMed] [Google Scholar]
- Guo, Y. , Jia, M.A. , Yang, Y. , Zhan, L. , Cheng, X. , Cai, J. , Zhang, J. et al. (2017) Integrated analysis of tobacco miRNA and mRNA expression profiles under PVY infection provides insight into tobacco‐PVY interactions. Sci. Rep. 7, 4895. [DOI] [PMC free article] [PubMed] [Google Scholar]
- He, X. , Zhu, L. , Xu, L. , Guo, W. and Zhang, X. (2016) GhATAF1, a NAC transcription factor, confers abiotic and biotic stress responses by regulating phytohormonal signaling networks. Plant Cell Rep. 35, 2167–2179. [DOI] [PubMed] [Google Scholar]
- Jain, M. , Chevala, V.N. and Garg, R. (2014) Genome‐wide discovery and differential regulation of conserved and novel microRNAs in chickpea via deep sequencing. J. Exp. Bot. 65, 5945–5958. [DOI] [PMC free article] [PubMed] [Google Scholar]
- Jain, M. , Pole, A.K. , Singh, V.K. , Ravikumar, R.L. and Garg, R. (2015) Discovery of molecular markers for Fusarium wilt via transcriptome sequencing of chickpea cultivars. Mol. Breed. 35, 198. [Google Scholar]
- Kim, D. , Pertea, G. , Trapnell, C. , Pimentel, H. , Kelley, R. and Salzberg, S.L. (2013) TopHat2: accurate alignment of transcriptomes in the presence of insertions, deletions and gene fusions. Genome Biol. 14, R36. [DOI] [PMC free article] [PubMed] [Google Scholar]
- Kim, J. , Chang, C. and Tucker, M.L. (2015) To grow old: regulatory role of ethylene and jasmonic acid in senescence. Front. Plant Sci. 6, 20. [DOI] [PMC free article] [PubMed] [Google Scholar]
- Kohli, D. , Joshi, G. , Deokar, A.A. , Bhardwaj, A.R. , Agarwal, M. , Katiyar‐Agarwal, S. , Srinivasan, R. et al. (2014) Identification and characterization of wilt and salt stress‐responsive microRNAs in chickpea through high‐throughput sequencing. PLoS ONE, 9, e108851. [DOI] [PMC free article] [PubMed] [Google Scholar]
- Kozomara, A. and Griffiths‐Jones, S. (2014) miRBase: annotating high confidence microRNAs using deep sequencing data. Nucleic Acids Res. 42, D68–D73. [DOI] [PMC free article] [PubMed] [Google Scholar]
- Kramer, M.F. (2011) Stem‐Loop RT‐qPCR for miRNAs. Curr. Protocols Molecul. Biol. 95, 15.10.1–15.10.15. [DOI] [PMC free article] [PubMed] [Google Scholar]
- Kudapa, H. , Garg, V. , Chitikineni, A. and Varshney, R.K. (2018) The RNA‐Seq‐based high resolution gene expression atlas of chickpea (Cicer arietinum L.) reveals dynamic spatio‐temporal changes associated with growth and development. Plant, Cell Environ. 41, 2209–2225. [DOI] [PubMed] [Google Scholar]
- Leo, A.E. , Linde, C.C. and Ford, R. (2016) Defence gene expression profiling to Ascochyta rabiei aggressiveness in chickpea. Theoret. Appl. Genet. 129, 1333–1345. [DOI] [PubMed] [Google Scholar]
- Li, Y. , Ruperao, P. , Batley, J. , Edwards, D. , Davidson, J. , Hobson, K. and Sutton, T. (2017a) Genome analysis identified novel candidate genes for ascochyta blight resistance in chickpea using whole genome re‐sequencing data. Front. Plant Sci. 8, 359. [DOI] [PMC free article] [PubMed] [Google Scholar]
- Li, N. , Zhao, M. , Liu, T. , Dong, L. , Cheng, Q. , Wu, J. , Wang, L. et al. (2017b) A novel soybean dirigent gene GmDIR22 contributes to promotion of lignan biosynthesis and enhances resistance to Phytophthora sojae . Front. Plant Sci. 8, 1185. [DOI] [PMC free article] [PubMed] [Google Scholar]
- Livak, K.J. and Schmittgen, T.D. (2001) Analysis of relative gene expression data using real‐time quantitative PCR and the 2(‐Delta Delta C(T)) method. Methods, 25, 402–408. [DOI] [PubMed] [Google Scholar]
- Love, M.I. , Huber, W. and Anders, S. (2014) Moderated estimation of fold change and dispersion for RNA‐seq data with DESeq2. Genome Biol. 15, 550. [DOI] [PMC free article] [PubMed] [Google Scholar]
- Makandar, R. , Nalam, V. , Chaturvedi, R. , Jeannotte, R. , Sparks, A.A. and Shah, J. (2010) Involvement of salicylate and jasmonate signaling pathways in Arabidopsis interaction with Fusarium graminearum . Mol. Plant Microbe Interact. 23, 861–870. [DOI] [PMC free article] [PubMed] [Google Scholar]
- Mantri, N.L. , Ford, R. , Coram, T.E. and Pang, E.C. (2010) Evidence of unique and shared responses to major biotic and abiotic stresses in chickpea. Environ. Exp. Bot. 69, 286–292. [Google Scholar]
- Mashaki, K.M. , Garg, V. , Ghomi, A.A.N. , Kudapa, H. , Chitikineni, A. , Nezhad, K.Z. , Yamchi, A. et al. (2018) RNA‐Seq analysis revealed genes associated with drought stress response in kabuli chickpea (Cicer arietinum L.). PLoS ONE, 13, e0199774. [DOI] [PMC free article] [PubMed] [Google Scholar]
- Matić, S. , Bagnaresi, P. , Biselli, C. , Carneiro, G.A. , Siciliano, I. , Valé, G. , Gullino, M.L. et al. (2016) Comparative transcriptome profiling of resistant and susceptible rice genotypes in response to the seed borne pathogen Fusarium fujikuroi . BMC Genom. 17, 608. [DOI] [PMC free article] [PubMed] [Google Scholar]
- Meyers, B.C. , Axtell, M.J. , Bartel, B. , Bartel, D.P. , Baulcombe, D. , Bowman, J.L. , Cao, X. et al. (2008) Criteria for annotation of plant MicroRNAs. Plant Cell, 20, 3186–3190. [DOI] [PMC free article] [PubMed] [Google Scholar]
- Moriya, Y. , Itoh, M. , Okuda, S. , Yoshizawa, A.C. and Kanehisa, M. (2007) KAAS: an automatic genome annotation and pathway reconstruction server. Nucleic Acids Res. 35, W182–W185. [DOI] [PMC free article] [PubMed] [Google Scholar]
- Pande, S. , Siddique, K.H.M. , Kishore, G.K. , Bayaa, B. , Gaur, P.M. , Gowda, C.L.L. , Bretag, T.W. et al. (2005) Ascochyta blight of chickpea (Cicer arietinum L.): a review of biology, pathogenicity, and disease management. Aust. J. Agric. Res. 56, 317–332. [Google Scholar]
- Pande, S. , Sharma, M. , Gaur, P.M. , Tripathi, S. , Kaur, L. , Basandrai, A. , Khan, T. et al. (2011) Development of screening techniques and identification of new sources of resistance to Ascochyta blight disease of chickpea. Aust. Plant Pathol. 40, 149–156. [Google Scholar]
- Park, J.M. , Park, C.J. , Lee, S.B. , Ham, B.K. , Shin, R. and Paek, K.H. (2001) Overexpression of the tobacco Tsi1 gene encoding an EREBP/AP2–type transcription factor enhances resistance against pathogen attack and osmotic stress in tobacco. Plant Cell, 13, 1035–1046. [DOI] [PMC free article] [PubMed] [Google Scholar]
- Penning, T.M. (2004) Aldo‐keto reductases and formation of polycyclic aromatic hydrocarbon o‐quinones. Methods Enzymol. 378, 31–67. [DOI] [PMC free article] [PubMed] [Google Scholar]
- Rajagopalan, R. , Vaucheret, H. , Trejo, J. and Bartel, D.P. (2006) A diverse and evolutionarily fluid set of microRNAs in Arabidopsis thaliana . Genes Dev. 20, 3407–3425. [DOI] [PMC free article] [PubMed] [Google Scholar]
- Reinhart, B.J. , Weinstein, E.G. , Rhoades, M.W. , Bartel, B. and Bartel, D.P. (2002) MicroRNAs in plants. Genes Dev. 16, 1616–1626. [DOI] [PMC free article] [PubMed] [Google Scholar]
- Sabbavarapu, M.M. , Sharma, M. , Chamarthi, S.K. , Swapna, N. , Rathore, A. , Thudi, M. , Gaur, P.M. et al. (2013) Molecular mapping of QTLs for resistance to Fusarium wilt (race 1) and Ascochyta blight in chickpea (Cicer arietinum L.). Euphytica, 193, 121–133. [Google Scholar]
- Sagi, M.S. , Deokar, A.A. and Tar'an, B. (2017) Genetic analysis of NBS‐LRR gene family in chickpea and their expression profiles in response to Ascochyta blight infection. Front. Plant Sci. 8, 838. [DOI] [PMC free article] [PubMed] [Google Scholar]
- Sarkar, D. , Maji, R.K. , Dey, S. , Sarkar, A. , Ghosh, Z. and Kundu, P. (2017) Integrated miRNA and mRNA expression profiling reveals the response regulators of a susceptible tomato cultivar to early blight disease. DNA Res. 24, 235–250. [DOI] [PMC free article] [PubMed] [Google Scholar]
- Sharma, M. and Ghosh, R. (2016) An update on genetic resistance of chickpea to ascochyta blight. Agronomy, 6, 18. [Google Scholar]
- Shivaprasad, P.V. , Chen, H.M. , Patel, K. , Bond, D.M. , Santos, B.A. and Baulcombe, D.C. (2012) A microRNA superfamily regulates nucleotide binding site leucine rich repeats and other mRNAs. Plant Cell, 24, 859–874. [DOI] [PMC free article] [PubMed] [Google Scholar]
- Shkumatava, A. , Stark, A. , Sive, H. and Bartel, D.P. (2009) Coherent but overlapping expression of microRNAs and their targets during vertebrate development. Genes Dev. 23, 466–481. [DOI] [PMC free article] [PubMed] [Google Scholar]
- Srivastava, S. , Zheng, Y. , Kudapa, H. , Jagadeeswaran, G. , Hivrale, V. , Varshney, R.K. and Sunkar, R. (2015) High throughput sequencing of small RNA component of leaves and inflorescence revealed conserved and novel miRNAs as well as phasiRNA loci in chickpea. Plant Sci. 235, 46–57. [DOI] [PubMed] [Google Scholar]
- Sunkar, R. , Zhou, X. , Zheng, Y. , Zhang, W. and Zhu, J.K. (2008) Identification of novel and candidate miRNAs in rice by high throughput sequencing. BMC Plant Biol. 8, 25. [DOI] [PMC free article] [PubMed] [Google Scholar]
- Tang, J. and Chu, C. (2017) MicroRNAs in crop improvement: fine‐tuners for complex traits. Nature Plants, 3, 17077. [DOI] [PubMed] [Google Scholar]
- Tar'an, B. , Warkentin, T.D. , Tullu, A. and Vandenberg, A. (2007) Genetic mapping of ascochyta blight resistance in chickpea (Cicer arietinum L.) using a simple sequence repeat linkage map. Genome, 50, 26–34. [DOI] [PubMed] [Google Scholar]
- Trapnell, C. , Roberts, A. , Goff, L. , Pertea, G. , Kim, D. , Kelley, D.R. , Pimentel, H. et al. (2012) Differential gene and transcript expression analysis of RNA‐seq experiments with TopHat and Cufflinks. Nat. Protoc. 7, 562–578. [DOI] [PMC free article] [PubMed] [Google Scholar]
- Upasani, M.L. , Limaye, B.M. , Gurjar, G.S. , Kasibhatla, S.M. , Joshi, R.R. , Kadoo, N.Y. and Gupta, V.S. (2017) Chickpea‐Fusarium oxysporum interaction transcriptome reveals differential modulation of plant defense strategies. Sci. Rep. 7, 7746. [DOI] [PMC free article] [PubMed] [Google Scholar]
- Varshney, R.K. , Song, C. , Saxena, R.K. , Azam, S. , Yu, S. , Sharpe, A.G. , Cannon, S.B. et al. (2013) Draft genome sequence of chickpea (Cicer arietinum) provides a resource for trait improvement. Nat. Biotechnol. 31, 240–246. [DOI] [PubMed] [Google Scholar]
- Varshney, R.K. , Mohan, S.M. , Gaur, P.M. , Chamarthi, S.K. , Singh, V.K. , Srinivasan, S. , Swapna, N. et al. (2014) Marker‐assisted backcrossing to introgress resistance to Fusarium wilt race 1 and Ascochyta blight in C 214, an elite cultivar of chickpea. Plant Genome, 7, 1–11. [Google Scholar]
- Wang, X.E. , Basnayake, B.M.V.S. , Zhang, H. , Li, G. , Li, W. , Virk, N. , Mengiste, T. et al. (2009) The Arabidopsis ATAF1, a NAC transcription factor, is a negative regulator of defense responses against necrotrophic fungal and bacterial pathogens. Mol. Plant Microbe Interact. 22, 1227–1238. [DOI] [PubMed] [Google Scholar]
- Wang, Y. , Kwon, S.J. , Wu, J. , Choi, J. , Lee, Y.H. , Agrawal, G.K. , Tamogami, S. et al. (2014) Transcriptome analysis of early responsive genes in rice during Magnaporthe oryzae infection. Plant Pathol. J. 30, 343–354. [DOI] [PMC free article] [PubMed] [Google Scholar]
- Yang, X. and Li, L. (2011) miRDeep‐P: a computational tool for analyzing the microRNA transcriptome in plants. Bioinformatics, 27, 2614–2615. [DOI] [PubMed] [Google Scholar]
- You, F.M. , Huo, N. , Gu, Y.Q. , Luo, M.C. , Ma, Y. , Hane, D. , Lazo, G.R. et al. (2008) BatchPrimer3: a high throughput web application for PCR and sequencing primer design. BMC Bioinform. 9, 253. [DOI] [PMC free article] [PubMed] [Google Scholar]
- Young, M.D. , Wakefield, M.J. , Smyth, G.K. and Oshlack, A. (2010) Gene ontology analysis for RNA‐seq: accounting for selection bias. Genome Biol. 11, R14. [DOI] [PMC free article] [PubMed] [Google Scholar]
- Zhu, Q.H. , Fan, L. , Liu, Y. , Xu, H. , Llewellyn, D. and Wilson, I. (2013) miR482 regulation of NBS‐LRR defense genes during fungal pathogen infection in cotton. PLoS ONE, 8, e84390. [DOI] [PMC free article] [PubMed] [Google Scholar]
Associated Data
This section collects any data citations, data availability statements, or supplementary materials included in this article.
Supplementary Materials
Figure S1 Length distribution of unique small RNAs in twenty small RNA libraries.
Figure S2 The 5′ nucleotide composition of identified miRNAs in chickpea and other species.
Figure S3 Gene ontology enrichment of miRNA targets.
Figure S4 Pathway annotation of targets using KEGG database.
Figure S5 T‐plots and miRNA‐mRNA alignments validated by degradome sequencing where (a) miR157a cleaves Senescence‐associated (Ca_15107) gene; (b) miR5232 cleaves calcium‐transporting ATPase (Ca_12185) gene.
Figure S6 Validation of high‐throughput sequencing through qRT‐PCR (a) RNA‐seq (b) Small RNA‐seq where ‘r’ is the correlation coefficient between high‐throughput sequencing data and qRT‐PCR data
Table S1 Details of identified miRNAs (known and novel), their targets and annotation.
Table S2 Statistics of degradome sequencing and splicing sites identified in each sample.
Table S3 List of primers used for qRT‐PCR experiments.
Data Availability Statement
The sequencing data have been deposited in NCBI Sequence Read Archive (SRA, http://www.ncbi.nlm.nih.gov/sra) with the BioProject ID PRJNA479940.