

Abstract
Background
The number of people with type 2 diabetes mellitus (T2DM) is increasing worldwide. The combination of metformin and sulphonylurea (M+S) is a widely used treatment. Whether M+S shows better or worse effects in comparison with other antidiabetic medications for people with T2DM is still controversial.
Objectives
To assess the effects of metformin and sulphonylurea (second‐ or third‐generation) combination therapy for adults with type 2 diabetes mellitus.
Search methods
We updated the search of a recent systematic review from the Agency for Healthcare Research and Quality (AHRQ). The updated search included CENTRAL, MEDLINE, Embase, ClinicalTrials.gov and WHO ICTRP. The date of the last search was March 2018. We searched manufacturers' websites and reference lists of included trials, systematic reviews, meta‐analyses and health technology assessment reports. We asked investigators of the included trials for information about additional trials.
Selection criteria
We included randomised controlled trials (RCTs) randomising participants 18 years old or more with T2DM to M+S compared with metformin plus another glucose‐lowering intervention or metformin monotherapy with a treatment duration of 52 weeks or more.
Data collection and analysis
Two review authors read all abstracts and full‐text articles and records, assessed risk of bias and extracted outcome data independently. We used a random‐effects model to perform meta‐analysis, and calculated risk ratios (RRs) for dichotomous outcomes and mean differences (MDs) for continuous outcomes, using 95% confidence intervals (CIs) for effect estimates. We assessed the certainty of the evidence using the GRADE instrument.
Main results
We included 32 RCTs randomising 28,746 people. Treatment duration ranged between one to four years. We judged none of these trials as low risk of bias for all 'Risk of bias' domains. Most important events per person were all‐cause and cardiovascular mortality, serious adverse events (SAE), non‐fatal stroke (NFS), non‐fatal myocardial infarction (MI) and microvascular complications. Most important comparisons were as follows:
Five trials compared M+S (N = 1194) with metformin plus a glucagon‐like peptide 1 analogue (N = 1675): all‐cause mortality was 11/1057 (1%) versus 11/1537 (0.7%), risk ratio (RR) 1.15 (95% confidence interval (CI) 0.49 to 2.67); 3 trials; 2594 participants; low‐certainty evidence; cardiovascular mortality 1/307 (0.3%) versus 1/302 (0.3%), low‐certainty evidence; serious adverse events (SAE) 128/1057 (12.1%) versus 194/1537 (12.6%), RR 0.90 (95% CI 0.73 to 1.11); 3 trials; 2594 participants; very low‐certainty evidence; non‐fatal myocardial infarction (MI) 2/549 (0.4%) versus 6/1026 (0.6%), RR 0.57 (95% CI 0.12 to 2.82); 2 trials; 1575 participants; very low‐certainty evidence.
Nine trials compared M+S (N = 5414) with metformin plus a dipeptidyl‐peptidase 4 inhibitor (N = 6346): all‐cause mortality was 33/5387 (0.6%) versus 26/6307 (0.4%), RR 1.32 (95% CI 0.76 to 2.28); 9 trials; 11,694 participants; low‐certainty evidence; cardiovascular mortality 11/2989 (0.4%) versus 9/3885 (0.2%), RR 1.54 (95% CI 0.63 to 3.79); 6 trials; 6874 participants; low‐certainty evidence; SAE 735/5387 (13.6%) versus 779/6307 (12.4%), RR 1.07 (95% CI 0.97 to 1.18); 9 trials; 11,694 participants; very low‐certainty evidence; NFS 14/2098 (0.7%) versus 8/2995 (0.3%), RR 2.21 (95% CI 0.74 to 6.58); 4 trials; 5093 participants; very low‐certainty evidence; non‐fatal MI 15/2989 (0.5%) versus 13/3885 (0.3%), RR 1.45 (95% CI 0.69 to 3.07); 6 trials; 6874 participants; very low‐certainty evidence; one trial in 64 participants reported no microvascular complications were observed (very low‐certainty evidence).
Eleven trials compared M+S (N = 3626) with metformin plus a thiazolidinedione (N = 3685): all‐cause mortality was 123/3300 (3.7%) versus 114/3354 (3.4%), RR 1.09 (95% CI 0.85 to 1.40); 6 trials; 6654 participants; low‐certainty evidence; cardiovascular mortality 37/2946 (1.3%) versus 41/2994 (1.4%), RR 0.78 (95% CI 0.36 to 1.67); 4 trials; 5940 participants; low‐certainty evidence; SAE 666/3300 (20.2%) versus 671/3354 (20%), RR 1.01 (95% CI 0.93 to 1.11); 6 trials; 6654 participants; very low‐certainty evidence; NFS 20/1540 (1.3%) versus 16/1583 (1%), RR 1.29 (95% CI 0.67 to 2.47); P = 0.45; 2 trials; 3123 participants; very low‐certainty evidence; non‐fatal MI 25/1841 (1.4%) versus 21/1877 (1.1%), RR 1.21 (95% CI 0.68 to 2.14); P = 0.51; 3 trials; 3718 participants; very low‐certainty evidence; three trials (3123 participants) reported no microvascular complications (very low‐certainty evidence).
Three trials compared M+S (N = 462) with metformin plus a glinide (N = 476): one person died in each intervention group (3 trials; 874 participants; low‐certainty evidence); no cardiovascular mortality (2 trials; 446 participants; low‐certainty evidence); SAE 34/424 (8%) versus 27/450 (6%), RR 1.68 (95% CI 0.54 to 5.21); P = 0.37; 3 trials; 874 participants; low‐certainty evidence; no NFS (1 trial; 233 participants; very low‐certainty evidence); non‐fatal MI 2/215 (0.9%) participants in the M+S group; 2 trials; 446 participants; low‐certainty evidence; no microvascular complications (1 trial; 233 participants; low‐certainty evidence).
Four trials compared M+S (N = 2109) with metformin plus a sodium‐glucose co‐transporter 2 inhibitor (N = 3032): all‐cause mortality was 13/2107 (0.6%) versus 19/3027 (0.6%), RR 0.96 (95% CI 0.44 to 2.09); 4 trials; 5134 participants; very low‐certainty evidence; cardiovascular mortality 4/1327 (0.3%) versus 6/2262 (0.3%), RR 1.22 (95% CI 0.33 to 4.41); 3 trials; 3589 participants; very low‐certainty evidence; SAE 315/2107 (15.5%) versus 375/3027 (12.4%), RR 1.02 (95% CI 0.76 to 1.37); 4 trials; 5134 participants; very low‐certainty evidence; NFS 3/919 (0.3%) versus 7/1856 (0.4%), RR 0.87 (95% CI 0.22 to 3.34); 2 trials; 2775 participants; very low‐certainty evidence; non‐fatal MI 7/890 (0.8%) versus 8/1374 (0.6%), RR 1.43 (95% CI 0.49 to 4.18; 2 trials); 2264 participants; very low‐certainty evidence; amputation of lower extremity 1/437 (0.2%) versus 1/888 (0.1%); very low‐certainty evidence.
Trials reported more hypoglycaemic episodes with M+S combination compared to all other metformin‐antidiabetic agent combinations. Results for M+S versus metformin monotherapy were inconclusive. There were no RCTs comparing M+S with metformin plus insulin. We identified nine ongoing trials and two trials are awaiting assessment. Together these trials will include approximately 16,631 participants.
Authors' conclusions
There is inconclusive evidence whether M+S combination therapy compared with metformin plus another glucose‐lowering intervention results in benefit or harm for most patient‐important outcomes (mortality, SAEs, macrovascular and microvascular complications) with the exception of hypoglycaemia (more harm for M+S combination). No RCT reported on health‐related quality of life.
Plain language summary
Metformin and sulphonylurea combination therapy for adults with type 2 diabetes mellitus
Review question
We wanted to investigate the effects of the combination of the antidiabetic medications metformin plus sulphonylurea compared with other antidiabetic interventions in people with type 2 diabetes.
Background
Many people with type 2 diabetes are treated with several types of glucose‐lowering drugs such as 'sulphonylureas' (for example glibenclamide or glyburide, glipizide and gliclazide). These medications lower blood glucose by stimulating the secretion of insulin in the body, thereby increasing insulin levels in the blood. Another antidiabetic agent, metformin lowers blood glucose by improving the body's ability to make insulin work better (insulin sensitivity). The combination of metformin plus sulphonylurea is widely used. We wanted to investigate the effects of metformin plus sulphonylurea on patient‐important outcomes such as complications of diabetes (for example kidney and eye disease, heart attacks, strokes), death from any cause, health‐related quality of life and side effects of the medications.
Study characteristics
We found 32 randomised controlled studies (clinical trials where people are randomly put into one of two or more treatment groups), which allocated 28,746 people with type 2 diabetes to either metformin plus sulphonylurea or a comparator group. The comparator groups consisted of the following types of antidiabetic medications in addition to metformin: five studies with glucagon‐like peptide 1 analogues, nine studies with dipeptidyl‐peptidase 4 inhibitors, 11 studies with thiazolidinediones, three studies with glinides and four studies with sodium‐glucose co‐transporter 2 inhibitors.
Participants of the studies were treated for between one and four years. There were big differences between people taking part in the studies, especially with regard to age, how long people had diabetes and whether diabetes complications were present at the start of the study.
This evidence is up to date as of March 2018.
Key results
Data on patient‐important outcomes were few, and data were sparse for all comparisons of metformin plus sulphonylurea with other antidiabetic medications. The available data did not show firm differences between metformin plus sulphonylurea and other combinations of metformin with antidiabetic drugs or metformin only for most patient‐important outcomes. There were more events with low blood sugar (hypoglycaemic episodes) with metformin plus sulphonylurea combination treatment compared to all other combinations of metformin with another antidiabetic compound.
We did not identify studies reporting on health‐related quality of life. We identified nine ongoing studies and two yet unpublished studies are awaiting assessment. Together these studies will include around 16,631 participants. Once results are published these studies could significantly influence the findings of our review.
Certainty of the evidence
All included studies had deficiencies in the way they were conducted or how study authors reported the results. For individual comparisons of the antidiabetic medications the number of participants was often small, resulting in a high risk of random error (play of chance).
Summary of findings
Summary of findings for the main comparison. Metformin‐sulphonylurea (second‐ or third‐generation) combination therapy compared with metformin plus another antidiabetic drug for adults with type 2 diabetes mellitus.
| Metformin‐sulphonylurea (second‐ or third‐generation) combination therapy compared with metformin plus another antidiabetic drug for adults with type 2 diabetes mellitus | ||||||
|
Patient: people with type 2 diabetes mellitus Settings: outpatients Intervention: metformin + sulphonylurea Comparison: metformin plus another antidiabetic drug | ||||||
| Outcomes | Metformin + antidiabetic drug | Metformin + sulphonylurea | Relative effect (95% CI) | No. of participants (trials) | Certainty of the evidence (GRADE) | Comments |
| All‐cause mortality (N) | ||||||
| M + GLP1‐A Follow‐up: 2‐3 years | 7 per 1000 | 8 per 1000 (4 to 19) | RR 1.15 (0.49 to 2.67) | 2594 (3) | ⊕⊕⊝⊝a1 Low |
|
| M + DPP4‐I Follow‐up: 1‐3 years | 4 per 1000 | 5 per 1000 (3 to 9) | RR 1.32 (0.76 to 2.28) | 11,694 (9) | ⊕⊕⊝⊝ Lowb1 | |
| M + thiazolidinedione Follow‐up: 1‐5.5 years | 34 per 1000 | 37 per 1000 (29 to 48) | RR 1.09 (0.85 to 1.40) | 6654 (6) | ⊕⊕⊝⊝ Lowc1 | |
| M + nateglinide Follow‐up: 1‐2 years |
See comment | 874 (3) | ⊕⊕⊝⊝ Lowd1 | 1 participant died in each intervention group | ||
| M + SGLT2‐I Follow‐up: 2‐4 years | 6 per 1000 | 6 per 1000 (3 to 13) | RR 0.96 (0.44 to 2.09) | 5134 (4) | ⊕⊝⊝⊝ Very lowe1 | |
| Cardiovascular mortality (N) | ||||||
| M + GLP1‐A Follow‐up: 2‐3 years | See comment | 609 (1) | ⊕⊕⊝⊝ Lowa2 | 1/307 (0.3%) participants died due to cardiovascular disease in the M+S group compared with 1/302 (0.3%) participants in the M + GLP1‐A group | ||
| M + DPP4‐I Follow‐up: 1‐3 years | 2 per 1000 | 4 per 1000 (1 to 9) | RR 1.54 (0.63 to 3.79) | 6874 (6) | ⊕⊕⊝⊝ Lowb2 | |
| M + thiazolidinedione Follow‐up: 1‐5.5 years | 14 per 1000 | 11 per 1000 (5 to 23) | RR 0.78 (0.36 to 1.67) | 5940 (4) | ⊕⊕⊝⊝ Lowc2 | |
| M + nateglinide Follow‐up: 1 year |
See comment | 446 (2) | ⊕⊕⊝⊝ Lowd2 | No cardiovascular death was reported | ||
| M + SGLT2‐I Follow‐up: 2‐4 years | 3 per 1000 | 3 per 1000 (1 to 12) | RR 1.22 (0.33 to 4.41) | 3589 (3) | ⊕⊝⊝⊝ very lowe2 | |
| Serious adverse events (N) | ||||||
| M + GLP1‐A Follow‐up: 2‐3 years | 126 per 1000 | 114 per 1000 (92 to 140) | RR 0.90 (0.73 to 1.11) | 2594 (3) | ⊕⊝⊝⊝ Very lowa3 | |
| M + DPP4‐I Follow‐up: 1‐3 years | 124 per 1000 | 132 per 1000 (120 to 146) | RR 1.07 (0.97 to 1.18) | 11,694 (9) | ⊕⊝⊝⊝ Very lowb3 | |
| M + thiazolidinedione Follow‐up: 1‐5.5 years | 200 per 1000 | 202 per 1000 (186 to 222) | RR 1.01 (0.93 to 1.11) | 6654 (6) | ⊕⊝⊝⊝ Very lowc3 | |
| M + nateglinide Follow‐up: |
60 per 1000 | 101 per 1000 (32 to 313) | RR 1.68 (0.54 to 5.21) | 874 (3) | ⊕⊕⊝⊝ Lowd3 | |
| M + SGLT2‐I Follow‐up: 2‐4 years | 124 per 1000 | 126 per 1000 (94 to 170) | RR 1.02 (0.76 to 1.37) | 5134 (4) | ⊕⊝⊝⊝ Very lowe3 | |
| Non‐fatal stroke (N) | ||||||
| M + GLP1‐A | Not reporteda4 | |||||
| M + DPP4‐I Follow‐up: 1‐2 years | 3 per 1000 | 6 per 1000 (2 to 18) | RR 2.21 (0.74 to 6.58) | 5093 (4) | ⊕⊝⊝⊝ Very lowb4 | |
| M + thiazolidinedione Follow‐up: 1‐4.8 years | 10 per 1000 | 13 per 1000 (7 to 25) | RR 1.29 (0.67 to 2.47) | 3123 (2) | ⊕⊝⊝⊝ Very lowc4 | |
| M + nateglinide Follow‐up: 52 weeks |
See comment | 233 (1) | ⊕⊝⊝⊝ Very lowd4 | No non‐fatal stroke was reported | ||
| M + SGLT2‐I Follow‐up: 2 years | 4 per 1000 | 3 per 1000 (1 to 13) | RR 0.87 (0.22 to 3.34) | 2775 (2) | ⊕⊝⊝⊝ Very lowe4 | |
| Non‐fatal myocardial infarction (N) | ||||||
| M + GLP1‐A Follow‐up: 2‐3 years | 6 per 1000 | 3 per 1000 (1 to 16) | RR 0.57 (0.12 to 2.82) | 1575 (2) | ⊕⊝⊝⊝ Very lowa5 | |
| M + DPP4‐I Follow‐up: 1‐3 years | 3 per 1000 | 5 per 1000 (2 to 10) | RR 1.45 (0.69 to 3.07) | 6874 (6) | ⊕⊝⊝⊝ very lowb5 | |
| M + thiazolidinedione Follow‐up: 1‐4.8 years | 11 per 1000 | 14 per 1000 (8 to 24) | RR 1.21 (0.68 to 2.14) | 3718 (3) | ⊕⊝⊝⊝ Very lowc5 | |
| M + nateglinide Follow‐up: 1 year |
See comment | 446 (2) | ⊕⊕⊝⊝ Lowd5 | In 1 trial 2/101 (2%) participants had a non‐fatal myocardial infarction in the M+S group compared with 0/112 participant in the metformin plus nateglinide group | ||
| M + SGLT2‐I Follow‐up: 2‐4 years | 6 per 1000 | 8 per 1000 (3 to 24) | RR 1.43 (0.49 to 4.18) | 2264 (2) | ⊕⊝⊝⊝ Very lowe5 | |
| Microvascular complications (N), definition: end‐stage renal disease, blindness or severe vision loss, amputation of lower extremity | ||||||
| M + GLP1‐A | Not reporteda6 | |||||
| M + DPP4‐I Follow‐up: 1 year | See comment | 64 (1) | ⊕⊝⊝⊝ Very lowb6 | In 1 trial no participants had a lower‐extremity amputation, developed blindness or severe vision loss, or end‐stage renal disease | ||
| M + thiazolidinedione Follow‐up: 1‐4.8 years | See comment | 3123 (2) | ⊕⊝⊝⊝ Very lowc6 | 2 trials (3123 participants) reported that no participants had a lower‐extremity amputation 1 trial (95 participants) reported that no participants developed blindness or severe vision loss, or end‐stage renal disease | ||
| M + nateglinide Follow‐up: 52 weeks |
See comment | 233 (1) | ⊕⊕⊝⊝ Lowd6 | No microvascular complications were reported | ||
| M + SGLT2‐I Follow‐up: 2 years | See comment | 1325 (1) | ⊕⊝⊝⊝ Very lowe6 | In 1 trial 1/437 (0.2%) participants had an amputation of the lower extremity in the M+S group compared with 1/888 (0.1%) in the M + SGLT2‐I group | ||
| Health‐related quality of life | Not reported | |||||
| *The basis for the assumed risk (e.g. the median control group risk across trials) is provided in footnotes. The corresponding risk (and its 95% confidence interval) is based on the assumed risk in the comparison group and the relative effect of the intervention (and its 95% CI) CI: confidence interval; DPP4‐I: dipeptidyl peptidase‐4 inhibitor; GLP1‐A: glucagon‐like peptide 1 analogue; HbA1c: glycosylated haemoglobin A1c; M: metformin; M+S: metformin + sulphonylurea; N: number; N/R: not reported; RR: risk ratio; SGLT2‐I: sodium‐glucose co‐transporter 2 inhibitor; T: thiazolidinedione | ||||||
| GRADE Working Group grades of evidence High certainty: we are very confident that the true effect lies close to that of the estimate of the effect. Moderate certainty: we are moderately confident in the effect estimate; the true effect is likely to be close to the estimate of the effect, but there is a possibility that it is substantially different. Low certainty: our confidence in the effect estimate is limited; the true effect may be substantially different from the estimate of the effect. Very low certainty: we have very little confidence in the effect estimate; the true effect is likely to be substantially different from the estimate of effect. | ||||||
All‐cause mortality a1Downgraded by two levels because of serious imprecision (CI consistent with both benefit and harm, small number of trials) ‐ see Appendix 17. b1Downgraded by one level because of inconsistency (non‐consistent direction of effect) and by one level because of imprecision (CI consistent with both benefit and harm) ‐ see Appendix 18. c1Downgraded by two levels because of serious imprecision (CI consistent with both benefit and harm, small number of trials) ‐ see Appendix 20. d1Downgraded by two levels because of serious imprecision (CI consistent with both benefit and harm, small number of trials) ‐ see Appendix 21. e1Downgraded by one level because of inconsistency (point estimates varied widely) and by two levels because of serious imprecision (CI consistent with both benefit and harm, small number of trials, low event rate) ‐ see Appendix 22.
Cardiovascular mortality a2Downgraded by two levels because of serious imprecision (small number of trials, CI consistent with both benefit and harm) ‐ see Appendix 17. b2Downgraded by one level because of because of inconsistency (non‐consistent direction of effect) and by one level because of imprecision (CI consistent with both benefit and harm) ‐ see Appendix 18. c2Downgraded by two levels because of serious imprecision (small number of trials, CI consistent with both benefit and harm) ‐ see Appendix 20. d2Downgraded by two levels because of serious imprecision (small number of trials, unknown event rate) ‐ see Appendix 20. e2Downgraded by one level because of inconsistency (point estimates varied widely) and by two levels because of serious imprecision (CI consistent with both benefit and harm, small number of trials, low event rate) ‐ see Appendix 22.
Serious adverse events a3Downgraded by one level because of attrition bias and by two levels because of serious imprecision (CI consistent with both benefit and harm, small number of trials) ‐ see Appendix 17. b3Downgraded by one level because of attrition bias, by one level because of inconsistency (non‐consistent direction of effect) and by one level because of imprecision (CI consistent with both benefit and harm) ‐ see Appendix 18. c3Downgraded by one level because of attrition bias, by one level because of inconsistency (non‐consistent direction of effect) and by one level because of serious imprecision (CI consistent with both benefit and harm, small number of trials) ‐ see Appendix 20. d3Downgraded by two levels because of serious imprecision (CI consistent with both benefit and harm, small number of trials) ‐ see Appendix 21. e3Downgraded by one level because of attrition bias and inconsistency (point estimates varied widely) and by two levels because of serious imprecision (CI consistent with both benefit and harm, small number of trials) ‐ see Appendix 22.
Non‐fatal stroke a4No adequate data for analysis. b4Downgraded by one level because of attrition bias and by two levels because of serious imprecision (CI consistent with both benefit and harm, small number of trials, low event rate) ‐ see Appendix 18. c4Downgraded by two levels because of serious imprecision (CI consistent with both benefit and harm, small number of trials) ‐ see Appendix 20. d4Downgraded by two levels of evidence because of serious imprecision (low number of trials, unknown event rate) ‐ see Appendix 21. e4Downgraded by one level because of attrition bias and by two levels because of serious imprecision (CI consistent with both benefit and harm, small number of trials, low event rate) ‐ see Appendix 22.
Non‐fatal myocardial infarction a5Downgraded by one level because of attrition bias and by two levels because of serious imprecision (small number of trials, CI consistent with both benefit and harm) ‐ see Appendix 17. b5Downgraded by one level because of attrition bias and by two levels because of serious imprecision (CI consistent with both benefit and harm, small number of trials, low event rate) ‐ see Appendix 18. c5Downgraded by one level because of attrition bias and by two levels because of serious imprecision (CI consistent with both benefit and harm, small number of trials) ‐ see Appendix 20. d5Downgraded by two levels because of serious imprecision (low number of trials, low event rate) ‐ see Appendix 21. e15Downgraded by one level because of attrition bias and by two levels because of serious imprecision (CI consistent with both benefit and harm, small number of trials, low event rate) ‐ see Appendix 22.
Microvascular complications a6No adequate data for analysis. b6Downgraded by three levels because of very serious imprecision (small number of participants, one trial only, unknown event rate) ‐ see Appendix 18. c6Downgraded by one level because of attrition bias and reporting bias and by two levels because of serious imprecision (CI consistent with both benefit and harm, small number of trials, unknown event rate) ‐ see Appendix 20. d6Downgraded by two levels because of serious imprecision (low number of trials, unknown event rate) ‐ see Appendix 21. e6Downgraded by one level because of attrition bias and by two levels because of serious imprecision (CI consistent with both benefit and harm, small number of trials, low event rate) ‐ see Appendix 22.
Background
A number of medical organisations have developed guidelines or recommendations for treatment of type 2 diabetes mellitus (T2DM). Most people with T2DM are initially recommended to reduce calorie intake and increase physical activity in order to improve glycaemic control (ADA 2016). However, in order to achieve and maintain specific glycaemic targets, the majority of people with T2DM will require pharmacological glucose‐lowering interventions. Metformin is currently the first‐line glucose‐lowering drug for people with T2DM because of its postulated benefits, including absence of weight gain, or even weight loss, and lack of hypoglycaemia (Inzucchi 2012; Nathan 2009). If behavioural interventions like diet and exercise and maximum tolerated doses of one oral glucose‐lowering drug fail to achieve the glycaemic target, other glucose‐lowering drugs are often added (ADA 2016). As T2DM is a progressive condition, a substantial proportion of people with T2DM will, with time, require insulin. Some guidelines recommend continuing metformin in this situation (ADA 2016).
As described below, people with T2DM have an elevated risk of developing macrovascular as well as microvascular complications (Almdal 2004). In the treatment of people with T2DM, researchers have considered which glycaemic target is appropriate in order to lower the risk of these complications. One hypothesis so far has been that lower glycosylated haemoglobin A1c (HbA1c) values are associated with reduced macrovascular and microvascular complications. However, this paradigm has been challenged by a Cochrane Review investigating intensive glycaemic control compared to conventional glycaemic control in people with T2DM (Hemmingsen 2011). In this review, authors found insufficient information to confirm or exclude a risk reduction in macrovascular as well as microvascular complications with intensive compared to conventional glycaemic control.
Description of the condition
Worldwide, the number of people with diabetes was estimated to be 177 million in 2000 and is foreseen to rise to 366 million in 2030 (Wild 2004). T2DM comprises 90% of people with diabetes and is associated with excess bodyweight and physical inactivity (WHO 2015). T2DM is characterised by hyperglycaemia, insulin resistance and impaired insulin secretion (LeRoith 2002). Although the definition of T2DM relies on elevated blood glucose, T2DM occurs not in isolation, but as part of a complex metabolic‐cardiovascular syndrome that includes dyslipidaemia, hypertension, obesity, clotting abnormalities, microalbuminuria and accelerated atherosclerosis, although not every one of these disorders occurs in every person with T2DM (DeFronzo 1999). People with T2DM have an elevated risk of developing macrovascular disease (such as cardiovascular death, myocardial infarction, stroke and peripheral ischaemia) as well as microvascular complications (such as retinopathy, nephropathy and neuropathy) (Almdal 2004).
Description of the intervention
Since the introduction of the sulphonylureas in the 1950s these glucose‐lowering drugs have been the mainstay in the treatment of T2DM. The first to be introduced on the market were the first‐generation sulphonylureas (acetohexamide, carbutamide, chlorpropamide, tolazamide and tolbutamide). Later, the second and third generations of sulphonylureas were introduced, and have now almost completely replaced the first‐generation sulphonylureas (Harrower 2000). The second‐generation sulphonylureas (e.g. glibenclamide (in the USA: glyburide), glipizide and gliclazide) and the third‐generation sulphonylureas (gliclazide modified release (MR), glipizide gastrointestinal therapeutic system (GITS) and glimepiride) are thought to have a better safety profile (Harrower 2000). In the late 1950s the biguanide metformin was introduced as another glucose‐lowering drug (Bailey 1996).
Metformin is usually the first choice of a glucose‐lowering drug if diet and exercise are insufficient in controlling T2DM. However, in case of metformin intolerance or contraindications, sulphonylureas might be prescribed as monotherapy. Sulphonylureas are mostly prescribed as a part of combination therapy with other glucose‐lowering drugs, especially metformin (ADA 2016). All sulphonylureas are administered orally. The daily dose recommended in people with T2DM depends on the specific sulphonylurea compound. The sulphonylureas have different pharmacokinetic profiles due to different bindings to the sulphonylurea receptor in the pancreatic β‐cells. Chlorpropamide has a half‐life of 36 hours, whereas glimepiride has a half‐life of around 5 hours (McCall 2001). Metformin has an estimated plasma half‐life of 1.5 to 4.9 hours (Bailey 1996). Because of variations in the half‐life of the different sulphonylureas, some have to be taken once daily and others two or three times daily. For glimepiride, the recommended dose is up to 6 mg per day (Langtry 1998). For gliclazide the daily dose is 30 mg to 120 mg (Deacon 2015; Harrower 2000a). Metformin is likewise administered orally. Titration of metformin begins with a low dose (500 mg) taken once or twice per day with meals. The maximum recommended dose is up to 1000 mg twice daily (Nathan 2009).
Adverse effects of the intervention
All sulphonylureas have the potential to cause hypoglycaemia. The risk of hypoglycaemia differs between the different types of sulphonylureas and some agents like glibenclamide are prone to cause prolonged hypoglycaemia. The risk of hypoglycaemia is more pronounced for the first‐generation sulphonylureas than the newer generations of sulphonylureas (Harrower 2000). In people with T2DM receiving metformin, gastrointestinal adverse effects, including abdominal discomfort and diarrhoea, are the most common adverse events, occurring in 20% to 30% of patients. Because metformin does not increase insulin secretion, hypoglycaemia is uncommon in people with T2DM taking metformin monotherapy (DeFronzo 1999). Previously, metformin was considered to be contraindicated in many chronic conditions, due to an increased risk of lactic acidosis. However, a Cochrane Review has concluded that there is no evidence that metformin is associated with an increased risk of lactic acidosis and the list of contraindications for metformin use should be reassessed (Salpeter 2010).
The University Group Diabetes Program (UGDP) trial suggested that tolbutamide was associated with adverse cardiovascular effects compared with placebo and insulin in people with T2DM (UGDP 1976). Later, other randomised clinical trials did not demonstrate clear evidence of an increased risk of cardiovascular events with sulphonylurea use compared with other glucose‐lowering drugs in people with T2DM (ADOPT 2006; UKPDS‐33 1998). Several observational studies have indicated increased mortality and risk of cardiovascular disease with sulphonylurea monotherapy compared with metformin monotherapy in people with T2DM (Morgan 2014; Roumie 2012; Schramm 2011). However, the risk seems to depend on the type of sulphonylurea (Pantalone 2012; Schramm 2011). Moreover, because of uncontrolled, or undetected, or both confounding factors in observational studies, the results of these studies have to be verified by randomised controlled trials (RCTs; Deeks 2003).
A UKPDS substudy showed that the early addition of metformin in sulphonylurea‐treated participants was associated with an increased risk of mortality compared with continuation of sulphonylurea alone (UKPDS‐34 1998). Several observational studies have investigated the association between the combination of metformin and sulphonylureas and the risk of cardiovascular disease and mortality. Overall, these studies show conflicting results (Evans 2006; Gulliford 2004; Johnson 2002; Kahler 2007).
How the intervention might work
The primary mechanism of action for the sulphonylureas is to stimulate insulin release from the pancreatic β‐cells. Sulphonylureas increase pancreatic insulin release by closing of potassium‐sensitive adenosine triphosphate (P‐ATP) channels in the β‐cells (Harrower 2000; Scott 2012). Metformin is thought to increase insulin sensitivity, which may lead to a variety of metabolic effects. Inhibition of hepatic glucose production (through increased hepatic sensitivity to insulin) is regarded as the principal mechanism through which metformin lowers blood glucose (Krentz 2005). The enzyme adenosine 5'‐monophosphate‐activated protein kinase (AMPK) has been identified as a target of the drug. Through phosphorylation of key proteins affecting energy production, AMPK regulates and co‐ordinates cellular glucose and lipid metabolism (Krentz 2005).
Why it is important to do this review
Several studies have investigated the combination therapy of metformin and sulphonylureas and the risk of cardiovascular disease and mortality (Evans 2006; Gulliford 2004; Johnson 2002; Kahler 2007; UKPDS‐34 1998). However, the data are primarily based on observational studies and show conflicting results. Therefore, it is still unclear whether metformin and sulphonylurea in combination increase the risk of cardiovascular disease and mortality. Guidelines suggest flexibility in choosing the next drug after metformin monotherapy failure (ADA 2016). It therefore remains to be clarified which drug class is the most suitable second line, since most people with T2DM will need a combination therapy over time in order to achieve glycaemic targets. This systematic review aims to evaluate whether sulphonylureas are the best choice of combination therapy with metformin.
Objectives
To assess the effects of metformin and sulphonylurea (second‐ or third‐generation) combination therapy for adults with type 2 diabetes mellitus.
Methods
Criteria for considering studies for this review
Types of studies
We included randomised controlled trials (RCTs).
Types of participants
Adults aged 18 years or older with type 2 diabetes mellitus (T2DM).
Diagnostic criteria for diabetes mellitus
In order to be consistent with changes in the classification of and diagnostic criteria for diabetes mellitus over the years, the diagnosis should be established using the standard criteria valid at the time the trial commenced (e.g. ADA 2003; ADA 2008; WHO 1998). Ideally, the diagnostic criteria should have been described. We used the trial authors' definition of diabetes mellitus if necessary. We planned to subject diagnostic criteria to a sensitivity analysis.
Types of interventions
We planned to investigate the following comparisons of intervention versus control/comparator.
Intervention
Metformin plus second‐ or third‐generation sulphonylurea (M+S) combination therapy
Comparator
Metformin plus another glucose‐lowering intervention as a combination therapy (e.g. metformin plus dipeptidylpeptidase‐4 inhibitor, metformin plus insulin)
Metformin plus placebo
Metformin monotherapy
Concomitant interventions would have to be the same in both the intervention and comparator groups to establish fair comparisons.
If a trial included multiple arms, we included any arm that met the review's inclusion criteria.
Minimum duration of intervention
We included trials with a minimum duration of intervention of 52 weeks. Because we primarily intended to investigate patient‐important outcomes, we focused on longer‐term trials, since macrovascular and microvascular complications develop over time.
Minimum duration of follow‐up
We included trials with a duration of the intervention of 52 weeks or more. Extended follow‐up periods (also called open‐label extension studies) defined as a follow‐up of participants once the original trial was terminated, as specified in the power calculation for this trial, are frequently of an observational nature, and we have only evaluated them for adverse events (Buch 2011; Megan 2012).
Summary of specific exclusion criteria
We excluded combinations of more than two glucose‐lowering agents.
We excluded studies investigated women diagnosed with gestational diabetes.
Types of outcome measures
We did not exclude a trial only on the basis that one or several of our primary or secondary outcome measures were not reported in the publication. In case none of our primary or secondary outcomes were reported we did not include this trial but provided some basic information in an additional table.
Primary outcomes
All‐cause mortality
Health‐related quality of life
Serious adverse events
Secondary outcomes
Cardiovascular mortality
Non‐fatal myocardial infarction
Heart failure
Non‐fatal stroke
Amputation of lower extremity
Blindness or severe vision loss
End‐stage renal disease
Non‐serious adverse events
Hypoglycaemia
Socio‐economic effects
Additional explorative outcomes
Weight
HbA1c (glycosylated haemoglobin A1c)
Method of outcome measurement
All‐cause mortality: defined as death from any cause
Health‐related quality of life: defined as mental and physical health‐related quality of life, separate and combined, evaluated by a validated instrument such as Short‐Form 36
Serious adverse events: defined according to the International Conference on Harmonization Guidelines as any event that leads to death, that is life‐threatening, required in‐patient hospitalisation or prolongation of existing hospitalisation, resulted in persistent or significant disability, and any important medical event that may have jeopardised the participant or required intervention to prevent it (ICH 1997), or as reported in trials.
Cardiovascular mortality: defined as death from myocardial infarction, heart failure or stroke
Non‐fatal myocardial infarction, heart failure, non‐fatal stroke, amputation of lower extremity, blindness or severe vision loss, hypoglycaemia (mild/moderate, serious): defined as reported in trials. Measured at the end of the intervention and at the end of follow‐up.
End‐stage renal disease: defined as dialysis, renal transplantation or death due to renal disease
Non‐serious adverse events: defined as number of participants with any untoward medical occurrence not necessarily having a causal relationship with the intervention.
Weight and HbA1c: measured in kg and %
Socio‐economic effects: for example costs of the intervention, absence from work, medication consumption
Timing of outcome measurement
For all‐cause mortality, serious adverse events and non‐serious adverse events: any time after participants were randomised to intervention/comparator groups
For all other outcomes measures: at the end of the intervention and at the end of follow‐up.
Specification of key prognostic variables
Ethnicity
Obesity
Hypertension
Previous gestational diabetes
Age
Existing cardiovascular disease
Kidney disease
Search methods for identification of studies
Electronic searches
In 2016 the Agency for Healthcare Research and Quality (AHRQ) published an updated systematic review with meta‐analyses on the effectiveness and safety of glucose‐lowering interventions for people with T2DM, including metformin‐based combination therapies (Maruthur 2016). This report included search results from several databases up to April 2015 and a further update of MEDLINE up to December 2015.
We based our search on the results of this systematic AHRQ report and added new references identified by a revised search strategy from 2015 onwards, in the following literature databases.
Cochrane Central Register of Controlled Trials (CENTRAL; 2018, Issue 3) via the Cochrane Register of Studies Online (CRSO)
MEDLINE Ovid (Epub Ahead of Print, In‐Process & Other Non‐Indexed Citations, Ovid MEDLINE(R) Daily and Ovid MEDLINE(R); from 1946 to 5 March 2018)
Embase Ovid (from 1974 to 13 July 2016)
Additionally we searched the following trials registers:
ClinicalTrials.gov (5 March 2018)
World Health Organization International Clinical Trials Registry Platform (ICTRP) (5 March 2018)
We continuously applied a MEDLINE (Ovid SP) email alert service to identify newly published trials using the same search strategy as described for MEDLINE (for details on search strategies, see Appendix 1).
Searching other resources
We searched the reference lists of included trials, systematic reviews, meta‐analyses and health technology assessment reports for other potentially eligible trials or ancillary publications. In addition, we contacted authors of included trials to identify any additional information about the retrieved trials and to determine whether further trials existed that we had missed.
We also searched manufacturers' websites and the databases of regulatory agencies (European Medicines Agency (EMA), US Food and Drugs Administration (FDA); Hart 2012; Schroll 2015).
We did not use abstracts or conference proceedings for data extraction because this information source does not fulfil the CONSORT requirements which is "an evidence‐based, minimum set of recommendations for reporting randomized trials" (CONSORT; Scherer 2007).
Data collection and analysis
Selection of studies
Two review authors (KM and PK, LK or FG) independently scanned the abstract, title, or both, of every record we retrieved in the literature searches, to determine which trials we should assess further. We obtained the full text of all potentially‐relevant records. We resolved any disagreements through consensus or by recourse to an additional review author (BH). If we could not resolve a disagreement, we categorised the trial as a 'study awaiting classification' and contacted the trial authors for clarification. We prepared a flow diagram of the number of trials identified and excluded at each stage in accordance with the PRISMA flow diagram of trial selection (Liberati 2009).
Data extraction and management
For trials that fulfilled our inclusion criteria, two review authors (KM and PK, LK or FG) independently extracted key participant and intervention characteristics. We reported data on efficacy outcomes and adverse events using standard data extraction sheets from the Cochrane Metabolic and Endocrine Disorders (CMED) Group. We resolved any disagreements by discussion or, if required, by consultation with an additional review author (BH) (for details see Characteristics of included studies; Table 2; Table 3; Appendix 2; Appendix 3; Appendix 4; Appendix 5; Appendix 6; Appendix 7; Appendix 8; Appendix 9; Appendix 10; Appendix 11; Appendix 12; Appendix 13; Appendix 14). We tried to retrieve the protocol for each included trial.
1. Overview of trial populations.
|
Trial ID (design) |
Intervention(s) and comparator(s) | Description of power and sample size calculation | Screened/eligible (N) | Randomised (N) | Analysed (N) | Finishing trial (N) | Randomised finishing trial (%) | Follow‐up (extended follow‐up)a |
|
Handelsman 2017 (non‐inferiority parallel RCT) |
I: metformin ≥ 1500 mg/day + glimepiride 1‐6 mg/day + placebo | Quote from publication: "A sample size of ˜340 patients randomized to each treatment group was calculated to have 91% power to declare non‐inferiority for a margin of δ=0.35% at an overall two sided 5% alpha‐level, assuming that the true mean difference in HbA1c between omarigliptin and glimepiride is 0.0%" | 1197 | 375 | 375 | 284 | 75.7 | 54 weeks |
| C: metformin ≥ 1500 mg/day + omarigliptin 25 mg/week + placebo | 376 | 375 | 290 | 77.1 | ||||
| Total: | 751 | 750 | 574 | 76.4 | ||||
|
Hollander 2017 (non‐inferiority parallel RCT) |
I: metformin ≥ 1500 mg/day + glimepiride 1‐8 mg/day + placebo | Quote from publication: "With a non‐inferiority margin of 3.3 mmol/mol (0.3%), and assuming a true mean difference in HbA1c of 0 mmol/mol, randomisation of approximately 1230 patients (410 patients per group, to yield a sample size of 337 per group at week 52) was estimated to provide 97% power to demonstrate non‐inferiority of a given ertugliflozin dose to glimepiride in HbA1c reduction at week 52" | 2985 | 437 | 352 | 348 | 79.6 | 52 weeks (104 weeks)b |
| C1: metformin ≥ 1500 mg/day + ertugliflozin 5 mg/day + placebo | 448 | 335 | 340 | 75.9 | ||||
| C2: metformin ≥ 1500 mg/day + ertugliflozin 15 mg/day + placebo | 441 | 350 | 357 | 81.0 | ||||
| Total: | 1326 | 1037 | 1045 | 78.8 | ||||
|
Vaccaro 2017 (parallel RCT)c |
I: metformin 2000 mg/day + sulphonylurea (glibenclamide 5‐15 mg/day, gliclazide 30‐120 mg/day or glimepiride 2‐6 mg/day) | Quote from publication: "The study was designed to be event driven. The initial sample size calculation was based on an estimated primary endpoint rate of 3.5% per year, with the study intended to have 80% power to detect a reduction of 20% in the primary outcome in either group versus the other, based on the results of the PROACTIVE trial. On the basis of these assumptions, 652 events were needed for the primary efficacy analysis. Therefore, 4396 patients had to be enrolled and followed up for at least 4 years; assuming a trial discontinuation rate of 15%, 5172 patients needed to be recruited and randomly assigned (2586 in each treatment group). However, because of the lower than expected rate of recruitment and because the number of participants discontinuing the study was lower than initially foreseen, an approved protocol amendment (January, 2012) subsequently reduced the sample size requirement. Accordingly, 3371 patients should have been enrolled to expect the 498 endpoint events needed to detect a 20% reduction in the incidence of events with a statistical power of 80% (hazard ratio [HR] 0.80, p=0.05 [one‐sided log‐rank test]), assuming an estimated occurrence rate of the primary endpoint of 3.5% per year and a 5% loss to follow‐up. Nonetheless, nearly 9 years after the beginning of the study, the number of events needed was still not reached, and a futility analysis was done as recommended by the data and safety monitoring board" | 4956 | 1500 | 1493 | 1255 | 83.6 | Median follow‐up 57.3 months |
| C: metformin 2000 mg/day + pioglitazone 15‐45 mg/day | 1541 | 1535 | 1103 | 71.6 | ||||
| Total: | 3041 | 3028 | 2358 | 77.5 | ||||
|
Dei Cas 2017 (parallel RCT) |
I: metformin ≥ 1500 mg/day + glibenclamide 10 mg/day | Quote from publication: "Sample size was calculated to achieve 80% power to reject the null hypothesis of equal mean changes in the primary endpoint when the population mean difference is 0.15 with a standard deviation of 0.2 in both groups and with a significance level (∝) of 0.05 using a two‐sided two sample equal‐variance T test (difference between the two treatments at 12 months) (software PASS‐ NCSS, USA). In addition, 40 subjects were sufficient to guarantee a delta value between 0 and 12 months in the treatment group of ˜10% (SD of pair differences 20%) with a alpha value of 5% and β = 80%" | 73 | 24 | 24 | 19 | 79.2 | 12 months |
| C: metformin ≥ 1500 mg/day + vildagliptin 100 mg/day | 40 | 40 | 40 | 100 | ||||
| Total: | 64 | 64 | 59 | 92.2 | ||||
|
Leiter 2015 (non‐inferiority parallel RCT) |
I: metformin ≥ 1500 mg/day + glimepiride 1‐8 mg/day | Quote from publication: "Sample size was calculated on the basis of the per‐protocol analysis; an estimated 277 patients per group would be needed to provide approximately 90% power to show non‐inferiority of canagliflozin to glimepiride for HbA1c lowering, with an assumed difference of 0.0% between canagliflozin and glimepiride and an assumed common SD of 1.0%. We assumed that 35% of patients would discontinue the study before week 52; therefore, about 427 patients were planned for inclusion in each group. For the body composition substudy, 46 or more patients per group would provide 90% power for the comparisons between groups in percentage of total fat and visceral adipose tissue; to assure collection of imaging at both baseline and week 52, approximately 70 patients per group were planned for inclusion" | 3316 | 484 | 482 | 314 | 64.9 | 52 weeks (+ 52 weeks) |
| C1: metformin ≥ 1500 mg/day + canagliflozin 100 mg/day | 483 | 483 | 343 | 71.0 | ||||
| C2: metformin ≥ 1500 mg/day + canagliflozin 300 mg/day | 485 | 485 | 323 | 66.6 | ||||
| Total: | 1452 | |||||||
|
Del Prato 2015 (non‐inferiority parallel RCT) |
I: metformin 1500‐2500 mg/day + glipizide 5‐20 mg/day | Quote from publication: "To demonstrate non‐inferiority of dapagliflozin in comparison with glipizide as add‐on therapy to metformin for changes from baseline to week 52 in HbA1c with a non‐inferiority margin of 0.35%, assuming a standard deviation (SD) of 1.25%, and at a one‐sided significance level of 0.025, 280 evaluable patients were needed in each treatment group to provide approximately 90% power (given a true difference of zero between the 2 treatment groups). Assuming a 5% exclusion rate from the full analysis set, 295 patients per treatment group are needed for the full analysis set. Additionally, to have 90% power for the per‐protocol population and assuming a 25% exclusion rate from the per‐protocol population, 373 patients per treatment group (746 patients in total) were planned for randomization" | 1217 | 408 | 401 | 141 | 34.6 | 52 weeks (+156 weeks) |
| C: metformin 1500‐2500 mg/day + dapagliflozin 2.5‐10 mg/day | 406 | 400 | 161 | 39.7 | ||||
| Total: | 814d | 801 | 302 | 37.0 | ||||
|
Schernthaner 2015 (parallel RCT) |
I: metformin at any dose + glimepiride 1‐6 mg/day + placebo | Quote from publication: "A sample size of 698 patients (349/treatment arm) was calculated for detecting superiority of saxagliptin in the primary endpoint, with a two‐sided significance level of 0.05 and 80% power. This assumed a 10% dropout rate and an odds ratio (OR) of 1.55 for achieving target HbA1c without hypoglycaemia with saxagliptin compared with glimepiride" | 957 | 360 | 359 | 285 | 79.2 | 52 weeks |
| C: metformin at any dose + saxagliptin 5 mg/day + placebo | 360 | 359 | 289 | 80.3 | ||||
| Total: | 720 | 718 | 574 | 79.7 | ||||
|
Del Prato 2014e (non‐inferiority parallel RCT) |
I: metformin ≥ 1500 mg once daily or maximum tolerated dose + glipizide 5‐20 mg once daily | Quote from publication: "The planned randomization sample size for the study was between 815 and 897 patients per treatment arm. This ensured at least 95% power to declare non‐inferiority between either alogliptin dose (12.5 or 25 mg) and glipizide at week 104, assuming a non‐inferiority margin of 0.3%, no difference between either alogliptin dose and glipizide, a standard deviation of change from baseline of 1.2%, an evaluability rate of 60%, and a one‐sided 0.0125 significance level. The 0.0125 significance level was chosen so that, combined with similar analyses conducted at week 52, the overall one‐sided type 1 error rate for the trial was maintained at the 0.025 level" | 5789 | 874 | 336 | 427 | 48.9 | 104 weeks (+ 2 weeks) |
| C1: metformin ≥ 1500 mg once daily or maximum tolerated dose + alogliptin 12.5 mg once daily | 880 | 371 | 472 | 53.6 | ||||
| C2: metformin ≥ 1500 mg once daily or maximum tolerated dose + alogliptin 25 mg once daily | 885 | 382 | 493 | 55.7 | ||||
| Total: | 2639 | 1089 | 1392 | 52.7 | ||||
|
Ahrén 2014 (non‐inferiority parallel RCT) |
I: metformin ≥ 1500 mg daily + glimepiride 2‐4 mg once daily + placebo | Quote from publication: "The planned sample size provided >90% power to demonstrate superiority versus placebo and noninferiority versus sitagliptin and glimepiride (noninferiority margin = 0.3%). Superiority of albiglutide versus sitagliptin and glimepiride was tested if noninferiority was established" | 1525 | 317 | 102 | 191 | 60.3 | 104 weeks (+ 52 weeks) |
| C1: metformin ≥ 1500 mg daily + albiglutide 30‐50 mg once weekly + placebo | 315 | 115 | 192 | 61.0 | ||||
| C2: metformin ≥ 1500 mg daily + sitagliptin 100 mg once daily + placebo | 313 | 88 | 190 | 60.7 | ||||
| C3: metformin ≥ 1500 mg daily + placebo | 104 | 16 | 55 | 52.9 | ||||
| Total: | 1049 | 321 | 628 | 59.9 | ||||
|
Ridderstråle 2014 (non‐inferiority parallel RCT) |
I: metformin immediate release ≥ 1500 mg/day plus glimepiride 1‐4 mg/day | Quote from publication: "698 patients per group were needed to provide a power of at least 95% to show non‐inferiority, based on a margin of 0.3%, for the primary endpoint at weeks 52 and 104 if the true treatment effect is 0.05% (in favour of glimepiride) and SD is 1.2%" | 2637 | 780 | 780 | 648 ( 2 years) 589 (4 years) |
83.1 (2 years) 75.5 (4 years) |
208 weeks |
| C: metformin immediate release ≥ 1500 mg/day plus empagliflozin 25 mg/day | 769 | 765 | 652 (2 years) 610 (4 years) |
84.8 (2 years) 79.3 (4 years) |
||||
| Total: | 1549 | 1545 |
1300 (2 years) 1199 (4 years) |
83.9 (2 years) 77.4 (4 years) |
||||
|
Göke 2013 (non‐inferiority parallel RCT) |
I: metformin ≥ 1500 mg daily + glipizide 5‐20 mg/day | Quote from publication: "With 419 patients per treatment group, there was a 95% power to establish the non‐inferiority comparison on change from baseline to week 52 HbA1c at the 5% level, assuming that the standard deviation of change from baseline HbA1c was 1.1%, with a non‐inferiority limit set at 0.35% and a zero true difference between the two randomised treatments. The sample size assumed that 35% of randomised patients would be excluded from the PP analysis set" | 1377 | 430 | 426 | 147 | 34.2 | 52 weeks (+ 52 weeks) |
| C: metformin ≥ 1500 mg daily + saxagliptin 5 mg/day | 428 | 426 | 165 | 38.6 | ||||
| Total: | 858 | 852 | 312 | 36.4 | ||||
|
Maffioli 2013 (parallel RCT) |
I: metformin 2550 mg/day plus glibenclamide 10 mg/day | Quote from publication: "Considering a difference of at least 10% as clinically significant compared with the baseline and an α error of 0.05, the actual sample size was adequate to obtain a power higher than 0.80 to detect a significant between‐group difference in variables related to ultrasonography parameters" | ‐ | 84 | 80 | 80 | 95.2 | 12 months |
| C: metformin 2550 mg/day plus pioglitazone 30 mg/day | 86 | 80 | 80 | 93.0 | ||||
| Total: | 170 | 160 | 160 | 94.1 | ||||
|
Nauck 2013 (parallel RCT) |
I: metformin 1500‐2000 mg/day + glimepiride 1‐4 mg/day + placebo | Quote from publication: "Sample size calculations were based on showing A1C and body weight differences of 0.5 and 3%, respectively, after 6 months of treatment. The assumed standard deviation for A1C and the coefficient of variance for weight were 1.2 and 3%, respectively. The combined power (calculated as the product of the marginal powers for A1C and weight) was at least 85%" | 1662 | 244 | 234 | 113 | 46.3 | 26 weeks (+ 18 months) |
| C1: metformin 1500‐2000 mg/day + liraglutide 0.6 mg/day + placebo | 242 | 239 | 130 | 53.7 | ||||
| C2: metformin 1500‐2000 mg/day + liraglutide 1.2 mg/day + placebo | 241 | 231 | 137 | 56.8 | ||||
| C3: metformin 1500‐2000 mg/day + liraglutide 1.8 mg/day + placebo | 242 | 235 | 118 | 48.8 | ||||
| C4: metformin 1500‐2000 mg/day + placebo | 122 | 120 | 31 | 25.4 | ||||
| Total: | 1091 | 1059 | 529 | 48.5 | ||||
|
Gallwitz 2012a (non‐inferiority parallel RCT) |
I: metformin median dose 2000 mg/day + glimepiride mean dose 2.01 mg/day + placebo | Quote from publication: "We calculated sample size on the basis of the non‐inferiority test of exenatide versus glimepiride, an expected mean baseline HbA1c concentration of 8.2%, a 1 year patient accrual, maximum follow‐up of 3 years, dropout rate of 15% per year (for reasons other than treatment failure), and a 58% event rate in each group after 1 year. With these assumptions, 527 patients per study group would provide about a 90% power to conclude non‐inferiority of exenatide" | 1404 | 514 | 485 | 386 | 75.1 | Max. follow‐up 3 years |
| C: metformin median dose 2000 mg/day + exenatide mean dose 17.35 μg/day + placebo | 515 | 488 | 341 | 66.2 | ||||
| Total: | 1029 | 973 | 727 | 71.1 | ||||
|
Gallwitz 2012b (non‐inferiority parallel RCT) |
I: metformin ≥ 1500 mg/day + glimepiride 1‐4 mg/day | Quote from publication: "On the assumption of an SD of change in HbA1c from baseline of 1.3%, a sample size of 707 participants per treatment group was needed for 90% power to show non‐inferiority through a 97.5% CI for treatment difference in the adjusted mean change from baseline to endpoint of < 0.35% HbA1c at the level of α=0.0125 (one‐sided)" | 2283 | 775 | 755 | 604 | 78 | 104 weeks (+ 1 week) |
| C: metformin ≥ 1500 mg/day + linagliptin 5 mg/day | 777 | 764 | 587 | 76 | ||||
| Total: | 1552 | 1519 | 1191 | 77 | ||||
|
Derosa 2011a (parallel RCT) |
I: metformin 1000‐2000 mg/day + glimepiride 6 mg/day | Quote from publication: "Considering as clinically significant a difference of at least the 10% compared to the baseline and an alpha error of 0.05, the actual sample size was adequate to obtain a power higher than 0.80 for all measured variable" | ‐ | 54 | 49 | 49 | 90.7 | 12 months |
| C: metformin 1000‐2000 mg/day + exenatide 20 μg/day | 57 | 52 | 52 | 91.2 | ||||
| Total: | 111 | 101 | 101 | 91.0 | ||||
|
Derosa 2011b (parallel RCT) |
I: metformin 1700 ± 850 mg/day + glibenclamide 5‐15 mg/day | Quote from publication: "Considering as clinically significant a difference of at least the 10% compared to the baseline and an alpha error of 0.05, the actual sample size was adequate to obtain a power higher than 0.80 for all measured variables" | ‐ | 99 | 95 | 95 | 96.0 | 12 months |
| C: metformin 1700 ± 850 mg/day + pioglitazone 15‐45 mg/day | 102 | 99 | 99 | 97.1 | ||||
| Total: | 201 | 194 | 194 | 96.5 | ||||
|
Petrica 2011 (parallel RCT) |
I: metformin 1700 mg/day plus glimepiride 4 mg/day | ‐ | 124 | 39 | 34 | 34 | 87.2 | 1 year |
| C: metformin 1700 mg/day plus pioglitazone 30 mg/day | 39 | 34 | 34 | 87.2 | ||||
| Total: | 78 | 68 | 68 | 87.2 | ||||
|
Derosa 2010 (parallel RCT) |
I: metformin 1500 ± 500 mg/day + glibenclamide 15 mg/day | ‐ | ‐ | 65 | 57 | 57 | 87.7 | 12 months |
| C: metformin 1500 ± 500 mg/day + exenatide 20 μg/day | 63 | 59 | 59 | 93.7 | ||||
| Total: | 128 | 116 | 116 | 90.6 | ||||
|
Matthews 2010 (non‐inferiority parallel RCT) |
I: metformin ≥ 1500 mg twice a day + glimepiride 2‐6 mg/day | Quote from publication: "With 3120 patients randomized (i.e. 1560 patients per treatment arm) and an overall 20% discontinuation rate, the study had 96% power to show non‐inferiority of vildagliptin compared with glimepiride (one‐sided α level of 0.0125, assuming a non‐inferiority margin of 0.3% HbA1c and a standard deviation of 1.25%)" | approx. 6000 | 1556 | 1518 | 953 | 61.2 | 2 years |
| C: metformin ≥ 1500 mg twice a day + vildagliptin 50 mg twice a day | 1562 | 1476 | 994 | 63.6 | ||||
| Total: | 3118 | 2994 | 1947 | 62.4 | ||||
|
Filozof 2010 (non‐inferiority parallel RCT) |
I: metformin 1500 mg/day plus gliclazide 80‐320 mg/day | Quote from publication: "Eight hundred patients (400 per group) were required to demonstrate non‐inferiority of vildagliptin to gliclazide in HbA1c reduction, with a one‐sided α level of 0.025 at the end of the study with 92% power (assuming a true difference of 0.1% in favour of gliclazide, standard deviation of HbA1c reduction at week 52 of 1.25 units and discontinuation rate of 20% over the 52‐week period)" | ‐ | 494 | 393 | 412 | 83.4 | 52 weeks |
| C: metformin 1500 mg/day plus vildagliptin 100 mg/day | 513 | 386 | 407 | 79.3 | ||||
| Total: | 1007 | 779 | 819 | 81.3 | ||||
|
Seck 2010 (non‐inferiority parallel RCT) |
I: metformin ≥ 1500 mg/day plus glipizide 5‐20 mg/day | ‐ | 2141 | 584 | 559 | 264 | 45.2 | 2 years |
| C: metformin ≥ 1500 mg/day plus sitagliptin 100 mg/day | 588 | 576 | 255 | 43.4 | ||||
| Total: | 1172 | 1135 | 519 | 44.3 | ||||
|
Home 2009 (non‐inferiority parallel RCT) |
I: metformin up to 2550 mg/day + glibenclamide (or equivalent for different preparations) up to 15 mg/day or gliclazide up to 240 mg/day or glimepiride up to 4 mg/day | Quote from publication: "For the non‐inferiority hypothesis, 4000 participants followed for a median time of 6 years were needed to give 99% power, provided that the active control group had an 11% event rate per year, allowing 2% annual loss to follow‐up. Blinded overall event tracking showed the event rate during the study was well below this rate. Therefore, endpoint sweeps were implemented to identify any missed events. An in‐depth review of a sample of individual records showed very few missed events" | 7428 | 1108 | 1105 | 906 | 82.0 | Mean follow‐up: 5.5 years |
| C: metformin up to 2550 mg/day + rosiglitazone up to 8 mg/day | 1120 | 1117 | 939 | 84.1 | ||||
| Total: | 2228 | 2222 | 1845 | 83.0 | ||||
|
Derosa 2009a (parallel RCT) |
I: metformin 850 mg/day + glimepiride 2‐6 mg/day | Quote from publication: "Considering as clinically significant a difference of at least 10% compared with the baseline and an α error of 0.05, the actual sample size is adequate to obtain a power higher than 0.80 for all variables related to glucose metabolism..." | ‐ | 66 | ‐ | 60 | 90.9 | 15 months |
| C1: metformin 850‐2550 mg/day + pioglitazone 15‐45 mg/day | 69 | ‐ | 60 | 87.0 | ||||
| C2: metformin 1000‐3000 mg/day | 67 | ‐ | 60 | 90.0 | ||||
| Total: | 202 | 180 | 89.1 | |||||
|
Derosa 2009b (parallel RCT) |
I: metformin 1500‐3000 mg/day + glibenclamide 7.5‐15 mg/day | ‐ | ‐ | 124 | 114 | 114 | 91.9 | 1 year |
| C: metformin 1500‐3000 mg/day + nateglinide 180‐360 mg/day | 124 | 119 | 119 | 96.0 | ||||
| Total: | 248 | 233 | 233 | 94.0 | ||||
|
Petrica 2009 (parallel RCT) |
I: metformin 1700 mg/day + glimepiride 4 mg/day | ‐ | 65 | 22 | 17 | 17 | 77.3 | 1 year |
| C: metformin 1700 mg/day plus rosiglitazone 4 mg/day | 22 | 17 | 17 | 77.3 | ||||
| Total: | 44 | 34 | 34 | 77.3 | ||||
|
NCT00367055 (parallel RCT) |
I: metformin 2000 mg/day + gliclazide 80‐320 mg/day | ‐ | ‐ | 44 | 41 | 30 | 68.2 | 36 months |
| C: metformin 2000 mg/day + rosiglitazone 4‐8 mg/day | 45 | 43 | 32 | 71.1 | ||||
| Total: | 89 | 62 | 62 | 69.7 | ||||
|
Hamann 2008 (non‐inferiority parallel RCT) |
I: metformin 2000 mg/day + glibenclamide 5‐15 mg/day or gliclazide 80‐320 mg/day | Quote from publication: "The non‐inferiority margin was set at 0.4%. A sample size of 190 per treatment group was required to give a 90% probability that the upper limit of a two‐sided 95% CI for the difference in treatment means would be below 0.4% (significance level of 0.025 in a one‐sided test), assuming an SD of 1.2%. Assuming an attrition rate of 30%, 544 subjects were to be recruited" | 818 | 302 | 288 | 230 | 76.2 | 52 weeks |
| C: metformin 2000 mg/day + rosiglitazone 4‐8 mg/day | 294 | 285 | 233 | 79.3 | ||||
| Total: | 596 | 573 | 463 | 77.7 | ||||
|
Ristic 2007 (parallel RCT) |
I: metformin > 1000 mg/day + gliclazide 80‐240 mg/day | Quote from publication: "A planned sample size of 120 patients per treatment was considered sufficient to detect an HbA1c difference of 0.5% with 90% power, assuming a dropout rate of 15% and an SD of 1.1 (calculated for 24 weeks treatment)" | ‐ | 129 | 101 | 98 | 76.0 | 24 weeks (+6 months) |
| C: metformin > 1000 mg/day + nateglinide 180‐540 mg/day | 133 | 112 | 108 | 81.2 | ||||
| Total: | 262 | 213 | 206 | 78.6 | ||||
|
Charbonnel 2005 (parallel RCT) |
I: metformin at pre‐study dose + gliclazide 80‐320 mg/day | Quote from publication: "Sample size was based on demonstrating a between‐group difference of 0.35% in the change in HbA1c from baseline to week 52 (the primary efficacy variable) using a two‐sided t‐test. A total of 225 patients/group completing at least 24 weeks of the study was required, on the basis of a level of 95% power at 5% significance" | 1071 | 313 | ‐ | 238 | 76.0 | 104 weeks |
| C: metformin at pre‐study dose + pioglitazone 15‐45 mg/day | 317 | ‐ | 233 | 73.5 | ||||
| Total: | 630 | ‐ | 471 | 74.8 | ||||
|
Derosa 2005 (parallel RCT) |
I: metformin 1500 mg/day plus glimepiride 2 mg/day | Quote from publication: "The study power was a priori calculated by using the World Wide Web‐available power calculator of the university of California, Los Angeles, Department of statistics (Los Angeles, CA)" | ‐ | 49 | 47 | 47 | 95.9 | 12 months |
| C: metformin 1500 mg/day plus rosiglitazone 4 mg/day | 50 | 48 | 48 | 96.0 | ||||
| Total: | 99 | 95 | 95 | 96.0 | ||||
|
Gerich 2005 (parallel RCT) |
I: metformin 500‐2000 mg/day + glyburide 1.25‐15 mg/day + placebo | ‐ | 908 | 209 | 198 | 122 | 58.4 | 104 weeks |
| C: metformin 500‐2000 mg/day + nateglinide 180‐540 mg/day + placebo | 219 | 208 | 141 | 64.4 | ||||
| Total: | 428 | 406 | 263 | 61.4 | ||||
| Grand total | All interventions | 12,863 | ||||||
| All comparators | 15,883 | |||||||
| All interventions and comparators | 28,746 | |||||||
‐ denotes not reported
aFollow‐up under randomised conditions until end of trial (= duration of intervention + follow‐up post‐intervention or identical to duration of intervention); extended follow‐up refers to follow‐up of participants once the original trial was terminated as specified in the power calculation. bThe trial was conducted over 104 weeks in two 52‐week phases; the primary and secondary hypotheses were pre‐specified for testing at week 52 (phase A); treatment was continued for another 52 weeks (phase B) to evaluate longer‐term safety and efficacy. cThe median duration of therapy was 12 (IQR 11–13) months, 12 (11–12) months for vildagliptin and 12 (7–13) months for glibenclamide. dTwo participants did not take the drug. eThe primary efficacy endpoint was the change in HbA1c from baseline to week 52 and to week 104.
C: comparator; CI: confidence interval; FPG: fasting plasma glucose; HbA1c: glycosylated haemoglobin A1c; I: intervention; IQR: interquartile range; PP: per protocol; RCT: randomised controlled trial; SD: standard deviation
2. Overview of trials (trial arms), comparators, intervention and number of randomised participants.
| Drug class | Trials (trial arms) (N)a | Metformin + comparator: randomised participants (N) | Metformin + sulphonylurea: randomised participants (N)b |
| Thiazolidinediones | 1 1 1 1 1 1 1 1 1 1 1 Total:11 (11) |
Pioglitazone 15‐45 mg: 1541 Pioglitazone 15‐45 mg: 102 Pioglitazone 15‐45 mg: 69 Pioglitazone: 15‐45 mg: 317 Pioglitazone 30 mg: 86 Pioglitazone 30 mg: 39 Rosiglitazone 4 mg: 22 Rosiglitazone 4 mg: 50 Rosiglitazone 4‐8 mg: 45 Rosiglitazone 4‐8 mg: 294 Rosiglitazone up to 8 mg: 1120 Total:3685 |
Glimepiride/glibenclamide/gliclazide: 1500 Glibenclamide: 99 Glimepiride: 66 Gliclazide: 313 Glibenclamide: 84 Glimepiride: 39 Glimepiride: 22 Glimepiride: 49 Gliclazide: 44 Glibenclamide/gliclazide: 302 Glibenclamide/gliclazide/glimepiride: 1108 Total:3626 |
| DPP‐4 inhibitors | 1 1 1 1 1 1 1 1 1 1 1 Total: 10 (11) |
Alogliptin 12.5 mg: 880 Alogliptin 25 mg: 885 Linagliptin 5 mg: 777 Omarigliptin 25 mg: 376 Saxagliptin 5 mg: 360 Saxagliptin 5 mg: 428 Sitagliptin 100 mg: 313 Sitagliptin 100 mg: 588 Vildagliptin 50 mg: 1562 Vildagliptin 100 mg: 40 Vildagliptin 100 mg: 513 Total: 6722 |
Glipizide: 874
(Glipizide: 874) Glimepiride: 775 Glimepiride: 375 Glimepiride: 360 Glipizide: 430 Glimepiride: 317 Glipizide: 584 Glimepiride: 1556 Glibenclamide: 24 Gliclazide: 494 Total: 5789 |
| GLP‐1 agonists | 1 1 1 1 1 1 1 Total: 5 (7) |
Albiglutide 30‐50 mg: 315 Exenatide 17.35 µg: 515 Exenatide 20 µg: 57 Exenatide 20 µg: 63 Liraglutide 0.6 mg: 242 Liraglutide 1.2 mg: 241 Liraglutide 1.8 mg: 242 Total: 1675 |
Glimepiride: 317 Glimepiride: 514 Glimepiride: 54 Glibenclamide: 65 Glimepiride: 244 (Glimepiride: 244) (Glimepiride: 244) Total: 1194 |
| SGLT‐2 inhibitors | 1 1 1 1 1 1 Total: 4 (6) |
Canagliflozin 100 mg: 483 Canagliflozin 300 mg: 485 Dapagliflozin 2.5‐10 mg: 406 Empagliflozin 25 mg: 769 Ertugliflozin 5 mg: 448 Ertugliflozin 15 mg: 441 Total: 3032 |
Glimepiride: 484 (Glimepiride: 484) Glipizide: 408 Glimepiride: 780 Glimepiride: 437 (Glimepiride: 437) Total: 2109 |
| Glinides | 1 1 1 Total: 3 (3) |
Nateglinide 180‐360 mg: 124 Nateglinide 180‐540 mg: 133 Nateglinide 180‐540 mg: 219 Total: 476 |
Glibenclamide: 124 Gliclazide: 129 Glyburide: 209 Total: 462 |
| Metformin monotherapy | 1 1 1 Total:3 (3) |
Metformin ≥1500 mg: 104 Metformin 1500‐2000 mg: 122 Metformin 1000‐3000 mg: 67 Total: 293 |
(Glimepiride: 317) (Glimepiride: 244) (Glimepiride: 66) (Total: 627) |
aTotal number of unique included trials was 32 with 41 trial arms. bNumbers of randomised participants for metformin combination therapy do not add up correctly because several trials had one intervention with several comparator groups, the intervention group may therefore appear in several drug classes and is characterised by parentheses; combination therapy data for metformin monotherapy are shown for illustrative purposes.
DPP4‐I: dipeptidyl‐peptidase 4; GLP‐1: glucagon‐like peptide‐1 agonist; SGLT‐2: sodium‐glucose transport 2
We provided information about potentially relevant ongoing trials in the Characteristics of ongoing studies table and in Appendix 7 'Matrix of trial outcome (publications and trial endpoints)'.
We emailed all authors of included trials to enquire whether they were willing to answer questions regarding their trials. We presented the results of this survey in Appendix 15 'Survey of trial investigators providing information on studies'. We sought relevant missing information on the trial from the primary author(s) of the article, if possible.
Dealing with duplicate and companion publications
In the event of duplicate publications, companion documents or multiple reports of a primary trial, we maximised the information yield by collating all available data and used the most complete dataset aggregated across all known publications. We listed duplicate publications, companion documents, multiple reports of a primary trial and trial documents of included trials (such as trial registry information) as secondary references under the study identifier (ID) of the included trial. Furthermore, we also listed duplicate publications, companion documents, multiple reports of a trial and trial documents of excluded trials (such as trial registry information) as secondary references under the study ID of the excluded trial.
Data from clinical trial registers
In case data of included trials were available as study results in clinical trials registers such as ClinicalTrials.gov, we made full use of this information and extracted the data. If there was also a full publication of the trial, we collated and critically appraised all available data. If a trial fulfilled the inclusion criteria and was marked as a completed study in the clinical trials register but no additional information was available, we added this trial to the table of 'Studies awaiting classification'.
Assessment of risk of bias in included studies
Two review authors (KM and PK, LK or FG) independently assessed the risk of bias of each included trial. We resolved disagreements by consensus, or by consultation with an additional review author (BH). In cases of disagreement, we consulted the remainder of the review author team and made a judgement based on consensus. If adequate information was not available from the publications, trial protocols, or other sources, we contacted the trial authors for more detail to request missing data on 'Risk of bias' items.
We used the Cochrane 'Risk of bias' assessment tool (Higgins 2011a; Higgins 2017) assigning assessments of low, high, or unclear risk of bias (for details, see Appendix 2; Appendix 3). We evaluated individual bias items as described in the Cochrane Handbook for Systematic Reviews of Interventions, according to the criteria and associated categorisations contained therein (Higgins 2017).
Summary assessment of risk of bias
We presented a 'Risk of bias' graph and a 'Risk of bias' summary figure.
We distinguished between self‐reported, investigator‐assessed and adjudicated outcome measures.
We considered the following outcomes as self‐reported.
Health‐related quality of life
Non‐serious adverse events
Hypoglycaemia
Weight
We considered the following outcomes as investigator‐assessed.
All‐cause mortality
Serious adverse events
Cardiovascular mortality
Non‐fatal myocardial infarction
Heart failure
Non‐fatal stroke
Amputation of lower extremity
Blindness or severe vision loss
End‐stage renal disease
Hypoglycaemia
Socio‐economic effects
Weight
HbA1c
Risk of bias for a trial across outcomes Some risk of bias domains, such as selection bias (sequence generation and allocation sequence concealment), affected the risk of bias across all outcome measures in a trial. In case of high risk of selection bias, we marked all outcomes investigated in the associated trial as high risk. Otherwise, we did not perform a summary assessment of the risk of bias across all outcomes for a trial.
Risk of bias for an outcome within a trial and across domains We assessed the risk of bias for an outcome measure by including all entries relevant to that outcome (i.e. both trial‐level entries and outcome‐specific entries). We considered low risk of bias to denote a low risk of bias for all key domains, unclear risk to denote an unclear risk of bias for one or more key domains and high risk to denote a high risk of bias for one or more key domains.
Risk of bias for an outcome across trials and across domains These were our main summary assessments that we incorporated into our judgements about the certainty of the evidence in Table 1. We defined outcomes as at low risk of bias when most information came from trials at low risk of bias, unclear risk when most information came from trials at low or unclear risk of bias, and high risk when a sufficient proportion of information came from trials at high risk of bias.
Measures of treatment effect
When at least two trials were available for a comparison of a given outcome, we expressed dichotomous data as risk ratio (RR) or an odds ratio (OR) with 95% confidence interval (CI). For continuous outcomes measured on the same scale (e.g. weight loss in kg) we estimated the intervention effect using the mean difference (MD) with 95% CI. For continuous outcomes measuring the same underlying concept (e.g. health‐related quality of life) but applying different measurement scales, we calculated the standardised mean difference (SMD). We planned to calculate time‐to‐event data as hazard ratio (HR) with 95% CI with the generic inverse variance method.
The scales measuring health‐related quality of life could go in different directions. Some scales increase in values with improved health‐related quality of life, whereas other scales decrease in values with improved health‐related quality of life. To adjust for the different directions of the scales, we planned to multiply the scales that reported better health‐related quality of life with decreasing values by ‐1.
Unit of analysis issues
We took into account the level at which randomisation occurred, for example in cross‐over trials, cluster‐randomised trials and multiple observations for the same outcome. If more than one comparison from the same trial was eligible for inclusion in the same meta‐analysis, we either combined groups to create a single pair‐wise comparison or we appropriately reduced the sample size so that the same participants did not contribute multiply (splitting the 'shared' group into two or more groups). Although the latter approach offers some solution for adjusting the precision of the comparison, it does not account for correlation arising from inclusion of the same set of participants in multiple comparisons (Higgins 2011b).
We planned to re‐analyse cluster‐RCTs that did not appropriately adjust for potential clustering of participants within clusters in their analyses. Variance of the intervention effects was planned to be inflated by a design effect (DEFF). Calculation of a DEFF involves estimation of an intra‐cluster correlation (ICC). We planned to obtain estimates of ICCs by contacting trial authors, or by imputing ICC values using either estimates from other included trials that reported ICCs or external estimates from empirical research (e.g. Bell 2013). We planned to examine the impact of clustering by performing sensitivity analyses.
Dealing with missing data
We tried to obtain missing data from trial authors and carefully evaluate important numerical data such as screened, randomly‐assigned participants as well as intention‐to‐treat (ITT), and as‐treated and per‐protocol populations. We investigated attrition rates (e.g. dropouts, losses to follow‐up, withdrawals), and we critically appraised issues concerning missing data and imputation methods (e.g. last observation carried forward (LOCF)).
In trials where the standard deviation of the outcome was not available at follow‐up or could not be recreated, we standardised by the average of the pooled baseline standard deviation (SD) from those trials in which this information was reported.
When included trials did not report means and SDs for outcomes and we did not receive the necessary information from trial authors, we imputed these values by estimating the mean and variance from the median, range, and the size of the sample (Hozo 2005).
We planned to investigate the impact of imputation on meta‐analyses by performing sensitivity analyses.
Assessment of heterogeneity
In the event of substantial clinical or methodological heterogeneity, we planned not to report trial results as the pooled effect estimate in a meta‐analysis.
We identified heterogeneity (inconsistency) by visually inspecting the forest plots and by using a standard Chi² test with a significance level of α = 0.1 (Deeks 2017). In view of the low power of this test, we also considered the I² statistic, which quantifies inconsistency across trials to assess the impact of heterogeneity on the meta‐analysis (Higgins 2002; Higgins 2003); an I² statistic of 75% or more indicates a considerable level of heterogeneity (Higgins 2011b).
When heterogeneity was present, we attempted to determine possible reasons for it by examining individual trial and subgroup characteristics.
Assessment of reporting biases
If we included 10 or more trials investigating a particular outcome, we planned to use funnel plots to assess small‐trial effects. Several explanations may account for funnel plot asymmetry, including true heterogeneity of effect with respect to trial size, poor methodological design (and hence bias of small trials) and publication bias (Sterne 2017). Therefore, we planned to interpret the results carefully (Sterne 2011).
Data synthesis
We undertook meta‐analysis only if we judged participants, interventions, comparisons and outcomes to be sufficiently similar to ensure an answer that was clinically meaningful. Unless good evidence showed homogeneous effects across trials, we primarily summarised data at low risk of bias using a random‐effects model (Wood 2008). We interpreted random‐effects meta‐analyses with consideration to the whole distribution of effects, ideally by presenting a prediction interval (Higgins 2009). A prediction interval specifies a predicted range for the true treatment effect in an individual trial (Riley 2011). In addition, we performed statistical analyses according to the statistical guidelines presented in the Cochrane Handbook for Systematic Reviews of Interventions (Deeks 2017).
Trial sequential analyses
In a single trial, sparse data and interim analyses increase the risk of type I and type II errors. To avoid type I errors, group sequential monitoring boundaries are applied to decide whether a trial could be terminated early because of a sufficiently small P value, that is the cumulative Z‐curve crosses the monitoring boundaries (Lan 1983). Likewise, before reaching the planned sample size of a trial, the trial may be stopped due to futility if the cumulative Z‐score crosses the futility monitoring boundaries (Higgins 2011b). Sequential monitoring boundaries for benefit, harm, or futility can be applied to meta‐analyses as well, called trial sequential monitoring boundaries (Higgins 2011; Wetterslev 2008). In a trial sequential analysis (TSA), the addition of each trial in a cumulative meta‐analysis is regarded as an interim meta‐analysis and helps to clarify if significance is reached or futility is reached or whether additional trials are needed (Wetterslev 2008).
TSA combines a calculation of the diversity‐adjusted required information size (cumulated meta‐analysis sample size to detect or reject a specific relative intervention effect) for meta‐analysis with the threshold of data associated with statistics (Pogue 1997; Wetterslev 2008).
The idea in TSA is that if the cumulative Z‐curve crosses the boundary for benefit or harm before a diversity‐adjusted required information size is reached, a sufficient level of evidence for the anticipated intervention effect has been reached with the assumed type I error and no further trials may be needed. If the cumulative Z‐curve crosses the boundary for futility before a diversity‐adjusted required information size is reached, the assumed intervention effect can be rejected with the assumed type II error and no further trials may be needed. If the Z‐curve does not cross any boundary, then there is insufficient evidence to reach a conclusion. To construct the trial sequential monitoring boundaries, the required information size is needed and is calculated as the least number of participants needed in a well‐powered single trial and subsequently adjusted for diversity among the included trials in the meta‐analysis (Wetterslev 2008). We applied TSA as it decreases the risk of type I and II errors due to sparse data and multiple updating in a cumulative meta‐analysis, and it provides us with important information in order to estimate the risks of imprecision when the required information size is not reached. Additionally, TSA provides important information regarding the need for additional trials and the required information size of such trials (Wetterslev 2008).
We applied trial sequential monitoring boundaries according to an estimated clinical important effect. We based the required information size on an a priori effect corresponding to a 10% relative risk reduction (RRR).
We performed TSA for continuous outcomes with mean differences, by using the trials applying the same scale to calculate the required sample size. For the continuous outcomes we tested the evidence for the achieved differences in the cumulative meta‐analyses.
For the heterogeneity adjustment of the required information size we used the diversity (D²) estimated in the meta‐analyses of included trials.
We performed TSA on primary and secondary outcomes.
Subgroup analysis and investigation of heterogeneity
We expected the following characteristics to introduce clinical heterogeneity and carried out the following subgroup analyses (on our primary and secondary outcomes) including investigation of interactions (Altman 2003).
Trials with a long duration (≥ 2 years) versus trials with a short duration (< 2 years).
Trials including obese participants versus trials including non‐obese participants.
Sensitivity analysis
We performed sensitivity analyses on our primary and secondary outcomes to explore the influence of the following factors (when applicable) on effect sizes, by restricting the analysis to the following.
Published trials
Effect of risk of bias, as specified in the Assessment of risk of bias in included studies section
Very long or large trials, to establish the extent to which they dominate the results
Use of the following filters: diagnostic criteria, imputation, language of publication, source of funding (industry versus other), or country
We also tested the robustness of results by repeating analyses using different measures of effect size (i.e. RR, OR, etc.) and different statistical models (fixed‐effect and random‐effects models).
Certainty of the evidence
We presented the overall certainty of the evidence for each outcome specified below, according to the GRADE approach, which takes into account issues relating not only to internal validity (risk of bias, inconsistency, imprecision, publication bias) but also to external validity, such as directness of results. Two review authors (KM and PK, LK or FG) independently rated the certainty of the evidence for each outcome.
We included an appendix titled 'Checklist to aid consistency and reproducibility of GRADE assessments' to help with the standardisation of the 'Summary of findings' tables (Meader 2014). Alternatively, we would have used the GRADEpro Guideline Development Tool (GDT) software and presented evidence profile tables as an appendix (GRADEproGDT 2015). We presented results for outcomes as described in the Types of outcome measures section. If meta‐analysis was not possible, we presented the results in a narrative format in the 'Summary of findings' table. We justified all decisions to downgrade the certainty of the evidence using footnotes, and we made comments to aid the reader's understanding of the Cochrane Review when necessary.
'Summary of findings' table
We presented a summary of the evidence in Table 1. This provides key information about the best estimate of the magnitude of effect, in relative terms and as absolute differences for each relevant comparison of alternative management strategies, numbers of participants and trials addressing each important outcome, and rates the overall confidence in effect estimates for each outcome. We created the 'Summary of findings' table using the methods described in the Cochrane Handbook for Systematic Reviews of Interventions (Schünemann 2017), along with Review Manager 5 (RevMan 5) table editor (Review Manager 2014). We reported the following outcomes, listed according to priority.
All‐cause mortality
Cardiovascular mortality
Serious adverse events
Non‐fatal stroke
Non‐fatal myocardial infarction
Microvascular complications (end‐stage renal disease, blindness or severe vision loss, amputation of lower extremity)
Health‐related quality of life
Results
Description of studies
For a detailed description of trials, see Table 2, Table 3, 'Characteristics of included studies', 'Characteristics of excluded studies, and 'Characteristics of ongoing studies'.
Results of the search
Our databases search identified 2754 records to be screened. We excluded most of the records on the basis of their titles and abstracts because they clearly did not meet the inclusion criteria. We assessed a total of 296 full‐text articles/records for eligibility. After screening, 32 trials with 41 trial arms, published in 164 publications/records finally met our inclusion criteria.
Handsearching of systematic reviews and reference lists identified two trials described in seven publications (Gerich 2005; Ristic 2007). Handsearching of manufacturers' websites identified eight records.
We excluded a total of 118 full‐text articles/records, 80 of these publications/records described 62 trials and 38 of these publications/records did not describe trials. We identified nine ongoing trials described in 11 publications/records (see 'Ongoing studies'). We identified two trials awaiting assessment (see 'Characteristics of studies awaiting classification'). For an overview of trial selection, please see Figure 1.
1.
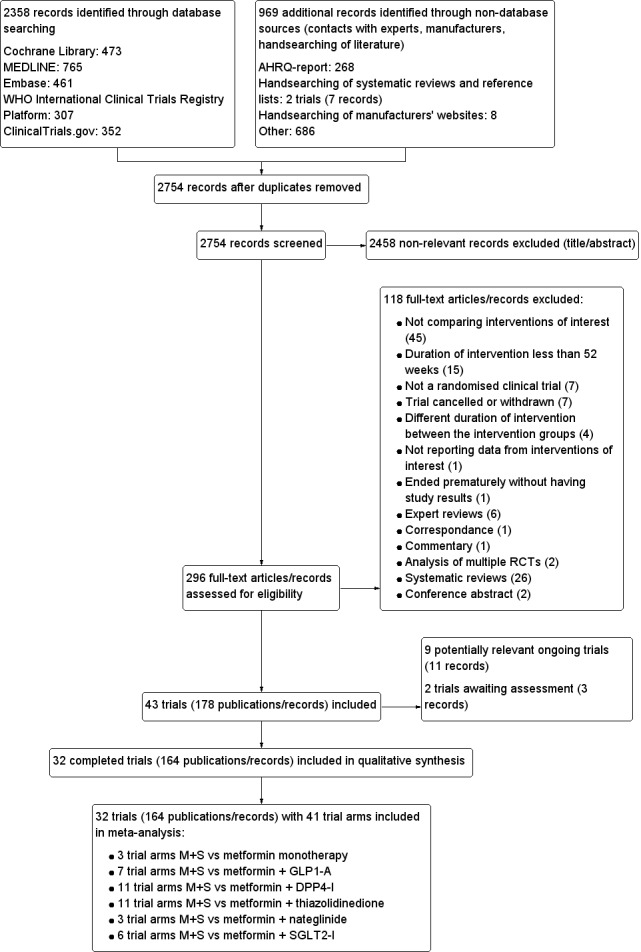
Trial flow diagram AHRQ: Agency for Healthcare Research and Quality; DPP4‐I: dipeptidyl‐peptidase 4 inhibitor; GLP1‐A: glucagon‐like peptide 1 analogue; M+S: metformin + sulphonylurea; SGLT2‐I: sodium‐glucose co‐transporter 2 inhibitor
Included studies
A detailed description of the characteristics of included trials is presented elsewhere (see Characteristics of included studies and Appendix 4; Appendix 5; Appendix 6; Appendix 7; Appendix 8; Appendix 9; Appendix 10; Appendix 11; Appendix 12; Appendix 13; Appendix 14). The following is a succinct overview.
Source of data
Twenty‐six trials reported data with relevance for this review, published in medical journals (Charbonnel 2005; Del Prato 2014; Del Prato 2015; Derosa 2005; Derosa 2009b; Derosa 2010; Derosa 2011a; Derosa 2011b; Filozof 2010; Gallwitz 2012a; Gallwitz 2012b; Gerich 2005; Göke 2013; Hamann 2008; Handelsman 2017; Hollander 2017; Leiter 2015; Maffioli 2013; Matthews 2010; Nauck 2013; Petrica 2009; Petrica 2011; Ridderstråle 2014; Schernthaner 2015; Seck 2010; Vaccaro 2017).
Fourteen trials reported data in trials registers (Ahrén 2014; Del Prato 2014; Del Prato 2015; Gallwitz 2012a; Gallwitz 2012b; Göke 2013; Handelsman 2017; Home 2009; Leiter 2015; Nauck 2013; NCT00367055; Ridderstråle 2014; Schernthaner 2015; Seck 2010).
Six trials reported data on the manufacturer's website (Ahrén 2014; Gerich 2005; Hamann 2008; Matthews 2010; NCT00367055; Ristic 2007).
We contacted all trial authors or investigators by email (see Appendix 15). When important information was lacking on ongoing studies and excluded trials, we contacted investigators for clarification (see Appendix 15). We only received additional data on four included trials through correspondence with authors (Dei Cas 2017; Derosa 2005; Home 2009; Vaccaro 2017).
Comparisons
One trial compared M+S with metformin monotherapy (Derosa 2009a). Two trials compared M+S with metformin plus placebo (Ahrén 2014; Nauck 2013). Five trials compared M+S with metformin plus a GLP‐1 analogue (Ahrén 2014; Derosa 2010; Derosa 2011a; Gallwitz 2012a; Nauck 2013). Nine trials compared M+S with metformin plus a DPP‐4 inhibitor (Ahrén 2014; Dei Cas 2017; Del Prato 2014; Filozof 2010; Gallwitz 2012b; Göke 2013; Matthews 2010; Schernthaner 2015; Seck 2010). One trial compared M+S with metformin plus long‐acting DPP‐4 inhibitor (Handelsman 2017). Eleven trials compared M+S with metformin plus a thiazolidinedione (Charbonnel 2005; Derosa 2005; Derosa 2009a; Derosa 2011b; Hamann 2008; Home 2009; Maffioli 2013; NCT00367055; Petrica 2009; Petrica 2011; Vaccaro 2017). Three trials compared M+S with metformin plus a glinide (Derosa 2009b; Gerich 2005; Ristic 2007). Four trials compared M+S with metformin plus a SGLT‐2 inhibitor (Del Prato 2015; Hollander 2017; Leiter 2015; Ridderstråle 2014).
Several trials implemented more than two comparison groups within their trial designs. For an overview of trials, trial arms, comparators, interventions and number of randomised participants see Table 3.
Overview of trial populations
All, but seven trials provided information on sample size calculations (Derosa 2009b; Derosa 2010; Gerich 2005; NCT00367055; Petrica 2009; Petrica 2011; Seck 2010). All, but 10 trials reported the total number of participants screened (Derosa 2005; Derosa 2009a; Derosa 2009b; Derosa 2010; Derosa 2011a; Derosa 2011b; Filozof 2010; Maffioli 2013; NCT00367055; Ristic 2007). A total of 12,863 participants were randomised to M+S and 15,833 participants were randomised to a comparator. The percentage of participants finishing the trial was approximately 69% in the M+S group and 69% in the comparator groups. Number of randomised participants ranged from 22 to 1556 in the M+S groups and from 22 to 1765 in the comparator groups (Table 2).
Trial design
All of the 32 trials were randomised controlled trials with a parallel design. In 15 trials the primary trial structure had a non‐inferiority design (Ahrén 2014; Del Prato 2014; Del Prato 2015; Filozof 2010; Gallwitz 2012a; Gallwitz 2012b; Göke 2013; Hamann 2008; Handelsman 2017; Hollander 2017; Home 2009; Leiter 2015; Matthews 2010; Ridderstråle 2014; Seck 2010).
Two trials had both a placebo group and an active comparator group (Ahrén 2014; Nauck 2013), the rest of the included trials had an active comparator group. Two trials were single‐centre trials (Dei Cas 2017; Maffioli 2013). Two trials did not report number of centres (Petrica 2009; Petrica 2011). The remaining trials were multicentre trials, defined as two or more centres. Seven trials were open‐labelled for participants and personnel (Dei Cas 2017; Gallwitz 2012a; Home 2009; NCT00367055; Petrica 2009; Petrica 2011; Vaccaro 2017). Two trials were single‐blind for investigators but not for the participants (Derosa 2010; Derosa 2011a). The remaining trials were double‐blinded for investigators and participants. Three trials did not report blinding of outcome assessors for any outcome (Dei Cas 2017; Gallwitz 2012a; NCT00367055). The remaining trials reported blinding of outcome assessors for one or more outcomes. Trials were performed between the years 2001 to 2017. The duration of the intervention ranged from 52 weeks to 208 weeks. Twenty trials had a run‐in period (Ahrén 2014; Del Prato 2014; Del Prato 2015; Derosa 2005; Derosa 2009b; Derosa 2010; Filozof 2010; Gallwitz 2012a; Gerich 2005; Göke 2013; Hamann 2008; Handelsman 2017; Hollander 2017; Home 2009; Leiter 2015; Maffioli 2013; Nauck 2013; Ridderstråle 2014; Schernthaner 2015; Seck 2010). The remaining trials did not report any run‐in period. Two trials were terminated early (Matthews 2010; Vaccaro 2017). Matthews 2010 had a higher than expected discontinuation rate and fewer participants than expected reached the primary endpoint. Vaccaro 2017 had a lower than expected rate of primary endpoint events during follow‐up.
Eleven trials had an extended follow‐up period (Ahrén 2014; Charbonnel 2005; Del Prato 2015; Göke 2013; Hollander 2017; Home 2009; Leiter 2015; Nauck 2013; Ridderstråle 2014; Ristic 2007; Seck 2010). With the exception of Ristic 2007 all had high attrition rates between the original time of follow‐up and the extended follow‐up. Four trials reported that they were able to keep the double‐blinding conditions (Del Prato 2015; Göke 2013; Leiter 2015; Ristic 2007).
Settings
All trials were conducted in outpatient clinics.
Participants
All the trials included people with T2DM and with HbA1c ranging from 7% to 9% (Dei Cas 2017; Hollander 2017; Home 2009; Schernthaner 2015; Vaccaro 2017); 7% to 9.5% (Leiter 2015); 6.5% to 10% (Del Prato 2015; Gallwitz 2012b; Göke 2013; Seck 2010); 7% to 10% (Ahrén 2014; Del Prato 2014; Hamann 2008; Ridderstråle 2014); 7% to 11% (Gerich 2005; Nauck 2013); 6.8% to 9% (Ristic 2007); 7.5% to 11% (Charbonnel 2005; Filozof 2010); 6.5% to 8.5% (Matthews 2010; NCT00367055); 6.5% to 9% (Gallwitz 2012a; Handelsman 2017); more than 6.5% (Derosa 2009a); more than 7% (Derosa 2005; Derosa 2009b; Derosa 2011b; Petrica 2009; Petrica 2011) and more than 8% (Derosa 2010; Derosa 2011a; Maffioli 2013).
One trial did not report the duration of T2DM at baseline (Derosa 2009a). For the rest of the trials the mean duration of T2DM ranged from newly diagnosed to more than 10 years.
All trials included both genders. The percentage of women ranged from 29% to 65%.
The mean age of the participants ranged from 52 years to 73 years. One trial only included participants aged 65 years and more (Schernthaner 2015).
Mean HbA1c at baseline ranged from 7.3% to 9.3%.
Ten trials did not report any comorbidities, cointerventions or comedications (Ahrén 2014; Del Prato 2014; Filozof 2010; Gerich 2005; Handelsman 2017; Hollander 2017; Home 2009; Nauck 2013; NCT00367055; Ristic 2007).
Major exclusion criteria were type 1 diabetes mellitus or secondary forms of diabetes, diabetic complications (nephropathy, retinopathy, neuropathy), history of ketoacidosis, organ failure (renal, hepatic, heart), history of pancreatitis, new cardiovascular event or pregnancy.
Diagnosis
Five trials applied the diagnostic criteria of T2DM as defined by the European Association for the Study of Diabetes (EASD) 2007 guideline (Derosa 2009a; Derosa 2010; Derosa 2011a; Derosa 2011b; Maffioli 2013), four trials used the definition of the World Health Organization (WHO) 1999/2006 criteria (Gallwitz 2012a; Hamann 2008; Home 2009; NCT00367055), two trials used the American Diabetes Association (ADA) 2001 criteria (Derosa 2005; Derosa 2009b), one trial applied the ADA 1997 criteria (Dei Cas 2017), and one trial applied the ADA 2017 criteria (Hollander 2017). The remaining trials did not report diagnostic criteria for T2DM.
Interventions
Metformin was administered in all intervention and comparator arms and was mostly given in doses of 500 mg/day to 3000 mg/day (Appendix 4).
Second‐generation sulphonylurea was administered either as glibenclamide, in doses of 5 mg/day to 15 mg/day (Dei Cas 2017; Derosa 2009b; Derosa 2010; Derosa 2011b; Gerich 2005; Maffioli 2013); gliclazide, in doses of 30 to 320 mg/day (Charbonnel 2005; Filozof 2010; NCT00367055; Ristic 2007); or glipizide, in doses of 5 to 20 mg/day (Del Prato 2014; Del Prato 2015; Göke 2013; Seck 2010). Third‐generation sulphonylurea was administered as glimepiride, in doses of 1 mg/day to 8 mg/day (Ahrén 2014; Derosa 2005; Derosa 2009a; Derosa 2011a; Gallwitz 2012a; Gallwitz 2012b; Handelsman 2017; Hollander 2017; Home 2009; Leiter 2015; Matthews 2010; Nauck 2013; Petrica 2009; Petrica 2011; Ridderstråle 2014; Schernthaner 2015). Two trials administered more than one kind of sulphonylurea, that is, glibenclamide or gliclazide (Hamann 2008), or glibenclamide, gliclazide or glimepiride (Vaccaro 2017).
GLP‐1 analogues were administered as albiglutide, in doses of 30 mg to 50 mg once weekly (Ahrén 2014); exenatide, in doses of 10 μg/day to 20 μg/day (Derosa 2010; Derosa 2011a; Gallwitz 2012a); or liraglutide, in doses of 0.6 mg/day to 1.8 mg/day (Nauck 2013).
DPP‐4 inhibitors were administered as either sitagliptin, in doses of 100 mg/day (Ahrén 2014; Seck 2010); vildagliptin (in doses of 100 mg/day (Dei Cas 2017; Filozof 2010; Matthews 2010); alogliptin, in doses of 12.5 mg/day to 25 mg/day (Del Prato 2014); linagliptin (in doses of 5 mg/day (Gallwitz 2012b); or saxagliptin, in doses of 5 mg/day (Göke 2013; Schernthaner 2015).
Thiazolidinediones were administered as either rosiglitazone, in doses of 4 mg/day to 8 mg/day (Derosa 2005; Hamann 2008; Home 2009; NCT00367055; Petrica 2009); or pioglitazone, in doses of 15 mg/day to 45 mg/day (Derosa 2011b; Maffioli 2013; Vaccaro 2017).
Glinides were administered as nateglinide, in doses of 180 mg/day to 540 mg/day (Derosa 2009b; Gerich 2005; Ristic 2007).
SGLT‐2 inhibitors were administered as either dapagliflozin, in doses of 2.5 mg/day to 10 mg/day (Del Prato 2015); canagliflozin, in doses of 100 mg/day to 300 mg/day (Leiter 2015); empagliflozin, in doses of 25 mg/day (Ridderstråle 2014); or ertugliflozin, in doses of 5 mg/day to 15 mg/day (Hollander 2017).
Long‐acting DPP‐4 inhibitors were administered as omarigliptin, in doses of 25 mg/week (Handelsman 2017).
Two trials compared M+S with metformin plus placebo (Ahrén 2014; Nauck 2013).
Twelve trials reported counselling for diet and exercise (Del Prato 2015; Derosa 2005; Derosa 2009a; Derosa 2009b; Derosa 2010; Derosa 2011a; Derosa 2011b; Göke 2013; Maffioli 2013; Ridderstråle 2014; Schernthaner 2015; Seck 2010). One trial counselled on diet only (Charbonnel 2005). The remaining trials did not provide information about counselling.
Outcomes
Six trials did not define a primary outcome (Derosa 2009a; Derosa 2009b; Derosa 2010; Maffioli 2013; Petrica 2009; Petrica 2011). None of these trials was registered in ClinicalTrials.gov or had a design paper published.
Twenty trials were registered at ClinicalTrials.gov (Ahrén 2014; Dei Cas 2017; Del Prato 2014; Del Prato 2015; Filozof 2010; Gallwitz 2012a; Gallwitz 2012b; Göke 2013; Hamann 2008; Handelsman 2017; Hollander 2017; Home 2009; Leiter 2015; Matthews 2010; Nauck 2013; NCT00367055; Ridderstråle 2014; Schernthaner 2015; Seck 2010; Vaccaro 2017).
Most trials used HbA1c as the primary outcome measure.
We included 32 trials. All the included trials but eight reported one or more of the primary outcomes of relevance for this review (Derosa 2009a; Derosa 2009b; Derosa 2010; Derosa 2011a; Derosa 2011b; Maffioli 2013; Petrica 2009; Petrica 2011). All the included trials but nine reported on all‐cause mortality (Dei Cas 2017; Derosa 2009a; Derosa 2009b; Derosa 2010; Derosa 2011a; Derosa 2011b; Maffioli 2013; Petrica 2009; Petrica 2011). All the included trials but nine reported on serious adverse events and non‐serious adverse events (Derosa 2009a; Derosa 2009b; Derosa 2010; Derosa 2011a; Derosa 2011b; Maffioli 2013; Petrica 2009; Petrica 2011; Ristic 2007), see Appendix 11. Three trials only reported adverse events leading to discontinuation (Derosa 2009a; Derosa 2010; Maffioli 2013). In three trials, the authors provided safety‐data without the number of participants included in the safety‐analysis (Derosa 2009b; Derosa 2011a; Derosa 2011b). One trial reported on adverse events for up to six months and 6 to 12 months separately (Ristic 2007).
One trial reported on health‐related quality of life (Nauck 2013). This trial measured the outcome 'impact of weight on quality of life' (IWQOL). Authors did not report results per intervention groups.
Four trials reported on 'amputation of lower extremity' (Dei Cas 2017; Derosa 2005; Hollander 2017; Vaccaro 2017). Three trials reported on 'end‐stage renal disease' (Nauck 2013; Dei Cas 2017; Derosa 2005). Two trials reported on 'blindness or severe vision loss' (Dei Cas 2017; Derosa 2005).
Three trials reported cost effectiveness data (Del Prato 2014; Del Prato 2015; Göke 2013).
For definitions of outcomes see Appendix 9 and Appendix 10.
Excluded studies
We excluded 118 publications/records after full‐text evaluation (see Characteristics of excluded studies) mainly for the following reasons. The trial did not compare interventions of interest (N = 45). Two of these trials investigated an investigational drug (EUCTR2004‐002549‐11‐FI (tesaglitazar); NCT01481116 (fasiglifam)) and one trial investigated a drug no longer approved for use (Rubin 2008 (muraglitazar)). Other reasons for exclusion included: duration of intervention less than 52 weeks (N = 15), not an RCT (N = 7), trial cancelled or withdrawn (N = 7) and different duration of the intervention between the intervention groups (N = 4). One trial compared interventions of interest (metformin compared with M+S), but the trial only reported on metformin compared with usual care (Cryer 2005). We contacted the trial authors to request data, but did not receive a reply. One trial ended prematurely and had no study results (EUCTR2009‐014727‐23‐IT). Six publications were expert reviews (Albarran 2013; Fleming 2015; Nishio 2015; Odawara 2015; Scheen 2016; Seufert 2014), one was a correspondence (Kannan 2015), one was a commentary on a systematic review (Bellary 2011) and two were analysing pooled data from multiple RCTs (Reid 2016; Rosenstock 2015). We identified 26 systematic reviews (Amate 2015; Aylsworth 2014; Belsey 2008; Chan 2015; Dai 2014; Foroutan 2016; Geng 2015; Goring 2014; Gu 2015; Guthrie 2015; Hershon 2016; Hou 2015; Kuecker 2016; Lim 2015; Liu 2014; Maruthur 2016; Mearns 2015; Mishriky 2015; Monami 2008; Phung 2010; Phung 2014; Rosenstock 2013; Varvaki 2016; Whalen 2015; Zhou 2015; Zintzaras 2014), and one conference abstract (Alvares 2015). This publication is listed in Additional references.
Risk of bias in included studies
For details on the risk of bias of the included trials see Characteristics of included studies. For an overview of review authors' judgements about each risk of bias item for individual trials and across all trials see Figure 2 and Figure 3.
2.
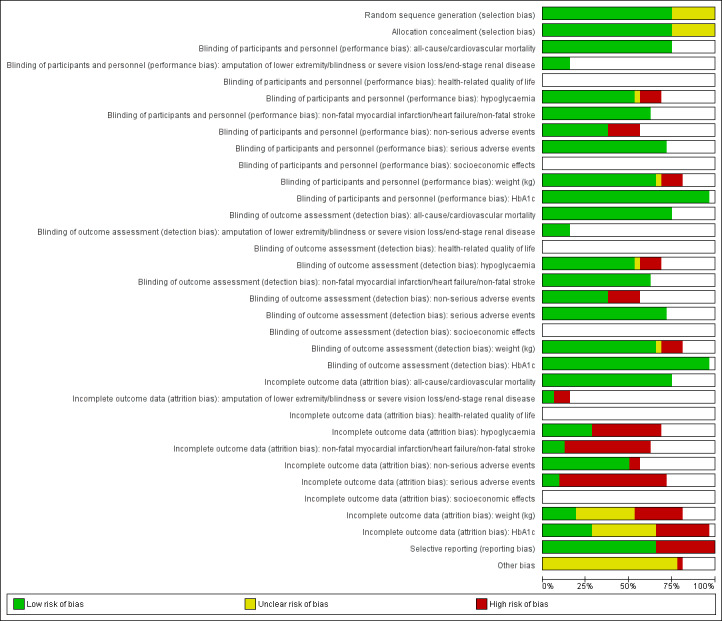
'Risk of bias' graph: review authors' judgements about each 'Risk of bias' item presented as percentages across all included trials (blank cells indicate that the particular outcome was not measured in some trials).
3.
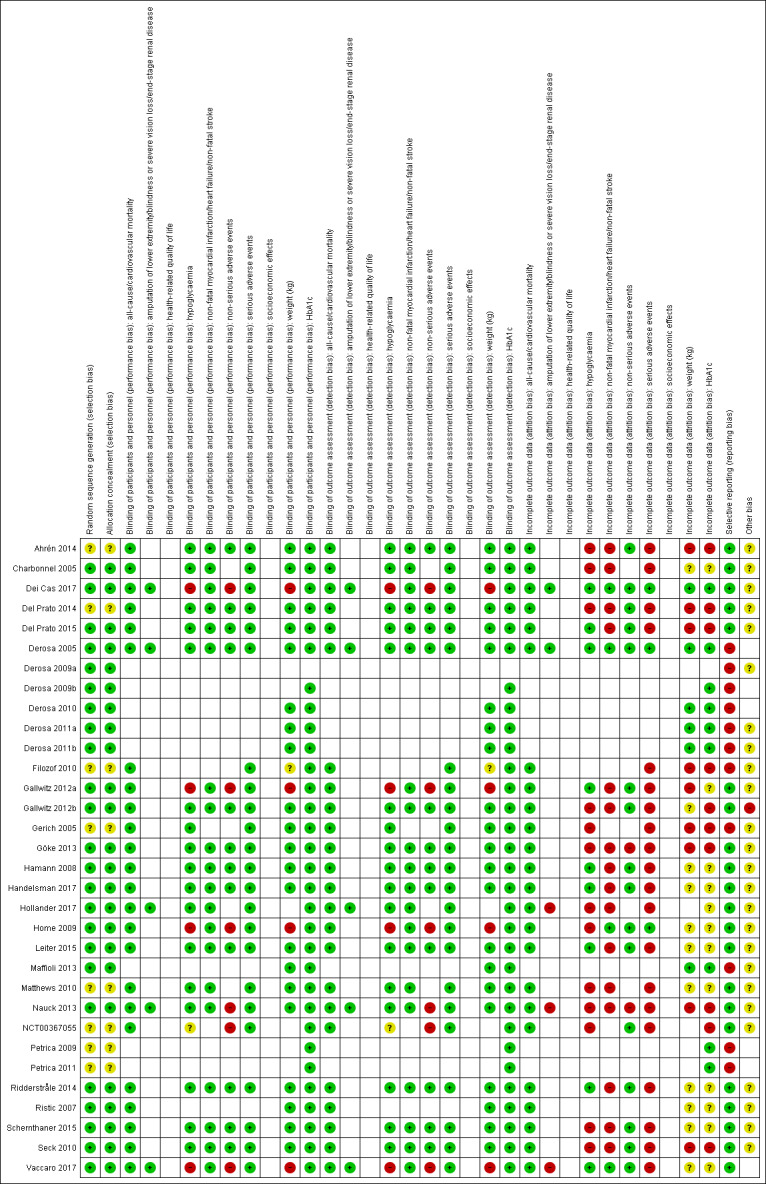
'Risk of bias' summary: review authors' judgements about each 'Risk of bias' item for each included trial ((blank cells indicate that the particular outcome was not measured in some trials)
Allocation
We judged 24 trials at low risk of selection bias regarding the method of randomisation and allocation concealment (Charbonnel 2005; Dei Cas 2017; Del Prato 2015; Derosa 2005; Derosa 2009a; Derosa 2009b; Derosa 2010; Derosa 2011a; Derosa 2011b; Gallwitz 2012a; Gallwitz 2012b; Göke 2013; Hamann 2008; Handelsman 2017; Hollander 2017; Home 2009; Leiter 2015; Maffioli 2013; Nauck 2013; Ridderstråle 2014; Ristic 2007; Schernthaner 2015; Seck 2010; Vaccaro 2017). The remaining trials only reported that the participants were randomised but did not provide any further description (Ahrén 2014; Del Prato 2014; Filozof 2010; Gerich 2005; Matthews 2010; NCT00367055; Petrica 2009; Petrica 2011). Therefore, we judged these trials at unclear risk of bias regarding randomisation and allocation concealment.
We evaluated trial baseline data for our predefined prognostic baseline variables. None of the included trials reported data on all our key prognostic variables. However, all trials reported some variables of interest. None of the trials reporting prognostic variables showed important differences between the intervention groups.
Blinding
Blinding of participants and investigators for all outcomes was adequate in 21 trials (Ahrén 2014; Charbonnel 2005; Del Prato 2014; Del Prato 2015; Derosa 2005; Derosa 2009b; Derosa 2011b; Gallwitz 2012b; Gerich 2005; Göke 2013; Hamann 2008; Handelsman 2017; Hollander 2017; Leiter 2015; Maffioli 2013; Matthews 2010; Nauck 2013; Ridderstråle 2014; Ristic 2007; Schernthaner 2015; Seck 2010). Trials ensured blinding of participants and investigators by using identical placebo tablets or injections. Seven trials were open‐label (Dei Cas 2017; Gallwitz 2012a; Home 2009; NCT00367055; Petrica 2009; Petrica 2011; Vaccaro 2017). Two trials were single‐blinded (Derosa 2010; Derosa 2011a).
In one trial the participants and investigators were blinded in the first 26 weeks of the intervention period followed by a 78‐week open‐label extension phase (Nauck 2013).
Eight trials described a blinded outcome committee evaluating cardiovascular and cerebrovascular events (Ahrén 2014; Del Prato 2014; Filozof 2010; Gallwitz 2012b; Home 2009; Matthews 2010; Ridderstråle 2014; Vaccaro 2017).
Where measured, all primary outcomes of this review were investigator‐assessed and we judged these at low risk of performance and detection bias. The trials reporting blood glucose measurements were all performed by the investigators and we judged these outcomes measures at low risk of performance and detection bias. Overall, the risk of performance bias and detection bias was low or unclear for our secondary outcomes.
Incomplete outcome data
All trials reported the complete number of participants randomised and finishing the trial. Two trials adequately addressed incomplete data for all outcomes (Dei Cas 2017; Derosa 2005). We judged the following outcomes to be at unclear or high risk of attrition bias in one or more trials: amputation of lower extremity, blindness or severe vision loss, end‐stage renal disease (Hollander 2017; Nauck 2013; Vaccaro 2017); hypoglycaemia (Ahrén 2014; Charbonnel 2005; Del Prato 2014; Gallwitz 2012b; Gerich 2005; Göke 2013; Hollander 2017; Home 2009; Matthews 2010; Nauck 2013; NCT00367055; Schernthaner 2015; Seck 2010); non‐fatal myocardial infarction, heart failure, non‐fatal stroke (Ahrén 2014; Charbonnel 2005; Del Prato 2014; Del Prato 2015; Gallwitz 2012a; Gallwitz 2012b; Göke 2013; Hamann 2008; Handelsman 2017; Hollander 2017; Leiter 2015; Matthews 2010; Nauck 2013; Ridderstråle 2014; Schernthaner 2015; Seck 2010); non‐serious adverse events (Filozof 2010; Göke 2013; Nauck 2013); serious adverse events (Ahrén 2014; Charbonnel 2005; Del Prato 2014; Del Prato 2015; Filozof 2010; Gallwitz 2012a; Gallwitz 2012b; Gerich 2005; Göke 2013; Hamann 2008; Handelsman 2017; Hollander 2017; Leiter 2015; Matthews 2010; Nauck 2013; NCT00367055; Ridderstråle 2014; Schernthaner 2015; Seck 2010; Vaccaro 2017); weight (Ahrén 2014; Charbonnel 2005; Del Prato 2014; Del Prato 2015; Filozof 2010; Gallwitz 2012a; Gallwitz 2012b; Gerich 2005; Göke 2013; Hamann 2008; Handelsman 2017; Home 2009; Leiter 2015; Matthews 2010; Nauck 2013; NCT00367055; Ridderstråle 2014; Ristic 2007; Schernthaner 2015; Seck 2010; Vaccaro 2017) and HbA1c (Ahrén 2014; Charbonnel 2005; Del Prato 2014; Del Prato 2015; Filozof 2010; Gallwitz 2012a; Gallwitz 2012b; Gerich 2005; Göke 2013; Hamann 2008; Handelsman 2017; Hollander 2017; Home 2009; Leiter 2015; Matthews 2010; Nauck 2013; NCT00367055; Ridderstråle 2014; Ristic 2007; Schernthaner 2015; Seck 2010; Vaccaro 2017).
The reasons for a high risk of attrition bias for dichotomous outcomes were: high dropout rate; dropout rate not balanced between intervention groups; reason for dropout not balanced between intervention groups; no information on imputation method; missing data imputed with 'last observation carried forward' technique; proportion of missing outcomes compared with the observed event risk was substantial enough to result in potentially clinically relevant bias for the intervention effect estimate.
The reasons for an unclear or high risk of attrition bias for continuous outcomes were: high dropout rate; dropout rate not balanced between intervention groups; reason for dropout not balanced between intervention groups; no information on imputation method; missing data imputed with 'last observation carried forward' technique; only participants with a value at baseline and at a specified visit were analysed; only participants who completed the study (excluding participants receiving rescue therapy) were included in the analysis; analyses based on per protocol population; and substantial amount of missing outcomes to potentially result in clinically relevant bias for the observed effect size.
Selective reporting
Twenty‐two of the included trials had a published protocol (Ahrén 2014; Dei Cas 2017; Del Prato 2014; Del Prato 2015; Filozof 2010; Gallwitz 2012a; Gallwitz 2012b; Gerich 2005; Göke 2013; Hamann 2008; Handelsman 2017; Hollander 2017; Home 2009; Leiter 2015; Matthews 2010; Nauck 2013; NCT00367055; Ridderstråle 2014; Ristic 2007; Schernthaner 2015; Seck 2010; Vaccaro 2017).
We judged 11 of the included trials at high risk of reporting bias for one or more of our outcomes (Derosa 2005; Derosa 2009a; Derosa 2009b; Derosa 2010; Derosa 2011a; Derosa 2011b; Filozof 2010; Gerich 2005; Maffioli 2013; Petrica 2009; Petrica 2011). For more details, see Appendix 8.
We judged nine trials as at high risk of selective outcome reporting regarding one or more of the primary outcomes with relevance to this review (Derosa 2005; Derosa 2009a; Derosa 2009b; Derosa 2010; Derosa 2011a; Derosa 2011b; Maffioli 2013; Petrica 2009; Petrica 2011); we judged 10 trials as high risk of selective outcome reporting regarding one or more of the secondary outcomes with relevance to this review (Derosa 2005; Derosa 2009a; Derosa 2009b; Derosa 2010; Derosa 2011a; Derosa 2011b; Gerich 2005; Maffioli 2013; Petrica 2009; Petrica 2011).
We judged two trials as high risk of selective outcome reporting regarding one or more of the additional explorative outcomes of relevance to this review (Derosa 2009a; Filozof 2010).
Other potential sources of bias
Twenty‐two trials received support or funding from a pharmaceutical company (Ahrén 2014; Charbonnel 2005; Dei Cas 2017; Del Prato 2014; Del Prato 2015; Filozof 2010; Gallwitz 2012a; Gallwitz 2012b; Gerich 2005; Göke 2013; Hamann 2008; Handelsman 2017; Hollander 2017; Home 2009; Leiter 2015; Matthews 2010; Nauck 2013; NCT00367055; Ridderstråle 2014; Ristic 2007; Schernthaner 2015; Seck 2010). For some comparisons, the same author had performed similar trials (Derosa 2005; Derosa 2009a; Derosa 2010; Derosa 2011a; Derosa 2011b; Maffioli 2013).
Effects of interventions
See: Table 1
See Table 1 for details on the most important comparisons of this review (M+S compared with metformin plus GLP‐1 analogue, metformin plus DPP‐4 inhibitor, metformin plus thiazolidinedione, metformin plus glinide and metformin plus SGLt‐2 inhibitor).
Baseline characteristics
For details on baseline characteristics, see Appendix 5 and Appendix 6.
Metformin‐sulfonylurea combination therapy versus metformin plus insulin
We identified no trials comparing M+S with metformin plus insulin.
Metformin‐sulfonylurea combination therapy versus metformin monotherapy
One trial compared M+S combination therapy with metformin monotherapy (Derosa 2009a). The intervention group received metformin in doses of 850 mg/day and glimepiride in doses of 2 mg/day to 6 mg/day. The comparator group received metformin in doses of 1000 mg/day to 3000 mg/day.
Primary outcomes
The included trial did not report on all‐cause mortality, health‐related quality of life or serious adverse events.
Secondary outcomes
The included trial did not report on cardiovascular mortality, non‐fatal myocardial infarction, heart failure, non‐fatal stroke, amputation of lower extremity, blindness or severe vision loss, end‐stage renal disease, non‐serious adverse events, hypoglycaemia or socioeconomic effects.
Additional explorative outcomes
Weight
The included trial did not report on weight.
HbA1c
The included trial reported final HbA1c measurements of 7.8% (SD 0.4) and 7.9% (SD 0.5) in the M+S group compared with the metformin monotherapy, respectively. They did not report the number of participants included in the analysis.
Metformin‐sulfonylurea combination therapy versus metformin plus placebo
Two trials compared M+S combination therapy with metformin plus placebo (Ahrén 2014; Nauck 2013). Both trials administered glimepiride, given in doses of 1 mg/day to 4 mg/day; and metformin in doses of ≥ 1500 mg/day. Both trials had multiple intervention arms with glimepiride, GLP‐1 analogue, DPP‐4 inhibitor or placebo in combination with metformin (Ahrén 2014), as well as glimepiride, GLP‐1 analogue or placebo in combination with metformin (Nauck 2013). For details of the certainty of the evidence see Appendix 16.
Primary outcomes
All‐cause mortality
Both included trials reported data on all‐cause mortality (low‐certainty evidence because of serious imprecision; Analysis 1.1). One trial reported 6 deaths out of 307 participants (2%) and 1 death out of 101 participants (1%) in the M+S combination group compared with the metformin plus placebo group, respectively (Ahrén 2014). However, the number of deaths was unclear due to varied reporting. We contacted the trial authors for clarification but did not receive a reply. To be sure to account for all deaths, we extracted data from the publication that reported the highest number. One trial reported data after an 18‐month, open‐label extension: there were no deaths in 242 participants and no deaths in 121 participants in the M+S combination group compared with the metformin plus placebo group, respectively (Nauck 2013).
1.1. Analysis.
Comparison 1 Metformin plus sulphonylurea vs metformin plus placebo, Outcome 1 All‐cause mortality.
Health‐related quality of life
None of the included trials reported on this outcome.
Serious adverse effects
Both included trials reported that a total of 84 participants experienced a serious adverse event; in the M+S group 60/549 (10.9%) participants had a serious adverse event compared with 24/222 (10.8%) participants in the metformin plus placebo group (RR 0.97, 95% CI 0.59 to 1.61; P = 0.91; 2 trials; 771 participants; very low‐certainty evidence because of attrition bias and serious imprecision; Analysis 1.2). One trial reported data after an 18‐month, open‐label extension phase (Nauck 2013).
1.2. Analysis.
Comparison 1 Metformin plus sulphonylurea vs metformin plus placebo, Outcome 2 Serious adverse events.
TSA showed that 2.45% of the diversity‐adjusted required information size to detect or reject a 10% relative risk reduction (RRR) had been accrued. Diversity was 21%. As only a minor fraction of the diversity‐adjusted required information size to detect or reject a 10% RRR had been accrued, we could not calculate the TSA‐adjusted 95% CI.
Secondary outcomes
Cardiovascular mortality
Both included trials reported data on cardiovascular mortality (low‐certainty evidence because of serious imprecision; Analysis 1.3). One trial reported 1 cardiovascular death in 307 (0.3%) participants in the M+S group compared with 1 cardiovascular death in 101 (1%) participants in the metformin plus placebo group (Ahrén 2014). One trial reported that no participants died in either intervention group after an 18‐month, open‐label extension phase (Nauck 2013).
1.3. Analysis.
Comparison 1 Metformin plus sulphonylurea vs metformin plus placebo, Outcome 3 Cardiovascular mortality.
Non‐fatal myocardial infarction
Both included trials reported that a total of three participants experienced a non‐fatal myocardial infarction; in the M+S group 2/549 (0.4%) participants had a myocardial infarction compared with 1/222 (0.5%) participants in the metformin plus placebo group (RR 0.63, 95% CI 0.08 to 5.10; P = 0.67; 2 trials; 771 participants; very low‐certainty evidence because of attrition bias and serious imprecision; Analysis 1.4). One trial reported data after an 18‐month, open‐label extension phase (Nauck 2013).
1.4. Analysis.
Comparison 1 Metformin plus sulphonylurea vs metformin plus placebo, Outcome 4 Non‐fatal myocardial infarction.
TSA showed that 0.13% of the diversity‐adjusted required information size to detect or reject a 10% RRR had been accrued. Diversity was zero. As only a minor fraction of the diversity‐adjusted required information size to detect or reject a 10% RRR had been accrued, we could not calculate the TSA‐adjusted 95% CI.
Heart failure
Both included trials reported data on heart failure (Analysis 1.5). One trial reported one heart failure in 307 participants (0.3%) and no heart failure in 101 participants in the M+S group compared with the metformin plus placebo group, respectively (Ahrén 2014). One trial reported that no participants experienced a heart failure in either intervention group after an 18‐month, open‐label extension phase (Nauck 2013).
1.5. Analysis.
Comparison 1 Metformin plus sulphonylurea vs metformin plus placebo, Outcome 5 Heart failure.
Non‐fatal stroke, amputation of lower extremity, blindness or severe vision loss
None of the included trials reported on this outcome.
End‐stage renal disease
One trial reported that no participants had end‐stage renal disease in either intervention group after an 18‐month, open‐label extension phase (very low‐certainty evidence because of attrition bias and serious imprecision; Nauck 2013).
Non‐serious adverse events
Both included trials reported that a total of 505 participants experienced a non‐serious adverse event: in the M+S group 386/549 (70.3%) participants had a non‐serious adverse event compared with 119/222 (53.6%) participants in the metformin plus placebo group (random RR 1.25, 95% CI 0.96 to 1.64; P = 0.10; fixed RR 1.24, 95% CI 1.10 to 1.41; P < 0.001; 2 trials; 771 participants; Analysis 1.6). None of the trials provided a detailed definition of the outcome. One trial reported data after an 18‐month, open‐label extension phase (Nauck 2013).
1.6. Analysis.
Comparison 1 Metformin plus sulphonylurea vs metformin plus placebo, Outcome 6 Non‐serious adverse events.
TSA showed that 5.8% of the diversity‐adjusted required information size to detect or reject a 10% RRR had been accrued. Diversity was 78%. The TSA‐adjusted 95% CI was 0.47 to 3.32.
Hypoglycaemia
Both included trials reported that a total of 181 participants experienced a mild or moderate hypoglycaemic episode; in the M+S group there were 160/549 (29.1%) participants with hypoglycaemic episodes compared with 21/222 (9.5%) participants in the metformin plus placebo group (random RR 3.93, 95% CI 0.71 to 21.88; P = 0.12; fixed RR 2.87, 95% CI 1.90 to 4.34; P < 0.001; 2 trials; 771 participants; Analysis 1.7 in favour of metformin plus placebo). Ahrén 2014 defined mild or moderate hypoglycaemia by blood glucose levels 3.9 mmol/L or lower and Nauck 2013 used blood glucose values 3.1 mmol/L or lower. One trial reported data after an 18‐month, open‐label extension phase (Nauck 2013).
1.7. Analysis.
Comparison 1 Metformin plus sulphonylurea vs metformin plus placebo, Outcome 7 Mild/moderate hypoglycaemia.
TSA showed that 0.18% of the diversity‐adjusted required information size to detect or reject a 10% RRR had been accrued. Diversity was 93%. As only a minor fraction of the diversity‐adjusted required information size to detect or reject a 10% RRR had been accrued, we could not calculate the TSA‐adjusted 95% CI.
Both included trials reported data on serious hypoglycaemia (Analysis 1.8). One trial reported one participant with serious hypoglycaemia out of 307 participants (0.3%) and no participants with serious hypoglycaemia out of 101 participants in the M+S group compared with the metformin plus placebo group, respectively (Ahrén 2014). One trial reported that no participants had serious hypoglycaemia in either intervention group after an 18‐month, open‐label extension phase (Nauck 2013).
1.8. Analysis.
Comparison 1 Metformin plus sulphonylurea vs metformin plus placebo, Outcome 8 Serious hypoglycaemia.
Socioeconomic effects
None of the included trials reported on this outcome.
Additional explorative outcomes
Weight
Both included trials reported weight change in favour of metformin plus placebo (mean difference (MD) 3.4 kg, 95% CI 1.4 to 5.4; P = 0.001; 2 trials; 476 participants; Analysis 1.9). Nauck 2013 reported data after an 18‐month, open‐label extension phase.
1.9. Analysis.
Comparison 1 Metformin plus sulphonylurea vs metformin plus placebo, Outcome 9 Weight change.
HbA1c
Both included trials reported change in HbA1c in favour of M+S (random MD −0.5%, 95% CI −1.1 to 0.1; P = 0.13; fixed MD −0.6%, 95% CI −0.8 to −0.4; P < 0.001; 2 trials; 472 participants; Analysis 1.10). One trial reported data after an 18‐month, open‐label extension phase (Nauck 2013).
1.10. Analysis.
Comparison 1 Metformin plus sulphonylurea vs metformin plus placebo, Outcome 10 Change in HbA1c.
Metformin‐sulfonylurea combination therapy versus metformin plus GLP‐1 analogue
Five trials compared M+S with metformin plus a GLP‐1 analogue (Ahrén 2014; Derosa 2010; Derosa 2011a; Gallwitz 2012a; Nauck 2013). Four trials administered glimepiride in doses of 2 mg/day to 6 mg/day (Ahrén 2014; Derosa 2011a; Gallwitz 2012a; Nauck 2013), and one trial administered glibenclamide in doses of 15 mg/day (Derosa 2010). Three trials administered exenatide in doses of 10 μg/day to 20 μg/day (Derosa 2010; Derosa 2011a; Gallwitz 2012a), one trial administered albiglutide in doses of 30 mg/week to 50 mg/week (Ahrén 2014), and one trial administered liraglutide in doses of 0.6 mg/day to 1.8 mg/day (Nauck 2013). Metformin was given in doses of 1000 mg/day to 1500 mg/day or more.
Primary outcomes
All‐cause mortality
Three trials reported that a total of 22 participants died: in the M+S group 11/1057 participants (1.0%) died compared with 11/1537 participants (0.7%) in the metformin plus GLP‐1 analogue group (RR 1.15, 95% CI 0.49 to 2.67; P = 0.75; 3 trials; 2594 participants; low‐certainty evidence; Analysis 2.1). Calculation of the 95% prediction interval did not provide a meaningful estimate. One trial reported data after an 18‐month, open‐label extension phase (Nauck 2013).
2.1. Analysis.
Comparison 2 Metformin plus sulphonylurea vs metformin plus GLP‐1 analogue, Outcome 1 All‐cause mortality.
Derosa 2011a reported that no participants died but did not provide the number of participants included in the analysis.
Because all trials were published in English, we could not perform sensitivity analyses according to publication status or language of publication. Sensitivity analysis restricted to trials with low risk of selection bias did not change the direction of the effect estimate (RR 0.93, 95% CI 0.30 to 2.93; P = 0.91; 2 trials; 1985 participants). We could not perform sensitivity analysis excluding large trials because none of the included trials for this comparison had more than 1000 participants randomised to each intervention group. We could not perform sensitivity analysis excluding trials funded by a pharmaceutical company since all trials received funding from a pharmaceutical company.
TSA showed that 0.61% of the diversity‐adjusted information size had been accrued to detect or reject a 10% RRR. Diversity was zero. As only a minor fraction of the diversity‐adjusted required information size to detect or reject a 10% RRR had been accrued, we could not calculate the TSA‐adjusted 95% CI.
Health‐related quality of life
We did not identify trials with data on health‐related quality of life for this comparison. One trial reported on 'impact of weight on quality of life' (IWQOL; Nauck 2013). They reported the result separately for each intervention group.
Serious adverse effects
Three trials reported that a total of 322 participants experienced a serious adverse event: in the M+S group 128/1057 participants (12.1%) had a serious adverse event compared with 194/1537 participants (12.6%) in the metformin plus GLP‐1 analogue group (RR 0.90, 95% CI 0.73 to 1.11; P = 0.32; 3 trials; 2594 participants; very low‐certainty evidence; Analysis 2.2). The 95% prediction interval ranged between 0.23 and 3.51. One of the trials reported data after an 18‐month, open‐label extension (Nauck 2013). Derosa 2011a reported that no participants experienced serious adverse events but did not provide the number of participants included in the analysis.
2.2. Analysis.
Comparison 2 Metformin plus sulphonylurea vs metformin plus GLP‐1 analogue, Outcome 2 Serious adverse events.
Because all trials were published in English, we could not perform sensitivity analyses according to publication status or language of publication. Sensitivity analysis according to trials with low risk of selection bias and duration of intervention (excluding trials with duration of intervention longer than 104 weeks) contained the same two trials (Gallwitz 2012a; Nauck 2013). The effect estimate did not change substantially (RR 0.94, 95% CI 0.73 to 1.20; P = 0.60; 2 trials; 1985 participants). We could not perform sensitivity analysis excluding large trials because no trials had more than 1000 participants randomised to each intervention group. We could not perform sensitivity analysis excluding trials funded by a pharmaceutical company because all trials received funding from a pharmaceutical company.
TSA showed that 12.4% of the diversity‐adjusted information size had been accrued to detect or reject a 10% RRR. Diversity was zero. The TSA‐adjusted 95% CI was 0.38 to 2.15.
Secondary outcomes
Cardiovascular mortality
Three trials reported on cardiovascular disease (Ahrén 2014; Derosa 2011a; Nauck 2013). Derosa 2011a reported that no participants died due to cardiovascular disease but did not provide the number of participants included in the analysis. Nauck 2013 reported that no participants died due to cardiovascular disease in any of the intervention groups referring to the 18‐month, open‐label extension phase.
Ahrén 2014 reported that in the M+S group 1/307 (0.3%) participants died of cardiovascular disease compared with 1/302 (0.3%) participants in the metformin plus GLP‐1 analogue group (Analysis 2.3; low‐certainty evidence).
2.3. Analysis.
Comparison 2 Metformin plus sulphonylurea vs metformin plus GLP‐1 analogue, Outcome 3 Cardiovascular mortality.
Non‐fatal myocardial infarction
Two trials reported that a total of eight participants experienced a non‐fatal myocardial infarction: in the M+S group 2/549 (0.4%) participants had a non‐fatal myocardial infarction compared with 6/1026 (0.6%) participants in the metformin plus GLP‐1 analogue group (RR 0.57, 95% CI 0.12 to 2.82; P = 0.49; 2 trials; 1575 participants; very low‐certainty evidence; Analysis 2.4).
2.4. Analysis.
Comparison 2 Metformin plus sulphonylurea vs metformin plus GLP‐1 analogue, Outcome 4 Non‐fatal myocardial infarction.
Nauck 2013 reported data after an 18‐month, open‐label extension phase. Derosa 2011a reported that no participants experienced a non‐fatal myocardial infarction but did not provide the number of participants included in the analysis.
We could not perform sensitivity analyses due to lack of data.
TSA showed that 0.4% of the diversity‐adjusted information size had been accrued to detect or reject a 10% RRR. Diversity was zero. As only a minor fraction of the diversity‐adjusted required information size to detect or reject a 10% RRR had been accrued, we could not calculate the TSA‐adjusted 95% CI.
Heart failure
Four trials reported that a total of five participants developed heart failure: in the M+S group 1/1057 (0.1%) participants developed heart failure compared with 4/1537 (0.3%) participants in the metformin plus GLP‐1 analogue group (RR 0.54, 95% CI 0.10 to 2.77; P = 0.46; 3 trials; 2594 participants; Analysis 2.5). Calculation of the 95% prediction interval did not provide a meaningful estimate.
2.5. Analysis.
Comparison 2 Metformin plus sulphonylurea vs metformin plus GLP‐1 analogue, Outcome 5 Heart failure.
Nauck 2013 reported data after an 18‐month, open‐label extension phase. Derosa 2011a reported that no participants developed heart failure but did not provide the number of participants included in the analysis.
Because all trials were published in English, we could not perform sensitivity analyses according to publication status or language of publication. Sensitivity analysis restricted to trials with low risk of selection bias and duration of intervention (excluding trials with duration of intervention more than 104 weeks) contained the same two trials (Gallwitz 2012a; Nauck 2013). The effect estimate did not change substantially (RR 0.58, 95% CI 0.06 to 5.54; P = 0.63; 2 trials; 1985 participants). We could not perform sensitivity analysis excluding large trials because no trials had more than 1000 participants randomised to each intervention group. We could not perform sensitivity analysis excluding trials funded by a pharmaceutical company because all trials received funding from a pharmaceutical company.
TSA showed that 0.26% of the diversity‐adjusted information size had been accrued to detect or reject a 10% RRR. Diversity was zero. As only a minor fraction of the diversity‐adjusted required information size to detect or reject a 10% RRR had been accrued, we could not calculate the TSA‐adjusted 95% CI.
Non‐fatal stroke
Derosa 2011a reported that no participants experienced a stroke during the intervention period but did not provide the number of participants included in the analysis.
Amputation of lower extremity
Derosa 2011a reported that no participants had amputation of lower extremity during the intervention period but did not provide the number of participants included in the analysis.
Blindness or severe vision loss
Derosa 2011a reported that no participants had blindness or severe vision loss during the intervention period but did not provide the number of participants included in the analysis.
End‐stage renal disease
One trial provided data on end‐stage renal disease, however only after the 18‐month, open‐label extension phase (Nauck 2013). In the M+S group no participants out of 242 participants had end‐stage renal disease compared with 1 participant out of 724 (0.1%) participants in the metformin plus GLP‐1 analogue group (Analysis 2.6).
2.6. Analysis.
Comparison 2 Metformin plus sulphonylurea vs metformin plus GLP‐1 analogue, Outcome 6 End‐stage renal disease.
Derosa 2011a reported that no participants had end‐stage renal disease during the intervention period but did not provide the number of participants included in the analysis.
Non‐serious adverse events
Three trials reported that a total of 1621 participants experienced a non‐serious adverse event: in the M+S group 634/1057 (60.0%) participants had a non‐serious adverse event compared with 987/1537 (64.2%) participants in the metformin plus GLP‐1 analogue group (Analysis 2.7). Due to substantial heterogeneity, aggregating the trials in a meta‐analysis was not appropriate. With regard to the M+S groups, the trial with most of the non‐serious adverse events had two placebo interventions (GLP‐1 analogue as subcutaneous injection and placebo DPP‐4 inhibitor as tablet) in addition to M+S (Ahrén 2014).
2.7. Analysis.
Comparison 2 Metformin plus sulphonylurea vs metformin plus GLP‐1 analogue, Outcome 7 Non‐serious adverse events.
One trial was open‐label and did not apply placebo (Gallwitz 2012a), and one trial (Nauck 2013), reported data after an 18‐month, open‐label extension. With regard to the metformin plus GLP‐1 analogue treatment arms, each trial used a different GLP‐1 analogue: one administered albiglutide (Ahrén 2014), and one administered exenatide (Gallwitz 2012a), or liraglutide (Nauck 2013).
Derosa 2011a reported that no participants experienced non‐serious adverse events but did not provide the number of participants included in the analysis.
Because all trials were published in English, we could not perform sensitivity analyses according to publication status or language of publication. Sensitivity analyses restricted to trials with low risk of selection bias and duration of intervention (excluding trials with duration of intervention longer than 104 weeks) contained the same two trials (Gallwitz 2012a; Nauck 2013). The effect estimate was in favour of M+S combination therapy (RR 0.84, 95% CI 0.76 to 0.92; P = 0.0001; 2 trials; 1985 participants). We could not perform sensitivity analysis excluding large trials because no trials had more than 1000 participants randomised to each intervention group. We could not perform sensitivity analysis excluding trials funded by a pharmaceutical company because all trials received funding from a pharmaceutical company.
Hypoglycaemia
Three trials reported that a total of 569 participants experienced a mild or moderate hypoglycaemic episode: in the M+S group 400/1057 (37.8%) participants had a hypoglycaemic episode compared with 169/1537 (11.0%) participants in the metformin plus GLP‐1 analogue group (RR 3.24, 95% CI 2.05 to 5.13; P < 0.001; 3 trials; 2594 participants; Analysis 2.8; in favour of metformin plus GLP‐1 analogue). Calculation of the 95% prediction interval did not provide a meaningful estimate. The trial with mostly mild or moderate hypoglycaemic events defined hypoglycaemia as any sign or symptom of hypoglycaemia or blood glucose 3.9 mmol/L or less (Gallwitz 2012a), whereas the other trials defined hypoglycaemia as symptoms of hypoglycaemia plus blood glucose values 3.9 mmol/L or less, or blood glucose values 3.9 mmol/L or less without symptoms (Ahrén 2014), or symptoms of hypoglycaemia or blood glucose values 3.1 mmol/L or less (Nauck 2013). Nauck 2013 reported data after an 18‐month, open‐label extension phase.
2.8. Analysis.
Comparison 2 Metformin plus sulphonylurea vs metformin plus GLP‐1 analogue, Outcome 8 Mild/moderate hypoglycaemia.
Derosa 2011a reported two events of mild or moderate hypoglycaemia in the glimepiride group and one in the exenatide group but did not provide the number of participants included in the analysis.
Because all trials were published in English, we could not perform sensitivity analyses according to publication status or language of publication. Sensitivity analyses restricted to trials with low risk of selection bias and duration of intervention (excluding trials with duration of intervention longer than 104 weeks) contained the same two trials (Gallwitz 2012a; Nauck 2013). We could not perform sensitivity analysis excluding large trials because no trials had more than 1000 participants randomised to each intervention group. We could not perform sensitivity analysis excluding trials funded by a pharmaceutical company because all trials received funding from a pharmaceutical company.
Only three participants reported serious hypoglycaemia: in the M+S group 1/1057 (0.1%) participants had a serious hypoglycaemic event compared with 2/1537 (0.1%) participants in the metformin plus GLP‐1 analogue group (RR 1.00, 95% CI 0.16 to 6.30; P = 1.00; 3 trials; 2594 participants; Analysis 2.9).
2.9. Analysis.
Comparison 2 Metformin plus sulphonylurea vs metformin plus GLP‐1 analogue, Outcome 9 Serious hypoglycaemia.
Nauck 2013 reported data after an 18‐month, open‐label extension phase. Derosa 2011a reported that no event of serious hypoglycaemia was observed but did not provide the number of participants included in the analysis.
Because all trials were published in English, we could not perform sensitivity analyses according to publication status or language of publication. Sensitivity analyses restricted to trials with low risk of selection bias and duration of intervention (excluding trials with duration of intervention longer than 104 weeks) contained the same two trials (Gallwitz 2012a; Nauck 2013). The effect estimate did not change substantially (RR 0.58, 95% CI 0.06 to 5.54; P = 0.63; 2 trials; 1985 participants). We could not perform sensitivity analysis excluding large trials because no trial had more than 1000 participants randomised to each intervention group. We could not perform sensitivity analysis excluding trials funded by a pharmaceutical company because all trials received funding from a pharmaceutical company.
TSA for severe hypoglycaemia showed that 0.09% of the diversity‐adjusted information size had been accrued to detect or reject a 10% RRR. Diversity was zero. As only a minor fraction of the diversity‐adjusted required information size to detect or reject a 10% RRR had been accrued, we could not calculate the TSA‐adjusted 95% CI.
Socioeconomic effects
We did not identify trials with data on socioeconomic effects for this comparison.
Additional explorative outcomes
Weight
Five trials reported weight change in favour of metformin plus GLP‐1 analogue (MD 5.5 kg, 95% CI 3.6 to 7.5; P < 0.001; 5 trials; 1777 participants; Analysis 2.10). Calculation of the 95% prediction interval did not provide a meaningful estimate. Heterogeneity in the findings could have been caused by the various durations of follow‐up, ranging from 52 weeks to 156 weeks, and various doses of glimepiride ranging from 1 mg/day to 6 mg/day. Hollander 2017 did not report the number of participants included in the analysis.
2.10. Analysis.
Comparison 2 Metformin plus sulphonylurea vs metformin plus GLP‐1 analogue, Outcome 10 Weight (change).
Nauck 2013 reported data after an 18‐month, open‐label extension phase.
HbA1c
Five trials reported change in HbA1c (MD 0.01%, 95% CI ‐0.2 to 0.2; P = 0.91; 5 trials; 2346 participants; Analysis 2.11). The 95% prediction interval ranged between 0% and 1.0%.
2.11. Analysis.
Comparison 2 Metformin plus sulphonylurea vs metformin plus GLP‐1 analogue, Outcome 11 Change in HbA1c.
Nauck 2013 reported data after an 18‐month, open‐label extension phase. Trials with 52 weeks of treatment reported at greater decrease in Hba1c with sulphonylurea treatment, whereas trials with 104 weeks of treatment or more reported a greater decrease in HbA1c with GLP‐1 analogue treatment.
TSA showed that 0.61% of the diversity‐adjusted information size had been accrued to detect or reject a 10% RRR. Diversity was 91%. As only a minor fraction of the diversity‐adjusted required information size to detect or reject a 10% RRR had been accrued, we could not calculate the TSA‐adjusted 95% CI.
Metformin‐sulfonylurea combination therapy versus metformin plus DPP‐4 inhibitor
Nine trials compared M+S combination therapy with metformin plus a DPP‐4 inhibitor (Ahrén 2014; Dei Cas 2017; Del Prato 2014; Filozof 2010; Gallwitz 2012b; Göke 2013; Matthews 2010; Schernthaner 2015; Seck 2010). Four trials administered glimepiride in doses of 1 mg/day to 6 mg/day (Ahrén 2014; Gallwitz 2012b; Matthews 2010; Schernthaner 2015), three trials administered glipizide in doses of 5 mg/day to 20 mg/day (Del Prato 2014; Göke 2013; Seck 2010), one trial administered glibenclamide in doses of 10 mg/day (Dei Cas 2017), and one trial administered gliclazide in doses of 80 mg/day to 320 mg/day (Filozof 2010). Three trials administered vildagliptin in doses of 100 mg/day (Dei Cas 2017; Filozof 2010; Matthews 2010), two trials administered sitagliptin in doses of 100 mg/day (Ahrén 2014; Seck 2010), two trials administered saxagliptin in doses of 5 mg/day ( Göke 2013; Schernthaner 2015), one trial administered alogliptin (in doses of 12.5 mg/day to 25 mg/day (Del Prato 2014), and one trial administered linagliptin in doses of 5 mg/day (Gallwitz 2012b). One trial administered metformin at any dose (Schernthaner 2015), the remaining trials administered metformin in doses of 1500 mg/day or more.
Primary outcomes
All‐cause mortality
Nine trials reported that a total of 59 participants died: in the M+S group 33 participants died out of 5387 (0.6%) participants, compared with 26 deaths in 6307 (0.4%) participants in the metformin plus DPP‐4 inhibitor group (RR 1.32, 95% CI 0.76 to 2.28; P = 0.32; 9 trials; 11,694 participants; low‐certainty evidence; Analysis 3.1). The 95% prediction interval ranged between 0.68 and 2.55.
3.1. Analysis.
Comparison 3 Metformin plus sulphonylurea vs metformin plus DPP‐4 inhibitor, Outcome 1 All‐cause mortality.
A test for subgroup differences according to duration of follow‐up did not indicate interaction (P = 0.77).
Because all trials were published in English, we could not perform sensitivity analyses according to publication status or language of publication. Sensitivity analysis restricted to trials with low risk of selection bias did not substantially change the effect estimate (RR 1.29, 95% CI 0.41 to 4.10; P = 0.66; 5 trials; 4363 participants). Sensitivity analysis excluding large trials did not substantially change the effect estimate (RR 1.52, 95% CI 0.81 to 2.88; P = 0.19; 8 trials; 8595 participants). We could not perform sensitivity analysis excluding trials funded by a pharmaceutical company because all trials had received funding from a pharmaceutical company.
TSA showed that 2.4% of the diversity‐adjusted information size had been accrued to detect or reject a 10% RRR. Diversity was zero. As only a minor fraction of the diversity‐adjusted required information size to detect or reject a 10% RRR had been accrued, we could not calculate the TSA‐adjusted 95% CI.
Health‐related quality of life
We did not identify trials reporting data on health‐related quality of life for this comparison.
Serious adverse effects
Nine trials reported that a total of 1514 participants experienced a serious adverse event: in the M+S group 735/5387 (13.6%) participants had a serious adverse event compared with 779/6307 (12.4%) participants in the metformin plus DPP‐4 inhibitor group (RR 1.07, 95% CI 0.97 to 1.18; P = 0.17; 9 trials; 11,694 participants; very low‐certainty evidence; Analysis 3.2). The 95% prediction interval ranged between 0.95 and 1.20.
3.2. Analysis.
Comparison 3 Metformin plus sulphonylurea vs metformin plus DPP‐4 inhibitor, Outcome 2 Serious adverse events.
A test for subgroup differences according to duration of follow‐up did not indicate interaction (P = 0.82).
Because all trials were published in English, we could not perform sensitivity analyses according to publication status or language of publication. Sensitivity analysis restricted to only trials with low risk of selection bias did not substantially change the effect estimate (RR 1.09, 95% CI 0.93 to 1.28; P = 0.27; 5 trials; 4363 participants). Sensitivity analysis excluding large trials did not substantially change the effect estimate (RR 1.06, 95% CI 0.94 to 1.20; P = 0.33; 8 trials; 8595 participants). We could not perform sensitivity analysis excluding trials funded by a pharmaceutical company because all trials received funding from a pharmaceutical company.
TSA showed that 61% of the diversity‐adjusted required information size to detect or reject a 10% RRR had been accrued. Diversity was zero. The TSA‐adjusted 95% CI was 0.93 to 1.23.
Secondary outcomes
Cardiovascular mortality
Six trials reported that a total of 20 participants died due to cardiovascular disease: in the M+S group 11 participants died out of 2989 (0.4%) participants compared with 9 out of 3885 (0.2%) participants in the metformin plus DPP‐4 inhibitor group (RR 1.54, 95% CI 0.63 to 3.79; P = 0.34; 6 trials; 6874 participants; low‐certainty evidence; Analysis 3.3). The 95% prediction interval ranged between 0.43 and 5.52. Two trials reported a composite outcome of cardiovascular and cerebrovascular events (Filozof 2010: M+S 12/493 (2.4%) participants, metformin plus DPP‐4 inhibitor 7/510 (1.4%) participants; Matthews 2010: M+S 60/1546 (3.9%) participants, metformin plus DPP‐4 inhibitor 59/1553 (3.8%) participants).
3.3. Analysis.
Comparison 3 Metformin plus sulphonylurea vs metformin plus DPP‐4 inhibitor, Outcome 3 Cardiovascular mortality.
We could not perform a test for subgroup differences according to duration of follow‐up due to lack of data.
Because all trials were published in English, we could not perform sensitivity analyses according to publication status or language of publication. Sensitivity analysis restricted to only trials with low risk of selection bias did not substantially change the effect estimate (RR 1.72, 95% CI 0.44 to 6.69; P = 0.43; 4 trials; 3645 participants).
We could not perform sensitivity analysis excluding large trials because no trials had more than 1000 participants randomised to each intervention group. We could not perform sensitivity analysis excluding trials funded by a pharmaceutical company because all trials received funding from a pharmaceutical company.
TSA showed that 0.92% of the diversity‐adjusted information size had been accrued to detect or reject a 10% RRR. Diversity was zero. As only a minor fraction of the diversity‐adjusted required information size to detect or reject a 10% RRR had been accrued, we could not calculate the TSA‐adjusted 95% CI.
Non‐fatal myocardial infarction
Six trials reported that a total of 28 participants experienced a non‐fatal myocardial infarction: in the M+S group 15/2989 (0.5%) participants had a myocardial infarction compared with 13/3885 (0.3%) participants in the metformin plus DPP‐4 inhibitor group (RR 1.45, 95% CI 0.69 to 3.07; P = 0.33; 6 trials; 6874 participants; very low‐certainty evidence; Analysis 3.4). The 95% prediction interval ranged between 0.50 and 4.20.
3.4. Analysis.
Comparison 3 Metformin plus sulphonylurea vs metformin plus DPP‐4 inhibitor, Outcome 4 Non‐fatal myocardial infarction.
We could not perform a test for subgroup differences according to duration of follow‐up due to lack of data.
Because all trials were published in English, we could not perform sensitivity analyses according to publication status or language of publication. Sensitivity analysis restricted to trials with low risk of selection bias did not substantially change the effect estimate (RR 1.44, 95% CI 0.55 to 3.77; P = 0.45; 4 trials; 3645 participants). We could not perform sensitivity analysis excluding large trials because no trials had more than 1000 participants randomised to each intervention group. We could not perform sensitivity analysis excluding trials funded by a pharmaceutical company because all trials received funding from a pharmaceutical company.
TSA showed that 0.95% of the diversity‐adjusted information size had been accrued to detect or reject a 10% RRR. Diversity was zero. As only a minor fraction of the diversity‐adjusted required information size to detect or reject a 10% RRR had been accrued, we could not calculate the TSA‐adjusted 95% CI.
Heart failure
Eight trials reported that a total of 29 participants developed heart failure: in the M+S group 15/4894 (0.3%) participants developed heart failure compared with 14/5797 (0.2%) participants in the metformin plus DPP‐4 inhibitor group (RR 1.05, 95% CI 0.47 to 2.34; P = 0.90; 8 trials; 10,691 participants; Analysis 3.5). The 95% prediction interval ranged between 0.39 and 2.86.
3.5. Analysis.
Comparison 3 Metformin plus sulphonylurea vs metformin plus DPP‐4 inhibitor, Outcome 5 Heart failure.
A test for subgroup differences according to duration of follow‐up did not indicate interaction (P = 0.08).
Because all trials were published in English, we could not perform sensitivity analyses according to publication status or language of publication. Sensitivity analysis restricted to only trials with low risk of selection bias did not substantially change the direction of the effect estimate (RR 1.21, 95% CI 0.38 to 3.78; P = 0.75; 5 trials; 4363 participants). Sensitivity analysis excluding large trials did not substantially change the direction of the effect estimate (RR 1.07, 95% CI 0.42 to 2.69; P = 0.89; 7 trials; 7592 participants). We could not perform sensitivity analysis excluding trials funded by a pharmaceutical company because all trials received funding from a pharmaceutical company.
Non‐fatal stroke
Four trials reported that a total of 22 participants experienced a non‐fatal stroke: in the M+S group 14/2098 (0.7%) participants had a non‐fatal stroke compared with 8/2995 (0.3%) participants in the metformin plus DPP‐4 inhibitor group (RR 2.21, 95% CI 0.74 to 6.58; P = 0.15; 4 trials; 5093 participants; very low‐certainty evidence; Analysis 3.6). The 95% prediction interval ranged between 0.12 and 40.89.
3.6. Analysis.
Comparison 3 Metformin plus sulphonylurea vs metformin plus DPP‐4 inhibitor, Outcome 6 Non‐fatal stroke.
We could not perform subgroup analysis due to lack of data.
Because all trials were published in English, we could not perform sensitivity analyses according to publication status or language of publication. We could not perform sensitivity analysis restricted to trials with low risk of selection bias due to lack of data. We could not perform sensitivity analysis excluding long trials because all trials had a follow‐up of 104 weeks or less. We could not perform sensitivity analysis excluding large trials because no trials had more than 1000 participants randomised to each intervention group. We could not perform sensitivity analysis excluding trials funded by a pharmaceutical company because all trials received funding from a pharmaceutical company.
TSA showed that 0.76% of the diversity‐adjusted information size had been accrued to detect or reject a 10% RRR. Diversity was 23%. As only a minor fraction of the diversity‐adjusted required information size to detect or reject a 10% RRR had been accrued, we could not calculate the TSA‐adjusted 95% CI.
Amputation of lower extremity
Dei Cas 2017 did not observe amputation of the lower extremity in either intervention group (64 participants; very low‐certainty evidence).
Blindness or severe vision loss
Dei Cas 2017 did not observe blindness or severe vision loss in either intervention group (64 participants; very low‐certainty evidence).
End‐stage renal disease
Dei Cas 2017 did not observe end‐stage renal disease in either intervention group (64 participants; very low‐certainty evidence).
Non‐serious adverse events
Seven trials reported that a total of 4751 participants experienced a non‐serious adverse event: in the M+S group 2156/3348 (64.4%) participants had a non‐serious adverse event compared with 2595/4244 (61.1%) participants in the metformin plus DPP‐4 inhibitor group (RR 1.18, 95% CI 1.03 to 1.35; P = 0.02; 7 trials; 7592 participants; Analysis 3.7 in favour of metformin plus DPP‐4 inhibitor). The 95% prediction interval ranged between 0.73 and 1.91. There was substantial heterogeneity, which could be caused by various definitions of the outcome (most trials did not adequately specify this outcome measure).
3.7. Analysis.
Comparison 3 Metformin plus sulphonylurea vs metformin plus DPP‐4 inhibitor, Outcome 7 Non‐serious adverse events.
A test for subgroup differences according to duration of follow‐up did not indicate interaction (P = 0.11).
Because all trials were published in English, we could not perform sensitivity analyses according to publication status or language of publication. Sensitivity analysis restricted to trials with low risk of selection bias did not substantially change the effect estimate (RR 1.27, 95% CI 1.06 to 1.52; P = 0.01; 5 trials; 4363 participants). We could not perform sensitivity analysis excluding large trials because no trials had more than 1000 participants randomised to each intervention group. We could not perform sensitivity analysis excluding trials funded by a pharmaceutical company because all trials received funding from a pharmaceutical company.
TSA showed that 21.5% of the diversity‐adjusted required information size to detect or reject a 10% RRR had been accrued. Diversity was 94%. The TSA‐adjusted 95% CI was 0.88 to 1.58.
Hypoglycaemia
Seven trials reported that a total of 1544 participants experienced a mild or moderate hypoglycaemic event: in the M+S group 1359/4535 (30.0%) participants had a mild or moderate hypoglycaemic episode compared with 185/5438 (3.4%) participants in the metformin plus DPP‐4 inhibitor group (RR 7.42, 95% CI 4.77 to 11.53; P < 0.001; 7 trials; 9973 participants; Analysis 3.8 in favour of metformin plus DPP‐4 inhibitor). The 95% prediction interval ranged between 1.86 and 29.66. There was substantial heterogeneity, probably caused by various definitions of the outcome. All trials that stated a definition of outcome defined mild/moderate hypoglycaemia in different ways (Ahrén 2014; Del Prato 2014; Göke 2013; Matthews 2010).
3.8. Analysis.
Comparison 3 Metformin plus sulphonylurea vs metformin plus DPP‐4 inhibitor, Outcome 8 Mild/moderate hypoglycaemia.
The test for subgroup differences analysing trials according to duration of intervention showed a statistically significant difference between subgroups (P = 0.04; Analysis 3.8). However, CIs overlap indicating that in fact there was no true interaction.
Because all trials were published in English, we could not perform sensitivity analyses according to publication status or language of publication. Sensitivity analysis restricted to trials with low risk of selection bias did not substantially change the effect estimate (RR 6.71, 95% CI 3.94 to 11.44; P < 0.001; 4 trials; 3645 participants). Sensitivity analysis excluding large trials did not substantially change the effect estimate (RR 6.00, 95% CI 4.33 to 8.32; P < 0.001; 6 trials; 6874 participants). We could not perform sensitivity analysis excluding trials funded by a pharmaceutical company because all trials received funding from a pharmaceutical company.
TSA showed that 1.4% of the diversity‐adjusted information size had been accrued to detect or reject a 10% RRR. Diversity was 88%. As only a minor fraction of the diversity‐adjusted required information size to detect or reject a 10% RRR had been accrued, we could not calculate the TSA‐adjusted 95% CI.
Eight trials reported that a total of 55 participants experienced a serious hypoglycaemic event: in the M+S group 51/4894 (1.0%) participants had a serious hypoglycaemic episode compared with 4/5797 (0.1%) participants in the metformin plus DPP‐4 inhibitor group (RR 8.04, 95% CI 3.31 to 19.53; P < 0.01; 8 trials; 10,691 participants; Analysis 3.9 in favour of metformin plus DPP‐4 inhibitor). The 95% prediction interval ranged between 2.66 and 24.35.
3.9. Analysis.
Comparison 3 Metformin plus sulphonylurea vs metformin plus DPP‐4 inhibitor, Outcome 9 Serious hypoglycaemia.
A test for subgroup differences according to duration of follow‐up did not indicate interaction (P = 0.78).
Because all trials were published in English, we could not perform sensitivity analyses according to publication status or language of publication. Sensitivity analysis restricted to trials with low risk of selection bias did not substantially change the effect estimate (RR 8.62, 95% CI 2.81 to 26.43; P = 0.0002; 5 trials; 4363 participants). Sensitivity analysis excluding large trials did not substantially change the effect estimate (RR 6.93, 95% CI 2.72 to 17.65; P < 0.001; 7 trials; 7592 participants). We could not perform sensitivity analysis excluding trials funded by a pharmaceutical company because all trials received funding from a pharmaceutical company.
TSA showed that 0.62% of the diversity‐adjusted information size had been accrued to detect or reject a 10% RRR. Diversity was 0%. As only a minor fraction of the diversity‐adjusted required information size to detect or reject a 10% RRR had been accrued, we could not calculate the TSA‐adjusted 95% CI.
Socioeconomic effects
Two trials performed economic analyses of trial data (Del Prato 2014; Göke 2013).
One trial presented an economic analysis using the IMS Core Diabetes Model (Del Prato 2014). Treatment with alogliptin 12.5 mg or 25 mg compared with sulphonylurea was associated with an incremental cost‐effectiveness ratio of GBP 10,959 or GBP 7217 per quality adjusted life year, respectively.
One trial presented an economic analysis using the Cardiff Stochastic Simulation Cost‐utility Model (Göke 2013). The overall mean cost per quality adjusted life year gained with saxagliptin plus metformin compared with M+S was GBP 7888.
Additional explorative outcomes
Weight
Nine trials reported weight change. Metformin plus DPP‐4 inhibitor compared with M+S combination therapy resulted in a weight loss of 2.2 kg (95% CI 1.7 to 2.6; P < 0.001; 9 trials; 10,228 participants; Analysis 3.10). The 95% prediction interval ranged between 0.8 kg and 3.5 kg.
3.10. Analysis.
Comparison 3 Metformin plus sulphonylurea vs metformin plus DPP‐4 inhibitor, Outcome 10 Weight change (kg).
HbA1c
Nine trials reported HbA1c (random MD −0.1%, 95% CI −0.1 to 0.03; P = 0.25; 9 trials; 9320 participants; fixed MD −0.1%, 95% CI −0.1 to −0.04; P < 0.001; Analysis 3.11 in favour of M+S). The 95% prediction interval ranged between −0.3% and 0.2%.
3.11. Analysis.
Comparison 3 Metformin plus sulphonylurea vs metformin plus DPP‐4 inhibitor, Outcome 11 Change in HbA1c.
Metformin‐sulfonylurea combination therapy versus metformin plus a long‐acting DPP‐4 inhibitor
One trial compared M+S with metformin plus a long‐acting DPP‐4 inhibitor (Handelsman 2017). Glimepiride was given in doses of 1 mg/day to 6 mg/day, omarigliptin in doses of 25 mg/week and metformin in doses of 1500 mg/day or more. For details of the certainty of the evidence see Appendix 19.
Primary outcomes
All‐cause mortality
In the M+S group no participants died out of 375 participants, compared with 2 deaths in 375 (0.5%) participants in the metformin plus long‐acting DPP‐4 inhibitor group (RR 0.20, 95% CI 0.01 to 4.15; P = 0.30; very low‐certainty evidence because of indirectness and very serious imprecision; Analysis 4.1).
4.1. Analysis.
Comparison 4 Metformin plus sulphonylurea vs metformin plus long‐acting DPP‐4 inhibitor, Outcome 1 All‐cause mortality.
Health‐related quality of life
Handelsman 2017 did not report on this outcome.
Serious adverse effects
In the M+S group 18/375 (4.8%) participants experienced a serious adverse event compared with 24/375 (6.4%) participants in the metformin plus long‐acting DPP‐4 inhibitor group (RR 0.75, 95% CI 0.41 to 1.36; P = 0.34; very low‐certainty evidence because of very serious imprecision, Analysis 4.2).
4.2. Analysis.
Comparison 4 Metformin plus sulphonylurea vs metformin plus long‐acting DPP‐4 inhibitor, Outcome 2 Serious adverse events.
Secondary outcomes
Cardiovascular mortality
In the M+S group no participants out of 375 died compared with 1 death in 375 (0.3%) participants in the metformin plus long‐acting DPP‐4 inhibitor (RR 0.33, 95% CI 0.01 to 8.16; P = 0.50; very low‐certainty evidence because of indirectness and very serious imprecision; Analysis 4.3).
4.3. Analysis.
Comparison 4 Metformin plus sulphonylurea vs metformin plus long‐acting DPP‐4 inhibitor, Outcome 3 Cardiovascular mortality.
Non‐fatal myocardial infarction
In the M+S group 1/375 (0.3%) participants experienced a non‐fatal myocardial infarction compared with 0/375 participants in the metformin plus long‐acting DPP‐4 inhibitor (RR 3.00, 95% CI 0.12 to 73.41; P = 0.50; very low‐certainty evidence because of indirectness and very serious imprecision, Analysis 4.4).
4.4. Analysis.
Comparison 4 Metformin plus sulphonylurea vs metformin plus long‐acting DPP‐4 inhibitor, Outcome 4 Non‐fatal myocardial infarction.
Heart failure, non‐fatal stroke, amputation of lower extremity, blindness or severe vision loss, end‐stage renal disease
Handelsman 2017 did not report on these outcomes.
Non‐serious adverse events
In the M+S group 125/375 (33.3%) participants experienced a non‐serious adverse event compared with 43/375 (11.5%) participants in the metformin plus long‐acting DPP‐4 inhibitor (RR 2.91, 95% CI 2.12 to 3.99; P < 0.001; Analysis 4.5), favouring metformin plus long‐acting DPP‐4 inhibitor.
4.5. Analysis.
Comparison 4 Metformin plus sulphonylurea vs metformin plus long‐acting DPP‐4 inhibitor, Outcome 5 Non‐serious adverse events.
Hypoglycaemia
In the M+S group 110/375 (29.3%) participants experienced a mild or moderate hypoglycaemic episode compared with 21/375 (5.6%) participants in the metformin plus long‐acting DPP‐4 inhibitor (RR 5.24, 95% CI 3.36 to 8.17; P < 0.001; Analysis 4.6 in favour of metformin plus long‐acting DPP‐4 inhibitor).
4.6. Analysis.
Comparison 4 Metformin plus sulphonylurea vs metformin plus long‐acting DPP‐4 inhibitor, Outcome 6 Mild/moderate hypoglycaemia.
In the M+S group 6/375 (1.6%) participants experienced a serious hypoglycaemic episode compared with 1/375 (0.3%) participant in the metformin plus long‐acting DPP‐4 inhibitor (RR 6.00, 95% CI 0.73 to 49.60; P = 0.10; Analysis 4.7).
4.7. Analysis.
Comparison 4 Metformin plus sulphonylurea vs metformin plus long‐acting DPP‐4 inhibitor, Outcome 7 Serious hypoglycaemia.
Socioeconomic effects
Handelsman 2017 did not report on this outcome.
Additional explorative outcomes
Weight
Change from baseline in body weight increased by 1.5 kg (SD 4.0) in 375 participants in the M+S group compared with a weight reduction of 0.4 kg in 375 participants in the metformin plus long‐acting DPP‐4 inhibitor group (MD 1.9 kg, 95% CI 1.3 to 2.5; P < 0.001; Analysis 4.8).
4.8. Analysis.
Comparison 4 Metformin plus sulphonylurea vs metformin plus long‐acting DPP‐4 inhibitor, Outcome 8 Weight change (kg).
HbA1c
In the M+S group there was a MD in HbA1c change of −0.5% in 375 participants compared with −0.3% in 375 participants in the metformin plus long‐acting DPP‐4 inhibitor group (MD of −0.2%, 95% CI −0.3 to −0.1; P = 0.006; Analysis 4.9).
4.9. Analysis.
Comparison 4 Metformin plus sulphonylurea vs metformin plus long‐acting DPP‐4 inhibitor, Outcome 9 Change in HbA1c (%).
Metformin‐sulfonylurea combination therapy versus metformin plus thiazolidinedione
Eleven trials compared M+S combination therapy with metformin plus a thiazolidinedione (Charbonnel 2005; Derosa 2005; Derosa 2009a; Derosa 2011b; Hamann 2008; Home 2009; Maffioli 2013; NCT00367055; Petrica 2009; Petrica 2011; Vaccaro 2017). Four trials administered glimepiride in doses of 2 mg/day to 4 mg/day (Derosa 2005; Derosa 2009a; Petrica 2009; Petrica 2011), two trials administered glibenclamide in doses of 5 mg/day to 15 mg/day (Derosa 2011b; Maffioli 2013), and two trials administered gliclazide in doses of 80 mg/day to 320 mg/day (Charbonnel 2005; NCT00367055). Three trials treated participants with various sulphonylureas: glibenclamide and gliclazide in doses of 5 mg/day to 15 mg/day and 80 mg/day to 320 mg/day, respectively (Hamann 2008); glibenclamide, gliclazide and glimepiride in doses up to 15 mg/day, 240 mg/day and 4 mg/day, respectively (Home 2009); glibenclamide, gliclazide and glimepiride in doses of 5 mg/day to 15 mg/day, 30 mg/day to 120 mg/day and 2 mg/day to 6 mg/day, respectively (Vaccaro 2017). Five trials administered rosiglitazone in doses of 4 mg/day to 8 mg/day (Derosa 2005; Hamann 2008; Home 2009; NCT00367055; Petrica 2009), and six trials administered pioglitazone in doses of 15 mg/day to 45 mg/day (Charbonnel 2005; Derosa 2009a; Derosa 2011b; Maffioli 2013; Petrica 2011; Vaccaro 2017). Metformin was given in doses of 850 mg/day to 2550 mg/day.
Primary outcomes
All‐cause mortality
Six trials reported that a total of 237 participants died: in the M+S group 123/3300 (3.7%) participants died compared with 114/3354 (3.4%) participants in the metformin plus thiazolidinedione group (RR 1.09, 95% CI 0.85 to 1.40; P = 0.51; 6 trials; 6654 participants; low‐certainty evidence; Analysis 5.1). The 95% prediction interval ranged between 0.75 and 1.55. One of the trials provided data from a time‐to‐event analysis on all‐cause mortality: the HR for metformin plus pioglitazone versus M+S was 1.10 (95% CI 0.75 to 1.61, P = 0.63; Vaccaro 2017).
5.1. Analysis.
Comparison 5 Metformin plus sulphonylurea vs metformin plus thiazolidinedione, Outcome 1 All‐cause mortality.
In one trial, comparing M+S with metformin plus pioglitazone, the investigators reported that no participants died but did not provide the number of participants included in the analysis (Derosa 2011b).
A test for subgroup differences comparing rosiglitazone with pioglitazone did not indicate interaction (P = 0.84; Analysis 5.1). A test for subgroup differences according to duration of follow‐up did not indicate interaction (P = 0.91; Analysis 6.1).
6.1. Analysis.
Comparison 6 Metformin plus sulphonylurea vs metformin plus thiazolidinedione (subgroups duration of intervention), Outcome 1 All‐cause mortality.
Because all trials were published in English, we could not perform sensitivity analyses according to publication status or language of publication. Sensitivity analysis according to trials with low risk of selection bias did not substantially change the effect estimate (RR 1.08, 95% CI 0.84 to 1.38; P = 0.57; 5 trials; 6570 participants). Sensitivity analysis excluding large trials did not substantially change the effect estimate (RR 2.08, 95% CI 0.49 to 8.80; P = 0.32; 4 trials; 1404 participants). We could not perform sensitivity analysis excluding trials funded by a pharmaceutical company due to lack of data.
TSA showed that 7.7% of the diversity‐adjusted required information size to detect or reject a 10% RRR had been accrued. Diversity was 0%. The TSA‐adjusted 95% CI was 0.39 to 3.01.
Health‐related quality of life
None of the included trials reported on this outcome.
Serious adverse effects
Six trials reported that a total of 1337 participants experienced a serious adverse event: in the M+S group 666/3300 (20.2%) participants had a serious adverse event compared with 671/3354 (20.0%) participants in the metformin plus thiazolidinedione group (RR 1.01, 95% CI 0.93 to 1.11; P = 0.80; 6 trials; 6654 participants; very low‐certainty evidence; Analysis 5.2). The 95% prediction interval ranged between 0.88 and 1.16.
5.2. Analysis.
Comparison 5 Metformin plus sulphonylurea vs metformin plus thiazolidinedione, Outcome 2 Serious adverse events.
Derosa 2011b compared M+S with metformin plus pioglitazone and reported that no participants experienced a serious adverse event but did not provide the number of participants included in the analysis.
A test for subgroup differences comparing rosiglitazone with pioglitazone did not indicate interaction (P = 0.84; Analysis 5.2). A test for subgroup differences according to duration of follow‐up did not indicate interaction (P = 0.28; Analysis 6.2).
6.2. Analysis.
Comparison 6 Metformin plus sulphonylurea vs metformin plus thiazolidinedione (subgroups duration of intervention), Outcome 2 Serious adverse events.
Because all trials were published in English, we could not perform sensitivity analyses according to publication status or language of publication. Sensitivity analysis according to trials with low risk of selection bias did not substantially change the effect estimate (RR 1.01, 95% CI 0.92 to 1.10; P = 0.90; 5 trials; 6570 participants). Sensitivity analysis excluding large trials did not substantially change the effect estimate (RR 1.13, 95% CI 0.69 to 1.86; P = 0.63; 4 trials; 1404 participants). We could not perform sensitivity analysis excluding trials funded by a pharmaceutical company due to lack of data.
TSA showed that 10.6% of the diversity‐adjusted required information size to detect or reject a 10% RRR had been accrued. Diversity was 81%. The TSA‐adjusted 95% CI was 0.41 to 2.22.
Secondary outcomes
Cardiovascular mortality
Four trials reported that a total of 78 participants died due to cardiovascular disease: in the M+S group 37/2946 (1.3%) participants died compared with 41/2994 (1.4%) participants in the metformin plus thiazolidinedione group (RR 0.78, 95% CI 0.36 to 1.67; P = 0.52; 4 trials; 5940 participants; low‐certainty evidence; Analysis 5.3). The 95% prediction interval ranged between 0.07 and 8.92. Vaccaro 2017 provided data from a time‐to‐event analysis on cardiovascular mortality: metformin plus pioglitazone versus M+S had a HR of 2.24 (95% CI 0.69 to 7.28, P = 0.18). Derosa 2011b, compared M+S with metformin plus pioglitazone and reported that no participants died due to cardiovascular disease but did not provide the number of participants included in the analysis.
5.3. Analysis.
Comparison 5 Metformin plus sulphonylurea vs metformin plus thiazolidinedione, Outcome 3 Cardiovascular mortality.
A test for subgroup differences comparing rosiglitazone with pioglitazone did not indicate interaction (P = 0.40; Analysis 5.3). A test for subgroup differences according to duration of follow‐up did not indicate interaction (P = 0.36; Analysis 6.3).
6.3. Analysis.
Comparison 6 Metformin plus sulphonylurea vs metformin plus thiazolidinedione (subgroups duration of intervention), Outcome 3 Cardiovascular mortality.
Because all trials were published in English, we could not perform sensitivity analyses according to publication status or language of publication. We could not perform sensitivity analysis according to trials with low risk of selection bias since all trials were evaluated as low risk of selection bias. We could not perform sensitivity analyses excluding large trials and trials funded by a pharmaceutical company due to lack of data.
TSA showed that 1.3% of the diversity‐adjusted required information size to detect or reject a 10% RRR had been accrued. Diversity was 66%. As only a minor fraction of the diversity‐adjusted required information size to detect or reject a 10% RRR had been accrued, we could not calculate the TSA‐adjusted 95% CI.
Non‐fatal myocardial infarction
Three trials reported that a total of 46 participants experienced a non‐fatal myocardial infarction: in the M+S group 25/1841 (1.4%) participants had a non‐fatal myocardial infarction compared with 21/1877 (1.1%) participants in the metformin plus thiazolidinedione group (RR 1.21, 95% CI 0.68 to 2.14; P = 0.51; 3 trials; 3718 participants; very low‐certainty evidence; Analysis 5.4). The 95% prediction interval ranged between 0.03 and 48.76.
5.4. Analysis.
Comparison 5 Metformin plus sulphonylurea vs metformin plus thiazolidinedione, Outcome 4 Non‐fatal myocardial infarction.
Vaccaro 2017 provided data from a time‐to‐event analysis on non‐fatal myocardial infarction: M+S versus metformin plus pioglitazone had a HR of 0.87 (95% CI 0.48 to 1.55; P = 0.63).
Derosa 2011b compared M+S with metformin plus pioglitazone and reported that no participants experienced a non‐fatal myocardial infarction but did not provide the number of participants included in the analysis.
A test for subgroup differences comparing rosiglitazone with pioglitazone did not indicate interaction (P = 0.58; Analysis 5.4). A test for subgroup differences according to duration of follow‐up did not indicate interaction (P = 0.58; Analysis 6.4).
6.4. Analysis.
Comparison 6 Metformin plus sulphonylurea vs metformin plus thiazolidinedione (subgroups duration of intervention), Outcome 4 Non‐fatal myocardial infarction.
Because all trials were published in English, we could not perform sensitivity analyses according to publication status or language of publication. We could not perform sensitivity analysis according to trials with low risk of selection bias because all trials were evaluated as low risk of selection bias. Sensitivity analyses excluding large trials and trials funded by a pharmaceutical company could not be performed due to lack of data.
TSA showed that 1.72% of the diversity‐adjusted required information size to detect or reject a 10% RRR had been accrued. Diversity was 0%. As only a minor fraction of the diversity‐adjusted required information size to detect or reject a 10% RRR had been accrued, we could not calculate the TSA‐adjusted 95% CI.
Heart failure
Five trials reported that a total of 83 participants developed heart failure: in the M+S group 33/3259 (1.0%) participants developed heart failure compared with 50/3311 (1.5%) participants in the metformin plus thiazolidinedione group (RR 0.67, 95% CI 0.43 to 1.04; P = 0.08; 5 trials; 6570 participants; Analysis 5.5). The 95% prediction interval ranged between 0.33 and 1.37.
5.5. Analysis.
Comparison 5 Metformin plus sulphonylurea vs metformin plus thiazolidinedione, Outcome 5 Heart failure.
Vaccaro 2017 provided data from a time‐to‐event analysis on heart failure: the HR comparing participants in the sulphonylureas group with participants in the pioglitazone group was 1.57 (95% CI 0.76 to 3.24; P = 0.22).
Derosa 2011b compared M+S with metformin plus pioglitazone and reported that no participants developed heart failure but did not report the number of participants included in the analysis.
A test for subgroup differences comparing rosiglitazone with pioglitazone did not indicate interaction (P = 0.65; Analysis 5.5). A test for subgroup differences according to duration of follow‐up did not indicate interaction (P = 0.79; Analysis 6.5).
6.5. Analysis.
Comparison 6 Metformin plus sulphonylurea vs metformin plus thiazolidinedione (subgroups duration of intervention), Outcome 5 Heart failure.
Because all trials were published in English, we could not perform sensitivity analyses according to publication status or language of publication. We could not perform sensitivity analysis according to trials with low risk of selection bias because all trials were evaluated as low risk of selection bias. Sensitivity analysis excluding large trials did not substantially change the effect estimate (RR 0.51, 95% CI 0.12 to 2.07; P = 0.35; 3 trials; 1320 participants). We could not perform sensitivity analysis excluding trials funded by a pharmaceutical company due to lack of data.
TSA showed that 3.3% of the diversity‐adjusted required information size to detect or reject a 10% RRR had been accrued. Diversity was 0%. As only a minor fraction of the diversity‐adjusted required information size to detect or reject a 10% RRR had been accrued, we could not calculate the TSA‐adjusted 95% CI.
Non‐fatal stroke
Two trials compared M+S with metformin plus thiazolidinedione: in the M+S group 20/1540 (1.3%) participants had a non‐fatal stroke compared with 16/1583 (1%) participants in the metformin plus thiazolidinedione group (RR 1.29, 95% CI 0.67 to 2.47; P = 0.45; 2 trials; 3123 participants; very low‐certainty evidence; Analysis 5.6). Vaccaro 2017 administered pioglitazone combined with metformin and also provided data from a time‐to‐event analysis on non‐fatal stroke: M+S compared with metformin plus pioglitazone showed a HR of 0.79 (95% CI 0.41 to 1.53; P = 0.49; 3028 participants). Only Vaccaro 2017, in his trial of long duration, observed non‐fatal strokes (Analysis 6.6).
5.6. Analysis.
Comparison 5 Metformin plus sulphonylurea vs metformin plus thiazolidinedione, Outcome 6 Non‐fatal stroke.
6.6. Analysis.
Comparison 6 Metformin plus sulphonylurea vs metformin plus thiazolidinedione (subgroups duration of intervention), Outcome 6 Non‐fatal stroke.
Derosa 2011b administered pioglitazone combined with metformin and reported that no participants experienced a non‐fatal stroke but did not provide the number of participants included in the analysis.
Amputation of lower extremity
Two trials with 3123 participants provided data on amputation of lower extremity (very low‐certainty evidence; Analysis 5.7). Neither of the trials reported any events.
5.7. Analysis.
Comparison 5 Metformin plus sulphonylurea vs metformin plus thiazolidinedione, Outcome 7 Amputation of lower extremity.
Blindness or severe vision loss
One trial with 95 participants provided data on blindness or severe vision loss (very low‐certainty evidence; Analysis 5.8). They did not report any events.
5.8. Analysis.
Comparison 5 Metformin plus sulphonylurea vs metformin plus thiazolidinedione, Outcome 8 Blindness or severe vision loss.
End‐stage renal disease
One trial with 95 participants provided data on end‐stage renal disease (very low‐certainty evidence; Analysis 5.9). They did not report any events.
5.9. Analysis.
Comparison 5 Metformin plus sulphonylurea vs metformin plus thiazolidinedione, Outcome 9 End‐stage renal disease.
Non‐serious adverse events
Five trials reported that a total of 3072 participants experienced a non‐serious adverse event: in the M+S group 1510/2987 (50.6%) participants had a non‐serious adverse event compared with 1562/3037 (51.4%) participants in the metformin plus thiazolidinedione group (RR 0.94, 95% CI 0.44 to 2.01; P = 0.87; 5 trials; 6024 participants; Analysis 5.10). The 95% prediction interval ranged between 0.05 and 16.49.
5.10. Analysis.
Comparison 5 Metformin plus sulphonylurea vs metformin plus thiazolidinedione, Outcome 10 Non‐serious adverse events.
Derosa 2011b compared M+S with metformin plus pioglitazone and reported that two and three participants experienced non‐serious adverse events, respectively. However, they did not provide the number of participants included in the analysis.
A test for subgroup differences comparing rosiglitazone with pioglitazone did not indicate interaction (P = 0.36; Analysis 5.10). A test for subgroup differences according to duration of follow‐up did not indicate interaction (P = 0.94; Analysis 6.7).
6.7. Analysis.
Comparison 6 Metformin plus sulphonylurea vs metformin plus thiazolidinedione (subgroups duration of intervention), Outcome 7 Non‐serious adverse events.
Because all trials were published in English, we could not perform sensitivity analyses according to publication status or language of publication. Sensitivity analysis according to trials with low risk of selection bias did not substantially change the effect estimate (RR 0.92, 95% CI 0.36 to 2.35; P = 0.87; 4 trials; 5940 participants). Sensitivity analysis excluding large trials did not substantially change the effect estimate (RR 0.97, 95% CI 0.76 to 1.25; P = 0.83; 3 trials; 774 participants). Sensitivity analysis excluding trials funded by a pharmaceutical company did not substantially change the effect estimate (RR 0.93, 95% CI 0.82 to 1.05; P = 0.24; 2 trials; 3123 participants).
TSA showed that the cumulative z‐curve crossed the futility boundaries suggesting that a 10% or greater RRR could be rejected at this point. Diversity was 0%. The TSA‐adjusted 95% CI was 0.74 to 1.19.
Hypoglycaemia
Five trials reported that a total of 926 participants had a mild or moderate hypoglycaemic episode: in the M+S group 721/2999 (24.0%) participants had a mild or moderate hypoglycaemic episode compared with 205/3060 (6.7%) participants in the metformin plus thiazolidinedione group (RR 3.63, 95% CI 2.98 to 4.44; P < 0.001; 5 trials; 6059 participants; Analysis 5.11 in favour of metformin plus thiazolidinedione). The 95% prediction interval ranged between 2.30 and 5.73. Derosa 2011b compared M+S with metformin plus pioglitazone and reported two and one events of mild/moderate hypoglycaemia, respectively. However, they did not provide the number of participants included in the analysis.
5.11. Analysis.
Comparison 5 Metformin plus sulphonylurea vs metformin plus thiazolidinedione, Outcome 11 Mild/moderate hypoglycaemia.
A test for subgroup differences comparing rosiglitazone with pioglitazone did not indicate interaction (P = 0.62; Analysis 5.11). A test for subgroup differences according to duration of follow‐up did not indicate interaction (P = 0.48; Analysis 6.8).
6.8. Analysis.
Comparison 6 Metformin plus sulphonylurea vs metformin plus thiazolidinedione (subgroups duration of intervention), Outcome 8 Mild/moderate hypoglycaemia.
Because all trials were published in English, we could not perform sensitivity analyses according to publication status or language of publication. Sensitivity analysis according to trials with low risk of selection bias did not substantially change the effect estimate (RR 3.63, 95% CI 2.92 to 4.52; P < 0.00001; 4 trials; 5975 participants). Sensitivity analysis excluding large trials did not substantially change the effect estimate (RR 5.99, 95% CI 2.43 to 14.76; P = 0.0001; 3 trials; 809 participants). Sensitivity analysis excluding trials funded by a pharmaceutical company did not substantially change the effect estimate (RR 3.37, 95% CI 2.84 to 3.99; P < 0.00001; 2 trials; 3123 participants).
TSA showed that 8.0% of the diversity‐adjusted required information size to detect or reject a 10% RRR had been accrued. Diversity was 45%. The TSA‐adjusted 95% CI was 1.63 to 8.09.
Five trials reported that 36 participants experienced serious hypoglycaemia: in the M+S group 30/3259 (0.9%) participants had a serious hypoglycaemic episode compared with 6/3311 (0.2%) participants in the metformin plus thiazolidinedione group (random RR 3.98, 95% CI 0.34 to 46.01; P = 0.27; fixed RR 4.77, 95% CI 2.05 to 11.09; P < 0.001; 5 trials; 6570 participants; Analysis 5.12; in favour of metformin plus thiazolidinedione). However, there was substantial heterogeneity, probably caused by various definitions of serious hypoglycaemia. Only one trial provided a clear description of serious hypoglycaemia (Vaccaro 2017).
5.12. Analysis.
Comparison 5 Metformin plus sulphonylurea vs metformin plus thiazolidinedione, Outcome 12 Serious hypoglycaemia.
Derosa 2011b compared M+S with metformin plus pioglitazone and reported no serious hypoglycaemic events. However, they did not provide the number of participants included in the analysis.
A test for subgroup differences comparing rosiglitazone with pioglitazone showed a statistically significant difference between subgroups (P = 0.009; Analysis 5.12). However, CIs overlap slightly indicating that in fact there was no true interaction. A test for subgroup differences according to duration of follow‐up did not indicate interaction (P = 0.85; Analysis 6.9).
6.9. Analysis.
Comparison 6 Metformin plus sulphonylurea vs metformin plus thiazolidinedione (subgroups duration of intervention), Outcome 9 Serious hypoglycaemia.
Because all trials were published in English, we could not perform sensitivity analyses according to publication status or language of publication. We could not perform sensitivity analysis according to trials with low risk of selection bias because all trials were evaluated as low risk of selection bias. We could not perform sensitivity analysis of large trials and trials funded by a pharmaceutical company due to lack of data.
TSA showed that 0.08% of the diversity‐adjusted required information size to detect or reject a 10% RRR had been accrued. Diversity was 79%. As only a minor fraction of the diversity‐adjusted required information size to detect or reject a 10% RRR had been accrued, we could not calculate the TSA‐adjusted 95% CI.
Socioeconomic effects
None of the included trials reported on this outcome.
Additional explorative outcomes
Weight
Seven trials reported weight change (random MD −0.6 kg, 95% CI −2.8 to 1.6; P = 0.62; fixed MD −2.0 kg, 95% CI −2.4 to −1.6; P < 0.001; 7 trials; 6877 participants; Analysis 5.13; in favour of M+S). The 95% prediction interval ranged between −8.3 kg and 7.2 kg.There was substantial heterogeneity probably caused by two of the rosiglitazone trials (Derosa 2005; Home 2009), and by duration of follow‐up (ranging from one year to 5.5 years), various sulphonylureas (glimepiride, glibenclamide, gliclazide) and various doses of rosiglitazone ranging from 4 mg/day to 8 mg/day.
5.13. Analysis.
Comparison 5 Metformin plus sulphonylurea vs metformin plus thiazolidinedione, Outcome 13 Weight (change).
HbA1c
Ten trials reported change in HbA1c (random MD 0.2%, 95% CI 0.04 to 0.3; P = 0.01; fixed MD 0.2%, 95% CI 0.1 to 0.2; P < 0.001; 10 trials; 7020 participants; Analysis 5.14; in favour of metformin plus thiazolidinedione). The 95% prediction interval ranged between −0.2% and 0.5%. There was substantial heterogeneity probably caused by duration of follow‐up (ranging from 1 year to 5.5 years), various sulphonylureas (glimepiride, glibenclamide, gliclazide) and various doses of sulphonylureas and thiazolidinediones.
5.14. Analysis.
Comparison 5 Metformin plus sulphonylurea vs metformin plus thiazolidinedione, Outcome 14 Change in HbA1c.
Derosa 2009a reported HbA1c final values of 7.8% (SD 0.4) in the M+S group and 7.2% (SD 0.3) in the metformin plus pioglitazone group. However, they did not provide the number of participants included in the analysis.
Metformin‐sulfonylurea combination therapy versus metformin plus glinide
Three trials compared M+S combination therapy with metformin plus a glinide (Derosa 2009b; Gerich 2005; Ristic 2007). Two trials administered glibenclamide in doses of 1.25 mg/day to 15 mg/day and one trial administered gliclazide in doses of 80 mg/day to 240 mg/day. All trials administered nateglinide in doses of 180 mg/day to 540 mg/day. The trials administered metformin in doses of 500 mg/day to 3000 mg/day.
Primary outcomes
All‐cause mortality
Three trials with 874 participants reported data on all‐cause mortality and one person died in each intervention group (low‐certainty evidence; Analysis 7.1).
7.1. Analysis.
Comparison 7 Metformin plus sulphonylurea vs metformin plus glinide, Outcome 1 All‐cause mortality.
Health‐related quality of life
None of the included trials reported on this outcome.
Serious adverse effects
Three trials reported that a total of 61 participants experienced a serious adverse event: in the M+S group 34/424 (8%) participants had a serious adverse event compared with 27/450 (6%) participants in the metformin plus thiazolidinedione group (RR 1.68, 95% CI 0.54 to 5.21; P = 0.37; 3 trials; 874 participants; low‐certainty evidence; Analysis 7.2).
7.2. Analysis.
Comparison 7 Metformin plus sulphonylurea vs metformin plus glinide, Outcome 2 Serious adverse events.
In one trial serious adverse events were reported for up to six months and six to 12 months separately. For up to six months 5/126 (4.0%) participants in the M+S group had a serious adverse event compared with 7/130 (5.4%) participants in the metformin plus glinide group. For six to 12 months, 7/101 (6.9%) participants and 2/112 (1.8%) participants experienced a serious adverse event in the M+S group compared with the metformin plus glinide group, respectively (Ristic 2007).
Secondary outcomes
Cardiovascular mortality
Two trials with 446 participants provided data on cardiovascular mortality (Derosa 2009b; Ristic 2007). No cardiovascular death was observed in either trial (low‐certainty evidence; Analysis 7.3).
7.3. Analysis.
Comparison 7 Metformin plus sulphonylurea vs metformin plus glinide, Outcome 3 Cardiovascular mortality.
Non‐fatal myocardial infarction
Two trials provided data on non‐fatal myocardial infarction in 446 participants. In total two non‐fatal myocardial infarctions were reported in 2/215 (0.9%) participants in the M+S group compared with 0/231 participants in the metformin plus thiazolidinedione group (2 trials; 446 participants; low‐certainty evidence). Derosa 2009b stated that no participants experienced a non‐fatal myocardial infarction. One trial reported non‐fatal myocardial infarction for up to six months and six to 12 months separately (Ristic 2007). For up to six months no event occurred in either intervention group. For six to 12 months, 2/101 (2%) participants had non‐fatal myocardial infarction in the M+S group compared to 0/112 participant in the metformin plus glinide group (RR 5.54, 95% CI 0.27 to 114.02; P = 0.27).
Heart failure
Two trials provided data on heart failure. Derosa 2009b stated that no heart failure occurred. One trial reported data on heart failure for up to six months and six to 12 months separately. For up to six months no event occurred in either intervention group. For six to 12 months, 0/101 participants and 1/112 (0.9%) participants developed heart failure in the M+S group compared to the metformin plus glinide group, respectively (Ristic 2007).
Non‐fatal stroke
Derosa 2009b stated that no non‐fatal stroke occurred (233 participants; very low‐certainty evidence).
Amputation of lower extremity
Derosa 2009b stated that no amputation of lower extremity occurred (233 participants; low‐certainty evidence).
Blindness or severe vision loss
Derosa 2009b stated that no blindness or severe vision loss occurred (233 participants; low‐certainty evidence).
End‐stage renal disease
Derosa 2009b stated that no end‐stage renal disease occurred (233 participants; low‐certainty evidence).
Non‐serious adverse events
Derosa 2009b stated that no non‐serious adverse events occurred.
Hypoglycaemia
Two trials provided data on mild or moderate hypoglycaemia. Gerich 2005 reported data from a subgroup analysis of participants 65 years and older: in the M+S group 7/40 (17.5%) participants had mild or moderate hypoglycaemia compared with 1/35 (2.9%) participants in the metformin plus glinide group (Analysis 7.4). Derosa 2009b reported two mild or moderate hypoglycaemic episodes in the M+S group compared with three events in the metformin plus glinide group.
7.4. Analysis.
Comparison 7 Metformin plus sulphonylurea vs metformin plus glinide, Outcome 4 Mild/moderate hypoglycaemia.
Two trials provided data on serious hypoglycaemia. Gerich 2005 reported that 2/209 (1%) participants in the M+S group compared with 0/219 participants in the metformin plus glinide group experienced a serious hypoglycaemic episode (Analysis 7.5). Derosa 2009b stated that no serious hypoglycaemia occurred.
7.5. Analysis.
Comparison 7 Metformin plus sulphonylurea vs metformin plus glinide, Outcome 5 Serious hypoglycaemia.
Socioeconomic effects
Neither of the included trials reported on this outcome.
Additional explorative outcomes
Weight
Two trials reported weight change (MD 1.1 kg, 95% CI −0.1 to 2.3; P = 0.06; 2 trials; 619 participants; Analysis 7.6).
7.6. Analysis.
Comparison 7 Metformin plus sulphonylurea vs metformin plus glinide, Outcome 6 Weight change.
HbA1c
Three trials reported change in HbA1c (random MD 0.2%, 95% CI ‐0.6 to 1.0; P = 0.69; fixed MD 0.4%, 95% CI 0.3 to 0.5; P < 0.00001; 3 trials; 852 participants; Analysis 7.7; in favour of metformin plus glinide). Calculation of the 95% prediction interval did not provide a meaningful estimate. There was substantial heterogeneity probably caused by various durations of follow‐up (ranging from 52 weeks to 104 weeks), various sulphonylureas (glibenclamide and gliclazide) and various doses of nateglinide (ranging from 180 mg/day to 540 mg/day).
7.7. Analysis.
Comparison 7 Metformin plus sulphonylurea vs metformin plus glinide, Outcome 7 Change in HbA1c.
Metformin‐sulfonylurea combination therapy versus metformin plus sodium‐glucose co‐transporter 2 (SGLT‐2) inhibitor
Four trials compared M+S combination therapy with metformin plus a SGLT‐2 inhibitor (Del Prato 2015; Hollander 2017; Leiter 2015; Ridderstråle 2014). Three trials administered glimepiride in doses of 1 mg/day to 8 mg/day (Hollander 2017; Leiter 2015; Ridderstråle 2014), and one trial administered glipizide in doses of 5 mg/day to 20 mg/day (Del Prato 2015). All trials administered various SGLT‐2 inhibitors: dapagliflozin in doses of 2.5 mg/day to 10 mg/day (Del Prato 2015), ertugliflozin in doses of 15 mg/day (Hollander 2017), canagliflozin in doses of 100 mg/day to 300 mg/day (Leiter 2015), and empagliflozin in doses of 25 mg/day (Ridderstråle 2014). Metformin was given in doses of 1000 mg/day to 1500 mg/day or more.
Primary outcomes
All‐cause mortality
Four trials reported that a total of 32 participants died: in the M+S group 13/2107 (0.6%) participants died compared with 19/3027 (0.6%) participants in the metformin plus SGLT‐2 inhibitor group (RR 0.96, 95% CI 0.44 to 2.09; P = 0.91; 4 trials; 5134 participants; very low‐certainty evidence; Analysis 8.1). The 95% prediction interval ranged between 0.17 and 5.30.
8.1. Analysis.
Comparison 8 Metformin plus sulphonylurea vs metformin plus SGLT‐2 inhibitor, Outcome 1 All‐cause mortality.
Because all trials were published in English, we could not perform sensitivity analyses according to publication status or language of publication. We could not perform sensitivity analysis according to trials with low risk of selection bias because all trials were evaluated as low risk of selection bias. Sensitivity analysis excluding long trials did not substantially change the effect estimate (RR 0.72, 95% CI 0.30 to 1.76; P = 0.47; 3 trials; 4320 participants). One trial reported data for 104 weeks (Ridderstråle 2014). We could not perform sensitivity analysis excluding large trials because all trials randomised fewer than 1000 participants to each intervention group. We could not perform sensitivity analysis excluding trials funded by a pharmaceutical company because all trials received funding from a pharmaceutical company.
TSA showed that 1.04% of the diversity‐adjusted required information size to detect or reject a 10% RRR had been accrued. Diversity was 0%. As only a minor fraction of the diversity‐adjusted required information size to detect or reject a 10% RRR had been accrued, we could not calculate the TSA‐adjusted 95% CI.
Health‐related quality of life
None of the included trials reported on this outcome.
Serious adverse effects
Four trials reported that a total of 690 participants experienced a serious adverse event: in the M+S group 315/2107 (15.5%) participants had a serious adverse event compared with 375/3027 (12.4%) participants in the metformin plus SGLT‐2 inhibitor group (RR 1.02, 95% CI 0.76 to 1.37; P = 0.90; 4 trials; 5134 participants; very low‐certainty evidence; Analysis 8.2). The 95% prediction interval ranged between 0.30 and 3.51.
8.2. Analysis.
Comparison 8 Metformin plus sulphonylurea vs metformin plus SGLT‐2 inhibitor, Outcome 2 Serious adverse events.
Because all trials were published in English, we could not perform sensitivity analyses according to publication status or language of publication. We could not perform sensitivity analysis according to trials with low risk of selection bias because all trials were evaluated as low risk of selection bias. Sensitivity analysis excluding long trials did not substantially change the effect estimate (RR 0.93, 95% CI 0.35 to 2.49; P = 0.88; 2 trials; 2775 participants). We could not perform sensitivity analysis excluding large trials because all trials randomised fewer than 1000 participants to each intervention group. We could not perform sensitivity analysis excluding trials funded by a pharmaceutical company because all trials received funding from a pharmaceutical company.
TSA showed that 12.4% of the diversity‐adjusted required information size to detect or reject a 10% RRR had been accrued. Diversity was 78%. The TSA‐adjusted 95% CI was 0.31 to 3.36.
Secondary outcomes
Cardiovascular mortality
Three trials reported that a total of 10 participants died due to cardiovascular disease: in the M+S group 4/1327 (0.3%) participants died compared with 6/2262 (0.3%) participants in the metformin plus SGLT‐2 inhibitor group (RR 1.22, 95% CI 0.33 to 4.41; P = 0.77; 3 trials; 3589 participants; very low‐certainty evidence; Analysis 8.3). Calculation of the 95% prediction interval did not provide a meaningful estimate.
8.3. Analysis.
Comparison 8 Metformin plus sulphonylurea vs metformin plus SGLT‐2 inhibitor, Outcome 3 Cardiovascular mortality.
Because all trials were published in English, we could not perform sensitivity analyses according to publication status or language of publication. We could not perform sensitivity analysis according to trials with low risk of selection bias because all trials were evaluated as low risk of selection bias. Sensitivity analysis excluding long trials did not substantially change the effect estimate (RR 1.02, 95% CI 0.25 to 4.18; P = 0.98; 2 trials; 2775 participants). We could not perform sensitivity analysis excluding large trials because all trials randomised fewer than 1000 participants to each intervention group. We could not perform sensitivity analysis excluding trials funded by a pharmaceutical company because all trials received funding from a pharmaceutical company.
TSA showed that 0.36% of the diversity‐adjusted required information size to detect or reject a 10% RRR had been accrued. Diversity was 0%. As only a minor fraction of the diversity‐adjusted required information size to detect or reject a 10% RRR had been accrued, we could not calculate the TSA‐adjusted 95% CI.
Non‐fatal myocardial infarction
Two trials reported that a total of 15 participants experienced a non‐fatal myocardial infarction: in the M+S group 7/890 (0.8%) participants had a non‐fatal myocardial infarction compared with 8/1374 (0.6%) participants in the metformin plus SGLT‐2 inhibitor group (RR 1.43, 95% CI 0.49 to 4.18; P = 0.52; 2 trials; 2264 participants; very low‐certainty evidence; Analysis 8.4).
8.4. Analysis.
Comparison 8 Metformin plus sulphonylurea vs metformin plus SGLT‐2 inhibitor, Outcome 4 Non‐fatal myocardial infarction.
We could not perform sensitivity analyses due to lack of data.
TSA showed that 0.46% of the diversity‐adjusted required information size to detect or reject a 10% RRR had been accrued. Diversity was 0%. As only a minor fraction of the diversity‐adjusted required information size to detect or reject a 10% RRR had been accrued, we could not calculate the TSA‐adjusted 95% CI.
Heart failure
Three trials reported that a total of four participants developed heart failure: in the M+S group 4/1670 (0.2%) participants developed heart failure compared with 0/2139 participant in the metformin plus SGLT‐2 inhibitor group (Peto OR 9.21, 95% CI 1.26 to 67.24; P = 0.03; 3 trials; 3809 participants; Analysis 8.5).
8.5. Analysis.
Comparison 8 Metformin plus sulphonylurea vs metformin plus SGLT‐2 inhibitor, Outcome 5 Heart failure.
Because all trials were published in English, we could not perform sensitivity analyses according to publication status or language of publication. We could not perform sensitivity analysis according to trials with low risk of selection bias because all trials were evaluated as low risk of selection bias. Sensitivity analysis excluding long trials did not substantially change the effect estimate but widened the CI (Peto OR 11.84, 95% CI 0.68 to 205.34; P = 0.09; 2 trials; 2264 participants). We could not perform sensitivity analysis excluding large trials because all trials randomised fewer than 1000 participants to each intervention group. We could not perform sensitivity analysis excluding trials funded by a pharmaceutical company because all trials received funding from a pharmaceutical company.
None of the participants in the comparator group (metformin plus SGLT‐2 inhibitor) developed heart failure. TSA could therefore not be performed as it was not possible to calculate an event rate in the comparator group. However, applying 0.5 events in each of the trials in the comparator group showed that 10.9% of the diversity‐adjusted required information size to detect or reject a 10% RRR had been accrued. Diversity was 0%. The TSA‐adjusted 95% CI did not provide a meaningful estimate.
Non‐fatal stroke
Two trials reported that a total of 10 participants experienced a non‐fatal stroke: in the M+S group 3/919 (0.3%) participants had a non‐fatal stroke compared with 7/1856 (0.4%) participants in the metformin plus SGLT‐2 inhibitor group (RR 0.87, 95% CI 0.22 to 3.34; P = 0.83; 2 trials; 2775 participants; very low‐certainty evidence; Analysis 8.6).
8.6. Analysis.
Comparison 8 Metformin plus sulphonylurea vs metformin plus SGLT‐2 inhibitor, Outcome 6 Non‐fatal stroke.
We could not perform sensitivity analyses due to lack of data.
TSA showed that 0.37% of the diversity‐adjusted required information size to detect or reject a 10% RRR had been accrued. Diversity was 0%. As only a minor fraction of the diversity‐adjusted required information size to detect or reject a 10% RRR had been accrued, we could not calculate the TSA‐adjusted 95% CI.
Amputation of lower extremity
Hollander 2017 reported one amputation of lower extremity in 437 (0.2%) participants in the M+S group compared with one amputation in 888 (0.1%) participants in the metformin plus SGLT‐2 inhibitor group (very low‐certainty evidence, Analysis 8.7).
8.7. Analysis.
Comparison 8 Metformin plus sulphonylurea vs metformin plus SGLT‐2 inhibitor, Outcome 7 Amputation of lower extremity.
Blindness or severe vision loss
None of the included trials reported on this outcome.
End‐stage renal disease
None of the included trials reported on this outcome.
Non‐serious adverse events
Three trials reported that a total of 2284 participants had non‐serious adverse events: in the M+S group 1139/1670 (68.2%) participants experienced a non‐serious adverse event compared with 1145/2139 (53.5%) participants in the metformin plus SGLT‐2 inhibitor group (RR 1.27, 95% CI 1.01 to 1.59; P = 0.04; 3 trials; 3809 participants; Analysis 8.8; in favour of metformin plus SGLT‐2 inhibitor). The 95% prediction interval ranged between 0.07 and 23.77. None of the trials provided a detailed definition of this outcome measure.
8.8. Analysis.
Comparison 8 Metformin plus sulphonylurea vs metformin plus SGLT‐2 inhibitor, Outcome 8 Non‐serious adverse events.
Because all trials were published in English, we could not perform sensitivity analyses according to publication status or language of publication. We could not perform sensitivity analysis according to trials with low risk of selection bias because all trials were evaluated as low risk of selection bias. Sensitivity analysis excluding long trials did not substantially change the direction of the effect estimate (RR 1.38, 95% CI 1.06 to 1.80; P = 0.02; 2 trials; 2264 participants). We included one trial with a duration of intervention longer than 104 weeks of treatment in the analysis because they reported data for non‐serious adverse events after 52 weeks of treatment (Del Prato 2015). We could not perform sensitivity analysis excluding large trials because all trials randomised fewer than 1000 participants to each intervention group. We could not perform sensitivity analysis excluding trials funded by a pharmaceutical company because all trials received funding from a pharmaceutical company.
TSA showed that 6.2% of the diversity‐adjusted required information size to detect or reject a 10% RRR had been accrued. Diversity was 96%. The TSA‐adjusted 95% CI was 0.53 to 3.01.
Hypoglycaemia
Three trials reported that a total of 603 participants experienced mild or moderate hypoglycaemia: in the M+S group 514/1670 (30.8%) participants had a mild or moderate hypoglycaemic episode compared with 89/1639 (5.4%) participants in the metformin plus SGLT‐2 inhibitor group (RR 5.60, 95% CI 2.38 to 13.14; P < 0.001; 3 trials; 3309 participants; Analysis 8.9; in favour of metformin plus SGLT‐2 inhibitor). Calculation of the 95% prediction interval did not provide a meaningful estimate.
8.9. Analysis.
Comparison 8 Metformin plus sulphonylurea vs metformin plus SGLT‐2 inhibitor, Outcome 9 Mild/moderate hypoglycaemia.
Because all trials were published in English, we could not perform sensitivity analyses according to publication status or language of publication. We could not perform sensitivity analysis according to trials with low risk of selection bias because all trials were evaluated as low risk of selection bias. We could not perform sensitivity analysis excluding long trials due to lack of data. We could not perform sensitivity analysis excluding large trials because all trials randomised fewer than 1000 participants to each intervention group. We could not perform sensitivity analysis excluding trials funded by a pharmaceutical company because all trials received funding from a pharmaceutical company.
TSA showed that 0.44% of the diversity‐adjusted required information size to detect or reject a 10% RRR had been accrued. Diversity was 93%. As only a minor fraction of the diversity‐adjusted required information size to detect or reject a 10% RRR had been accrued, we could not calculate the TSA‐adjusted 95% CI.
Four trials reported that a total of 38 participants had serious hypoglycaemia: in the M+S group 30/2107 (1.4%) participants had a serious hypoglycaemic episode compared with 8/3027 (0.3%) participants in the metformin plus SGLT‐2 inhibitor group (RR 6.16, 95% CI 2.92 to 12.97; P < 0.001; 4 trials; 5134 participants; Analysis 8.10; in favour of metformin plus SGLT‐2 inhibitor). The 95% prediction interval ranged between 1.20 and 31.58. For one of the trials included in the meta‐analysis, the number of serious hypoglycaemic events was unclear due to varied reporting (Leiter 2015). We contacted the trial authors for clarification but did not receive a reply. To be sure to have included all serious hypoglycaemic events, we extracted the highest number of serious hypoglycaemic events reported.
8.10. Analysis.
Comparison 8 Metformin plus sulphonylurea vs metformin plus SGLT‐2 inhibitor, Outcome 10 Serious hypoglycaemia.
Because all trials were published in English, we could not perform sensitivity analyses according to publication status or language of publication. We could not perform sensitivity analysis according to trials with low risk of selection bias because all trials were evaluated as low risk of selection bias. Sensitivity analysis excluding long trials did not substantially change the effect estimate (RR 6.39, 95% CI 2.89 to 14.12; P < 0.001; 2 trials; 2775 participants). We could not perform sensitivity analysis excluding large trials because all trials randomised fewer than 1000 participants to each intervention group. We could not perform sensitivity analysis excluding trials funded by a pharmaceutical company because all trials received funding from a pharmaceutical company.
TSA showed that 0.56% of the diversity‐adjusted required information size to detect or reject a 10% RRR had been accrued. Diversity was 0%. As only a minor fraction of the diversity‐adjusted required information size to detect or reject a 10% RRR had been accrued, we could not calculate the TSA‐adjusted 95% CI.
Socioeconomic effects
One trial performed three economic analyses of trial data using the Cardiff Diabetes Model (Del Prato 2015). One economic analysis aimed to assess the cost‐effectiveness of SGLT‐2 inhibitor compared with sulphonylurea when added to metformin for treatment of people in the UK with diabetes mellitus inadequately controlled on metformin alone. There was a mean incremental benefit of 0.47 quality‐adjusted life years (95% CI 0.42 to 0.67), calculated for dapagliflozin plus metformin, the incremental cost‐effectiveness ratio point estimate was GBP 2671 per quality‐adjusted life year.
Another economic analysis aimed to assess the cost‐effectiveness of SGLT‐2 inhibitor compared with sulphonylurea when added to metformin for treatment of Nordic people with diabetes mellitus inadequately controlled on metformin alone. The mean lifetime gain in quality‐adjusted life years for metformin plus dapagliflozin compared to M+S was 0.25 in Denmark, 0.27 in Finland, 0.24 in Norway and 0.28 in Sweden. The cost per quality‐adjusted life year gained was EUR 7944 in Denmark, EUR 5424 in Finland, EUR 4769 in Norway and EUR 6093 in Sweden.
The third economic analysis aimed to assess the cost‐effectiveness of SGLT‐2 inhibitor compared with sulphonylurea when added to metformin for treatment of Spanish people with diabetes mellitus inadequately controlled on metformin alone. Dapagliflozin was a cost‐effective option compared with sulphonylureas and resulted in a cost per quality‐adjusted life year gained of EUR 3560.
Additional explorative outcomes
Weight
Three trials reported weight change (MD 4.4 kg, 95% CI 4.1 to 4.8; P < 0.001; 3 trials; 3294 participants; Analysis 8.11; in favour of metformin plus SGLT‐2 inhibitor). The 95% prediction interval ranged between 2.7 kg and 7.3 kg.
8.11. Analysis.
Comparison 8 Metformin plus sulphonylurea vs metformin plus SGLT‐2 inhibitor, Outcome 11 Weight change.
HbA1c
Four trials reported HbA1c (random MD 0.1%, 95% CI −0.1 to 0.2; P = 0.26; fixed MD 0.1%, 95% CI 0.02 to 0.1; P = 0.005; 4 trials; 4182 participants; Analysis 8.12; in favour of metformin plus SGLT‐2 inhibitor). There was substantial heterogeneity, probably caused by various durations of intervention. For one trial (Hollander 2017), we extracted data after 52 weeks of treatment showing benefit of sulphonylurea treatment, whereas for the remaining trials we extracted data after 104 weeks or more showing benefit of SGLT‐2 inhibitor treatment. Furthermore, heterogeneity could have been caused by various sulphonylureas (glipizide and glimepiride) administered in various doses (1 mg/day to 8 mg/day) and various SGLT‐2 inhibitors (dapagliflozin, ertugliflozin, canagliflozin, empagliflozin).
8.12. Analysis.
Comparison 8 Metformin plus sulphonylurea vs metformin plus SGLT‐2 inhibitor, Outcome 12 Change in HbA1c.
Subgroup analyses
We only performed subgroup analyses on M+S combination therapy versus the combination of metformin plus DPP‐4 inhibitor and metformin plus thiazolidinediones (see above). The remaining combination comparators did not include enough trials to perform subgroup analyses.
We performed subgroup analyses for the comparison of M+S versus metformin plus thiazolidinediones dividing trials into studies investigating rosiglitazone or pioglitazone; see Analysis 5.1 to Analysis 5.14.
We performed subgroup analyses on trials with a long duration (two years and more) versus trials with a short duration (shorter than two years); see Analysis 6.1 to Analysis 6.11.
6.11. Analysis.
Comparison 6 Metformin plus sulphonylurea vs metformin plus thiazolidinedione (subgroups duration of intervention), Outcome 11 Change in HbA1c.
We did not perform a subgroup analysis on trials including obese participants (BMI ≥ 30) versus trials including non‐obese participants (BMI < 30) due to similar BMIs among the included trials.
Sensitivity analyses
We planned to perform sensitivity analyses for the following factors.
Published trials
Language of publication
Analysis restricted to trials with low risk of selection bias
Long trials (trials with duration of intervention longer than 104 weeks excluded)
Large trials (trials with more than 1000 participants randomised to each intervention group excluded).
Source of funding (trials funded by a pharmaceutical company excluded).
We did not perform sensitivity analysis on diagnostic criteria (often not reported), country (mostly performed in multiple countries) and imputation.
Assessment of reporting bias
We did not draw funnel plots due to limited number of trials for a particular outcome (maximum N = 8).
Ongoing trials
We identified nine ongoing RCTs, which potentially will provide data of interest for this review ( EUCTR2011‐003335‐63‐IT; EUCTR2012‐000152‐34‐IT; JPRN‐UMIN000008815; NCT01243424; NCT01794143; NCT02142309; NCT02730377; NCT02769481; NCT03332771). The ongoing trials will include about 15,147 participants. All ongoing trials assessed one or more outcomes of interest for our review.
Studies awaiting classification
We classified two trials as 'studies awaiting classification'. One trial (Müller‐Wieland 2018), was only published shortly before the publication of this review and one trial (NCT02564926), was submitted in January 2019 but results are not yet publicly available. Both trials compared M+S with metformin plus SGLT‐2 inhibitors. The trials included 1484 participants. Neither trial reports outcomes relevant for Table 1.
Discussion
Summary of main results
This Cochrane Review investigated the effects of M+S combination therapy compared with metformin plus another pharmacological glucose‐lowering intervention, placebo or metformin monotherapy in people with T2DM. We included 32 trials with a total of 28,746 randomised participants. We judged all trials to have unclear or high risk of bias in one or more 'Risk of bias' domains. The amount of evidence on patient‐important outcomes was limited. The use of M+S neither revealed a clear advantage nor a disadvantage for the outcome measures specified in the 'Summary of findings' table of this review. However, there were fewer hypoglycaemic episodes when comparing M+S with all other metformin plus another glucose‐lowering combination therapies. In two cases (M+S versus metformin plus placebo, M+S versus metformin plus DPP‐4 inhibitor), hypoglycaemia was reduced in the comparator groups and at the same time HbA1c was improved in the M+S group (Table 4). In three cases (M+S versus metformin plus thiazolidinedione, M+S versus metformin plus glinide, M+S versus metformin plus SGLT‐2 inhibitor), there were both improved HbA1c values and fewer hypoglycaemic episodes in the comparator groups (Table 4). One has to take into account that the risk of hypoglycaemia increases with low glucose level targets which may not apply to the majority of elderly people with diabetes (ADA 2019).
3. Overview of HbA1c and hypoglycaemia across comparisons.
| Comparison | Better HbA1c for M+S | Better HbA1c for comparator | Less hypoglycaemia for M+S | Less hypoglycaemia for comparator |
| M+S vs metformin + placebo | Yes | No | No | Yes: mild or moderate episodes |
| M+S vs metformin + GLP‐1 agonist | No | No | No | Yes: mild or moderate episodes |
| M+S vs metformin + DPP‐4 inhibitor | Yes | No | No | Yes: mild or moderate and serious episodes |
| M+S vs metformin + thiazolidinedione | No | Yes | No | Yes: mild or moderate and serious episodes |
| M+S vs metformin + glinide | No | Yes | No | Yes: mild or moderate episodes |
| M+S vs metformin + SGLT‐2 inhibitor | No | Yes | No | Yes: mild or moderate and serious episodes |
DPP4‐I: dipeptidyl‐peptidase 4; GLP‐1: glucagon‐like peptide‐1 agonist; HbA1c: glycosylated haemoglobin A1c; M+S: metformin + sulphonylurea; SGLT‐2: sodium‐glucose transport 2
Overall completeness and applicability of evidence
We conducted an extensive search for trials, including publications in all languages, and tried to obtain additional data on all trials. Handsearching of systematic reviews and reference lists identified two additional trials to be included (Gerich 2005; Ristic 2007). Handsearching of manufacturers' websites identified eight additional references to be included. For all trials, we contacted one or more trial authors to obtain supplemental information on 'Risk of bias' domains and outcomes. In addition, we asked trial authors about any additional information about the retrieved trial(s) and to specify whether further trials existed that we may had missed. Six trial investigators of 10 trials either just confirmed a question or provided additional data that could be implemented for the 'Risk of bias' assessment or the meta‐analyses of outcomes (Dei Cas 2017; Derosa 2005; Derosa 2009b; Derosa 2011a; Derosa 2011b; Gallwitz 2012a; Gallwitz 2012b; Göke 2013; Home 2009; Vaccaro 2017). For all trials, we identified contact information for one or more authors.
The diagnosis of T2DM was primary established using the European Association for the Study of Diabetes (EASD), World Health Organization (WHO) and American Diabetes Association (ADA) definitions. Nineteen trials did not specify how they established diagnosis of T2DM (Ahrén 2014; Charbonnel 2005; Del Prato 2014; Del Prato 2015; Filozof 2010; Gallwitz 2012b; Gerich 2005; Göke 2013; Handelsman 2017; Leiter 2015; Matthews 2010; Nauck 2013; Petrica 2009; Petrica 2011; Ridderstråle 2014; Ristic 2007; Schernthaner 2015; Seck 2010; Vaccaro 2017). The included trials used different types of sulphonylureas; 16 trials administered a second‐generation sulphonylurea and 16 trials administered a third‐generation sulphonylurea.
A potential selection bias within the trials may exist as more healthy and motivated people are expected to participate in a clinical trial. However, one Cochrane systematic review observed that clinical outcomes in people participating in RCTs are comparable to outcomes in comparable individuals outside RCTs (Vist 2008).
Quality of the evidence
None of the 32 included trials in our review was classified as having low risk of bias in all 'Risk of bias' domains. The description of randomisation and allocation in the included trials was insufficient in eight trials (Ahrén 2014; Del Prato 2014; Filozof 2010; Gerich 2005; Matthews 2010; NCT00367055; Petrica 2009; Petrica 2011). Eleven trials had insufficient reporting of one or more outcomes of relevance for our review and, therefore, we classified them as having high risk of bias for selective outcome reporting bias (Derosa 2005; Derosa 2009a; Derosa 2009b; Derosa 2010; Derosa 2011a; Derosa 2011b; Filozof 2010; Gerich 2005; Maffioli 2013; Petrica 2009; Petrica 2011). We were able to assess one or more of our predefined outcomes in all the included trials.
For all the comparisons, we judged the certainty of the evidence to be low or very low mainly because of very limited data, various risk of bias and imprecision.
Most trials received financial funding from the pharmaceutical industry. It is known that trials receiving funding or provision of free drugs or devices from a pharmaceutical company show more favourable results and conclusions compared to trials sponsored by other sources (Lundh 2017).
Potential biases in the review process
We were unable to draw funnel plots to assess small‐study bias due to lack of data. If more data had been available and more meta‐analyses could have been performed, we would have been able to investigate heterogeneity in more detail.
We were dealing with a substantially heterogeneous group of trials. Our meta‐analyses, when performed, were limited by the inability to use individual participant data to assess whether distinct clinical characteristics may have influenced the effect estimates of the interventions. We explored heterogeneity by performing sensitivity and subgroup analyses. However, due to a limited number of trials we only performed subgroup analyses on M+S versus metformin plus DPP‐4 inhibitor and M+S versus metformin plus thiazolidinedione. Many of the included trials were not designed or powered to detect our predefined patient‐important outcomes.
Most of the included trials had a relatively small number of participants and the information sizes in the meta‐analyses were equally small. This increases the risk of unrealistic estimates of the intervention effects due to bias (systematic errors) and chance (random errors) (Wetterslev 2008; Wood 2008). We have attempted to address systematic errors. We contacted all trial authors for clarification if one of the bias domains was not adequately reported. To reduce the risk of random errors, we conducted TSA on all predefined outcomes, whenever possible.
Several trials were published in more than one publication, which made it difficult for us to separate the primary publication from companion papers for some trials (for details, see Included studies).
We included trials with a minimum duration of 52 weeks to detect clinically relevant differences for the predefined outcomes. Unfortunately, the reporting of patient‐relevant outcomes in the included trials was poor.
Two review authors carried out data extraction. However, the review authors extracting the data were not blinded as to which trial they were extracting data from.
Agreements and disagreements with other studies or reviews
In the search for additional trials we checked other reviews, systematic reviews and meta‐analyses (Amate 2015; Andersen 2016; Aylsworth 2014; Belsey 2008; Chan 2015; Dai 2014; Foroutan 2016; Geng 2015; Goring 2014; Gu 2015; Guthrie 2015; Hershon 2016; Hou 2015; Kuecker 2016; Lim 2015; Liu 2014; Maruthur 2016; Mearns 2015; Mishriky 2015; Monami 2008; Phung 2010; Phung 2014; Rosenstock 2013; Sharma 2017; Varvaki 2016; Wang 2017; Whalen 2015; Zhou 2015; Zintzaras 2014). Because we primarily intended to investigate patient‐important outcomes we only included trials with a minimum duration of intervention of 52 weeks. However, all but three reviews (Goring 2014; Rosenstock 2013; Varvaki 2016), included trials with a duration of intervention less than 52 weeks or did not describe the duration of intervention in the included trials. Furthermore, all but seven reviews (Amate 2015; Foroutan 2016; Hershon 2016; Maruthur 2016; Rosenstock 2013; Varvaki 2016; Wang 2017), focused on outcomes such as glycaemic control, weight, lipids etc. One review (Rosenstock 2013), and one systematic review (Varvaki 2016), only included trials with a duration of intervention of 52 weeks and more, and focused on patient‐important outcomes. These reviews did not suggest an increased risk of cardiovascular events, all‐cause mortality or cardiovascular mortality, comparing M+S with metformin plus another glucose‐lowering drug. Several of the reviews and systematic reviews investigated exclusively M+S vs metformin plus a DPP‐4 inhibitor (Amate 2015; Foroutan 2016; Gu 2015; Hou 2015; Mishriky 2015; Sharma 2017; Wang 2017; Zhou 2015). One systematic review and meta‐analysis compared M+S with other metformin combination therapies as one group (Varvaki 2016). To our knowledge, our review is the first to investigate patient‐important outcomes in long‐term trials (defined as 52 weeks and more) looking at M+S compared to metformin plus another glucose‐lowering interventions separately.
Authors' conclusions
Implications for practice.
There is no firm evidence whether metformin plus sulphonylurea combination compared with metformin plus another glucose‐lowering agent or metformin monotherapy increases benefit or harm for most patient‐important outcomes (all‐cause mortality, serious adverse events, macrovascular complications (cardiovascular mortality, non‐fatal myocardial infarction, non‐fatal stroke) and microvascular complications (amputation of lower extremity, blindness or severe vision loss, end‐stage renal disease)). There were more reported hypoglycaemic episodes with metformin plus sulphonylurea combination in comparison to all other metformin‐antidiabetic agent combinations. The risk of hypoglycaemia increases with low glucose level targets which may not apply to the majority of elderly people with diabetes. There were no trials comparing metformin plus sulphonylurea with metformin plus insulin. We identified nine ongoing trials and two trials are awaiting assessment. Together these trials will include around 16,631 participants and could have an impact on the findings of our review.
Implications for research.
It remains to be clarified whether there are any substantial beneficial or harmful effects of metformin plus sulphonylurea in people with type 2 diabetes mellitus. Several ongoing trials with around 15,147 participants are investigating this topic and each trial will provide data on one or more outcomes of interest for our review. Trial completion dates are estimated between 2018 and 2021. Furthermore two trials with 1484 participants investigating metformin plus sulphonylurea compared with metformin plus SGLT‐2 inhibitors are awaiting assessment. Future long‐term randomised controlled trials should focus on patient‐important outcomes (especially mortality, health‐related quality of life, serious adverse events, macrovascular and microvascular complications).
Notes
Portions of the background and methods sections, the appendices, additional tables and figures 1 to 3 of this review are based on a standard template established by Cochrane Metabolic and Endocrine Disorders.
Acknowledgements
We would like to thank Olga Kurbatova for screening a trial published in Russian for inclusion/exclusion (Onuchin 2010). We would like to thank Alessandra Dei Cas for providing data on the Dei Cas 2017 trial, Pamela Maffioli for providing data on the Derosa 2005 trial, Philip Home for providing data on the Home 2009 trial, Olga Vaccaro for providing data on the Vaccaro 2017 trial, Baptist Gallwitz for answering questions regarding the Gallwitz 2012a and Gallwitz 2012b trials and Ingrid Gause‐Nilsson for answering questions regarding the Göke 2013 trial.We thank peer reviewer Peter T. Sawicki for his valuable comments and contribution to our review. We thank Denise Mitchell for her excellent copy‐editing of our review. Kasper Madsen thanks the Department of Endocrinology, Diabetes and Bone‐Metabolic Research Unit, Rigshospitalet, for providing office facilities and great colleagues.
Appendices
Appendix 1. Search strategies
| MEDLINE (Ovid SP) |
| 1. exp Diabetes Mellitus, Type 2/ 2. (MODY or NIDDM or T2D*).tw. 3. (non insulin* depend* or noninsulin* depend* or noninsulin?depend* or non insulin?depend*).tw. 4. ((typ? 2 or typ? II or typ?2 or typ?II) adj3 diabet*).tw. 5. (((late or adult* or matur* or slow or stabl*) adj3 onset) and diabet*).tw. 6. or/1‐5 7. Metformin/ 8. metformin*.tw. 9. or/7‐8 10. exp Sulfonylurea Compounds/ 11. (sulfon?lurea* or sulphon?lurea*).tw. 12. (gl?benclamid* or glyburid* or HB 419 OR HB419 or HB 420 OR HB420).tw. 13. (gl?bornurid* or Ro 6 4563 or Ro 4563 or gluborid*).tw. 14. (glipizid* or gl?diazinamide or glypidizine or K 4024 or K4024 or melizide or napizide).tw. 15. (gliquidon* or AR DF 26 or ARDF 26 or ARDF26).tw. 16. (glisoxepid* or RP 22410 or BS 4231).tw. 17. gl?clopyramid*.tw. 18. (glimepirid* or HOE 490).tw. 19. (gl?clazid* or gl?cazid* or S 1702 or S1702 or S 852 OR S852).tw. 20. or/10‐19 21. 6 and 9 and 20 [22‐32: Cochrane Handbook 2008 RCT filter ‐ sensitivity max. version] 22. randomized controlled trial.pt. 23. controlled clinical trial.pt. 24. randomi?ed.ab. 25. placebo.ab. 26. drug therapy.fs. 27. randomly.ab. 28. trial.ab. 29. groups.ab. 30. or/22‐29 31. exp animals/ not humans/ 32. 30 not 31 33. 21 and 32 [34:Wong 2006a– systematic reviews filter – SensSpec version] 34. meta analysis.mp,pt. or review.pt. or search*.tw. 35. 21 and 34 36. 33 or 35 37. (2015* or 2016*).dc. 38. 36 and 37 39. ..dedup 38 |
| Cochrane Central Register of Controlled Trials (CENTRAL) via Cochrane Register of Studies Online (CRSO) |
| 1. MESH DESCRIPTOR Diabetes Mellitus, Type 2 EXPLODE ALL TREES 2. (MODY OR NIDDM OR T2D*):TI,AB,KY 3. (non insulin* depend* OR noninsulin* depend* OR noninsulin?depend* OR non insulin?depend*):TI,AB,KY 4. ((typ? 2 OR typ? II OR typ?2 OR typ?II) ADJ3 diabet*):TI,AB,KY 5. (((late OR adult* OR matur* OR slow OR stabl*) ADJ3 onset) AND diabet*):TI,AB,KY 6. #1 OR #2 OR #3 OR #4 OR #5 7. MESH DESCRIPTOR Metformin 8. metformin*:TI,AB,KY 9. #7 OR #8 10. MESH DESCRIPTOR Sulfonylurea Compounds EXPLODE ALL TREES 11. (sulfon?lurea* OR sulphon?lurea*):TI,AB,KY 12. (gl?benclamid* OR glyburid* OR HB 419 OR HB419 OR HB 420 OR HB420):TI,AB,KY 13. (gl?bornurid* OR Ro 6 4563 OR Ro 4563 OR gluborid*):TI,AB,KY 14. (glipizid* OR gl?diazinamide OR glypidizine OR K 4024 OR K4024 OR melizide OR napizide):TI,AB,KY 15. (gliquidon* OR AR DF 26 OR ARDF 26 OR ARDF26):TI,AB,KY 16. (glisoxepid* OR RP 22410 OR BS 4231):TI,AB,KY 17. gl?clopyramid*:TI,AB,KY 18. (glimepirid* OR HOE 490):TI,AB,KY 19. (gl?clazid* OR gl?cazid* OR S 1702 OR S1702 OR S 852 OR S852):TI,AB,KY 20. #10 OR #11 OR #12 OR #13 OR #14 OR #15 OR #16 OR #17 OR #18 OR #19 21. #6 AND #9 AND #20 22. 2015 TO 2016:YR 23. #21 AND #22 |
| Embase (Ovid SP) |
| 1. non insulin dependent diabetes mellitus/ 2. (MODY or NIDDM or T2D*).tw. 3. (non insulin* depend* or noninsulin* depend* or noninsulin?depend* or non insulin?depend*).tw. 4. ((typ? 2 or typ? II or typ?2 or typ?II) adj3 diabet*).tw. 5. (((late or adult* or matur* or slow or stabl*) adj3 onset) and diabet*).tw. 6. or/1‐5 7. Metformin/ 8. metformin*.tw. 9. or/7‐8 10. gliamilide/ or glibenclamide/ or glibornuride/ or glicaramide/ or gliclazide/ or glicondamide/ or gliflumide/ or glimepiride/ or glipalamide/ or glipentide/ or glipizide/ or gliquidone/ or glisamuride/ or glisolamide/ or glisoxepide/ or glucosulfa/ or glybuthiazol/ or glybuzole/ or glycyclamide/ or glyhexamide/ or glyoctamide/ or glyparamide/ or glypinamide/ or glyprothiazol/ or glysobuzole/ 11. (sulfon?lurea* or sulphon?lurea*).tw. 12. (gl?benclamid* or glyburid* or HB 419 OR HB419 or HB 420 OR HB420).tw. 13. (gl?bornurid* or Ro 6 4563 or Ro 4563 or gluborid*).tw. 14. (glipizid* or gl?diazinamide or glypidizine or K 4024 or K4024 or melizide or napizide).tw. 15. (gliquidon* or AR DF 26 or ARDF 26 or ARDF26).tw. 16. (glisoxepid* or RP 22410 or BS 4231).tw. 17. gl?clopyramid*.tw. 18. (glimepirid* or HOE 490).tw. 19. (gl?clazid* or gl?cazid* or S 1702 or S1702 or S 852 OR S852).tw. 20. or/10‐19 21. 6 and 9 and 20 [22: Wong 2006b "sound treatment studies" filter – BS version] 22. random*.tw. or clinical trial*.mp. or exp health care quality/ 23. 21 and 22 24. (2015* or 2016*).dd. 25. 23 and 24 26. conference*.pt. 27. 25 not 26 28. ..dedup 27 |
| ClinicalTrials.gov (Expert search) |
| INFLECT EXACT "Interventional" [STUDY‐TYPES] AND ( diabetes OR diabetic OR "type 2" OR "type II" OR T2D OR T2DM ) [DISEASE] AND ( (gliamilide OR glibenclamide OR glybenclamide OR glibornuride OR glybornuride OR glicaramide OR gliclazide OR glyclazide OR glicondamide OR gliflumide OR glimepiride OR glipalamide OR glipentide OR glipizide OR glydiazinamide OR glidiazinamide OR glypidizine OR melizide OR napidizide OR gliquidone OR glisamuride OR glisolamide OR glisoxepide OR glucosulfa OR glyburide OR glybuthiazol OR gluboride OR glybuzole OR glycyclamide OR glyhexamide OR glyoctamide OR glyparamide OR glypinamide OR glyprothiazol OR glysobuzole OR gliclopyramide OR glyclopyramide OR "HB 419" OR HB419 OR "HB 420" OR HB420 OR "Ro 6 4563" OR "Ro 4563" OR "K 4024" OR K4024 OR "AR DF 26" OR "ARDF 26" OR ARDF26 OR "RP 22410" OR "BS 4231" OR "HOE 490" OR "S 1702" OR S1702 OR "S 852" OR S852 OR sulfonylurea OR sulfonilurea OR sulfonylureas OR sulfonilureas OR sulphonylurea OR sulphonilurea OR sulphonylureas OR sulphonilureas) AND metformin ) [TREATMENT] |
| WHO International Clinical Trials Registry Platform (ICTRP) Search Portal (Standard search) |
| diabet* AND metformin* AND sulfon* OR diabet* AND metformin* AND sulphon* OR diabet* AND metformin* AND glibenclamid* OR diabet* AND metformin* AND glybenclamid* OR diabet* AND metformin* AND glyburid* OR diabet* AND metformin* AND glipizid* OR diabet* AND metformin* AND glimepirid* OR diabet* AND metformin* AND gliclazid* OR T2D* AND metformin* AND sulfon* OR T2D* AND metformin* AND sulphon* OR T2D* AND metformin* AND glibenclamid* OR T2D* AND metformin* AND glybenclamid* OR T2D* AND metformin* AND glyburid* OR T2D* AND metformin* AND glipizid* OR T2D* AND metformin* AND glimepirid* OR T2D* AND metformin* AND gliclazid* |
Appendix 2. 'Risk of bias' assessment
| 'Risk of bias' domains |
|
Random sequence generation (selection bias due to inadequate generation of a randomised sequence) For each included trial, we will describe the method used to generate the allocation sequence in sufficient detail to allow an assessment of whether it should produce comparable groups.
Allocation concealment (selection bias due to inadequate concealment of allocation prior to assignment) We will describe for each included trial the method used to conceal allocation to interventions prior to assignment and we will assess whether intervention allocation could have been foreseen in advance of or during recruitment or changed after assignment.
We will also evaluate trial baseline data to incorporate assessment of baseline imbalance into the 'Risk of bias' judgement for selection bias (Corbett 2014). Chance imbalances may also affect judgements on the risk of attrition bias. In the case of unadjusted analyses, we will distinguish between trials that we rate as being at low risk of bias on the basis of both randomisation methods and baseline similarity, and trials that we judge as being at low risk of bias on the basis of baseline similarity alone (Corbett 2014). We will reclassify judgements of unclear, low, or high risk of selection bias as specified in Appendix 3. Blinding of participants and study personnel (performance bias due to knowledge of the allocated interventions by participants and personnel during the trial) We will evaluate the risk of detection bias separately for each outcome (Hróbjartsson 2013). We will note whether endpoints were self‐reported, investigator‐assessed, or adjudicated outcome measures (see below).
Blinding of outcome assessment (detection bias due to knowledge of the allocated interventions by outcome assessment) We will evaluate the risk of detection bias separately for each outcome (Hróbjartsson 2013). We will note whether endpoints were self‐reported, investigator‐assessed, or adjudicated outcome measures (see below).
Incomplete outcome data (attrition bias due to quantity, nature or handling of incomplete outcome data) For each included trial or each outcome, or both, we will describe the completeness of data, including attrition and exclusions from the analyses. We will state whether the trial reported attrition and exclusions, and we will report the number of participants included in the analysis at each stage (compared with the number of randomised participants per intervention/comparator groups). We will also note if the trial reported the reasons for attrition or exclusion, and whether missing data were balanced across groups or were related to outcomes. We will consider the implications of missing outcome data per outcome such as high dropout rates (e.g. above 15%) or disparate attrition rates (e.g. difference of 10% or more between trial arms).
Selective reporting (reporting bias due to selective outcome reporting) We will assess outcome reporting bias by integrating the results of the appendix 'Matrix of trial endpoints (publications and trial documents)' (Boutron 2014; Jones 2015; Mathieu 2009), with those of the appendix 'High risk of outcome reporting bias according to the Outcome Reporting Bias In Trials (ORBIT) classification' (Kirkham 2010). This analysis will form the basis for the judgement of selective reporting.
Other bias
|
Appendix 3. Selection bias decisions
| Selection bias decisions for trials that reported unadjusted analyses: comparison of results obtained using method details alone versus results obtained using method details and trial baseline informationa | |||
| Reported randomisation and allocation concealment methods | 'Risk of bias' judgement using methods reporting | Information gained from study characteristics data | Risk of bias using baseline information and methods reporting |
| Unclear methods | Unclear risk | Baseline imbalances present for important prognostic variable(s) | High risk |
| Groups appear similar at baseline for all important prognostic variables | Low risk | ||
| Limited or no baseline details | Unclear risk | ||
| Would generate a truly random sample, with robust allocation concealment | Low risk | Baseline imbalances present for important prognostic variable(s) | Unclear riskb |
| Groups appear similar at baseline for all important prognostic variables | Low risk | ||
| Limited baseline details, showing balance in some important prognostic variablesc | Low risk | ||
| No baseline details | Unclear risk | ||
| Sequence is not truly randomised or allocation concealment is inadequate | High risk | Baseline imbalances present for important prognostic variable(s) | High risk |
| Groups appear similar at baseline for all important prognostic variables | Low risk | ||
| Limited baseline details, showing balance in some important prognostic variablesc | Unclear risk | ||
| No baseline details | High risk | ||
| aTaken from Corbett 2014; judgements highlighted in bold indicate situations in which the addition of baseline assessments would change the judgement about risk of selection bias compared with using methods reporting alone. bImbalance was identified that appears likely to be due to chance. cDetails for the remaining important prognostic variables are not reported. | |||
Appendix 4. Description of interventions
| Trial ID | Intervention(s) | Comparator(s) |
| Handelsman 2017 | Metformin + glimepiride + omarigliptin placebo Metformin dose ≥ 1500 mg/day + glimepiride titrated from 1‐6 mg/day based upon participants self‐monitoring blood‐glucose results. Omarigliptin placebo once weekly. "Patients who were on a maximum tolerated dose of glimepiride who did not meet progressively stricter pre‐specified glycaemic control criteria post‐randomisation (from day 1 through week 6, FPG > 14.99 mmol/L (270 mg/dL); after week 6 through week 12, FPG > 13.32 mmol/L (240 mg/dL); after week 12 through week 24, FPG > 11.1 mmol/L (200 mg/dL); after week 24 through week 54, (HbA1c > 8.0%) were rescued with open‐label insulin glargine, initiated as per the local country insulin glargine label" |
Metformin + omarigliptin + glimepiride placebo: metformin dose ≥ 1500 mg/day + omarigliptin 25 mg once weekly. Glimepiride placebo |
| Hollander 2017 | Metformin + glimepiride Metformin dose ≥ 1500 mg/day + glimepiride titrated from 1‐8 mg/day. "To manage both hyperglycaemia and hypoglycaemia, the dose of glimepiride/matching placebo was to be up‐ and/or down‐titrated throughout the study on the basis of glucose levels, and by the investigator’s clinical assessment of the glycaemic status." "Glycaemic rescue therapy with open‐label sitagliptin was prescribed for participants who met progressively more stringent glycaemic rescue criteria (FPG values consistently (repeat measurement performed within 7 days) > 15.0 mmol/L (270 mg/dL) after randomisation through week 6; > 13.3 mmol/L (240 mg/dL) after week 6 through week 12; > 11.1 mmol/L (200 mg/dL) after week 12 through week 26; > 11.1 mmol/L (200 mg/dL) or HbA1c > 64 mmol/mol (8.0%) after week 26). Rescued participants continued on their study medication and background metformin" |
Metformin + ertugliflozin C1: metformin dose ≥ 1500 mg/day + ertugliflozin 5 mg/day C2: metformin dose ≥ 1500 mg/day + ertugliflozin 15 mg/day "Glycemic rescue therapy with open‐label sitagliptin was prescribed for participants who met progressively more stringent glycaemic rescue criteria (FPG values consistently (repeat measurement performed within 7 days) > 15.0 mmol/L (270 mg/dL) after randomisation through week 6; > 13.3 mmol/L (240 mg/dL) after week 6 through week 12; > 11.1 mmol/L (200 mg/dL) after week 12 through week 26; > 11.1 mmol/L (200 mg/dL) or HbA1c > 64 mmol/mol (8.0%) after week 26). Rescued participants continued on their study medication and background metformin" |
| Vaccaro 2017 | Metformin + sulphonylurea (glibenclamide, gliclazide or glimepiride) "The metformin dose remains constant (2 g/day) throughout the study. The add‐on drugs will be up‐titrated at any follow‐up visit, if necessary, based on home glucose monitoring (i.e. fasting glucose > 120 mg/dL or post prandial glucose > 160 mg/dL in > 50% of the home glucose readings performed over the last 8 weeks period). Doses of 5‐15 mg for glibenclamide, 30‐120 mg for gliclazide and 2‐6 mg for glimepiride were used. If, despite the maximal daily dose of the drugs has been reached, blood glucose control is still unsatisfactory, adherence to treatments is assessed, lifestyle recommendations are reinforced and HbA1c is re‐evaluated after three months. A confirmed HbA1c > 8.0%, will lead to add on a bed‐time injection of basal insulin (glargine) and prandial rapid acting insulin boluses, if glucose control is still unsatisfactory. Insulin titration is performed according to a pre‐defined algorithm based on self‐monitored fasting capillary glucose" |
Metformin + pioglitazone "The metformin dose remains constant (2 g/day) throughout the study. The add‐on drugs will be up‐titrated at any follow‐up visit, if necessary, based on home glucose monitoring (i.e. fasting glucose > 120 mg/dL or post prandial glucose > 160 mg/dl in > 50% of the home glucose readings performed over the last 8‐week period). Doses of 15‐45 mg for pioglitazone were used. If, despite the maximal daily dose of the drugs has been reached, blood glucose control is still unsatisfactory, adherence to treatments is assessed, lifestyle recommendations are reinforced and HbA1c is re‐evaluated after three months. A confirmed HbA1c > 8.0%, will lead to add on a bed‐time injection of basal insulin (glargine) and prandial rapid acting insulin boluses, if glucose control is still unsatisfactory. Insulin titration is performed according to a pre‐defined algorithm based on self‐monitored fasting capillary glucose" |
| Dei Cas 2017 | Metformin + glibenclamide Maximum dose of metformin was 2500 mg/day, oral administration. Glibenclamide was 2.5 mg daily, but increased to 5 mg/day administered as 2.5 mg twice daily before breakfast and dinner. After 1 month glibenclamide was increased to maximum of 7.5 mg/day and at 4 months up to 5 mg twice daily in order to achieve preprandial glucose values between 4.4‐7.8 mmol/L and post‐prandial glucose ≤ 11.1 mmol/L. Oral administration |
Metformin + vildagliptin Maximum dose of metformin was 2500 mg/day, oral administration Vildaglitptin dose was 100 mg. No dose titration. Oral administration |
| Leiter 2015 | Metformin + glimepiride (tablet) Metformin ≥ 1500 mg/day + glimepiride 1 mg/day titrated to a maximum dose of 6 or 8 mg/day (on the basis of maximum approved dose in the country of the investigational site) after 2 or more weeks at the current dose if participants met protocol‐specified glycaemic criteria (i.e., ≥ 50% of fasting self monitored blood glucose readings > 6.0 mmol/L, with no hypoglycaemic events during the 2 weeks preceding clinic visit or telephone contact) |
Metformin + canagliflozin (tablet) C1: metformin ≥ 1500 mg/day + canagliflozin 100 mg/day C2: metformin ≥ 1500 mg/day + canagliflozin 300 mg/day Participants assigned to the canagliflozin groups were mock up‐titrated |
| Del Prato 2015 | Metformin + glipizide (capsule) Metformin 1500‐2500 mg/day split/twice daily + glipizide 5 mg/day (dosage level 1) once or split/twice daily. "During an 18‐week period and at 21‐day intervals, participants were up‐titrated to the next dosage level if FPG was ≥ 6.1 mmol/L. Level 2 was glipizide 10 mg/day and level 3 was glipizide 20 mg /day. Up‐titration continued until the maximum tolerable dose level was reached." "After the 18‐week titration period, participants entered a 34‐week maintenance period, during which no further up‐titration was allowed." "For the 52‐week, double‐blind extension period, one single attempt at up‐titration was allowed if HbA1c was > 7%, but only if the participant had not already reached the maximum dose." "For the 104‐week, double‐blind extension period, one single attempt at up‐titration was allowed if HbA1c was > 7%." "After the 18‐week titration period, participants entered a 34‐week maintenance period, during which no further up‐titration was allowed. Particpants could be down‐titrated to the preceding level or potentially down to level 0 (placebo for both arms) in the event of recurrent hypoglycaemia" |
Metformin + dapagliflozin (tablet) Metformin 1500‐2500 mg/day split/twice daily + dapagliflozin 2.5 mg/day (dosage level 1) once daily. "During an 18‐week period and at 21‐day intervals, participants were up‐titrated to the next dosage level if FPG was ≥ 6.1 mmol/L. Level 2 was dapagliflozin 5 mg/day and level 3 was dapagliflozin 10 mg/day. Up‐titration continued until the maximum tolerable dose level was reached." "After the 18‐week titration period, participants entered a 34‐week maintenance period, during which no further up‐titration was allowed." "For the 52‐week double‐blind extension period one single attempt at up‐titration was allowed if HbA1c was >7%, but only if the participant had not already reached the maximum dose." "For the 104 week double‐blind extension period one single attempt at up‐titration was allowed if HbA1c was >7%." "After the 18‐week titration period, participants entered a 34‐week maintenance period, during which no further up‐titration was allowed. Particpants could be down‐titrated to the preceding level or potentially down to level 0 (placebo for both arms) in the event of recurrent hypoglycaemia" |
| Schernthaner 2015 | Metformin + glimepiride (tablet) + placebo Metformin at any dose (baseline mean dose 1572 mg/day) + glimepiride 1 mg/day + placebo 5 mg. "During the titration period (12 weeks), glimepiride was up‐titrated every 3 weeks in 1 or 2 mg/day increments to the optimum dose (fasting plasma glucose ≤ 6.1 mmol/L), up to 6 mg once daily. During maintenance (40 weeks), no up‐titration was performed Glimepiride could be down‐titrated if recurrent hypoglycaemia occurred" |
Metformin + saxagliptin (tablet) + placebo Metformin at any dose (baseline mean dose 1647 mg/day) + saxagliptin 5 mg once daily + placebo 1‐6 mg/day. "During the titration period (12 weeks), placebo was up‐titrated every 3 weeks in 1 or 2 mg/day increments to the optimum dose (fasting plasma glucose ≤ 6.1 mmol/L), up to 6 mg once daily. During maintenance (40 weeks), no up‐titration was performed." "Placebo could be down‐titrated if recurrent hypoglycaemia occurred" |
| Del Prato 2014 | Metformin + glipizide (tablet): "Glipizide 5 mg, tablets, orally, once daily and the maximum tolerated dose of metformin (1500 mg to 3300 mg daily) for up to 104 weeks. After at least 2 weeks of treatment but prior to week 20, participants with persistent hyperglycaemia (fasting plasma glucose ≥ 250 mg/dL) underwent a dose titration of glipizide up to 20 mg in 5‐mg increments in 4‐week intervals" | Metformin + alogliptin (tablet) C1: metformin + alogliptin 12.5 mg (tablet): "Alogliptin 12.5 mg, tablets, orally, once daily and the maximum tolerated dose of metformin (1500 mg to 3300 mg daily) for up to 104 weeks" C2: metformin + alogliptin 25 mg: "Alogliptin 25 mg, tablets, orally, once daily and the maximum tolerated dose of metformin (1500 mg to 3300 mg daily) for up to 104 weeks" |
| Ahrén 2014 | Metformin + glimepiride (tablet): "Participants received glimepiride 2 mg daily (with masked up‐titration to 4 mg daily if required) plus metformin ≥1500 mg daily plus matching albiglutide placebo as a subcutaneous injection weekly via a fully disposable pen injector system plus matching sitagliptin placebo from week 1 to week 156" | C1: metformin + albiglutide (injection): "Participants received albiglutide 30 mg weekly (with masked up‐titration to 50 mg weekly if required) as a subcutaneous injection via a fully disposable pen injector system plus metformin ≥ 1500 mg daily plus matching sitagliptin placebo plus matching glimepiride placebo from week 1 to week 156" C2: metformin + sitagliptin (tablet): "Participants received sitagliptin 100 mg daily plus metformin ≥ 1500 mg daily plus matching albiglutide placebo as a subcutaneous injection weekly via a fully disposable pen injector system plus matching glimepiride placebo from week 1 to week 156" C3: metformin + placebo: "Participants received metformin ≥ 1500 milligrams (mg) daily plus matching albiglutide placebo as a subcutaneous injection weekly via a fully disposable pen injector system plus matching sitagliptin placebo plus matching glimepiride placebo from week 1 to week 156" |
| Ridderstråle 2014 | Metformin + glimepiride Metformin immediate release ≥ 1500 mg/day was continued at the participant's usual dose. "Glimepiride was initiated at a dose of 1 mg/day, with a recommendation for up‐titration if fasting plasma glucose (assessed with home monitoring) was > 6.1 mmol/L to 2 mg/day at week 4, 3 mg/day at week 8, and 4 mg/day at week 12. Uptitration was to be withheld if it would place the participant at risk of hypoglycaemia and was not to be done after week 12. Glimepiride dose could be down‐titrated at any time to prevent recurrent hypoglycaemia." "Rescue treatment could be initiated if, after an overnight fast, a participant had confirmed blood glucose concentrations of > 13.3 mmol/L during weeks 1–12, > 11.1 mmol/L during weeks 12–28, or > 10.0 mmol/L (or HbA1c concentration >8%) after week 28. The choice and dose of rescue medication were at the discretion of the investigator, but could not include a sulphonylurea drug or SGLT‐2 inhibitor" |
Metformin + empagliflozin: metformin immediate release ≥ 1500 mg/day was continued at the participant's usual dose. Empagliflozin 25 mg/day "Rescue treatment could be initiated if, after an overnight fast, a participant had confirmed blood glucose concentrations of > 13.3 mmol/L during weeks 1–12, > 11.1 mmol/L during weeks 12–28, or > 10.0 mmol/L (or HbA1c concentration > 8%) after week 28. The choice and dose of rescue medication were at the discretion of the investigator, but could not include a sulphonylurea drug or SGLT‐2 inhibitor" |
| Göke 2013 | Metformin + glipizide (tablet) Open‐label metformin at 1500, 2000, 2500 or 3000 mg daily based on individual metformin dose at enrolment for the duration of the study; the dose remained stable throughout the study. Glipizide was titrated to an optimal effect (FPG ≤ 110 mg/dL (≤ 6.1 mmol/L)) or the highest tolerated dose during an 18‐week titration period. "Glipizide was initiated at 5 mg/day (morning dose) and titrated in 3‐week intervals to a maximum of 20 mg/day using a double‐dummy technique to ensure blinding. Titration steps were 10 mg/day (morning dose), followed by 15 mg/day (10‐mg morning dose, 5‐mg evening dose) and 20 mg/day (10‐mg morning dose, 10‐mg evening dose). Initial titration assessment was at week 3; subsequent reassessment for titration occurred at weeks 6, 9, 12, 15 and 18. During the titration period, glipizide could be down‐titrated once if hypoglycaemic events occurred and could thereafter be up‐titrated once. Evaluation at each titration visit and final decision by the investigator on dose increase or decrease took into account participant glucose measurements made before visits, hypoglycaemic events recorded in the participant diary and investigator’s measurements at titration visits. Following the titration period, medication doses remained stable except for instances of glipizide down‐titration to mitigate recurrent hypoglycaemia at the discretion of the study investigator; no up‐titration was allowed." Study medication was taken orally, immediately before or with a meal |
Metformin + saxagliptin (tablet): open‐label metformin at 1500, 2000, 2500 or 3000 mg daily based on individual metformin dose at enrolment for the duration of the study; the dose remained stable throughout the study. Saxagliptin 5 mg daily throughout the study. Study medication was taken orally, immediately before or with a meal |
| Maffioli 2013 | Metfmormin + glibenclamide (tablet) 3‐month run‐in period with metformin 850 mg 3 x/day followed by 12 months of metformin 850 mg 3 x/day + glibenclamide 5 mg twice a day. For the last 6 months rosuvastatin 5 mg/day was added. "Patients were already following a controlled‐energy diet (almost 600 kcal daily deficit) on the basis of American Heart Association recommendations that included 50% of calories from carbohydrates, 30% from fat (6% saturated), and 20% from proteins, with a maximum cholesterol content of 300 mg/day and 35 g/day of fibre. Patients were not treated with vitamins or mineral preparations during the study. Standard diet advice was provided by a dietitian and/or a specialist doctor. The dietitian and/or specialist doctor periodically provided instructions on dietary intake recording procedures as part of a behavior modification program and then later used the patient’s food diaries for counselling. Individuals were also encouraged to increase their physical activity by walking briskly for 20–30 min, three to five times per week, or by cycling. The recommended changes in physical activity throughout the study were not assessed." |
Metfmormin + pioglitazone (tablet): 3‐month run‐in period with metformin 850 mg 3 x/day followed by 12 months of metformin 850 mg 3 x/day + pioglitazone 15 mg twice a day. For the last 6 months rosuvastatin 5 mg/day was added. "Patients were already following a controlled‐energy diet (almost 600 kcal daily deficit) on the basis of American Heart Association recommendations that included 50% of calories from carbohydrates, 30% from fat (6% saturated), and 20% from proteins, with a maximum cholesterol content of 300 mg/day and 35 g/day of fibre. Patients were not treated with vitamins or mineral preparations during the study. Standard diet advice was provided by a dietitian and/or a specialist doctor. The dietitian and/or specialist doctor periodically provided instructions on dietary intake recording procedures as part of a behavior modification program and then later used the patient’s food diaries for counselling. Individuals were also encouraged to increase their physical activity by walking briskly for 20–30 min, three to five times per week, or by cycling. The recommended changes in physical activity throughout the study were not assessed." |
| Nauck 2013 | Metformin + glimepiride (oral) Metformin 1500‐2000 mg/day (taken in the morning and in the evening) + glimepiride up to 4 mg (once daily in the morning) + liraglutide placebo (injected subcutaneously once daily at any time of the day in the upper arm, abdomen, or thigh using a pen injector device. Participants were encouraged to inject liraglutide placebo at the same time each day. 26‐week double‐blind + 78‐week open‐label |
C1: metformin 1500‐2000 mg/day + liraglutide (injection) 0.6 mg/day + glimepiride placebo C2: metformin 1500‐2000 mg/day + liraglutide (injection) 1.2 mg/day + glimepiride placebo C3: metformin 1500‐2000 mg/day + liraglutide (injection) 1.8 mg/day + glimepiride placebo Metformin taken in the morning and in the evening. Liraglutide injected subcutaneously once daily at any time of the day in the upper arm, abdomen, or thigh using a pen injector device. Glimepiride placebo taken once daily in the morning. Participants were encouraged to inject liraglutide at the same time each day. 26‐week double‐blind + 78‐week open‐label C4: metformin + placebo (oral or injection): metformin 1500‐2000 mg/day (taken in the morning and in the evening) + glimepiride placebo (once daily in the morning) and liraglutide placebo (injected subcutaneously once daily at any time of the day in the upper arm, abdomen, or thigh using a pen injector device. Participants were encouraged to inject liraglutide placebo at the same time each day. 26‐week double‐blind + 78‐week open‐label |
| Gallwitz 2012a | Metformin + glimepiride (tablet) Maximally tolerated dose of metformin (either immediate or extended‐release) + glimepiride at starting dose at 1 mg/day, given once daily immediately before breakfast. Glimepiride dose adjusted every 4 weeks, according to tolerability, up to the maximum tolerated dose in accordance with the country specific summary of product characteristics |
Metformin + exenatide (subcutaneous injection): maximally tolerated dose of metformin (either immediate or extended‐release) + exenatide at starting dose at 5 μg twice daily injected within 60 min before breakfast and evening meal. After 4 weeks exenatide dose adjusted to 10 μg twice daily for the remaining study period. If participants had daily episodes of nausea for > 1 week, the 10 μg dose was reduced to 5 μg twice daily and could be increased again after nausea subsided |
| Gallwitz 2012b | Metformin + glimepiride (capsule) Metformin at 1500 mg/day or more. Dose unchanged throughout the study. Glimepiride at starting dose of 1 mg once daily, up‐titrated stepwise in 1 mg increments up to a maximum of 4 mg once daily, at 4‐week intervals during the first 12 weeks of treatment. Glimepiride was up‐titrated by investigators if the participants self‐monitored fasting plasma glucose values were > 6.1 mmol/L. At any time, glimepiride could be down‐titrated to prevent recurrent hypoglycaemic events. Placebo identical to linagliptin |
Metformin + linagliptin (tablet): metformin at 1500 mg/day or more. Dose unchanged throughout the study. Linagliptin 5 mg once daily. Placebo identical to glimepiride |
| Derosa 2011a | Metformin + glimepiride (tablet) Metformin 1000‐2000 mg/day + glimepiride 1 mg 3 x/day and titrated after 1 month to 2 mg 3 x/day. "Subjects began a controlled‐energy diet (near 600 Kcal daily deficit) based on American Heart Association recommendations that included 50 % of calories from carbohydrates, 30 % from fat (6 % saturated), and 20 % from proteins, with a maximum cholesterol content of 300 mg/day and 35 g/day of fibre. Patients were not treated with vitamins or mineral preparations during the study. Standard diet advice was given by a dietitian and/or specialist doctor. Dietitian and/or specialist doctor periodically provided instruction on dietary intake recording procedures as part of a behavior modification program and then later used the subject's food diaries for counselling. Individuals were also encouraged to increase their physical activity by walking briskly for 20 to 30 min, 3 to 5 times per week, or by cycling. The recommended changes in physical activity throughout the study were not assessed." |
Metformin + exenatide (injection): metformin 1000‐2000 mg/day + exenatide 5 μg twice a day titrated after one month to 10 μg twice a day. "Subjects began a controlled‐energy diet (near 600 Kcal daily deficit) based on American Heart Association recommendations that included 50 % of calories from carbohydrates, 30 % from fat (6 % saturated), and 20 % from proteins, with a maximum cholesterol content of 300 mg/day and 35 g/day of fibre. Patients were not treated with vitamins or mineral preparations during the study. Standard diet advice was given by a dietitian and/or specialist doctor. Dietitian and/or specialist doctor periodically provided instruction on dietary intake recording procedures as part of a behavior modification program and then later used the subject's food diaries for counselling. Individuals were also encouraged to increase their physical activity by walking briskly for 20 to 30 min, 3 to 5 times per week, or by cycling. The recommended changes in physical activity throughout the study were not assessed." |
| Derosa 2011b | Metformin + glibenclamide (tablet) Metformin (mean dosage: 1 700 ± 850 mg/day) + glibenclamide titrated till 15 mg/day with forced titration every 3 months (independently from their glycaemic control, unless the developed side effects also due to the drug dosage) for 12 months. "Subjects began a controlled‐energy diet (near 600 kcal daily deficit) based on American Heart Association recommendations that included 50 % of calories from carbohydrates, 30 % from fat (6 % saturated), and 20 % from proteins, with a maximum cholesterol content of 300 mg / day and 35 g/day of fibre. Patients were not treated with vitamins or mineral preparations during the study. Standard diet advice was given by a dietitian and / or specialist doctor. Dietitian and / or specialist doctor periodically provided instruction on dietary intake recording procedures as part of a behavior modification program and then later used the subject’s food diaries for counselling. Individuals were also encouraged to increase their physical activity by walking briskly for 20 – 30 min, 3 – 5 times per week, or by cycle. The recommended changes in physical activity throughout the study were assessed at each visit using the subject’s activity diary." |
Metformin + pioglitazone (tablet): metformin (mean dosage: 1 700 ± 850 mg/day) + pioglitazone titrated till 45 mg/day with forced titration every 3 months (independently from their glycaemic control, unless the developed side effects also due to the drug dosage) for 12 months. "Subjects began a controlled‐energy diet (near 600 kcal daily deficit) based on American Heart Association recommendations that included 50 % of calories from carbohydrates, 30 % from fat (6 % saturated), and 20 % from proteins, with a maximum cholesterol content of 300 mg/day and 35 g/ day of fibre. Patients were not treated with vitamins or mineral preparations during the study. Standard diet advice was given by a dietitian and/or specialist doctor. Dietitian and/or specialist doctor periodically provided instruction on dietary intake recording procedures as part of a behavior modification program and then later used the subject’s food diaries for counselling. Individuals were also encouraged to increase their physical activity by walking briskly for 20 – 30 min, 3 – 5 times per week, or by cycle. The recommended changes in physical activity throughout the study were assessed at each visit using the subject’s activity diary." |
| Petrica 2011 | Metformin + glimepiride Metformin 1700 mg/day + glimepiride 4 mg/day |
Metformin + pioglitazone: metformin 1700 mg/day + pioglitazone 30 mg/day |
| Derosa 2010 | Metformin + glibenclamide (tablet) Metformin 1500 ± 500 mg/day + glibenclamide 2.5 mg 3 x/day titrated after 1 month to 5 mg 3 x/day. "Subjects began a controlled‐energy diet (near 600 kcal daily deficit) based on American Heart Association recommendations 17 that included 50 % of calories from carbohydrates, 30% from fat (6% saturated), and 20 % from proteins, with a maximum cholesterol content of 300 mg/day and 35 g/day of fibre. Patients were not treated with vitamins or mineral preparations during the study. Standard diet advice was given by a dietitian and/or specialist doctor. Dietitian and/or a specialist doctor periodically provided instruction on dietary intake recording procedures as part of a behavior modification program and then later used the subject’s food diaries for counselling. Individuals were also encouraged to increase their physical activity by walking briskly for 20–30 min, three to five times per week, or bicycle. The recommended changes in physical activity throughout the study were not assessed." |
Metformin + exenatide (injection): metformin 1500 ± 500 mg/day + exenatide 5 μg twice a day titrated after 1 month to 10 μg twice a day. "Subjects began a controlled‐energy diet (near 600 kcal daily deficit) based on American Heart Association recommendations 17 that included 50 % of calories from carbohydrates, 30% from fat (6 % saturated), and 20 % from proteins, with a maximum cholesterol content of 300 mg/day and 35 g/day of fibre. Patients were not treated with vitamins or mineral preparations during the study. Standard diet advice was given by a dietitian and/or specialist doctor. Dietitian and/or a specialist doctor periodically provided instruction on dietary intake recording procedures as part of a behavior modification program and then later used the subject’s food diaries for counselling. Individuals were also encouraged to increase their physical activity by walking briskly for 20–30 min, three to five times per week, or bicycle. The recommended changes in physical activity throughout the study were not assessed." |
| Matthews 2010 | Metformin + glimepiride (tablet) Metformin ≥ 1500 mg twice a day + glimepiride 2 mg/day. Glimepiride could be up‐titrated (to a maximum of 6 mg/day) at weeks 4, 8 or any later visit if FPG exceeded 6.2 mmol/L or down‐titrated in cases of recurrent hypoglycaemia |
Metformin + vildagliptin (tablet): metformin ≥ 1500 mg twice a day + vildagliptin 50 mg twice a day |
| Filozof 2010 | Metformin + gliclazide (tablet) Metformin 1500 mg/day + gliclazide 80 mg/day up titrated to a maximum of 320 mg/day if FPG was > 7.0 mmol/L or fasting blood glucose was > 6.3 mmol/L based on the fasting finger‐stick capillary glucose measurement performed at the study centre. Participants were up‐titrated to the next dose level at week 4 (160 mg), week 8 (240 mg) and week 12 (320 mg) |
Metformin + vildagliptin (tablet): metformin 1500 mg/day + vildagliptin 50 mg twice daily |
| Seck 2010 | Metformin + glipizide Metformin ≥ 1500 mg/day + glipizide 5 mg/day up‐titrated to a potential maximum dose of 20 mg/day. In 3‐week intervals during the first 18 weeks of treatment, glipizide was up‐titrated if pre‐meal fingerstick glucose values were > 6.1 mmol/L (110 mg/dL). At the investigator’s discretion, up‐titration of glipizide was withheld if the investigator considered that up‐titration would place the participant at risk for hypoglycaemia. At any time during the study, glipizide could be down‐titrated to prevent recurrent hypoglycaemic events |
Metformin + sitagliptin Metformin ≥ 1500 mg/day + sitagliptin 100 mg/day |
| Home 2009 | Metformin + SU (tablet) Metformin, starting dose varied by local practice. Dose increase permitted after 8 weeks of treatment. Maximum daily dose 2550 mg. Suphonylurea, starting dose varied by local practice. Dose increase permitted after 8 weeks of treatment. Maximum daily dose glibenclamide (or equivalent for different preparations) 15 mg, gliclazide 240 mg and glimepiride 4 mg. Rescue therapy by transfer to insulin if HbA1c > 8.5 % confirmed |
Metformin + rosiglitazone (tablet) Metformin, starting dose varied by local practice. Dose increase permitted after 8 weeks of treatment. Maximum daily dose 2550 mg. Rosiglitazone, starting dose 4 mg/day. Dose increase permitted after 8 weeks of treatment to 8 mg/day. Rescue therapy by addition of a third oral agent if HbA1c > 8.5 % confirmed. In case of HbA1c > 8.5 % confirmed on triple therapy, rosiglitazone was stopped and insulin therapy substituted. |
| Derosa 2009a | Metformin + glimepiride (tablet): Metformin 850 mg/day + glimepiride 2 mg/day, both once a day after lunch for 1 month. Forced titration of glimepiride (independently from their glycaemic control, unless they developed adverse effects also due to the drug dosage) to 4 mg/day in the second month and hereafter 6 mg/day till the end of study. Metformin kept constant at 850 mg/day till study end. "At baseline, patients began a controlled‐energy diet (∼600 kcal daily deficit) based on American Diabetes Association recommendations that contained 50% of calories from carbohydrates, 30% from fat (6% saturated), and 20% from proteins, with a maximum cholesterol content of 300 mg/d, and 35 g/d of fibre. Each centre's standard diet advice was given by a dietitian and/or specialist physician. Dietitians and/or specialists each month for the first 3 months provided instruction on dietary intake, recording procedures as part of a behavior‐modification program, and then from month 3 used the patients' food diaries for counselling. During the study, behavior‐modification sessions on weight loss strategies were given to individual patients at baseline and then every 3 months until the end of the trial. Individuals were also encouraged to increase their physical activity by walking briskly or riding a stationary bicycle for 20 to 30 minutes, 3 to 5 times per week. The recommended changes in physical activity throughout the study were not assessed." |
C1: metformin + pioglitazone (tablet) Metformin 850 mg/day + pioglitazone 15 mg/day, both once a day after lunch for 1 month. Forced titration of metformin and pioglitazone (independently from their glycaemic control, unless they developed adverse effects also due to the drug dosage) to metformin 1700 mg/day + pioglitazone 30 mg/day in the second month and hereafter metformin 2550 mg/day + pioglitazone 45 mg/day till the end of study. C2: metformin monotherapy (tablet) Metformin 1000 mg/day, 500 mg, twice a day, after lunch and diner for 1 month. Forced titration (independently from their glycaemic control, unless they developed adverse effects also due to the drug dosage) to 2000 mg/day in the second month and hereafter 3000 mg/day till the end of study. "At baseline, patients began a controlled‐energy diet (∼600 kcal daily deficit) based on American Diabetes Association recommendations that contained 50% of calories from carbohydrates, 30% from fat (6% saturated), and 20% from proteins, with a maximum cholesterol content of 300 mg/d, and 35 g/d of fibre. Each centre's standard diet advice was given by a dietitian and/or specialist physician. Dietitians and/or specialists each month for the first 3 months provided instruction on dietary intake, recording procedures as part of a behavior‐modification program, and then from month 3 used the patients' food diaries for counselling. During the study, behavior‐modification sessions on weight loss strategies were given to individual patients at baseline and then every 3 months until the end of the trial. Individuals were also encouraged to increase their physical activity by walking briskly or riding a stationary bicycle for 20 to 30 minutes, 3 to 5 times per week. The recommended changes in physical activity throughout the study were not assessed." |
| Derosa 2009b | Metformin + glibenclamide (tablet) 6 months of run‐in. Glibenclamide starting dose 2.5 mg 3 x/day, titrated to 5 mg 3 x/day. After 1 month of run‐in metformin was added. Metformin starting dose 500 mg 3 x/day titrated to 1000 mg 3 x/day. "At baseline, patients began a controlled‐energy diet (600 kcal daily deficit), based on ADA recommendations, that contained 50 % of calories from carbohydrates, 30 % from fat (6 % saturated), and 20 % from proteins, with a maximum cholesterol content of 300 mg/d, and 35 g/d of fibre. Each centre’s standard diet advice was given by a dietitian and/or specialist physician. Dietitians and/or specialists each two weeks provided instruction on dietary intake–recording procedures as part of a behavior‐modification program and then from month 1 used the patients’ food diaries for counselling. During the study, behavior‐modification sessions on weight‐loss strategies were given to individual patients at baseline, one at 6 months, and four with all patients at 3, 6, 9 and 12 months. Individuals were also encouraged to increase their physical activity by walking briskly or riding a stationary bicycle for 20 to 30 min, 3–5 times per week. The recommended changes in physical activity throughout the study were not assessed." |
Metformin + nateglinide (tablet) 6 months of run‐in. Nateglinide starting dose 60 mg 3 x/day, titrated to 120 mg 3 x/day. After 1 month of run‐in metformin was added. Metformin starting dose 500 mg 3 x/day titrated to 1000 mg 3 x/day. "At baseline, patients began a controlled‐energy diet (600 kcal daily deficit), based on ADA recommendations, that contained 50 % of calories from carbohydrates, 30 % from fat (6 % saturated), and 20 % from proteins, with a maximum cholesterol content of 300 mg/d, and 35 g/d of fibre. Each centre’s standard diet advice was given by a dietitian and/or specialist physician. Dietitians and/or specialists each two weeks provided instruction on dietary intake–recording procedures as part of a behavior‐modification program and then from month 1 used the patients’ food diaries for counselling. During the study, behavior‐modification sessions on weight‐loss strategies were given to individual patients at baseline, one at 6 months, and four with all patients at 3, 6, 9 and 12 months. Individuals were also encouraged to increase their physical activity by walking briskly or riding a stationary bicycle for 20 to 30 min, 3–5 times per week. The recommended changes in physical activity throughout the study were not assessed." |
| Petrica 2009 | Metformin + glimepiride Metformin 1700 mg/day + glimepiride 4 mg/day |
Metformin + rosiglitazone Metformin 1700 mg/day + rosiglitazone 4 mg/day |
| NCT00367055 | Metformin + Gliclazide (tablet) Observation period: metformin 2 g/day Treatment period: initial dosage gliclazide 80 mg/day + metformin 2 g/day with the opportunity, in case of FBG > 1.26 g/L and after a 4‐week treatment period, to adjust progressively their treatment up to 320 mg/day and 2 g/day of gliclazide/metformin |
Metformin + rosiglitazone (tablet) Observation period: metformin 2 g/day Treatment period: initial dosage rosiglitazone 4 mg/day + metformin 2 g/day with the opportunity, in case of FBG > 1.26 g/L and after a 8‐week treatment period, to adjust their treatment up to 8 mg/day and 2 g/day of rosiglitazone/metformin |
| Hamann 2008 | Metformin + glibenclamide or gliclazide Metformin 2000 mg/day + glibenclamide 5 mg/day or gliclazide 80 mg/day up‐titrated to maximum tolerated dose (glibenclamide 15 mg/day, gliclazide 320 mg/day). "All subjects had their study medications progressively up‐titrated at 4, 8 and 12 weeks to achieve optimal glycaemic control, unless either their mean daily glucose (determined for the prior 3 days from diary cards) was < 6.1 mmol/L or they reported frequent or severe hypoglycaemia. Patients who were not up‐titrated at one visit because their mean daily glucose was < 6.1 mmol/L could have the dose up‐titrated at the next visit if mean daily glucose was then ≥ 6.1 mmol/L. Patients with multiple or severe episodes of hypoglycaemia could, at the investigators discretion, undergo blinded reduction to the previous dose level. Investigators were required to make every effort to confirm hypoglycaemia biochemically and to identify potential causes of hypoglycaemia other than study medication (e.g. a missed meal) before down‐titrating the dose level. Individuals with insufficient therapeutic effect (fasting blood glucose ≥ 12 mmol/L) after having been on the maximum dose level of study medication for at least 8 weeks were withdrawn from the study" |
Metformin + rosiglitazone Metformin 2000 mg/day + rosiglitazone 4 mg/day up‐titrated to maximum tolerated dose (8 mg/day). "All subjects had their study medications progressively up‐titrated at 4, 8 and 12 weeks to achieve optimal glycaemic control, unless either their mean daily glucose (determined for the prior 3 days from diary cards) was < 6.1 mmol/L or they reported frequent or severe hypoglycaemia. Patients who were not up‐titrated at one visit because their mean daily glucose was < 6.1 mmol/L could have the dose up‐titrated at the next visit if mean daily glucose was then ≥ 6.1 mmol/L. Patients with multiple or severe episodes of hypoglycaemia could, at the investigators discretion, undergo blinded reduction to the previous dose level. Investigators were required to make every effort to confirm hypoglycaemia biochemically and to identify potential causes of hypoglycaemia other than study medication (e.g. a missed meal) before down‐titrating the dose level. Individuals with insufficient therapeutic effect (fasting blood glucose ≥ 12 mmol/L) after having been on the maximum dose level of study medication for at least 8 weeks were withdrawn from the study" |
| Ristic 2007 | Metformin + gliclazide Metformin: "participants were kept on their individual maximally tolerated dose (the dose at which the participant was inadequately controlled, based on HbA1c assessment, which, however, could not be increased because of side‐effects) from 8 weeks before entering the study and during the entire course of the study." Mean dose 1834 mg/day. Gliclazide: "treatment regimen were started at the lowest level (80 mg/day) and were titrated to the next dose level on a monthly basis up to a maximum of 240 mg/day during the first 3 months. Dose levels of study medication were increased if the FPG level was > 7 mmol/L, if the participant had not experienced any confirmed hypoglycaemic events (symptomatic and/or asymptomatic events with plasma glucose concentration ≤ 4.0 mmol/L) and if the participant had not experienced > 3 hypoglycaemic events in the past month." |
Metformin + nateglinide Metformin: "participants were kept on their individual maximally tolerated dose (the dose at which the participant was inadequately controlled, based on HbA1c assessment, which, however, could not be increased because of side‐effects) from 8 weeks before entering the study and during the entire course of the study." Mean dose 1931 mg/day. Nateglinide: "treatment regimen were started at the lowest level (60 mg 3 x/day) and were titrated to the next dose level on a monthly basis up to a maximum of 180 mg 3 x /day during the first 3 months. Dose levels of study medication were increased if the FPG level was > 7 mmol/L, if the participant had not experienced any confirmed hypoglycaemic events (symptomatic and/or asymptomatic events with plasma glucose concentration ≤ 4.0 mmol/L) and if the participant had not experienced > 3 hypoglycaemic events in the past month." |
| Charbonnel 2005 | Metformin + gliclazide Metformin at pre‐study dose (mean 1705 mg/day, range 500‐3000). No decrease in metformin dose from pre‐study level was permitted. Gliclazide 80 mg once daily titrated (16 weeks forced titration) to 160 mg, 240 mg (160 mg and 80 mg) and 320 mg (160 mg twice daily). Cessation of titration or down‐titration was permitted only on the basis of tolerability issues, including actual hypoglycaemia or increased risk of hypoglycaemia. Participants continued to the next dose level, unless the investigator considered that the increase could put them at risk of hypoglycaemia (increase postponed for one visit from week 4 or week 8 or week‐8 dose maintained for rest of study), or the participant reported symptomatic hypoglycaemia (1‐step reduction) or if the participant experienced adverse events that required dose reduction (1‐step reduction at week 8, 12 or 16 with no further down‐titration). The dose achieved at week 16 was maintained for the remaining study |
Metformin + pioglitazone Metformin at pre‐study dose (mean 1705 mg/day, range 500‐3000). No decrease in metformin dose from pre‐study level was permitted. Pioglitazone 15 mg once daily titrated (16 weeks forced titration) to 30 and 45 mg. Cessation of titration or down‐titration was permitted only on the basis of tolerability issues, including actual hypoglycaemia or increased risk of hypoglycaemia. Participants continued to the next dose level, unless the investigator considered that the increase could put them at risk of hypoglycaemia (increase postponed for one visit from week 4 or week 8 or week‐8 dose maintained for rest of study), or the participant reported symptomatic hypoglycaemia (1‐step reduction) or if the participant experienced adverse events that required dose reduction (1‐step reduction at week 8, 12 or 16 with no further down‐titration). The dose achieved at week 16 was maintained for the remaining study |
| Derosa 2005 | Metformin + glimepiride (tablet) Metformin 1500 mg/day orally (3 x/day) + glimepiride 2 mg/day (once a day, before lunch). "Subjects began a controlled‐energy diet (approximately 600 kcal daily deficit) based on American Diabetes Association recommendations containing 52% as carbohydrates, 22% proteins, 26% of calories as lipids (6% saturated), with a maximum cholesterol content of 300 mg/day, and 35 g fibre. Each centre’s standard diet advice was given by a dietitian and/or specialist physician. Dietitians and/or diabetologists periodically provided instruction on dietary intake, recording procedures as part of a behavior modification program, and then later used the subject’s food diaries for counselling. During the study, one individual behavior‐modification session on weight‐loss strategies took place at baseline, and four collective educational seminars with all patients were held at 3, 6, 9, and 12 months. Individuals were also encouraged to increase their physical activity by walking briskly for 20–30 min, 3–5 times per week, or bicycle. The recommended changes in physical activity throughout the study were not assessed." |
Metformin + rosiglitazone (tablet) Metformin 1500 mg/day orally (3 x /day) + rosiglitazone 4 mg/day orally (once a day, before lunch). "Subjects began a controlled‐energy diet (approximately 600 kcal daily deficit) based on American Diabetes Association recommendations containing 52% as carbohydrates, 22% proteins, 26% of calories as lipids (6% saturated), with a maximum cholesterol content of 300 mg/day, and 35 g fibre. Each centre’s standard diet advice was given by a dietitian and/or specialist physician. Dietitians and/or diabetologists periodically provided instruction on dietary intake, recording procedures as part of a behavior modification program, and then later used the subject’s food diaries for counselling. During the study, one individual behavior‐modification session on weight‐loss strategies took place at baseline, and four collective educational seminars with all patients were held at 3, 6, 9, and 12 months. Individuals were also encouraged to increase their physical activity by walking briskly for 20–30 min, 3–5 times per week, or bicycle. The recommended changes in physical activity throughout the study were not assessed." |
| Gerich 2005 | Metformin + glyburide (capsules orally) + placebo to match nateglinide Maintenance period, 4 weeks: 500 mg metformin open‐label before the evening meal + 1.25 mg glyburide before breakfast. Titration period 12 weeks: Titration was performed at biweekly visits if FPG ≥ 6.7 mmol/L. Open‐label metformin was titrated in 500 mg increments to a maximum of 2000 mg daily. Glyburide was titrated in 1.25 mg increments to a maximum of 10 mg daily, before breakfast and before dinner. Monitoring period 88 weeks: study medication remained constant, unless protocol‐specified criteria for rescue therapy were met. The dose level was increased to the next highest level or to the “rescue dose level 9” if FPG ≥ 13.3 mmol/L, HbA1c ≥ 9.0%, or the participant had symptomatic hyperglycaemia. Rescue dose: 15 mg of glyburide in divided daily doses |
Metformin + nateglinide (tablets orally) + placebo to match glyburide Maintenance period, 4 weeks: 500 mg metformin open‐label before the evening meal + 120 mg nateglinide, before breakfast, lunch, dinner. The dose level was not adjusted during this 4‐week maintenance period, unless hypoglycaemia required downward titration to dose level 0 (60 mg nateglinide). Titration period 12 weeks: titration was performed at biweekly visits if FPG ≥ 6.7 mmol/L. Open‐label metformin was titrated in 500 mg increments to a maximum of 2000 mg daily. Nateglinide remained constant at 120 mg Monitoring period 88 weeks: study medication remained constant, unless protocol‐specified criteria for rescue therapy were met. The dose level was increased to the next highest level or to the “rescue dose level 9” if FPG ≥ 13.3 mmol/L, A1C ≥ 9.0%, or the participant had symptomatic hyperglycaemia. Rescue dose: 180 mg of nateglinide |
| ADA: American Diabetes Association; C: comparator; FBG: fasting blood glucose; FPG: fasting plasma glucose; HbA1c: glycosylated haemoglobin A1c; I: intervention; SGLT2: sodium‐glucose transport 2 | ||
Appendix 5. Baseline characteristics (I)
| Trial ID | Intervention(s) and comparator(s) | Duration of intervention (duration of follow‐up) | Description of participants | Trial period (year to year) | Country | Setting | Ethnic groups (%) | Duration of T2DM (mean/range years (SD)) |
| Handelsman 2017 | I: metformin ≥ 1500 mg/day + glimepiride 1‐6 mg/day + placebo | 54 weeks (54 weeks) | T2DM, HbA1c 6.55% ‐ 9% on metformin | 2012 to 2015 | Argentina, Croatia, Germany, Hungary, Korea, Lebanon, Lithuania, Malaysia, Mexico, Poland, Romania, USA | Outpatients | White: 82.7 Asian: 13.1 Black: 2.9 American Indian/Alaska native: 1.1 Not reported: 0.3 | 7.7 (4.9) |
| C: metformin ≥ 1500 mg/day + omarigliptin 25 mg/week + placebo | White: 81.6 Asian: 12 Black 3.7 American Indian/Alaska native: 2.7 | 7.6 (5.1) | ||||||
| Hollander 2017 | I: metformin ≥ 1500 mg/day + glimepiride 1‐8 mg/day + placebo | 104 weeks (104 weeks) | T2DM, HbA1c of 7%‐9% on metformin | 2013 to 2016 | Argentina, Canada, Czech Republic, Hungary, South Korea, Lithaunia, Mexico, Philippines, Poland, Romania, Russia, Slovakia, South Africa, Taiwan, Ukraine, USA | Outpatients | White: 72.8 Asian: 16.7 Black or African American: 5.7 Other: 4.8 | 7.5 (5.6) |
| C1: metformin ≥ 1500 mg/day + ertugliflozin 5 mg/day + placebo | White: 74.1 Asian: 18.1 Black or African American: 3.8 Other: 4 | 7.4 (5.7) | ||||||
| C2: metformin ≥ 1500 mg/day + ertugliflozin 15 mg/day + placebo | White: 71.8 Asian: 19.3 Black or African American: 4.3 Other: 4.5 | 7.5 (5.7) | ||||||
| Vaccaro 2017 | I: metformin 2000 mg/day + sulphonylurea (glibenclamide 5‐15 mg/day, gliclazide 30‐120 mg/day or glimepiride 2‐6 mg/day) | Median 57.3 month (median 57.3 month) | T2DM, HbA1c of 7%‐9% on metformin | 2008 to 2017 | Italy | Outpatients | ‐ | 8.5 (5.8) |
| C: metformin 2000 mg/day + pioglitazone 15‐45 mg/day) | ‐ | 8.4 (5.6) | ||||||
| Dei Cas 2017 | I: metformin ≥ 1500 mg/day + glibenclamide 10 mg/day | 52 weeks (52 weeks) | T2DM, HbA1c of 7%‐9% on metformin | 2007 to 2009 | Italy | Outpatients | ‐ | 5 (1‐10)a |
| C: metformin ≥ 1500 mg/day + vildagliptin 100 mg/day | ‐ | 7 (4‐11) | ||||||
| Leiter 2015 | I: metformin ≥ 1500 mg/day + glimepiride 1‐8 mg/day | 104 week (104 week) | T2DM, HbA1c of 7%‐9.5% on metformin | 2009 to 2013 | Argentina, Bulgaria, Canada, Costa Rica, Denmark, Finland, Germany, India, Israel, Mexico, Norway, Philippines, Poland, Romania, Russian Federation, Slovakia, South Korea, Ukraine, USA | Outpatients | White: 67 Black or African American: 5 Asian: 19 Other (includes American Indian or Alaska Native, Native Hawaiian or other Pacific Islander, multiple origin, and other): 9 | 6.6 (5.0) |
| C1: metformin ≥ 1500 mg/day + canagliflozin 100 mg/day | White: 67 Black or African American: 4 Asian: 21 Other (includes American Indian or Alaska Native, Native Hawaiian or other Pacific Islander, multiple origin, and other): 9 | 6.5 (5.5) | ||||||
| C2: metformin ≥ 1500 mg/day + canagliflozin 300 mg/day | White: 69 Black or African American: 4 Asian: 19 Other (includes American Indian or Alaska Native, Native Hawaiian or other Pacific Islander, multiple origin, and other): 9 | 6.7 (5.5) | ||||||
| Del Prato 2015 | I: metformin 1500‐2500 mg/day + glipizide 5‐20 mg/day | 208 weeks (208 weeks) | People with inadequately controlled T2DM (HbA1c 6.5%‐10%) while receiving metformin or metformin + one other OAD | 2008 to 2013 | Argentina, France, Germany, UK, Italy, Mexico, Netherlands, South Africa, Spain, Sweden | Outpatients | American Indian or Alaska Native: 0 Asian: 8.5 Black or African American: 6 White: 80.5 Unknown or not reported: 5 | 7 (6) |
| C: metformin 1500‐2500 mg/day + dapagliflozin 2.5‐10 mg/day | American Indian or Alaska Native: 0 Asian: 6.8 Black or African American: 6.5 White: 81.8 Unknown or not reported: 5 | 6 (5) | ||||||
| Schernthaner 2015 | I: metformin at any dose + glimepiride 1‐6 mg/day + placebo | 52 weeks (52 weeks) | People with T2DM aged ≥ 65 years, who were on stable metformin monotherapy at any dose for ≥ 8 weeks before enrolment and had an HbA1c concentration of 7%–9% | 2009 to 2012 | Austria, Denmark, Finland, France, Germany, Greece, Hungary, Italy, Mexico, Norway, Spain, Sweden, UK | Outpatients | White: 98.6 Other: 1.4 | 7.6 (6.0) |
| C: metformin at any dose + saxagliptin 5 mg/day + placebo | White: 97.8 Other: 2.2 | 7.6 (6.4) | ||||||
| Del Prato 2014 | I: metformin ≥ 1500 mg once daily or maximum tolerated dose + glipizide 5‐20 mg once daily | 104 weeks (104 weeks) | People with T2DM inadequately controlled (HbA1c 7%‐10%) on stable‐dose metformin | 2009 to 2012 | USA, Argentina, Australia, Austria, Brazil, Canada, Chile, Germany, Guatemala, Hong Kong, Hungary, India, Israel, Italy, Korea, Latvia, Lithuania, Malaysia, Mexico, New Zealand, Peru, Philippines, Poland, Puerto Rico, Romania, Russian Federation, Singapore, South Africa, Spain, Thailand, Ukraine, UK | Outpatients | American Indian or Alaska Native: 4 Asian: 23 Black or African American: 9 Native Hawaiian or Other Pacific Islander: 0.5 White: 61 Multiracial: 2 Hispanic or Latino: 22 Not Hispanic or Latino: 78 | 5.5 (4.9) |
| C1: metformin ≥ 1500 mg once daily or maximum tolerated dose + alogliptin 12.5 mg once daily | American Indian or Alaska Native: 5 Asian: 23 Black or African American: 8 Native Hawaiian or Other Pacific Islander: 0.7 White: 63 Multiracial: 2 Hispanic or Latino: 23 Not Hispanic or Latino: 77 | 5.7 (5.3) | ||||||
| C2: metformin ≥ 1500 mg once daily or maximum tolerated dose + alogliptin 25 mg once daily | American Indian or Alaska Native: 5 Asian: 22 Black or African American: 8 Native Hawaiian or Other Pacific Islander: 0.1 White: 63 Multiracial: 1 Hispanic or Latino: 22 Not Hispanic or Latino: 78 | 5.4 (4.7) | ||||||
| Ahrén 2014 | I: metformin ≥ 1500 mg daily + glimepiride 2‐4 mg once daily + placebo + placebo | 156 weeks (156 weeks) | People with T2DM with inadequate glycaemic control (HbA1c 7%‐10%) while taking background metformin | 2009 to 2013 | USA, Albania, Germany, Hong Kong, Mexico, Peru, Philippines, Russian, Federation, South Africa, Spain, UK | Outpatients | African American/African heritage: 13 American Indian or Alaskan native: 8 Asian ‐ Central/South Asian heritage: 1 Asian ‐ East Asian heritage: 1 Asian ‐ South East Asian heritage: 3 White Arabic/North African heritage: 3 White/European heritage: 72 | 6.0 (4.8) |
| C1: metformin ≥ 1500 mg daily + albiglutide 30‐50 mg once weekly + placebo | African American/African heritage: 18 American Indian or Alaskan Native: 6 Asian ‐ Central/South Asian heritage: 1 Asian ‐ East Asian heritage: 2 Asian ‐ South East Asian heritage: 4 Native Hawaiian or other Pacific Islander: 0 White Arabic/North African heritage: 1 White/European heritage: 71 | 6.0 (4.3) | ||||||
| C2: metformin ≥ 1500 mg daily + sitagliptin 100 mg once daily + placebo | African American/African heritage: 12 American Indian or Alaskan native: 7 Asian ‐ Central/South Asian heritage: 2 Asian ‐ East Asian heritage: 1 Asian ‐ South East Asian heritage: 4 White/Caucasian/European heritage: 75 | 5.8 (4.8) | ||||||
| C3: metformin ≥ 1500 mg daily + placebo | African American/African: 23 American Indian or Alaskan native: 9 Asian ‐ Central/South Asian heritage: 1 Asian ‐ Japanese heritage: 1 Asian ‐ South East Asian heritage: 3 Native Hawaiian or other Pacific Islander: 1 White/European heritage: 63 | 6.7 (6.6) | ||||||
| Ridderstråle 2014 | I: metformin immediate release ≥ 1500 mg/day + glimepiride 1‐4 mg/day | 208 weeks (208 weeks) | People with T2DM with poor glycaemic control (HbA1c 7%‐10%), BMI ≤ 45 kg/m², on stable metformin ≥ 1500 mg/day | 2010 to 2015 | Argentina, Austria, Canada, Colombia, Czech Republic, Finland, Hong Kong, India, Italy, Malaysia, Mexico, Netherlands, Norway, Philippines, Portugal, South Africa, Spain, Sweden, Switzerland, Taiwan, Thailand, UK, USA | Outpatients | White: 67 Asian: 32 Balck or Afican‐American: 1 | ≤ 1: 12 > 1‐5: 43 > 5‐10: 27 > 10: 18 |
| C: metformin immediate release ≥ 1500 mg/day + empagliflozin 25 mg/day | White: 65 Asian: 33 Balck or Afican‐American: 2 Hawaiian or Pacific Islander: < 1 | ≤ 1: 10 > 1‐5: 45 > 5‐10: 28 > 10: 17 | ||||||
| Göke 2013 | I: metformin ≥ 1500 mg daily + glipizide 5‐20 mg/day | 104 weeks (104 weeks) | People with T2DM with poor glycaemic control (HbA1c > 6.5%‐10%) on stable metformin ≥ 1500 mg/day | 2007 to 2010 | Germany, Finland, UK, Hungary, India, South Korea, Netherlands, Norway, Russia, Slovakia, Vietnam | Outpatients | Asian: 15.1 White: 84.2 Other: 0.7 | 5.4 (4.7) |
| C: metformin ≥ 1500 mg daily + saxagliptin 5 mg/day | Asian: 17.1 Black/African American: 0.2 White: 82.2 Other: 0.5 | 5.5 (4.5) | ||||||
| Maffioli 2013 | I: metformin 2550 mg/day + glibenclamide 10 mg/day | 52 weeks (52 weeks) | People with T2DM , who were naive and with poor glycaemic control (HbA1c > 8%) and hepatic steatosis | ‐ | Italy | Outpatients | ‐ | ‐ |
| C: metformin 2550 mg/day + pioglitazone 30 mg/day | ‐ | ‐ | ||||||
| Nauck 2013 | I: metformin 1500‐2000 mg/day + glimepiride 1‐4 mg/day + placebo | 26‐week double‐blind + 78‐week open label (104 weeks) | People with T2DM with inadequate glycaemic control (7%‐11%) | 2006 to 2008 | Argentina, Australia, Belgium, Bulgaria, Croatia, Denmark, Germany, Hungary, India, Ireland, Italy, Netherlands, Norway Romania, Russian Federation, Slovakia, South Africa, Spain, Sweden, UK | Outpatients | American Indian or Alaska native: 0
Asian: 8.7 Black or African American: 2.1 White: 88.4 Unknown or not reported: 0.8 |
7.7 (5.3) |
| C1: metformin 1500‐2000 mg/day + liraglutide 0.6 mg/day + placebo | American Indian or Alaska native: 0 Asian: 12.8 Native Hawaiian or other Pacific Islander: 0 Black or African American: 1.7 White: 83.5 > one race: 0 Unknown or not reported: 2.1 | 7.0 (4.8) | ||||||
| C2: metformin 1500‐2000 mg/day + liraglutide 1.2 mg/day + placebo | American Indian or Alaska native: 0 Asian: 7.9 Black or African American: 3.8 White: 87.5 Unknown or not reported: 0.8 | 6.8 (4.9) | ||||||
| C3: metformin 1500‐2000 mg/day + liraglutide 1.8 mg/day + placebo | American Indian or Alaska native: 0 Asian: 7.4 Black or African American: 2.1 White: 88.4 Unknown or not reported: 2.1 | 7.8 (5.2) | ||||||
| C4: metformin 1500‐2000 mg/day + placebo | American Indian or Alaska native: 0 Asian: 7.4 Black or African American: 2.5 White: 87.6 Unknown or not reported: 2.5 | 7.9 (6.0) | ||||||
| Gallwitz 2012a | I: metformin median dose 2000 mg/day + glimepiride mean dose 2.01 mg/day | Average 2 years (average 2 years) | Participants were obese with T2DM and poor glycaemic control (defined by HbA1c of 6.5% and more or 9% and less) receiving metformin monotherapy | 2006 to 2011 | Austria, Czech Republic, Finland, France, Germany, Hungary, Ireland, Israel, Italy, Mexico, Poland, Spain, Switzerland, UK | Outpatients | White: 91 Hispanic: 7 African or Asian: 2 | 5.5 (4.3) |
| C: metformin median dose 2000 mg/day + exenatide mean dose 17.35 μg/day | White 92 Hispanic 7 African or Asian < 1 | 5.8 (4.8) | ||||||
| Gallwitz 2012b | I: metformin ≥ 1500 mg/day + glimepiride 1‐4 mg/day + placebo | 104 weeks (104 weeks) | T2DM and HbA1c 6.5%‐10% on stable metformin alone or with one additional oral antidiabetic drug (washed out during screening) | 2008 to 2010 | Bulgaria, Denmark, France, Germany, Hong Kong, Hungary, India, Ireland, Italy, Netherlands, Norway, Poland, South Africa, Sweden, UK, USA | Outpatients | White: 85 Asian: 12 Black or African American: 2 Other: < 1 | ≤ 1 year 8% > 1 year and ≤ 5 years 39 % > 5 years 54% |
| C: metformin ≥ 1500 mg/day + linagliptin 5 mg/day + placebo | White: 85 Asian: 12 Black or African American: 3 Other: < 1 | ≤ 1 year 7% >1 year and ≤ 5 years 41% > 5 years 52% | ||||||
| Derosa 2011a | I: metformin 1000‐2000 mg/day + glimepiride 6 mg/day | 52 weeks (52 weeks) | White people with T2DM and poor glycaemic control (HbA1c > 8%) receiving therapy with metformin | ‐ | Italy | Outpatients | White 100 | ‐ |
| C: metformin 1000‐2000 mg/day + exenatide 20 μg/day | White 100 | ‐ | ||||||
| Derosa 2011b | I: metformin 1700 ± 850 mg/day + glibenclamide 5‐15 mg/day | 52 weeks (52 weeks) | White people with T2DM and poor glycaemic control (HbA1c > 7%) receiving therapy with metformin | ‐ | Italy | Outpatients | White 100 | ‐ |
| C: metformin 1700 ± 850 mg/day + pioglitazone 15‐45 mg/day | White 100 | ‐ | ||||||
| Petrica 2011 | I: metformin 1700 mg/day + glimepiride 4 mg/day | 52 weeks (52 weeks) | Normoalbuminuric people with T2DM with poor glycaemic control HbA1c > 7% on metformin monotherapy | ‐ | Romania | Outpatients | ‐ | 10.2 (5.3) |
| C: metformin 1700 mg/day + pioglitazone 30 mg/day | ‐ | 10.0 (3.5) | ||||||
| Derosa 2010 | I: metformin 1500 ± 500 mg/day + glibenclamide 15 mg/day | 52 weeks (52 weeks) | White people with T2DM and poor glycaemic control (HbA1c > 8%) receiving therapy with metformin | ‐ | Italy | Outpatients | White | ‐ |
| C: metformin 1500 ± 500 mg/day + exenatide 20 μg/day | White | ‐ | ||||||
| Matthews 2010 | I: metformin ≥ 1500 mg twice a day + glimepiride 2‐6 mg/day | 104 weeks (104 weeks) | People with T2DM inadequately controlled (6.5% ‐ 8.5%) on metformin | 2005 to 2008 | Argentina, Belgium, Canada, Columbia, Denmark, Egypt, Estonia, Finland, France, Germany, Greece, Guatemala, Hong‐Kong, Israel, Italy, Latvia, Lithuania, Netherlands, Peru, South Africa, Spain, Turkey, Ukraine, UK, USA | Outpatients | White: 86.3 Black: 1.2 Asian (non Indian subcontinent): 1.9 Asian (Indian subcontinent): 1.0 Hispanic or Latino: 8.5 Japanese: 0.1 Native American: 0.2 Pacific Islander: 0.1 Other: 0.6 | 5.7 (5.04) |
| C: metformin ≥ 1500 mg twice a day + vildagliptin 50 mg twice a day | White: 87.3 Black: 1.2 Asian (non Indian subcontinent): 1.9 Asian (Indian subcontinent): 0.9 Hispanic or Latino: 8.3 Native American: 0.2 Pacific Islander: 0.1 Other: 0.2 | 5.7 (5.20) | ||||||
| Filozof 2010 | I: metformin 1500 mg/day + gliclazide 80‐320 mg/day | 52 weeks (52 weeks) | People with T2DM with poor glycaemic control (7.5%‐11%) receiving therapy with metformin | 2005 to 2009 | Argentina, Australia, Brazil, Canada, Chile, Colombia, Czech Republic, Denmark, France, Gernamy, Guatemala, Hungary, India, Italy, Peru, Romania, Russia, Slovakia, Spain, Switzerland, Turkey, UK | Outpatients | Asian: 8.3 Black: 1.2 White: 77.5 Hispanic or Latino: 11.9 Other: 1 | 6.8 (5.3) |
| C: metformin 1500 mg/day + vildagliptin 100 mg/day | Asian: 8.4 Black: 0.6 White: 78.9 Hispanic or Latino: 11.3 Other: 0.8 | 6.4 (5.1) | ||||||
| Seck 2010 | I: metformin ≥ 1500 mg/day + glipizide 5‐20 mg/day | 104 weeks (104 weeks) | People with T2DM with inadequate glycaemic control (HbA1c ≥ 6.5% and ≤ 10%) on metformin monotherapy | 2004 to 2007 | ‐ | Outpatient | White: 74.3 Black: 6 Hispanic: 7.9 Asian: 8.4 Other: 3.4 | 6.2 (5.4) |
| C: metformin ≥ 1500 mg/day + sitagliptin 100 mg/day | White: 73.5 Black: 7 Hispanic: 7.3 Asian: 8.5 Other: 3.7 | 6.5 (6.1) | ||||||
| Home 2009 | I: metformin up to 2550 mg/day + glibenclamide (or equivalent for different preparations) up to 15 mg/day or gliclazide up to 240 mg/day or glimepiride up to 4 mg/day | Mean 5.5 years (mean 5.5 years) | People with T2DM with inadequate glycaemic control (HbA1c 7% ‐ 9%) on metformin | 2001 to 2008 | Australia, Belgium, Bulgaria, Croatia, Czech Republic, Denmark, Estonia, Finland, France, Germany, Greece, Hungary, Italy, Latvia, Lithuania, Netherlands, New Zealand, Poland, Romania, Russian Federation, Slovakia, Spain, Sweden, Ukraine, UK | Secondary care clinics and general practitioner surgeries, including site management organisations and private diabetes clinics | White: 98 Black: 0.5 Oriental: 0.2 Aboriginal: 0 Asian: 0.2 Indian: 0.09 Maori: 0.09 Middle East Hible: 0.09 Pacific Islander: 0.09 Polynesian: 0.09 Sri Lankan: 0.2 Tahitian: 0.09 | 6.3 (4.4) |
| C: metformin up to 2550 mg/day + rosiglitazone up to 8 mg/day | White: 99 Black: 0.3 Oriental: 0.4 Aboriginal: 0.09 African: 0.09 Asian: 0.09 Egyptian: 0.09 Gipsy: 0.09 | 6.1 (4.2) | ||||||
| Derosa 2009a | I: metformin 850 mg/day + glimepiride 2‐6 mg/day | 65 weeks (65 weeks) | White people with T2DM, who were naive and with poor glycaemic control (HbA1c > 6.5 %) | ‐ | Italy | Outpatients | White 100 | |
| C1: metformin 850‐2550 mg/day + pioglitazone 15‐45 mg/day | White 100 | |||||||
| C2: metformin 1000‐3000 mg/day | White 100 | |||||||
| Derosa 2009b | I: metformin 1500‐3000 mg/day + glibenclamide 7.5‐15 mg/day | 52 weeks (52 weeks) | White people with T2DM, who were naive and with poor glycaemic control (HbA1c > 7%) | ‐ | Italy | Outpatients | White 100 | 4 (2) |
| C: metformin 1500‐3000 mg/day + nateglinide 180‐360 mg/day | White 100 | 5 (2) | ||||||
| Petrica 2009 | I: metformin 1700 mg/day + glimepiride 4 mg/day | 52 weeks (52 weeks) | Normoalbuminuric people with T2DM with poor glycaemic control HbA1c > 7% on metformin monotherapy | ‐ | Romania | Outpatients | ‐ | 10.4 (1.84) |
| C: metformin 1700 mg/day + rosiglitazone 4 mg/day | ‐ | 10.5 (2.99) | ||||||
| NCT00367055 | I: metformin 2000 mg/day + gliclazide 80‐320 mg/day | 156 weeks (156 weeks) | People with T2DM with inadequate glycaemic control (HbA1c 6.5% ‐ 8.5%) on metformin alone | 2004 to 2008 | France | Outpatients | ‐ | > 1 year |
| C: metformin 2000 mg/day + rosiglitazone 4‐8 mg/day | ‐ | > 1 year | ||||||
| Hamann 2008 | I: metformin 2000 mg/day + glibenclamide 5‐15 mg/day or gliclazide 80‐320 mg/day | 52 weeks (52 weeks) | Overweight (BMI ≥ 25 kg/m²) people with T2DM with inadequate glycaemic control (HbA1c ≥ 7% and ≤ 10%) on metformin monotherapy | 2004 to 2006 | Belgium, France, Germany, Ireland, Italy, Lithuania, Mexico, Netherlands, Spain, Switzerland, UK | Outpatients | White 95 | 6.4 (5.6) |
| C: metformin 2000 mg/day + rosiglitazone 4‐8 mg/day | White 94 | 6.3 (5.4) | ||||||
| Ristic 2007 | I: metformin > 1000 mg/day + gliclazide 80‐240 mg/day | 52 weeks (52 weeks) | People with T2DM with inadequate glycaemic control (HbA1c 6.8%‐9%) on metformin > 1000 mg/day | 2001 to 2003 | Austria, Canada, France, Italy, Spain | Outpatients | White: 96.1 Black: 0.8 Asian/Chinese/Japanese: 1.6 Other: 1.6 | 6.7 (5.6) |
| C: metformin > 1000 mg/day + nateglinide 180‐540 mg/day | White: 98.5 Black: 0 Asian/Chinese/Japanese: 0 Other: 1.5 | 7.2 (6.3) | ||||||
| Charbonnel 2005 | I: metformin at pre‐study dose + gliclazide 80‐320 mg/day | 104 weeks (104 weeks) | People with T2DM with inadequate glycaemic control (HbA1c ≥ 7.5% to ≤ 11%) on metformin monotherapy | ‐ | European countries and Australia | Outpatients | White: 100 Oriental: 0 | 5.5 (5.1) |
| C: metformin at pre‐study dose + pioglitazone 15‐45 mg/day | White 99.4 Oriental 0.6 | 5.8 (5.1) | ||||||
| Derosa 2005 | I: metformin 1500 mg/day + glimepiride 2 mg/day | 52 weeks (52 weeks) | People with T2DM with inadequate glycaemic control (HbA1c > 7%) on diet and oral hypoglycaemic agents | ‐ | Italy | Outpatients | ‐ | 4 (3) |
| C: metformin 1500 mg/day + rosiglitazone 4 mg/day | ‐ | 5 (3) | ||||||
| Gerich 2005 | I: metformin 500‐2000 mg/day + glyburide 1.25‐15 mg/day + placebo | 104 weeks (104 weeks) | People with T2DM inadequately controlled (HbA1c 7%‐11%) by diet and exercise | 2001 to 2004 | USA | Outpatients | White: 65.2 Black: 16.7 Asian: 0.5 Other: 17.7 | 2.0 (4.3) |
| C: metformin 500‐2000 mg/day + nateglinide 180‐540 mg/day + placebo | White: 64.4 Black: 13 Asian: 2.4 Other: 20.2 | 1.5 (2.9) | ||||||
| ‐ denotes not reported amedian and interquartile range BMI: body mass index; C: comparator; HbA1c: glycosylated haemoglobin A1c; I: intervention; OAD: oral antidiabetic drug; SD: standard deviation; T2DM: type 2 diabetes mellitus | ||||||||
Appendix 6. Baseline characteristics (II)
| Trial ID | Intervention(s) and comparator(s) | Sex (female %) | Age (mean years (SD)) | HbA1c (mean % (SD)) | BMI (mean kg/m² (SD)) | Comedications/Cointerventions (% of participants) | Co‐morbidities/co‐disorders (% of participants) |
| Handelsman 2017 | I: metformin ≥ 1500 mg/day + glimepiride 1‐6 mg/day + placebo | 44 | 58 (9.0) | 7.4 (0.7) | 31.7 (6.0) | ‐ | ‐ |
| C: metformin ≥ 1500 mg/day + omarigliptin 25 mg/week + placebo | 46 | 58 (10.0) | 7.5 (0.8) | 31.2 (5.3) | |||
| Hollander 2017 | I: metformin ≥ 1500 mg/day + glimepiride 1‐8 mg/day + placebo | 49 | 57.8 (9.2) | 7.8 (0.6) | 31.2 (6.4) | ‐ | ‐ |
| C1: metformin ≥ 1500 mg/day + ertugliflozin 5 mg/day + placebo | 49 | 58.8 (9.7) | 7.8 (0.6) | 31.7 (5.5) | |||
| C2: metformin ≥ 1500 mg/day + ertugliflozin 15 mg/day + placebo | 57 | 58.0 (9.9) | 7.8 (0.6) | 31.3 (6.2) | |||
| Vaccaro 2017 | I: metformin 2000 mg/day + sulphonylurea (glibenclamide 5‐15 mg/day, gliclazide 30‐120 mg/day or glimepiride 2‐6 mg/day) | 42 | 62.2 (6.5) | 7.69 (0.51) | 30.4 (4.5) | Antihypertensive drugs: 70
Lipid‐lowering drugs: 57 Antiplatelet drugs: 38 |
Previous cardiovascular disease: 10 Previous acute myocardial infarction: 6 Previous stroke: 1 Previous acute coronary syndrome: 3 Carotid artery revascularisation: 1 Coronary artery revascularisation: 7 |
| C: metformin 2000 mg/day + pioglitazone 15‐45 mg/day) | 41 | 62.4 (6.4) | 7.67 (0.50) | 30.2 (4.4) | Antihypertensive drugs: 70 Lipid‐lowering drugs: 58 Antiplatelet drugs: 42 | Previous cardiovascular disease: 12 Previous acute myocardial infarction: 7 Previous stroke: 2 Previous acute coronary syndrome: 3 Carotid artery revascularisation: 1 Coronary artery revascularisation: 7 | |
| Dei Cas 2017 | I: metformin ≥ 1500 mg/day + glibenclamide 10 mg/day | 29 | 63 (10) | 7.7 (7.5‐8.1)a | 28.9 (25.4‐34.1)a | Antihypertensive: 75 Lipid‐lowering: 75 Anti‐platelet: 42 | ‐ |
| C: metformin ≥ 1500 mg/day + vildagliptin 100 mg/day | 35 | 61 (9) | 7.7 (7.4‐7.9)a | 29.1 (26.8‐32.9)a | Antihypertensive: 64 Lipid‐lowering: 67 Anti‐platelet: 51 |
‐ | |
| Leiter 2015 | I: metformin ≥ 1500 mg/day + glimepiride 1‐8 mg/day | 45 | 56.3 (9.0) | 7.8 (0.8) | 30.9 (5.5) | ACE‐inhibitor or ARB use: 62.9 Participants who started or modified therapy with lipid‐modifying agents: 13.3 | Obese: 51.5 Neuropathy: 13.9 Retinopathy: 5.6 Nephropathy: 3.3 |
| C1: metformin ≥ 1500 mg/day + canagliflozin 100 mg/day | 48 | 56.4 (9.5) | 7.8 (0.8) | 31.0 (5.3) | ACE‐inhibitor or ARB use: 59.4 Participants who started or modified therapy with lipid‐modifying agents: 13.0 | Obese: 55.5 Neuropathy: 15.5 Retinopathy: 5.4 Nephropathy: 3.7 | |
| C2: metformin ≥ 1500 mg/day + canagliflozin 300 mg/day | 50 | 55.8 (9.2) | 7.8 (0.8) | 31.2 (5.4) | ACE‐inhibitor or ARB use: 60 Participants who started or modified therapy with lipid‐modifying agents: 11.5 | Obese: 53.8 Neuropathy: 12.8 Retinopathy: 7.6 Nephropathy: 3.1 | |
| Del Prato 2015 | I: metformin 1500‐2500 mg/day + glipizide 5‐20 mg/day | 45 | 59 (10) | 7.7 (0.9) | 31.2 (5.1) | Dietary and lifestyle advice | |
| C: metformin 1500‐2500 mg/day + dapagliflozin 2.5‐10 mg/day | 45 | 58 (9) | 7.7 (0.9) | 31.7 (5.1) | Dietary and lifestyle advice | ||
| Schernthaner 2015 | I: metformin at any dose + glimepiride 1‐6 mg/day + placebo | 37 | 72.7 (5.4) | 7.62 (0.65) | 29.3 (4.7) | Counselled on dietary and lifestyle modifications according to usual clinical routine | Musculoskeletal and connective tissue disorders: 33.6 Gastrointestinal disorders: 22.8 Reproductive systems and breast disorders: 16.7 Neoplasms: 13.6 Hypertension: 77.5 Coronary artery disease: 10 Previous myocardial infarction: 5.6 Cardiovascular accident 5.8 Stable angina: 5.8 Lipid disorder: 59.2 |
| C: metformin at any dose + saxagliptin 5 mg/day + placebo | 40 | 72.5 (5.7) | 7.58 (0.67) | 29.9 (5.0) | Counselled on dietary and lifestyle modifications according to usual clinical routine | Musculoskeletal and connective tissue disorders: 33.3 Gastrointestinal disorders: 23.6 Reproductive systems and breast disorders: 14.4 Neoplasms: 14.7 Hypertension: 76.7 Coronary artery disease: 8.6 Previous myocardial infarction: 9.4 Cardiovascular accident: 5.3 Stable angina: 4.7 Lipid disorder: 61.1 | |
| Del Prato 2014 | I: metformin ≥ 1500 mg once daily or maximum tolerated dose + glipizide 5‐20 mg once daily | 50 | 55.4 (9.6) | 7.6 (0.6) | 31.1 (5.3) | ‐ | ‐ |
| C1: metformin ≥ 1500 mg once daily or maximum tolerated dose + alogliptin 12.5 mg once daily | 52 | 55.2 (9.6) | 7.6 (0.6) | 31.3 (5.4) | |||
| C2: metformin ≥ 1500 mg once daily or maximum tolerated dose + alogliptin 25 mg once daily | 49 | 55.5 (9.8) | 7.6 (0.6) | 31.3 (5.3) | |||
| Ahrén 2014 | I: metformin ≥ 1500 mg daily + glimepiride 2‐4 mg once daily + placebo + placebo | 49 | 54.4 (10.0) | 8.1 (0.8) | 32.5 (5.5) | ‐ | ‐ |
| C1: metformin ≥ 1500 mg daily + albiglutide 30‐50 mg once weekly + placebo + placebo | 55 | 54.3 (10.1) | 8.1 (0.8) | 32.7 (5.6) | |||
| C2: metformin ≥ 1500 mg daily + sitagliptin 100 mg once daily + placebo + placebo | 54 | 54.3 (9.8) | 8.1 (0.8) | 32.5 (5.4) | |||
| C3: metformin ≥ 1500 mg daily + placebo + placebo | 50 | 56.1 (10.0) | 8.2 (0.9) | 32.8 (5.4) | |||
| Ridderstråle 2014 | I: metformin immediate release ≥ 1500 mg/day + glimepiride 1‐4 mg/day | 46 | 55.7 (10.4) | 7.9 (0.9) | 30.3 (5.3) | Diet and exercise counselling: 100 Cardiovascular medications: 74 | Not blood pressure controlled (< 130 mmHg/80 mmHg): 69 Estimated glomerular filtration rate 30 to < 60: 3 Macroalbuminuria: 2 |
| C: metformin immediate release ≥ 1500 mg/day + empagliflozin 25 mg/day | 44 | 56.2 (10.3) | 7.9 (0.8) | 29.9 (5.3) | Diet and exercise counselling: 100 Cardiovascular medications: 78 |
Not blood pressure controlled (< 130 mmHg/80 mmHg): 68 Estimated glomerular filtration rate 30 to < 60: 2 Macroalbuminuria: 2 | |
| Göke 2013 | I: metformin ≥ 1500 mg daily + glipizide 5‐20 mg/day | 46 | 57.6 (10.37) | 7.7 (0.9) | 31.3 (6.17) | Advice on diet and exercise | ‐ |
| C: metformin ≥ 1500 mg daily + saxagliptin 5 mg/day | 51 | 57.5 (10.26) | 7.7 (0.9) | 31.5 (5.70) | Advice on diet and exercise | ||
| Maffioli 2013 | I: metformin 2550 mg/day + glibenclamide 10 mg/day | 50 | 61.4 (5.6) | 8.2 (3.6)b | 30.2 (2.9) | Comedication: 6 months of rosuvastatin 5 mg/day: 100 Cointervention: controlled‐energy diet, behaviour‐modification programme and physical activity: 100 |
Overweight: 100 Hepatic steatosis: 100) |
| C: metformin 2550 mg/day + pioglitazone 30 mg/day | 52 | 62.8 (6.3) | 8.4 (3.4) | 30.0 (3.0) | Comedication: 6 months of rosuvastatin 5 mg/day: 100 Cointervention: controlled‐energy diet, behaviour modification programme and physical activity: 100 |
Overweight: 100 Hepatic steatosis: 100 | |
| Nauck 2013 | I: metformin 1500‐2000 mg/day + glimepiride 1‐4 mg/day + placebo | 43 | 57.3 (8.8) | 8.4 (0.9) | 31.2 (4.6) | ‐ | ‐ |
| C1: metformin 1500‐2000 mg/day + liraglutide 0.6 mg/day + placebo | 38 | 56.0 (10.5) | 8.4 (0.9) | 30.5 (4.8) | |||
| C2: metformin 1500‐2000 mg/day + liraglutide 1.2 mg/day + placebo | 46 | 57.2 (9.2) | 8.3 (0.9) | 31.1 (4.8) | |||
| C3: metformin 1500‐2000 mg/day + liraglutide 1.8 mg/day + placebo | 41 | 56.8 (9.4) | 8.3 (0.9) | 30.9 (4.6) | |||
| C4: metformin 1500‐2000 mg/day + placebo + placebo | 41 | 56.0 (9.4) | 8.4 (1.0) | 31.6 (4.4) | |||
| Gallwitz 2012a | I: metformin median dose 2000 mg/day + glimepiride mean dose 2.01 mg/day | 48 | 56 (9.1) | 7.4 (0.7) | 32.3 (3.9) | Antihypertensive drugs: 75 | Overweight: 100 |
| C: metformin median dose 2000 mg/day + exenatide mean dose 17.35 μg/day | 44 | 56 (1.0) | 7.5 (0.7) | 32.6 (4.2) | Antihypertensive drugs: 69 | Overweight: 100 | |
| Gallwitz 2012b | I: metformin ≥ 1500 mg/day + glimepiride 1‐4 mg/day + placebo | 39 | 59.8 (9.4) | 7.69 (0.9) | 30.31 (4.6) | Most participants received other treatments, most commonly antihypertensive drugs | |
| C: metformin ≥ 1500 mg/day + linagliptin 5 mg/day + placebo | 40 | 59.8 (9.4) | 7.69 (0.9) | 30.21 (4.8) | Most participants received other treatments, most commonly antihypertensive drugs | ||
| Derosa 2011a | I: metformin 1000‐2000 mg/day + glimepiride 6 mg/day | 52 | 55 (6) | 8.8 (0.8) | 28.5 (1.4) | Cointervention: controlled‐energy diet, behavior modification program and physical activity: 100 | Overweight: 100 |
| C: metformin 1000‐2000 mg/day + exenatide 20 μg/day | 51 | 56 (7) | 8.7 (0.7) | 28.4 (1.3) | Cointervention: controlled‐energy diet, behavior modification program and physical activity: 100 | Overweight: 100 | |
| Derosa 2011b | I: metformin 1700 ± 850 mg/day + glibenclamide 5‐15 mg/day | 49 | 56.9 (8.8) | 7.5 (1.2) | 28.2 (3.1) | Concomitant medication: 42 Antihypertensives: ACE‐inhibitor: 13.1 ARBs: 12.1 Calcium antagonists: 11.1 β‐Blockers: 3.0 Diuretics: 7.1 α‐Blockers: 8.1 Antidyslipidemics: Statins: 10.1 Fibrates: 4.0 Antiaggregants: Acetylsalicylic acid: 40.4 Ticlopidine: 2.0 Cointervention: controlled‐energy diet, behaviour‐modification programme and physical activity: 100 |
Concomitant disease: 42 Hypertension: 25.2 Dyslipidemia: 15.1 Hypertension + dyslipidaemia: 2.0 |
| C: metformin 1700 ± 850 mg/day + pioglitazone 15‐45 mg/day | 50 | 55.8 (7.9) | 7.4 (1.1) | 27.8 (2.4) | Concomitant medication: 44 Antihypertensives: ACE‐inhibitor: 14.7 ARBs: 10.8 Calcium antagonists: 9.8 β‐Blockers: 3.9 Diuretics: 7.8 α‐Blockers: 5.9 Antidyslipidemics: Statins: 8.8 Fibrates: 5.9 Antiaggregants: Acetylsalicylic acid: 43.1 Ticlopidine: 1.0 Cointervention: controlled‐energy diet, behaviour‐modification programme and physical activity: 100 |
Concomitant disease: 44 Hypertension: 26.5 Dyslipidemia: 11.8 Hypertension + dyslipidaemia: 5.9 | |
| Petrica 2011 | I: metformin 1700 mg/day + glimepiride 4 mg/day | 62 | 58.8 (7.8) | 7.5 (1.0) | 32.1 (6.0) | ACE‐inhibitor or ARB Statins | ‐ |
| C: metformin 1700 mg/day + pioglitazone 30 mg/day | 65 | 56.9 (6.4) | 7.7 (0.8) | 33.7 (6.4) | ACE‐inhibitor or ARB Statins | ||
| Derosa 2010 | I: metformin 1500 ± 500 mg/day + glibenclamide 15 mg/day | 49 | 56 (7) | 8.9 (0.8) | 28.5 (1.4) | Cointervention: controlled‐energy diet, behaviour‐modification programme and physical activity: 100 | Overweight: 100 |
| C: metformin 1500 ± 500 mg/day + exenatide 20 μg/day | 52 | 57 (8) | 8.8 (0.7) | 28.7 (1.5) | Cointervention: controlled‐energy diet, behaviour‐modification programme and physical activity: 100 | Overweight: 100 | |
| Matthews 2010 | I: metformin ≥ 1500 mg twice a day + glimepiride 2‐6 mg/day | 46 | 57.5 (9.19) | 7.3 (0.66) | 31.7 (5.26) | Concomitant medications: ACE‐inhibitors ARBs Diuretics β‐blockers Lipid‐lowering agents Platelet aggregations inhibitors |
‐ |
| C: metformin ≥ 1500 mg twice a day + vildagliptin 50 mg twice a day | 47 | 57.5 (9.07) | 7.3 (0.65) | 31.9 (5.33) | Concomitant medications: ACE‐inhibitors ARBs Diuretics β‐blockers Lipid‐lowering agents Platelet aggregations inhibitors |
‐ | |
| Filozof 2010 | I: metformin 1500 mg/day + gliclazide 80‐320 mg/day | 48 | 59.7 (10.2) | 8.5 (1.0) | 31.2 (5.0) | ‐ | ‐ |
| C: metformin 1500 mg/day + vildagliptin 100 mg/day | 48 | 59.2 (9.9) | 8.5 (1.0) | 30.8 (5.0) | |||
| Seck 2010 | I: metformin ≥ 1500 mg/day + glipizide 5‐20 mg/day | 39 | 56.6 (9.8) | 7.6 (0.9) | 31.3 (5.2) | Counselling on exercise and diet | ‐ |
| C: metformin ≥ 1500 mg/day + sitagliptin 100 mg/day | 43 | 56.8 (9.3) | 7.7 (0.9) | 32.2 (5.0) | Counselling on exercise and diet | ||
| Home 2009 | I: metformin up to 2550 mg/day + glibenclamide (or equivalent for different preparations) up to 15 mg/day or gliclazide up to 240 mg/day or glimepiride up to 4 mg/day | 47 | 57.2 (8.14) | 7.8 (0.7) | 32.7 (5.2) | ‐ | ‐ |
| C: metformin up to 2550 mg/day + rosiglitazone up to 8 mg/day | 46 | 57.0 (8.02) | 7.8 (0.7) | 32.8 (5.0) | |||
| Derosa 2009a | I: metformin 850 mg/day + glimepiride 2‐6 mg/day | 52 | 57.7 (7) | 9.0 (1.1) | 27.1 (1.4) | Cointervention: controlled‐energy diet, behavior modification program, behavior‐modification session on weight‐loss and physical activity: 100 | Overweight: 100 |
| C1: metformin 850‐2550 mg/day + pioglitazone 15‐45 mg/day | 51 | 57 (7) | 9.3 (1.4) | 27.4 (1.6) | Cointervention: controlled‐energy diet, behavior modification program, behavior‐modification session on weight‐loss and physical activity: 100 | Overweight: 100 | |
| C2: metformin 1000‐3000 mg/day | 49 | 55 (5) | 9.1 (1.2) | 27.2 (1.5) | Cointervention: controlled‐energy diet, behavior modification program, behavior‐modification session on weight‐loss and physical activity: 100 | Overweight: (00) | |
| Derosa 2009b | I: metformin 1500‐3000 mg/day + glibenclamide 7.5‐15 mg/day | 50 | 56 (4) | 8.2 (1.1) | 26.5 (1.5) | Cointervention: controlled‐energy diet, behavior modification program, behavior‐modification session on weight‐loss and physical activity: 100 | Hypertension and overweight: 100 |
| C: metformin 1500‐3000 mg/day + nateglinide 180‐360 mg/day | 52 | 55 (5) | 8.1 (1.0) | 26.4 (1.4) | Cointervention: controlled‐energy diet, behavior modification program, behavior‐modification session on weight‐loss and physical activity: 100 | Hypertension and overweight: 100 | |
| Petrica 2009 | I: metformin 1700 mg/day + glimepiride 4 mg/day | 59 | 63.2 (7.2) | 7.6 (1.0) | 33.6 (4.9) | ACE‐inhibitor or ARB Statins |
‐ |
| C: metformin 1700 mg/day + rosiglitazone 4 mg/day | 59 | 63.0 (8.1) | 7.7 (1.2) | 33.6 (4.8) | ACE‐inhibitor or ARB Statins |
||
| NCT00367055 | I: metformin 2000 mg/day + gliclazide 80‐320 mg/day | 39 | 58.1 (8.0) | 7.3 (0.55) | < 25: 0% 25‐30: 49% > 30: 51% |
‐ | ‐ |
| C: metformin 2000 mg/day + rosiglitazone 4‐8 mg/day | 26 | 58.3 (8.4) | 7.5 (0.55) | < 25: 7% 25‐30: 49% > 30: 44% |
|||
| Hamann 2008 | I: metformin 2000 mg/day + glibenclamide 5‐15 mg/day or gliclazide 80‐320 mg/day | 48 | 59.3 (9.2) | 8.0 (1.0) | 32.2 (4.9) | ‐ | Overweight: 100 Dyslipidaemia: 51 Current smoker: 20 Former smoker: 26 |
| C: metformin 2000 mg/day + rosiglitazone 4‐8 mg/day | 47 | 58.5 (9.6) | 8.0 (0.9) | 33.0 (5.9) | Overweight: 100 Dyslipidaemia: 46 Current smoker: 21 Former smoker: 27 | ||
| Ristic 2007 | I: metformin > 1000 mg/day + gliclazide 80‐240 mg/day | 50 | 61.6 (10.1) | 7.6 (0.6) | 29.5 (3.6) | ‐ | ‐ |
| C: metformin > 1000 mg/day + nateglinide 180‐540 mg/day | 46 | 62.0 (11.0) | 7.7 (0.6) | 28.5 (3.5) | |||
| Charbonnel 2005 | I: metformin at pre‐study dose + gliclazide 80‐320 mg/day | 51 | 57 (9.0) | 8.5 (0.9) | 32.6 (5.8) | Dietary advice | ‐ |
| C: metformin at pre‐study dose + pioglitazone 15‐45 mg/day | 49 | 56 (9.2) | 8.7 (1.0) | 32.6 (5.0) | Dietary advice | ||
| Derosa 2005 | I: metformin 1500 mg/day + glimepiride 2 mg/day | 51 | 52 (5) | 7.9 (0.6) | 26.8 (1.5) | Comedication: some taking antihypertensive medications Cointervention: controlled‐energy diet, behaviour‐modification programme, behaviour‐modification session on weight‐loss and physical activity: 100 | 'Metabolic syndrome': 100 |
| C: metformin 1500 mg/day + rosiglitazone 4 mg/day | 48 | 54 (4) | 8.0 (0.7) | 26.6 (1.3) | Comedication: some taking antihypertensive medications Cointervention: controlled‐energy diet, behaviour‐modification programme, behaviour‐modification session on weight‐loss and physical activity: 100 | 'Metabolic syndrome': 100 | |
| Gerich 2005 | I: metformin 500‐2000 mg/day + glyburide 1.25‐15 mg/day + placebo | 52 | 53.5 (11.6) | 8.3 (1.1) | 33.5 (5.6) | ‐ | ‐ |
| C: metformin 500‐2000 mg/day + nateglinide 180‐540 mg/day + placebo | 49 | 52.6 (11.6) | 8.4 (1.2) | 33.3 (6.0) | |||
| ‐ denotes not reported aMedian and interquartile range bHbA1c converted from mmol/mol to percent (www.diabetes.co.uk) ACE: angiotensin‐converting enzyme; ARB: angiotensin receptor blocker; BMI: body mass index; C: comparator; HbA1c: glycosylated haemoglobin A1c; I: intervention; SD: standard deviation | |||||||
Appendix 7. Matrix of trial endpoints (publications and trial documents)
| Handelsman 2017 | Endpoints quoted in trial document(s) (ClinicalTrials.gov, FDA/EMA document, manufacturer's website, published design paper)a,c |
|
Source:NCT01682759 Primary outcome measure(s): change from baseline in HbA1c at week 54, percentage of participants who experienced at least one adverse event excluding data after glycaemic rescue, percentage of participants who discontinued from the study due to an adverse event excluding data after glycaemic rescue Secondary outcome measure(s): change from baseline in fasting plasma glucose at week 54, percentage of participants achieving a HbA1c of < 6.5% at week 54, percentage of participants with an adverse event of symptomatic hypoglycaemia excluding data after glycaemic rescue, change from baseline in body weight at week 54 excluding data after glycaemic rescue, percentage of participants achieving a HbA1c of < 7.0% at week 54 Other outcome measure(s): ‐ Trial results available in trial register: yes | |
| Endpoints quoted in publication(s)b,c | |
|
Primary outcome measure(s): change from baseline in HbA1c at week 54 Secondary outcome measure(s): change from baseline in FPG at week 54, proportion of participants achieving HbA1c goal of < 6.5 % (48mmol/mol), < 7% (53 mmol/mol) at week 54 Other outcome measure(s): any adverse events of symptomatic hypoglycaemia, change from baseline in body weight at week 54, adverse events summary measures, specific adverse events, system organ classes, and predefined limits of change, any adverse event of hypoglycaemia | |
| Endpoints quoted in abstract of publication(s)b,c | |
|
Primary outcome measure(s): ‐ Secondary outcome measure(s): ‐ Other outcome measure(s): change from baseline in HbA1c week 54, symptomatic hypoglycaemia, adverse events, weight change | |
| Hollander 2017 | Endpoints quoted in trial document(s) (ClinicalTrials.gov, FDA/EMA document, manufacturer's website, published design paper)a,c |
|
Source:NCT01999218 Primary outcome measure(s): change from baseline in HbA1C at week 52, number of participants experiencing an adverse event, time frame: up to week 106, number of participants discontinuing study treatment due to an AE, time frame: up to week 104 Secondary outcome measure(s): number of participants with an adverse event of symptomatic hypoglycaemia, time frame: up to week 52, change from baseline in body weight at week 52, change from baseline in systolic blood pressure at week 52 Other outcome measure(s): ‐ Trial results available in trial register: no | |
| Endpoints quoted in publication(s)b,c | |
|
Primary outcome measure(s): change from baseline in HbA1c at week 52 Secondary outcome measure(s): changes from baseline in body weight and systolic blood pressure at week 52 Other outcome measure(s): other efficacy endpoints evaluated at week 52 included the percentage of participants with HbA1c < 53 mmol/mol (7.0%); changes from baseline in diastolic blood pressure, FPG, homeostasis model assessment of b‐cell function, and proinsulin/C‐peptide ratio; the percentage of participants requiring rescue medication; and the percentage of participants meeting the composite endpoints of HbA1c | |
| Endpoints quoted in abstract of publication(s)b,c | |
|
Primary outcome measure(s): ‐ Secondary outcome measure(s): ‐ Other outcome measure(s): change from baseline in HbA1c, body weight and systolic pressure, adverse events, hypoglycaemia, genital mycotic infection, urinary tract infection, hypovolaemia | |
| Vaccaro 2017 | Endpoints quoted in trial document(s) (ClinicalTrials.gov, FDA/EMA document, manufacturer's website, published design paper)a,c |
|
Source:NCT00700856 Primary outcome measure(s): a composite endpoint including: all‐cause mortality, non fatal myocardial infarction (MI) (including silent MI), non fatal stroke, unplanned coronary revascularisation Secondary outcome measure(s): a composite ischemic end point of: sudden death, fatal and non fatal MI (including silent MI), fatal and non fatal stroke, major leg amputation (above the ankle), endovascular or surgical interventions on the coronary, leg or carotid arteries. A composite CV endpoint including the primary endpoint plus heart failure, endovascular or surgical intervention on the coronary, leg or carotid arteries, angina, intermittent claudication with an ankle/brachial index < 0.85. Glycaemic control (changes from baseline in HbA1c, time to failure of oral hypoglycaemic therapy, i.e., HBA1c > 8.0% on two consecutive occasions three months apart). Major cardiovascular risk factors (lipids, blood pressure, microalbuminuria, inflammation markers, waist circumference). Development of nephropathy: plasma creatinine increase of 2 times above the baseline value or creatinine clearance reduction of 20ml/min/1. 73m² or development of microalbuminuria or overt nephropathy (dialysis of plasma creatinine > 3.3 mg/dL). Events of heart failure evaluated according to the American Heart Association and the American Diabetes Association consensus on glitazones and heart failure Other outcome measure(s): ‐ Trial results available in trial register: no | |
| Endpoints quoted in publication(s)b,c | |
|
Primary outcome measure(s): the primary outcome was a composite of first occurrence of all‐cause death, non‐fatal myocardial infarction (including silent myocardial infarction), non‐fatal stroke, or urgent coronary revascularisation Secondary outcome measure(s): the key secondary outcome was a composite of ischaemic cardiovascular disease, which included first occurrence of sudden death, fatal and non‐fatal myocardial infarction (including silent myocardial infarction), fatal and non‐fatal stroke, leg amputation above the ankle, and any revascularisation of the coronary, leg, or carotid arteries. An expanded composite cardiovascular outcome was among the remaining secondary outcomes—this included the primary outcome plus heart failure; any revascularisation of the coronary, leg, or carotid arteries; angina confirmed by new ECG abnormalities; and intermittent claudication with an ankle‐brachial index less than 0.90. The other secondary outcomes were new or worsening nephropathy (i.e. new‐onset macroalbuminuria, twice the baseline levels of serum creatinine, creatinine clearance reduction of ≥ 20 mL/min per 1.73 m², plasma creatinine > 290 μmol/L, or need for permanent dialysis), time to failure of hypoglycaemic treatment (defined as HbA1c ≥ 8% (≥ 64 mmol/mol) on two consecutive visits 3 months apart), and changes in HbA1c and major cardiovascular risk factors (BMI, waist circumference, plasma lipids, blood pressure, microalbuminuria, C‐reactive protein, estimated glomerular filtration rate (eGFR), and heart rate) over time Other outcome measure(s): adverse events | |
| Endpoints quoted in abstract of publication(s)b,c | |
|
Primary outcome measure(s): the primary efficacy outcome is a composite endpoint of all‐cause mortality, nonfatal myocardial infarction, nonfatal stroke, and unplanned coronary revascularization Secondary outcome measure(s): principal secondary outcome is a composite ischemic endpoint of sudden death, fatal and non‐fatal myocardial infarction and stroke, endovascular or surgical intervention on the coronary, leg or carotid arteries, major amputations Other outcome measure(s): adverse effects, quality of life and economic costs will also be evaluated | |
| Dei Cas 2017 | Endpoints quoted in trial document(s) (ClinicalTrials.gov, FDA/EMA document, manufacturer's website, published design paper)a,c |
|
Source:NCT00968812 and NCT01822548 Primary outcome measure(s): absolute and relative change in the circulating endothelial progenitor cells number Secondary outcome measure(s): absolute and relative change in HbA1c compared to baseline Other outcome measure(s): adverse events, hypoglycaemia, hyperglycaemia, abnormal findings in physical exam and laboratory workup Trial results available in trial register: no | |
| Endpoints quoted in publication(s)b,c | |
|
Primary outcome measure(s): circulating endothelial progenitor cells number Secondary outcome measure(s): change in HbA1c Other outcome measure(s): adverse events, hypoglycaemia, hyperglycaemia, BMI, fasting plasma glucose | |
| Endpoints quoted in abstract of publication(s)b,c | |
|
Primary outcome measure(s): endothelial progenitor cells number Secondary outcome measure(s): glycaemic control Other outcome measure(s): inflammatory biomarkers | |
| Leiter 2015 | Endpoints quoted in trial document(s) (ClinicalTrials.gov, FDA/EMA document, manufacturer's website, published design paper)a,c |
|
Source:NCT00968812 Primary outcome measure(s): change in HbA1c from baseline to week 52 Secondary outcome measure(s): "percentage of participants experiencing at least 1 hypoglycemic event from baseline to week 52", "Percent change in body weight from baseline to week 52", "Change in HbA1c from baseline to week 104" Other outcome measure(s): ‐ Trial results available in trial register: yes | |
| Endpoints quoted in publication(s)b,c | |
|
Primary outcome measure(s): change in HbA1c from baseline to week 52 Secondary outcome measure(s): (Cefalu 2013) "... percentage change from baseline in bodyweight, and proportion of patients with documented hypoglycaemic episodes"; (Leiter 2015) "Secondary end points assessed at week 104 included change in A1C, FPG, and systolic and diastolic BP; percentage change in body weight and fasting plasma lipids (including triglycerides, HDL cholesterol [HDL‐C], LDL cholesterol [LDL‐C], LDL‐C/HDL‐C ratio, and non–HDL‐C); and the proportion of patients achieving A1C ,7.0% (53 mmol/mol)" Other outcome measure(s): (Cefalu 2013) "Additional endpoints included the proportion of patients achieving HbA1c less than either 7.0% or 6.5%; change in fasting plasma glucose and systolic and diastolic blood pressure; and percentage change in fasting plasma lipids, including HDL cholesterol, triglycerides, LDL cholesterol, non‐HDL cholesterol, and ratio of LDL cholesterol to HDL cholesterol." "We assessed body composition endpoints for a subset of patients at week 52. Changes from baseline in total fat mass, total lean mass, and percentage of total fat (total fat measurement as a percentage of the sum of total fat measurement, total lean measurement, and bone mineral content)..." "Percentage changes in subcutaneous adipose tissue and visceral adipose tissue, and the change in the ratio of subcutaneous to visceral adipose tissue ..." "We assessed safety with adverse events reports ..." "Additional data collection was prespecified for adverse events of genital mycotic infections and urinary tract infections ..." | |
| Endpoints quoted in abstract of publication(s)b,c | |
|
Primary outcome measure(s): (Cefalu 2013) "The primary endpoint was change in Hba1c from baseline to week 52..." Secondary outcome measure(s): ‐ Other outcome measure(s): ‐ | |
| Del Prato 2015 | Endpoints quoted in trial document(s) (ClinicalTrials.gov, FDA/EMA document, manufacturer's website, published design paper)a,c |
|
Source:NCT00660907 Primary outcome measure(s): adjusted mean change in HbA1c levels from baseline to week 52 Secondary outcome measure(s): adjusted mean change in body weight from baseline to week 52, proportion of participants with at least one episode of hypoglycaemia from baseline to week 52, proportion of participants with body weight reduction of at least 5% Other outcome measure(s): ‐ Trial results available in trial register: yes | |
| Endpoints quoted in publication(s)b,c | |
|
Primary outcome measure(s): (Nauck 2011, Nauck 2014 in Del Prato 2015, and Del Prato 2015) absolute change in Hba1c from baseline to week 52 Secondary outcome measure(s): "absolute change in total body weight from baseline to week 52, proportion of participants reporting at least one episode of hypoglycaemia (major, minor or other episode) during the 52 week treatment period, the proportion of participants achieving a total body weight decrease ≥ 5% from baseline to week 52" Other outcome measure(s): (Nauck 2011 in Del Prato 2015) "change from baseline to week 52 for body weight in participants with a baseline BMI ≥ 30 kg/m² and in those with baseline BMI ≥ 27 kg/m², waist circumference, change in HbA1c in participants with an HbA1c of ≥ 7% at baseline, and FPG. The proportions of participants with HbA1c < 7% at week 52 in participants with baseline HbA1c ≥ 7% and proportions of participants with HbA1c ≤ 6.5% at week 52 were also assessed. Absolute changes from baseline to week 52 for seated systolic and diastolic blood pressure, and percent changes from baseline to week 52 for total cholesterol, LDL cholesterol, HDL cholesterol, triglycerides, and free fatty acids were assessed. Safety and tolerability was assessed by collating data on AEs using the Medical Dictionary for Regulatory Activities (MedDRA version 12.1), hypoglycaemic events, laboratory tests, calculated creatinine clearance, urinary glucose/creatinine ratio, electrocardiographic and physical examinations, and vital signs. In addition, participants were actively questioned at each study visit to assess signs, symptoms, and reports suggestive of genital infections and UTIs. These responses, and those obtained spontaneously, were categorised in the database using a predefined list of MedDRA terms suggestive of genital infections and UTIs." (Nauck 2014 in Del Prato 2015) "The durability of glycaemic control was evaluated by examining the change from baseline in HbA1c and FPG over 104 weeks and the proportion of participants discontinuing treatment because of a lack of glycaemic control or hypoglycaemia over 104 weeks, and by calculating the CoF for HbA1c and FPG from 18 weeks (end of titration period) to 104 weeks. CoF analyses were not protocol pre‐specified. The maintenance of weight loss was evaluated by examining the change from baseline in total body weight over 104 weeks, and the proportion of participants achieving ≥ 5% reduction in body weight at week 104. The change from baseline in seated systolic blood pressure over 104 weeks was also evaluated. AEs of special interest included the proportion of participants reporting at least one hypoglycaemic event by weeks 18, 52 and week 104, and events suggestive of vulvovaginitis, balanitis and related genital infections (excluding sexually transmitted diseases) and of UTI by 52 and 104 weeks." (Del Prato 2015) "All variables analysed for the 52‐week period were re‐examined during the study extensions. All analyses during the extension periods were considered exploratory. All endpoints were reported as changes from a specific time point to weeks 52, 104 and 208. Glycaemic response was analysed in all participants based on baseline HbA1c: > 6.5, ≥ 7.0, < 8.0, ≥ 8.0, < 9.0 and ≥ 9.0%. The additional endpoints assessed included changes from baseline to week 208 in FPG, systolic blood pressure and diastolic blood pressure, total body weight and waist circumference, and rates of, and time to, study discontinuation and glycaemic rescue before or at week 208. Rates of AEs of interest (including hypoglycaemia, genital and urinary tract infections and renal impairment) were assessed at each study extension to account for participant attrition over time. In addition to the variables of hypoglycaemia and urinary glucose/creatinine ratio, participants were actively questioned on, or self‐reported, symptoms suggestive of genital infection or urinary tract infection at each study visit" | |
| Endpoints quoted in abstract of publication(s)b,c | |
|
Primary outcome measure(s): (Nauck 2011 in Del Prato 2015) adjusted mean Hba1c change at 52 weeks Secondary outcome measure(s): adjusted mean weight change at 52 weeks, proportion of participants achieving ≥ 5% body weight reduction, proportion experiencing hypoglycaemia Other outcome measure(s): ‐ | |
| Schernthaner 2015 | Endpoints quoted in trial document(s) (ClinicalTrials.gov, FDA/EMA document, manufacturer's website, published design paper)a,c |
|
Source:NCT01006603 Primary outcome measure(s): proportion of participants reaching HbA1c < 7% after 52 weeks of treatment without confirmed or severe hypoglycaemia Secondary outcome measure(s): proportion of participants having experienced at least one hypoglycaemic event (confirmed or severe) over the 52‐week double‐blind treatment period, change from baseline to week 52 in HbA1c, proportion of participants achieving a therapeutic glycaemic response at week 52 defined as HbA1c < 7.0%, change from baseline to week 52 in FPG, change from baseline to week 52 in insulin, change from baseline to week 52 in β‐cell function Other outcome measure(s): ‐ Trial results available in trial register: yes | |
| Endpoints quoted in publication(s)b,c | |
|
Primary outcome measure(s): proportion of participants achieving an HbA1c level of < 7.0% at week 52 without confirmed/severe hypoglycaemia Secondary outcome measure(s): the key secondary endpoint was the proportion of participants with ≥ 1 confirmed/severe hypoglycaemic event over the treatment period. Other secondary endpoints included the proportion of participants achievingHbA1c < 7.0 or ≤ 6.5% at week 52, and the change from baseline to week 52 in mean HbA1c Other outcome measure(s): post hoc analyses were conducted to determine the number of confirmed/severe hypoglycaemic events over time, and the incidence of confirmed/severe hypoglycaemia by HbA1c category at week 52 (< 7.0% or ≥ 7.0%) stratified by age group, and by HbA1c category at week 52 (< 6.5%; ≥ 6.5 to < 7.0%; ≥ 7.0 to < 7.5, and ≥ 7.5%). Safety and tolerability assessments included adverse events and body weight | |
| Endpoints quoted in abstract of publication(s)b,c | |
|
Primary outcome measure(s): achievement of HbA1c < 7.0% at week 52 without confirmed/severe hypoglycaemia Secondary outcome measure(s): the key secondary endpoint was incidence of confirmed/severe hypoglycaemia Other outcome measure(s): safety and tolerability | |
| Del Prato 2014 | Endpoints quoted in trial document(s) (ClinicalTrials.gov, FDA/EMA document, manufacturer's website, published design paper)a,c |
|
Source:NCT00856284 Primary outcome measure(s): "change from baseline in HbA1c at week 52", "change from baseline in HbA1c at week 104" Secondary outcome measure(s): "change from baseline in HbA1c at other time points", "change from baseline in FPG over time", "percentage of participants with HbA1c less than or equal to 6.5%", "percentage of participants with HbA1c less than or equal to 7.0%", "change from baseline in body weight over time" Other outcome measure(s): ‐ Trial results available in trial register: yes | |
| Endpoints quoted in publication(s)b,c | |
|
Primary outcome measure(s): the primary efficacy endpoint was the change in HbA1c from baseline to week 52 and to week 104 Secondary outcome measure(s): secondary and exploratory efficacy endpoints included (i) changes over time in HbA1c and FPG, (ii) incidence of clinical response (HbA1c ≤ 6.5 % and ≤ 7.0 %) at week 104, (iii) changes in body weight over time, (iv) incidence of hyperglycaemic rescue, and (v) changes in 2‐h PPG over time Other outcome measure(s): safety endpoints included incidence of hypoglycaemia, MACE or pancreatitis, as well as standard general safety endpoints | |
| Endpoints quoted in abstract of publication(s)b,c | |
|
Primary outcome measure(s): the primary endpoint was least square mean change from baseline in HbA1c level at 104 weeks Secondary outcome measure(s): ‐ Other outcome measure(s): FPG, mean weight change, hypoglycaemia, pancreatitis | |
| Ahrén 2014 | Endpoints quoted in trial document(s) (ClinicalTrials.gov, FDA/EMA document, manufacturer's website, published design paper)a,c |
|
Source:NCT00838903 Primary outcome measure(s): change from baseline in HbA1c at week 104 Secondary outcome measure(s): change from baseline in HbA1c at week 156; change from baseline in fasting plasma glucose at week 104 and week 156; number of participants who achieved clinically meaningful HbA1c response levels of < 6.5%, < 7%, and < 7.5% at week 104 and week 156; time to hyperglycaemia rescue until week 156; change from baseline in body weight at week 104 and week 156 Other outcome measure(s): serious adverse events, other adverse events Trial results available in trial register: yes | |
| Endpoints quoted in publication(s)b,c | |
|
Primary outcome measure(s): the primary end point was the change in model‐adjusted HbA1c from baseline to week 104 between albiglutide and the comparators Secondary outcome measure(s): secondary end points included changes in HbA1c, fasting plasma glucose, and weight from baseline over time; the proportion of participants who achieved HbA1c treatment goals (i.e. 6.5% (47.5 mmol/mol), 7.0% (53.0 mmol/mol) and 7.5% (58.5 mmol/mol)); and time to hyperglycaemic rescue Other outcome measure(s): safety and tolerability were assessed, including adverse events and serious adverse events; safety events of special interest (i.e. gastrointestinal or hypoglycaemic events, injection‐site reactions, pancreatitis, thyroid tumours, potential systematic allergic reactions and cardiovascular events; clinical laboratory evaluations; physical examinations; 12‐lead electrocardiograms; vital sign measurements; and immunogenicity | |
| Endpoints quoted in abstract of publication(s)b,c | |
|
Primary outcome measure(s): the primary end point was change in HbA1c from baseline at week 104 Secondary outcome measure(s): secondary end points included fasting plasma glucose, weight, and time to hyperglycaemic rescue Other outcome measure(s): serious adverse events, diarrhoea, nausea | |
| Ridderstråle 2014 | Endpoints quoted in trial document(s) (ClinicalTrials.gov, FDA/EMA document, manufacturer's website, published design paper)a,c |
|
Primary outcome measure(s): change from baseline in HbA1c after 52 and 104 weeks of treatment Secondary outcome measure(s): change from baseline in body weight after 52 and 104 weeks of treatment, occurrence of confirmed hypoglycaemic AEs during 52 and 104 weeks of treatment Other outcome measure(s): HbA1c < 7.0% or < 6.5% after 52, 104 and 208 weeks of treatment, HbA1c lowering by ≥ 0.5% after 52, 104 and 208 weeks of treatment, change from baseline in HbA1c after 208 weeks of treatment, coefficient of durability for HbA1c response, change from baseline in FPG after 52, 104 and 208 weeks of treatment, change from baseline in mean daily glucose (8‐point) after 52, 104 and 208 weeks of treatment (substudy), change from baseline in 2‐h PPG after 52, 104 and 208 weeks of treatment and follow‐up (4 weeks after treatment discontinuation) (substudy), biomarkers of insulin secretion and resistance after 104 and 208 weeks of treatment and (in the mean tolerance test substudy) follow‐up (4 weeks after treatment discontinuation), confirmed hypoglycaemic AEs during 208 weeks of treatment Change from baseline in body weight of > 2% and > 5% after 52, 104 and 208 weeks of treatment, change from baseline in body weight after 208 weeks of treatment and follow‐up (4 weeks after treatment discontinuation), change from baseline in waist circumference after 52, 104 and 208 weeks of treatment and follow‐up (4 weeks after treatment discontinuation), changes from baseline in trunk fat, limb fat, fat‐free mass and total fat mass (using DXA scan) after 52, 104 and 208 weeks of treatment (substudy), changes from baseline in bone mineral density and T‐scores (using DXA scan) after 52, 104 and 208 weeks of treatment (substudy), changes from baseline in abdominal VAT, abdominal SAT and VAT/SAT ratio (using MRI) after 52, 104 and 208 weeks of treatment (substudy), proportion of participants with BP < 130/80 mmHg after 52, 104 and 208 weeks of treatment, change from baseline in SBP and DBP after 208 weeks of treatment and follow‐up (4 weeks after treatment discontinuation), HbA1c < 7.0% or HbA1c reduction ≥ 1.0%, no confirmed hypoglycaemic AEs, and weight loss > 2% after 52, 104 and 208 weeks of treatment HbA1c < 6.5% or HbA1c reduction ≥ 1.0%, no confirmed hypoglycaemic AEs, and weight loss > 2% after 52, 104 and 208 weeks of treatment, change from baseline in lipid profile after 52, 104 and 208 weeks of treatment and follow‐up (4 weeks after treatment discontinuation) Trial results available in trial register: yes | |
| Endpoints quoted in publication(s)b,c | |
|
Primary outcome measure(s): change from baseline in HbA1c concentrations at weeks 52 and 104 Secondary outcome measure(s): occurrence of confirmed hypoglycaemic adverse events (plasma glucose ≤ 3.9 mmol/L or requiring assistance) up to weeks 52 and 104, changes from baseline in bodyweight, systolic blood, pressure, and diastolic blood pressure at weeks 52 and 104 Other outcome measure(s): percentage of participants who received rescue therapy (increases in the dose of metformin or additional antidiabetes treatment) over 104 weeks, percentage of participants with HbA1c concentrations of at least 7% who achieved a level of less than 7%, percentage of participants with bodyweight reductions of > 5%, changes from baseline in fasting plasma glucose at weeks 52 and 104 Safety endpoints were adverse events, vital signs, and clinical laboratory findings. Events consistent with urinary tract infection, genital infection, and volume depletion were identified from adverse events reported spontaneously by the investigator using prospectively defined search categories based on 73, 89, and eight preferred terms, respectively, according to the Medical Dictionary for Regulatory Activities (version 15.0) | |
| Endpoints quoted in abstract of publication(s)b,c | |
|
Primary outcome measure(s): change from baseline in HbA1c levels at week 52 and 104 Secondary outcome measure(s): ‐ Other outcome measure(s): adverse events, severe adverse events, confirmed hypoglycaemic adverse events | |
| Göke 2013 | Endpoints quoted in trial document(s) (ClinicalTrials.gov, FDA/EMA document, manufacturer's website, published design paper)a,c |
|
Source:NCT00575588 Primary outcome measure(s): HbA1c change from baseline to week 52 Secondary outcome measure(s): proportion of participants reporting at least one episode of any hypoglycaemic event over 52 weeks, body weight change from baseline to week 52, mean slope of the regressions of change from week 24 to week 52 in HbA1c Other outcome measure(s): ‐ Trial results available in trial register: yes | |
| Endpoints quoted in publication(s)b,c | |
|
Primary outcome measure(s): ‐ Secondary outcome measure(s): ‐ Other outcome measure(s): adverse events, serious adverse events, change from baseline in HbA1c, proportion of participants reporting at least one hypoglycaemic event during 104 weeks of treatment, change from baseline in body weight, durability of change from baseline HbA1c from week 24 to week 104, change from baseline FPG | |
| Endpoints quoted in abstract of publication(s)b,c | |
|
Primary outcome measure(s): ‐ Secondary outcome measure(s): ‐ Other outcome measure(s): adverse events, hypoglycaemia, weight change, change from baseline in HbA1c | |
| Maffioli 2013 | Endpoints quoted in trial document(s) (ClinicalTrials.gov, FDA/EMA document, manufacturer's website, published design paper)a,c |
| N/T | |
| Endpoints quoted in publication(s)b,c | |
|
Primary outcome measure(s): ‐ Secondary outcome measure(s): ‐ Other outcome measure(s): "We evaluated the following parameters at baseline, and after 6 and 12 months: body weight, BMI, HbA1c, fasting plasma glucose, postprandial glucose (PPG), fasting plasma insulin (FPI), total cholesterol (TC), low‐density lipoprotein‐cholesterol (LDL‐C), high‐density lipoprotein‐ cholesterol (HDL‐C), triglycerides (Tg), adiponectin (ADN), leptin, tumor necrosis factor‐a (TNF‐a), interleukin‐6 (IL‐6), and high‐sensitivity C‐reactive protein (Hs‐CRP). An euglycemic hyperinsulinemic clamp was performed at the baseline, and after 6 and 12 months to determine the glucose infusion rate (GIR); the participants also underwent an ultrasound examination at baseline, and after 6 and 12 months, performed by the same operator, to evaluate steatosis degree, defined as ultrasound grading (0–3), subcutaneous adipose tissue (SAT), and visceral adipose tissue diameter (VAT)"; "... all adverse events were recorded" | |
| Endpoints quoted in abstract of publication(s)b,c | |
|
Primary outcome measure(s): ‐ Secondary outcome measure(s): ‐ Other outcome measure(s): "Patients underwent an ultrasound examination for evaluation of steatosis degree, subcutaneous adipose tissue, and visceral adipose tissue diameter, an euglycemic hyperinsulinemic clamp, and blood sample collection for evaluation of glycemic control, fasting plasma insulin, lipid profile, adipocytokines at randomization, and after 6 and 12 months" | |
| Nauck 2013 | Endpoints quoted in trial document(s) (ClinicalTrials.gov, FDA/EMA document, manufacturer's website, published design paper)a,c |
|
Source:NCT00318461 Primary outcome measure(s): change in HbA1c at week 26 and week 104 Secondary outcome measure(s): change in body weight at week 26 and week 104, change in FPG at week 26 and week 104, change in mean prandial increments of plasma glucose based on self‐measured 7‐point plasma glucose profiles at week 26 and week 104, change in mean post prandial plasma glucose based on self‐measured 7‐point plasma glucose profiles at week 26 and week 104, change in beta‐cell function at week 26 and week 104, hypoglycaemic episodes at week 26 and week 104 Other outcome measure(s): ‐ Trial results available in trial register: yes | |
| Endpoints quoted in publication(s)b,c | |
|
Primary outcome measure(s): (Nauck 2009 in Nauck 2013, and Nauck 2013) change in Hba1c at week 26 and week 104 Secondary outcome measure(s): change in body weight, FPG, 7‐point plasma glucose profiles (before each meal, 90 min after breakfast, lunch, and dinner, and at bedtime), and beta‐cell function based on fasting insulin, fasting C‐peptide, fasting proinsulin‐to‐insulin ratio, and the HOMA‐B Other outcome measure(s): safety variables included adverse events, physical examination, vital signs, ophthalmoscopy, electrocardiogram, biochemical and hematology measures, urinalysis and subject‐reported hypoglycemic episodes (based on symptoms and plasma glucose < 3.1 mmol/L). Analyses of fasting glucagon, lipids (cholesterol, triglycerides (TG), free fatty acids and apolipoprotein B (ApoB)), blood pressure and cardiovascular markers (high‐sensitivity C‐reactive protein (hsCRP), plasminogen activator inhibitor‐1 (PAI‐1) and N‐terminal B‐type natriuretic peptide (NT‐proBNP)) were undertaken. (Hermansen 2010 in Nauck 2013) impact of weight on quality of life | |
| Endpoints quoted in abstract of publication(s)b,c | |
|
Primary outcome measure(s): ‐ Secondary outcome measure(s): ‐ Other outcome measure(s): HbA1c, body weight, hypoglycaemia, nausea | |
| Gallwitz 2012a | Endpoints quoted in trial document(s) (ClinicalTrials.gov, FDA/EMA document, manufacturer's website, published design paper)a,c |
|
Source:NCT00359762 Primary outcome measure(s): number of participants with treatment failure, time to treatment failure Secondary outcome measure(s): homeostasis model assessment of beta‐cell function, change in HOMA‐B from baseline to endpoint, fasting proinsulin/insulin ratio at year 3, change in fasting proinsulin/insulin ratio from baseline to endpoint, ratio of the 30‐min increment in plasma insulin concentration and the 30‐min increment in plasma glucose during the oral glucose tolerance test (DI30/DG30 Ratio) at year 3, change in DI30/DG30 ratio from baseline to endpoint, disposition index at year 3, change in disposition index from baseline to endpoint, change in HbA1c from baseline to year 3, change in HbA1c from baseline to endpoint, fasting plasma glucose at year 3, change in fasting plasma glucose from baseline to endpoint, postprandial (2 hours) plasma glucose at year 3, change in postprandial (2 hours) plasma glucose from baseline to endpoint, change in body weight from baseline to year 3, systolic blood pressure at year 3, diastolic blood pressure at year 3, heart rate at year 3, triglycerides at year 3, total cholesterol at year 3, high‐density lipoprotein cholesterol at year 3, hypoglycaemia rate per year, change in HbA1c from baseline to year 2 for participants randomised at entry in period III, change in HbA1c from baseline to year 2 for participants not randomised at entry in period III, hypoglycaemia rate per year in period III Other outcome measure(s): ‐ Trial results available in trial register: yes | |
| Endpoints quoted in publication(s)b,c | |
|
Primary outcome measure(s): the primary outcome was time to inadequate glycaemic control, defined as an HbA1c concentration of > 9% after the first 3 months of treatment, or > 7% at two consecutive visits 3 months apart after the first 6 months Secondary outcome measure(s): secondary outcomes were markers of β‐cell function, bodyweight, hypoglycaemia, and surrogate markers of cardiovascular risk (blood pressure and heart rate) Other outcome measure(s): adverse events | |
| Endpoints quoted in abstract of publication(s)b,c | |
|
Primary outcome measure(s): time to inadequate glycaemic control and need for alternative treatment, defined as an HbA1c concentration of > 9% after the first 3 months of treatment, or > 7% at two consecutive visits after the first 6 months Secondary outcome measure(s): ‐ Other outcome measure(s): adverse events | |
| Gallwitz 2012b | Endpoints quoted in trial document(s) (ClinicalTrials.gov, FDA/EMA document, manufacturer's website, published design paper)a,c |
|
Source:NCT00622284 Primary outcome measure(s): HbA1c change from baseline at week 52, HbA1c change from baseline at week 104 Secondary outcome measure(s): body weight change from baseline at week 52, body weight change from baseline at week 104, incidence of hypoglycaemic events up to 52 weeks, incidence of hypoglycaemic events up to 104 weeks, FPG change from baseline at week 52, FPG change from baseline at week 104, percentage of participants with HbA1c < 7.0% at week 52, percentage of participants with HbA1c < 7.0% at week 104, percentage of participants with HbA1c < 6.5% at week 52, percentage of participants with HbA1c < 6.5% at week 104, percentage of participants with HbA1c lowering by 0.5% at week 104, 2 hr PPG change from baseline at week 104, HbA1c change at week 4, HbA1c change at week 8, HbA1c change at week 12, HbA1c change at week 16, HbA1c change at week 28, HbA1c change at week 40, HbA1c change at week 52, HbA1c change at week 65, HbA1c change at week 78, HbA1c change at week 91, HbA1c change at week 104, change in baseline lipid parameter cholesterol at week 104, change in HDL at week 104, change in LDL at week 104, change in baseline lipid parameter triglyceride at week 104 Other outcome measure(s): ‐ Trial results available in trial register: yes | |
| Endpoints quoted in publication(s)b,c | |
|
Primary outcome measure(s): the primary efficacy endpoint was change in HbA1c from baseline to week 104 Secondary outcome measure(s): the two key secondary endpoints were occurrence of hypoglycaemic episodes up to 104 weeks and change in bodyweight from baseline to week 104. Other secondary endpoints were change in HbA1c from baseline to week 52, HbA1c reduction over time, occurrence of HbA1c on treatment of < 7.0% or < 6.5% at week 104, occurrence of HbA1c reduction of ≥ 0.5% at week 104, change in FPG from baseline to week 52 and 104, change in 2‐h postprandial glucose from baseline to week 104 during a meal tolerance test in a subset of participants who received a standardised breakfast of two nutrition bars and a drink (Ensure Plus, Abbott Nutrition, Columbus, OH, USA), and changes from baseline in total cholesterol, LDL cholesterol, HDL cholesterol, and triglycerides. The changes in plasma proinsulin/insulin ratio and in HOMA‐IR from baseline to week 104 were used to indirectly assess pancreatic β‐cell function and insulin resistance Other outcome measure(s): safety and tolerability endpoints included the incidence and intensity of adverse events, withdrawals because of adverse events, physical examination, 12‐lead electrocardiogram, vital signs, and clinical laboratory measures. Hypoglycaemic events and severe hypoglycaemic episodes were also recorded. Treatment‐emergent fatal events, suspected events of stroke, myocardial ischaemia (including myocardial infarction), admission to hospital for heart failure, stent thrombosis, and revascularisation procedures | |
| Endpoints quoted in abstract of publication(s)b,c | |
|
Primary outcome measure(s): change in HbA1c from baseline to week 104 Secondary outcome measure(s): ‐ Other outcome measure(s): hypoglycaemia, severe hypoglycaemia, cardiovascular events | |
| Derosa 2011a | Endpoints quoted in trial document(s) (ClinicalTrials.gov, FDA/EMA document, manufacturer's website, published design paper)a,c |
| N/T | |
| Endpoints quoted in publication(s)b,c | |
|
Primary outcome measure(s): the primary endpoint of this study was to evaluate the effect of these two different drugs on body weight, glycemic control, insulin resistance related‐parameters and inflammatory biomarkers Secondary outcome measure(s): ‐ Other outcome measure(s): "In order to evaluate the tolerability assessments, all adverse events were recorded" | |
| Endpoints quoted in abstract of publication(s)b,c | |
|
Primary outcome measure(s): ‐ Secondary outcome measure(s): ‐ Other outcome measure(s): body weight, glycemic control and insulin resistance | |
| Derosa 2011b | Endpoints quoted in trial document(s) (ClinicalTrials.gov, FDA/EMA document, manufacturer's website, published design paper)a,c |
| N/T | |
| Endpoints quoted in publication(s)b,c | |
|
Primary outcome measure(s): the primary endpoint of this study is to evaluate the effect of pioglitazone or glibenclamide when added to metformin therapy on metabolic and inflammatory parameters after an OFL Secondary outcome measure(s): the effects of pioglitazone and glibenclamide on metabolic and inflammatory parameters after 12 months of treatment in a baseline situation Other outcome measure(s): ‐ | |
| Endpoints quoted in abstract of publication(s)b,c | |
|
Primary outcome measure(s): ‐ Secondary outcome measure(s): ‐ Other outcome measure(s): "We evaluated glycemic‐metabolic parameters [glycated hemoglobin (HbA 1c ), fasting plasma glucose (FPG), fasting plasma insulin (FPI), homeostasis model assessment (Homa) index], total cholesterol (TC), low density lipoprotein‐cholesterol (LDL‐C), high density lipoprotein‐ cholesterol (HDL‐C), triglycerides (Tgs), interleukin‐6 (IL‐6), high sensitivity C‐reactive protein (Hs‐CRP), tumor necrosis factor‐ α (TNF‐α ), and adiponectin (ADN)" | |
| Petrica 2011 | Endpoints quoted in trial document(s) (ClinicalTrials.gov, FDA/EMA document, manufacturer's website, published design paper)a,c |
| N/T | |
| Endpoints quoted in publication(s)b,c | |
|
Primary outcome measure(s): ‐ Secondary outcome measure(s): ‐ Other outcome measure(s): plasma asymmetric dimethyl‐arginine (ADMA), serum creatinine, GFR, high sensitive C‐reactive protein (hsCRP), fibrinogen, glycaemia, glycated haemoglobin (HbA1c), cholesterol, triglycerides, haemoglobin, urine albumin: creatinine ratio (UACR), urinary beta2‐microglobulin, and urinary alpha1‐microglobulin | |
| Endpoints quoted in abstract of publication(s)b,c | |
|
Primary outcome measure(s): ‐ Secondary outcome measure(s): ‐ Other outcome measure(s): urinary albumin:creatinine ratio (UACR), urinary alpha1‐microglobulin, urinary beta2‐microglobulin, plasma asymmetric dimethyl‐arginine (ADMA), GFR, hsC‐reactive protein, fibrinogen, HbA1c; pulsatility index, resistance index in the internal carotid artery and middle cerebral artery, intima media thickness in the common carotid artery; cerebrovascular reactivity | |
| Derosa 2010 | Endpoints quoted in trial document(s) (ClinicalTrials.gov, FDA/EMA document, manufacturer's website, published design paper)a,c |
| N/T | |
| Endpoints quoted in publication(s)b,c | |
|
Primary outcome measure(s): ‐ Secondary outcome measure(s): ‐ Other outcome measure(s): "The aim of this study was to evaluate the effects of a 1‐year treatment with exenatide compared to glibenclamide in type 2 diabetes patients on body weight, glycemic control, and β‐cell function but also on insulin resistance and inflammatory state parameters like resistin, retinol binding protein‐4 (RBP‐4), and high‐sensitivity C‐reactive protein (Hs‐CRP)"; "In order to evaluate the tolerability assessments, all adverse events were recorded" | |
| Endpoints quoted in abstract of publication(s)b,c | |
|
Primary outcome measure(s): ‐ Secondary outcome measure(s): ‐ Other outcome measure(s): body weight, glycemic control, β‐cell function, insulin resistance, and inflammatory state | |
| Matthews 2010 | Endpoints quoted in trial document(s) (ClinicalTrials.gov, FDA/EMA document, manufacturer's website, published design paper)a,c |
|
Source:NCT00106340 Primary outcome measure(s): time to HbA1c > 8% at week 104 Source: Novartis Summary report Primary outcome measure(s): change in Hba1c from baseline to week 104 endpoint Secondary outcome measure(s): change from baseline in HbA1c at 5 years (2 years, amended), adverse event profile after 5 years of treatment (2 years, amended), coefficient of failure for HbA1c from week 24‐5 years (2 years, amended), change from baseline in fasting plasma glucose at 5 years (2 years amended), change from baseline in body weight at 5 years (2 years amended) Other outcome measure(s): (Novartis Summary report) risk of failure of glycaemic control over time Trial results available in trial register: no | |
| Endpoints quoted in publication(s)b,c | |
|
Primary outcome measure(s): change from baseline in Hba1c at study endpoint Secondary outcome measure(s): HbA1c responder rates (HbA1c ≥ 7% at baseline and < 7% at week 104 endpoint or HbA1c > 6.5% at baseline and ≤ 6.5% at week 104 endpoint), predefined subgroup analysis according to age (≥ 65 or < 65 years) at baseline, CoF, FPG, body weight, fasting lipids, β‐cell function and insulin resistance parameters Other outcome measure(s): AE, SAE, hypoglycaemic events, severe hypoglycaemia | |
| Endpoints quoted in abstract of publication(s)b,c | |
|
Primary outcome measure(s): ‐ Secondary outcome measure(s): ‐ Other outcome measure(s): change in Hba1c at 2 years, proportion of participants reaching Hba1c < 7%, hypoglycaemia, body weight | |
| Filozof 2010 | Endpoints quoted in trial document(s) (ClinicalTrials.gov, FDA/EMA document, manufacturer's website, published design paper)a,c |
|
Source:NCT00102466 Primary outcome measure(s): change from baseline in HbA1c at 52 weeks Secondary outcome measure(s): adverse event profile after 52 weeks of treatment, change from baseline in fasting plasma glucose at 52 weeks, participants with endpoint HbA1c < 7% at 52 weeks, participants with reduction in HbA1c ≥ 0.7% after 52 weeks, participants with reduction in HbA1c ≥ 0.5% after 52 weeks Other outcome measure(s): ‐ Trial results available in trial register: no | |
| Endpoints quoted in publication(s)b,c | |
|
Primary outcome measure(s): change in HbA1c from baseline to week 52 Secondary outcome measure(s): proportion of participants achieving HbA1c targets of < 7.0% and ≤ 6.5%, changes in FPG, body weight, B‐cell function (fasting proinsulin, fasting proinsulin/insulin ratio, HOMA‐B) and insulin resistance (fasting insulin, HOMA‐IR) Other outcome measure(s): "Subgroup analyses of change in HbA1c from baseline at the endpoint were performed according to baseline HbA1c (HbA1c ≤ 8.0% and > 8.0%; ≤ 9.0% and > 9.0%), age (≤ 65 years and > 65 years), gender and baseline body mass index (BMI) (< 30.0, ≥ 30.0 and ≥ 35.0 kg/m²)"; "Safety assessments consisted of monitoring and recording all adverse events (AEs) and serious adverse events (SAEs), regular monitoring of haematology, blood chemistry and urine, and regular assessments of vital signs, electrocardiogram (ECG), physical condition and body weight" | |
| Endpoints quoted in abstract of publication(s)b,c | |
|
Primary outcome measure(s): ‐ Secondary outcome measure(s): ‐ Other outcome measure(s): change from baseline glycated haemoglobin (HbA1c), proportion of participants reaching HbA1c < 7%, hypoglycaemic events, fasting plasma glucose, adverse events, serious adverse events, weight change | |
| Seck 2010 | Endpoints quoted in trial document(s) (ClinicalTrials.gov, FDA/EMA document, manufacturer's website, published design paper)a,c |
|
Source:NCT00094770 Primary outcome measure(s): change from baseline in HbA1c at week 52 Secondary outcome measure(s): change from baseline in HbA1c at week 104, change from baseline in body weight at week 52, change from baseline in body weight at week 104, hypoglycemic events at week 52, hypoglycemic events at week 104, number of participants with clinical adverse experiences at week 104, number of participants with serious clinical adverse experiences at week 104, number of participants with drug‐related clinical adverse experiences at week 104, number of participants with laboratory adverse experiences at week 104, number of participants with serious laboratory adverse experiences at week 104, number of participants with drug‐related laboratory adverse experiences at week 104 Other outcome measure(s): ‐ Trial results available in trial register: yes | |
| Endpoints quoted in publication(s)b,c | |
|
Primary outcome measure(s): ‐ Secondary outcome measure(s): ‐ Other outcome measure(s): HbA1c, FPG, serum insulin and proinsulin, plasma lipid parameters, adverse experiences, body weight, hypoglycaemia | |
| Endpoints quoted in abstract of publication(s)b,c | |
|
Primary outcome measure(s): ‐ Secondary outcome measure(s): ‐ Other outcome measure(s): change in HbA1c from baseline, beta‐cell responsiveness, hypoglycaemia, weight change | |
| Home 2009 | Endpoints quoted in trial document(s) (ClinicalTrials.gov, FDA/EMA document, manufacturer's website, published design paper)a,c |
|
Source:NCT00379769 Primary outcome measure(s):
Secondary outcome measure(s):
Other outcome measure(s): ‐ Trial results available in trial register: yes | |
| Endpoints quoted in publication(s)b,c | |
|
Primary outcome measure(s): time from the start of randomised treatment to reach the combined endpoint of (adjudicated) CV death or CV hospitalisation Secondary outcome measure(s): time to all‐cause mortality; time to first occurrence of definite CHF; time to first occurrence of all‐cause mortality, MI, stroke, definitive CHF and unstable angina; time to first occurrence of CV death, MI, stroke and unstable angina; combined CV death or CV hospitalisation plus microvascular events (diabetes‐related); time to CV death, acute MI, stroke (MACE) and time to each of the individual endpoints CV death, MI, stroke; total number of each of the events in the CV death or CV hospitalisation endpoint; total number of microvascular events (diabetes‐related) at study end; changes in glycaemia and related metabolic parameters; time to failure of glycaemic control (defined as the combination of HbA1c 8.5% ≥ on two consecutive visits, or HbA1c ≥ 8.5% at single visit and moved to post‐randomised treatment phase/initiated triple therapy); time to addition of a third oral therapy for rosiglitazone combination groups or switch to insulin for metformin and sulphonylurea combination groups; time to initiation of treatment with insulin; and, general safety through the assessment of changes in physical examinations, vital signs, body weight, clinical laboratory tests, AEs and electrocardiograms. An additional composite endpoint was added to the analysis plan at the request of the Steering Committee (CV death, MI, stroke, unstable angina and CHF) Other outcome measure(s): ‐ | |
| Endpoints quoted in abstract of publication(s)b,c | |
|
Primary outcome measure(s): cardiovascular hospitalisation or cardiovascular death Secondary outcome measure(s): ‐ Other outcome measure(s): ‐ | |
| Derosa 2009a | Endpoints quoted in trial document(s) (ClinicalTrials.gov, FDA/EMA document, manufacturer's website, published design paper)a,c |
| N/T | |
| Endpoints quoted in publication(s)b,c | |
|
Primary outcome measure(s): ‐ Secondary outcome measure(s): ‐ Other outcome measure(s): "Anthropometric and metabolic measurements were assessed at baseline, after 3 months, and after 12 months"; "To evaluate the tolerability assessments, all adverse events were recorded" | |
| Endpoints quoted in abstract of publication(s)b,c | |
|
Primary outcome measure(s): ‐ Secondary outcome measure(s): ‐ Other outcome measure(s): "Anthropometric and metabolic measurements were assessed at baseline, after 3 months, and after 12 months" | |
| Derosa 2009b | Endpoints quoted in trial document(s) (ClinicalTrials.gov, FDA/EMA document, manufacturer's website, published design paper)a,c |
| N/T | |
| Endpoints quoted in publication(s)b,c | |
|
Primary outcome measure(s): ‐ Secondary outcome measure(s): ‐ Other outcome measure(s): "Body Mass Index, HbA1c, FPG, PPG, FPI, PPI, HOMA index, TC, LDL‐C, HDL‐C, Tg, Apo A‐I, Apo‐B, SBP, and DBP values were also assessed at 3, 6, 9 and 12 months"; "Treatment tolerability was assessed at each study visit using an accurate interview of patients by the investigators, and comparisons of clinical and laboratory values with baseline levels" (Derosa 2007 in Derosa 2009b) BMI, HbA1c, FPG, PPG, FPI, PPI, HOMA index, TC, LDL‐C, HDL‐C, Tg, Lp(a), Fg, PAI‐1, tP‐A, Hcy, SBP, and DBP values were also assessed at 3, 6, 9, and 12 months | |
| Endpoints quoted in abstract of publication(s)b,c | |
|
Primary outcome measure(s): ‐ Secondary outcome measure(s): ‐ Other outcome measure(s): "We assessed body mass index (BMI), fasting (FPG) and post‐prandial (PPG) plasma glucose, glycosylated haemoglobin (HbA1c), fasting (FPI) and post‐prandial (PPI) plasma insulin, homeostasis model assessment (HOMA) index, and lipid profile [total cholesterol (TC), low density lipoprotein‐ cholesterol (LDL‐C), high density lipoprotein‐ cholesterol (HDL‐C), triglycerides (Tg), apolipoprotein A‐I (Apo A‐I), and apolipoprotein B (Apo B)], systolic blood pressure (SBP), and diastolic blood pressure (DBP)" (Derosa 2007 in Derosa 2009b) "We assessed body mass index (BMI), glycated hemoglobin (HbA1c), fasting plasma glucose (FPG), postprandial plasma glucose (PPG), fasting plasma insulin (FPI), postprandial plasma insulin (PPI), homeostasis model assessment index (HOMA index), lipid profile with lipoprotein (a) [Lp(a)], fibrinogen (Fg), plasminogen activator inhibitor‐1 (PAI‐1), tissue plasminogen activator (t‐PA), homocysteine (Hcy), systolic blood pressure (SBP), diastolic blood pressure (DBP)" | |
| Petrica 2009 | Endpoints quoted in trial document(s) (ClinicalTrials.gov, FDA/EMA document, manufacturer's website, published design paper)a,c |
| N/T | |
| Endpoints quoted in publication(s)b,c | |
|
Primary outcome measure(s): ‐ Secondary outcome measure(s): ‐ Other outcome measure(s): serum creatinine, GFR, C‐reactive protein, fibrinogen, glycaemia, HbA1c, cholesterol, triglycerides, haemoglobin, urine albumin/creatinine ratio, serum cystatin C, serum and urinary β2‐microglobulin, urinary a1‐microglobulin | |
| Endpoints quoted in abstract of publication(s)b,c | |
|
Primary outcome measure(s): ‐ Secondary outcome measure(s): ‐ Other outcome measure(s): nephro‐ and neuroprotective effects, biomarkers in the diagnosis of incipient diabetic nephropathy and cerebral microangiopathy | |
| NCT00367055 | Endpoints quoted in trial document(s) (ClinicalTrials.gov, FDA/EMA document, manufacturer's website, published design paper)a,c |
|
Source:NCT00367055 Primary outcome measure(s): the primary end point for efficacy was the change from baseline in the insulin secretory capacity after a 36‐month treatment measured by the assessment of blood insulin concentrations using the hyperglycaemic clamp technique Secondary outcome measure(s):
Other outcome measure(s): ‐ Trial results available in trial register: yes | |
| Endpoints quoted in publication(s)b,c | |
| N/A | |
| Endpoints quoted in abstract of publication(s)b,c | |
| N/A | |
| Hamann 2008 | Endpoints quoted in trial document(s) (ClinicalTrials.gov, FDA/EMA document, manufacturer's website, published design paper)a,c |
|
Source:NCT00359112 Primary outcome measure(s): change in HbA1c level from baseline following 52 weeks of treatment Secondary outcome measure(s): change in FPG, insulin sensitivity, beta cell function, change in PAI‐1, CRP, number of hypoglycaemic event, change in 24‐h ambulatory blood pressure monitoring, diabetes treatment satisfaction Other outcome measure(s): ‐ Trial results available in trial register: no | |
| Endpoints quoted in publication(s)b,c | |
|
Primary outcome measure(s): change in HbA1c from baseline following 52 weeks of treatment Secondary outcome measure(s): ‐ Other outcome measure(s): FPG, C‐peptide, insulin, proinsulin, cardiovascular biomarkers, health outcome, safety | |
| Endpoints quoted in abstract of publication(s)b,c | |
|
Primary outcome measure(s): change in HbA1c from baseline after 52 weeks of treatment Secondary outcome measure(s): ‐ Other outcome measure(s): ‐ | |
| Ristic 2007 | Endpoints quoted in trial document(s) (ClinicalTrials.gov, FDA/EMA document, manufacturer's website, published design paper)a,c |
|
Source:CDJN608A 2308E1 Primary outcome measure(s): HbA1c after 24 weeks, HbA1c after 52 weeks, safety and tolerability during 6‐month extension phase Secondary outcome measure(s): percentage of participants reaching treatment target (endpoint HbA1c < 7% and/or a decrease ≥ 0.5 % HbA1c, percentage of participants reaching treatment target (endpoint HbA1c < 6.5% and/or a decrease ≥ 1.0 % HbA1c, FPG and bodyweight after 24 weeks and after 52 weeks, prandial effect on glucose and insulin after a standardised meal challenge following 24 and 52 weeks of treatment Other outcome measure(s): ‐ Trial results available in trial register: no | |
| Endpoints quoted in publication(s)b,c | |
|
Primary outcome measure(s): ‐ Secondary outcome measure(s): ‐ Other outcome measure(s): HbA1c change from baseline to end point, percentage of participants achieving HbA1c < 7% and/or a decrease ≥ 0.5 %, FPG change from baseline to week 24, prandial plasma glucose, hypoglycaemia, weight | |
| Endpoints quoted in abstract of publication(s)b,c | |
|
Primary outcome measure(s): ‐ Secondary outcome measure(s): ‐ Other outcome measure(s): HbA1c change from baseline to week 52, proportion of participants achieving HbA1c < 7%, FPG change from baseline to week 52, prandial plasma glucose, hypoglycaemia, weight | |
| Charbonnel 2005 | Endpoints quoted in trial document(s) (ClinicalTrials.gov, FDA/EMA document, manufacturer's website, published design paper)a,c |
| N/T | |
| Endpoints quoted in publication(s)b,c | |
|
Primary outcome measure(s): change in HbA1c Secondary outcome measure(s): change in fasting plasma glucose, insulin, insulin precursors and lipids Other outcome measure(s): ‐ | |
| Endpoints quoted in abstract of publication(s)b,c | |
|
Primary outcome measure(s): ‐ Secondary outcome measure(s): ‐ Other outcome measure(s): HbA1c, fasting plasma glucose, insulin and lipids | |
| Derosa 2005 | Endpoints quoted in trial document(s) (ClinicalTrials.gov, FDA/EMA document, manufacturer's website, published design paper)a,c |
| N/T | |
| Endpoints quoted in publication(s)b,c | |
|
Primary outcome measure(s): changes in BMI, HbA1c, lipid profile and lipoprotein parameters were the primary efficacy variables Secondary outcome measure(s): ‐ Other outcome measure(s): "FPG, PPG and homeostasis model assessment (HOMA) index were also used to assess efficacy"; "In order to evaluate the tolerability assessments, all adverse events were recorded"; "AEs were recorded at each study visit, using spontaneous reporting, patient interview, and laboratory analysis (including liver enzymes)" | |
| Endpoints quoted in abstract of publication(s)b,c | |
|
Primary outcome measure(s): changes in BMI, glycosylated haemoglobin (HbA1c), Lp(a) and HCT were primary efficacy variables Secondary outcome measure(s): ‐ Other outcome measure(s): FPG, post‐prandial plasma glucose (PPG) and homeostasis model assessment index were also used to assess efficacy | |
| Gerich 2005 | Endpoints quoted in trial document(s) (ClinicalTrials.gov, FDA/EMA document, manufacturer's website, published design paper)a,c |
|
Source:CDJN608A US07 Primary outcome measure(s): change from baseline in HbA1c after 104 weeks of treatment Secondary outcome measure(s): tolerability and safety as assessed by the incidence of confirmed hypoglycaemia and change in body weight after 104 weeks of treatment; effects of 104 weeks of treatment on markers of beta‐cell function (fasting proinsulin/insulin ratio and HOMA‐b, calculated from fasting insulin and glucose); effects on serum insulin, glucose, and C‐peptide excursions (adjusted AUC0‐120min) during an OGTT; incremental changes in glucose and insulin within the first 30 minutes during the OGTT (insulinogenic index); effects on the AIR to glucose (AUC0‐10 min) during an IVGTT in a subset of participants (approximately 40 participants per arm, 80 participants total) Other outcome measure(s): safety assessments consisted of monitoring and recording all AEs, SSAEs, MACE, and hypoglycemic and hyperglycaemic events: monitoring haematology, blood chemistry, and urine values; and measurements of vital signs and the performance of physical examinations Trial results available in trial register: no | |
| Endpoints quoted in publication(s)b,c | |
|
Primary outcome measure(s): the primary efficacy variable was the change from baseline (average of weeks 2 and 0) to week 104 in A1C Secondary outcome measure(s): secondary efficacy variables included the change from baseline to week 104 in FPG, body weight, and the incremental AUC0–120min of glucose during oral glucose tolerance tests Other outcome measure(s): all adverse events | |
| Endpoints quoted in abstract of publication(s)b,c | |
|
Primary outcome measure(s): ‐ Secondary outcome measure(s): ‐ Other outcome measure(s): HbA1c, FPG, PPG during an OGTT | |
| ‐ denotes not reported aTrial document(s) refers to all available information from published design papers and sources other than regular publications (e.g. FDA/EMA documents, manufacturer's web sites, trial registers). bPublication(s) refers to trial information published in scientific journals (primary reference, duplicate publications, companion documents or multiple reports of a primary trial). cPrimary and secondary outcomes refer to verbatim specifications in publication/records. Other outcome measures refer to all outcomes not specified as primary or secondary outcome measures. AE: adverse event; AIR: acute insulin response; Apo‐B: apolipoprotein B; AUC: area under curve: BMI: body mass index; BP: blood pressure; CHF: congestive heart failure; CoF: coefficient of failure; CV: cardiovascular; DBP: diastolic blood pressure; ECG: electrocardiogram; EMA: European Medicines Agency; FDA: Food and Drug Administration (US); FFA: free fatty acids: FPG: fasting plasma glucose; GFR: glomerular filtration rate; HbA1c: glycosylated haemoglobin A1c; HDL: high‐density lipoprotein cholesterol; LDL: low‐density lipoprotein cholesterol; HOMA‐b: homeostatic model assessment beta‐cell function; HOMA‐IR: homeostatic model assessment insulin resistance; IR: independent re‐adjudication; IVGTT: intravenous glucose tolerance test; MACE: major adverse cardiac event; MI: myocardial infarction; N/A: not applicable; N/T: no trial document available; OGTT: oral glucose tolerance test; PPG: post‐prandial plasma glucose; PPGE: postprandial glucose excursions; SAE: serious adverse events; SBP: systolic blood pressure; TC: total cholesterol; UTI: urinary tract infection | |
Appendix 8. High risk of outcome reporting bias according to ORBIT classification
| Trial ID | Outcome | High risk of bias (category A)a | High risk of bias (category D)b | High risk of bias (category E)c | High risk of bias (category G)d |
| Maffioli 2013 | All‐cause mortality | No | No | No | Yes |
| Serious adverse events | No | No | Yes | No | |
| Derosa 2011a | All‐cause mortality | No | No | No | Yes |
| Serious adverse events | No | No | Yes | No | |
| Derosa 2011b | All‐cause mortality | No | No | No | Yes |
| Serious adverse events | No | No | No | Yes | |
| Petrica 2011 | All‐cause mortality | No | No | No | Yes |
| Serious adverse events | No | No | Yes | No | |
| Non‐serious adverse events | No | No | Yes | No | |
| Mild/moderate hypoglycaemia | No | No | No | Yes | |
| Serious hypoglycaemia | No | No | No | Yes | |
| Derosa 2010 | All‐cause mortality | No | No | No | Yes |
| Serious adverse events | No | No | Yes | No | |
| Derosa 2009a | All‐cause mortality | No | No | No | Yes |
| Serious adverse events | No | No | Yes | No | |
| Derosa 2009b | All‐cause mortality | No | No | No | Yes |
| Serious adverse events | No | No | Yes | No | |
| Non‐serious adverse events | No | No | Yes | No | |
| Mild/moderate hypoglycaemia | No | No | No | Yes | |
| Serious hypoglycaemia | No | No | No | Yes | |
| Petrica 2009 | All‐cause mortality | No | No | No | Yes |
| Serious adverse events | No | No | Yes | No | |
| Non‐serious adverse events | No | No | Yes | No | |
| Mild/moderate hypoglycaemia | No | No | No | Yes | |
| Serious hypoglycaemia | No | No | No | Yes | |
| Derosa 2005 | All‐cause mortality | No | No | No | Yes |
| Serious adverse events | No | No | Yes | No | |
| Mild/moderate hypoglycaemia | No | No | No | Yes | |
| Serious hypoglycaemia | No | No | No | Yes | |
| Gerich 2005 | Cardiovascular mortality | No | No | Yes | No |
| Non‐fatal myocardial infarction | No | No | Yes | No | |
| Heart failure | No | No | Yes | No | |
| Non‐fatal stroke | No | No | Yes | No | |
|
aClear that outcome was measured and analysed; trial report states that outcome was analysed but reports only that result was not significant (Classification 'A', table 2; Kirkham 2010).
bClear that outcome was measured and analysed; trial report states that outcome was analysed but report no results (Classification 'D', table 2; Kirkham 2010).
cClear that outcome was measured but was not necessarily analysed; judgement says likely to have been analysed but not reported because of non‐significant results (Classification 'E', table 2; Kirkham 2010).
dUnclear whether outcome was measured; not mentioned, but clinical judgement says likely to have been measured and analysed but not reported on the basis of non‐significant results (Classification 'G', table 2, Kirkham 2010). ORBIT: Outcome Reporting Bias In Trials | |||||
Appendix 9. Definition of endpoint measurement (I)a
| Trial ID | All‐cause mortality | Health‐related quality of life | Cardiovascular mortality | Non‐fatal myocardial infarction | Heart failure | Non‐fatal stroke | Amputation of lower extremity | Blindness or severe vision loss | End‐stage renal disease |
| Handelsman 2017 | IO "Two fatal adverse events were reported in the omarigliptin group; a 68‐year‐old male with a cardiac arrest that occurred on day 59, and a 64‐year‐old female who had an ischemic stroke on day 340 (both patients had a history of hypertension)." |
N/R | IO Ischaemic stroke |
IO Myocardial infarction |
N/R | N/R | N/R | N/R | N/R |
| Hollander 2017 | IO "The AEs resulting in death were in the ertugliflozin 15 mg group, acute MI; in the ertugliflozin 5 mg group, multiple organ dysfunction syndrome, sudden cardiac death, pneumonia, depression, chronic obstructive pulmonary disease; in the glimepiride group, congestive cardiac failure that started during the post‐treatment period" |
N/R | IO Acute MI Congestive cardiac failure |
N/R | N/R | IO Cerebrovascular accident |
IO Toe amputation |
N/R | N/R |
| Vaccaro 2017 | AO "All deaths, including those from cardiovascular, non‐cardiovascular or unknown reason will contribute to the primary end‐point" |
N/R | IO "Sudden death, unwitnessed unexpected death, fatal MI, fatal stroke, death from heart failure, death related to invasive diagnostic or therapeutic procedures, death due to other cardiovascular causes" |
AO "Non periprocedural MI. Myocardial infarction will be diagnosed if the subject has: Detection of rise of cardiac biomarkers (preferably troponin) with at least one value above the 99th percentile of the upper reference limit (URL) together with evidence of myocardial ischemia with at least one of the followings: ‐ Symptoms of ischaemia ‐ ECG changes indicative of new ischaemia (see ST elevation/ST depression and T wave changes)* ‐ Development of pathological Q waves in the ECG ‐ Imaging evidence of new loss of viable myocardium or new regional wall motion abnormality *[ST elevation = new ST elevation at the J point in two contiguous leads with the cut off points: ≥0.2 mV in men or ≥0.15 mV in women in leads V2 – V3 and/or 0.1 mV in other leads. ST depression and T‐wave changes = new horizontal or down sloping ST depression ≥ 0.05 mV in two contiguous leads; and/or T inversion ≥0.1 mV in two contiguous leads with prominent R‐wave or R‐S ratio >1]. Silent MI. Documentation of new significant Q waves in at least two consecutive leads or new Q waves in V1 and V2 or loss of R waves on one ECG in comparison to the previous ECG tracings. The new Q waves or R waves should not be considered in the presence of pacemaker rhythm, left ventricular hypertrophy or pre‐excitation syndrome. The date of MI will be considered the midway point between the diagnostic ECG and the most recent non diagnostic ECG. Periprocedural MI: ‐For percutaneous coronary interventions (PCI) in participants with normal baseline troponine values, elevations of cardiac biomarkers above the 99th percentile URL are indicative of peri‐procedural myocardial necrosis. By convention, increases of biomarkers > 3x99th percentile URL have been designated as defining PCI‐related myocardial infarction ‐ For coronary artery bypass grafting (CABG) in participants with normal baseline troponin values, elevation of cardiac biomarkers above the 99th percentile URL are indicative of peri‐procedural myocardial necrosis. By convention, increases of biomarkers > 5x 99th percentile URL plus either new pathological Q waves or new LBBB or angiographically documented new graft or native coronary artery occlusion, or imaging evidence of new loss of viable myocardium, have been designed as defining CABG‐ related myocardial infarction. Silent MI. Documentation of new significant Q waves in at least two consecutive leads or new Q waves in V_1 and V_2 or loss of R waves on one ECG in comparison to the previous ECG tracings. The new Q waves or R waves should not be considered in the presence of pacemaker rhythm, left ventricular hypertrophy or pre‐excitation syndrome. The date of MI will be considered the midway point between the diagnostic ECG and the most recent non diagnostic ECG." |
AO "Patients with PRE‐EXISTING heart failure Patients presenting with at least two of the following signs or symptoms and requiring intravenous medications (diuretics or vasodilators or inotropes) or an increase in dosing of oral diuretics: ‐ increased dyspnea on exertion ‐ orthopnea ‐ nocturnal dyspnea ‐ increasing peripheral edema ‐ pulmonary edema ‐ increasing fatigue/decreasing exercise tolerance ‐ renal hypoperfusion (worsening renal function) ‐ elevated jugular venous pressure ‐ radiological sign of CHF ‐ new evidence of left ventricular systolic dysfunction Participants with NEW ONSET heart failure (no previously known HF) Initiation or increase in dosage (if previously prescribed for another cause, i.e. hypertension) of loop diuretic, ACE‐inhibitor/ARB therapy, or evidence‐based beta‐blocker therapy because of new heart failure signs and symptoms (see above) AND AT LEAST 1 OF THE FOLLOWING: BNP ≥400 pg/mL, NT‐proBNP 1500pg/ml OR Structural heart disease with documentation of systolic dysfunction (LVEF <45%) or diastolic dysfunction not previously known. Heart failure requiring at least an overnight stay (2 calender days) in hospital or in an acute care setting and day‐care admissions for the management of heart failure are considered as a hospitalization. For scheduled multiple day care admissions a single hospitalization form will be filled reporting the number of days of admission." |
AO "Stroke is defined as the presence of acute neurological deficit thought to be of vascular origin with signs or symptoms lasting > 24 hours. Subarachnoid hemorrhage may not cause focal deficit. On the basis of clinical symptoms, autopsy and/or CT/MRI, strokes will be classified as: a) definite or probable ischemic stroke, b) definite hemorrhagic stroke, (for both, a & b, confirmed by CT, MRI scan), c) subarachnoid hemorrhage, (a CT scan or cerebrospinal fluid report must be available showing evidence of bleeding in the subaracnoid space). d) uncertain or unknown type of stroke. Hemorrhagic stroke does not include hemorrhage secondary to cerebral infarct, into a tumor, into a vascular malformation or post‐traumatic hemorrhage." |
IO "Leg amputation above the ancle" |
N/R | N/R |
| Dei Cas 2017 | N/R | N/R | N/R | N/R | N/R | N/R | N/R | N/R | N/R |
| Leiter 2015 | IO "Deaths" |
N/R | IO "Cardiovascular death" |
IO "Non‐fatal myocardial infarction" |
IO "Cardiac failure" |
IO "Non‐fatal stroke" |
N/R | N/R | N/R |
| Del Prato 2015 | IO "Deaths" |
N/R | IO "... deaths were reported... acute myocardial infarction..." |
IO "Myocardial infarction" |
IO Cardiac failure congestive |
N/R | N/R | N/R | N/R |
| Schernthaner 2015 | IO "There were two deaths in the study (saxagliptin: myocardial infarction; glimepiride: unknown cause)..." |
N/R | N/R | N/R | IO Heart failure |
N/R | N/R | N/R | N/R |
| Del Prato 2014 | AO "Deaths" |
N/R | AO "Cofirmed MACE (cardiovascular death, non‐fatal myocardial infarction or non‐fatal stroke)..." |
AO "Cofirmed MACE (cardiovascular death, non‐fatal myocardial infarction or non‐fatal stroke)..." |
AO "Congestive cardiac failure" |
AO "Cofirmed MACE (cardiovascular death, non‐fatal myocardial infarction or non‐fatal stroke)..." |
N/R | N/R | N/R |
| Ahrén 2014 | IO "Five of the death were cardiac in nature, 5 were death due to cancer, 2 deaths were from unknown causes, and 1 death were due to a cerebrovascular accident." |
N/R | AO "Cardiovascular death was defined as sudden cardiac death, death caused by myocardial infarction, death caused by heart failure, death caused by stroke, death caused by other cardiovascular causes, or presumed cardiovascular death. All deaths were classified as cardiovascular unless an unequivocal non‐cardiovascular cause of death was established. Death was defined as non‐cardiovascular if an unequivocal and documented non‐cardiovascular cause could be established—eg expected death from a carcinoma" |
AO "Acute myocardial infarction was defined as high cardiac enzymes or biomarkers plus one of the following: symptoms of ischaemia, electrocardiographic changes indicative of new ischaemia, development of pathological Q waves, or imaging evidence of new loss of viable myocardium or a new regional wall motion abnormality" "Silent myocardial infarction was defined as the development of new electrocardiographic changes consistent with previous myocardial infarction in a patient who had not had an overt myocardial infarction since the previous electrocardiograph" |
AO "Hospital admission for heart failure was defined as an emergency or unplanned admission to hospital that resulted in at least one overnight stay with clinical manifestations of new or worsening heart failure, radiological evidence of pulmonary oedema or congestion or cardiomegaly, or other imaging evidence of abnormal or high B‐type natriuretic peptide or N‐terminal‐pro B‐type natriuretic peptide concentrations, and new or additional treatment specifically for heart failure" |
N/R | N/R | N/R | N/R |
| Ridderstråle 2014 | AO Deaths An independent data‐monitoring committee monitored safety of the participants throughout the trial |
N/R | N/R | N/R | AO Cardiac failure congestive An independent data‐monitoring committee monitored safety of the participants throughout the trial |
N/R | N/R | N/R | N/R |
| Göke 2013 | IO 4 deaths in the saxagliptin group (acute myeloid leukaemia, cardiac failure, head injury, salmonella sepsis) 2 deaths in the glipizide group (ischaemic stroke and myocardial infarction) |
IO Saxagliptin group: death due to cardiac failure Glipizide group: death due to ischaemic stroke and myocardial infarction |
IO Myocardial infarction |
IO Cardiac failure |
IO Ischaemic stroke |
N/R | N/R | N/R | |
| Maffioli 2013 | N/R | N/R | N/R | N/R | N/R | N/R | N/R | N/R | N/R |
| Nauck 2013 | IO "... one death occurred during metformin run‐in and one patient (who developed liver cirrhosis and hepatocellular carcinoma during treatment) died after the 26‐week trial period. Two deaths occurred during the extension in the 0.6 mg liraglutide+metformin group: one patient suffered acute renal failure and pyelonephritis; the second suffered a fatal event of tuberculosis." |
N/R | IO "... one death occurred during metformin run‐in and one patient (who developed liver cirrhosis and hepatocellular carcinoma during treatment) died after the 26‐week trial period. Two deaths occurred during the extension in the 0.6 mg liraglutide+metformin group: one patient suffered acute renal failure and pyelonephritis; the second suffered a fatal event of tuberculosis." |
IO "Acute myocardial infarction" |
IO "Cardiac failure" |
N/R | N/R | N/R | IO "Two deaths occurred during the extension in the 0.6 mg liraglutide+metformin group: one patient suffered acute renal failure and pyelonephritis..." |
| Gallwitz 2012a | IO "Five patients in each treatment group died..." |
N/R | N/R | N/R | IO "Cardiac failure" |
N/R | N/R | N/R | N/R |
| Gallwitz 2012b | IO/AO "Eight deaths (four in each group) occurred during treatment... Causes of deaths in the linagliptin group were cardiorespiratory arrest, sudden cardiac death, bronchial carcinoma, and aortic aneurysm; causes of death in the glimepiride group were abdominal infection, sudden cardiac death, myocardial infarction, and metastatic bronchial carcinoma or acute renal failure" |
N/R | AO Cardiovascular death including fatal stroke and fatal myocardial infarction |
AO Non‐fatal myocardial infarction |
AO Cardiac failure |
AO Non‐fatal stroke |
N/R | N/R | N/R |
| Derosa 2011a | N/R | N/R | N/R | N/R | N/R | N/R | N/R | N/R | N/R |
| Derosa 2011b | N/R | N/R | N/R | N/R | N/R | N/R | N/R | N/R | N/R |
| Petrica 2011 | N/R | N/R | N/R | N/R | N/R | N/R | N/R | N/R | N/R |
| Derosa 2010 | N/R | N/R | N/R | N/R | N/R | N/R | N/R | N/R | N/R |
| Matthews 2010 | IO/AO "Seven deaths occurred in the vildagliptin group (0.5%) and six in the glimepiride group (0.4%), none of which was suspected to be related study treatment." |
N/R | N/R | N/R | N/R | N/R | N/R | N/R | N/R |
| Filozof 2010 | IO "Two deaths were reported..." |
N/R | N/R | N/R | N/R | N/R | N/R | N/R | N/R |
| Seck 2010 | IO 9 deaths occurred over the 2‐year treatment period: 8 in the glipizide group (sudden cardiac death, myocardial infarction (N = 2), cancer‐related deaths (N = 3), sepsis and a suicide that occurred 41 days following discontinuation of study drug) and 1 in the sitagliptin group (trauma related to being struck by a motor vehicle) |
N/R | IO Myocardian infarction |
N/R | IO Cardiac failure congestive |
N/R | N/R | N/R | N/R |
| Home 2009 | AO "All deaths identified during the original record study and discovered after the re‐adjudication efforts began were included" |
N/R | AO CV mortality |
N/R | AO New York Heart Association classification of congestive heart failure |
N/R | N/R | N/R | N/R |
| Derosa 2009a | N/R | N/R | N/R | N/R | N/R | N/R | N/R | N/R | N/R |
| Derosa 2009b | N/R | N/R | N/R | N/R | N/R | N/R | N/R | N/R | N/R |
| Petrica 2009 | N/R | N/R | N/R | N/R | N/R | N/R | N/R | N/R | N/R |
| NCT00367055 | IO "There were two fatalities..." |
N/R | N/R | N/R | N/R | N/R | N/R | N/R | N/R |
| Hamann 2008 | IO 4 participants died during the double‐blind phase of the study, 2 in the RSG + MET group (cerebrovascular accident and cardiovascular disorder) and 2 in the SU + MET group (respiratory failure and atrial fibrillation) |
N/R | IO Cerebrovascular accident Cardiovascular disorder |
IO Non‐fatal SAE: acute myocardial infarction |
IO Cardiac failure Left ventricular failure |
N/R | N/R | N/R | N/R |
| Ristic 2007 | IO There were no deaths during the study |
N/R | IO There were no deaths during the study |
N/R | N/R | N/R | N/R | N/R | N/R |
| Charbonnel 2005 | IO Two participants in the metformin plus gliclazide group died during the study (unrelated to medication) |
N/R | N/R | N/R | IO Congestive heart failure: acute, aggravated, congestive, chronic and not otherwise specified cardiac failure; left ventricular failure; aggravated congestive cardiac failure; acute, aggravated and not otherwise specified pulmonary oedema |
N/R | N/R | N/R | N/R |
| Derosa 2005 | N/R | N/R | N/R | N/R | N/R | N/R | N/R | N/R | N/R |
| Gerich 2005 | IO Deaths |
N/R | N/R | N/R | N/R | N/R | N/R | N/R | N/R |
|
aIn addition to definition of endpoint measurement, description who measured the outcome (AO: adjudicated outcome measurement; IO: investigator‐assessed outcome measurement; SO: self‐reported outcome measurement) ACE: angiotensin converting enzyme; AE: adverse event; ARB: angiotension receptor blocker; BNP: brain natriuretic peptide; CHF: chronic heart failure; CT: computed tomography; CV: cardiovascular; ECG: electrocardiography; HbA1c: glycosylated haemoglobin A1c; HF: heart failure; LVEF: left ventricular ejection fraction; MACE: major adverse cardiac event; MET: metformin; MI: myocardial infarction; MRI: magnetic resonance imaging; N/D: not defined; N/R: not reported; RSG: rosiglitazone; SU: sulphonylurea | |||||||||
Appendix 10. Definition of endpoint measurement (II)a
| Trial ID | Socioeconomic effects | All hypoglycaemic events | Severe/serious hypoglycaemia | Non‐serious adverse events | Severe/serious adverse events |
| Handelsman 2017 | N/R | SO/IO "Symptomatic hypoglycemia: episode with clinical symptoms attributed to hypoglycemia, without regard to glucose level. Severe hypoglycemia: episode that required assistance, either medical or non‐medical. Episodes with a markedly depressed level of consciousness, a loss of consciousness, or seizure were classified as having required medical assistance, whether or not medical assistance was obtained. Asymptomatic hypoglycemia: finger‐stick glucose values ≤ 3.9 mmol/L (70 mg/dL) without symptoms." |
IO "Severe hypoglycemia: episode that required assistance, either medical or non‐medical. Episodes with a markedly depressed level of consciousness, a loss of consciousness, or seizure were classified as having required medical assistance, whether or not medical assistance was obtained." |
SO "An adverse event that is not a serious adverse event, meaning that it does not result in death, is not life‐threatening, does not require inpatient hospitalization or extend a current hospital stay, does not result in an ongoing or significant incapacity or interfere substantially with normal life functions, and does not cause a congenital anomaly or birth defect; it also does not put the participant in danger and does not require medical or surgical intervention to prevent one of the results listed above." |
IO "An adverse event that results in death, is life‐threatening, requires inpatient hospitalization or extends a current hospital stay, results in an ongoing or significant incapacity or interferes substantially with normal life functions, or causes a congenital anomaly or birth defect. Medical events that do not result in death, are not life‐threatening, or do not require hospitalization may be considered serious adverse events if they put the participant in danger or require medical or surgical intervention to prevent one of the results listed above." |
| Hollander 2017 | N/R | SO/IO "Safety assessments included the incidence of adverse events (AEs), including AEs of special interest (symptomatic hypoglycemia [episodes with clinical symptoms reported by the investigator as hypoglycemia; biochemical documentation not required],..." "Documented hypoglycemia (episodes with a glucose level ≤ 3.9 mmol/L [70 mg/dL] with or without symptoms) and severe hypoglycemia (episodes that required medical or non‐medical assistance) were recorded." |
IO "...severe hypoglycemia (episodes that required medical or non‐medical assistance) were recorded." |
N/R | IO N/D |
| Vaccaro 2017 | N/R | SO/IO "...hypoglycaemic episodes defined as a documented glucose value of less than 3.3 mmol/L and graded as moderate (not requiring help for treatment) or severe (requiring assistance for treatment)." |
SO/IO "...hypoglycaemic episodes defined as a documented glucose value of less than 3.3 mmol/L and graded as moderate (not requiring help for treatment) or severe (requiring assistance for treatment)." |
SO/IO Non‐serious adverse event |
IO/AO "A serious adverse event was defined as death, a life‐threatening episode, hospital admission or prolongation of existing hospital admission, or a persistent or substantial disability." |
| Dei Cas 2017 | N/R | Mild hypoglycaemic events SO/IO |
Severe hypoglycaemic events SO/IO |
Adverse events SO/IO |
Adverse events SO/IO |
| Leiter 2015 | N/R | SO "... biochemically documented episodes (concurrent fingerstick glucose or plasma glucose ≤ 3.9 mmol/L with or without symptoms ..." |
SO/IO "severe episodes (those needing assistance of another individual or resulting in seizure or loss of consciousness)." |
SO/IO "Other Adverse Events are adverse events that are not Serious Adverse Events but that exceed the indicated frequency threshold." |
IO "Serious Adverse Events include adverse events that result in death, require either inpatient hospitalization or the prolongation of hospitalization, are life‐threatening, result in a persistent or significant disability/incapacity or result in a congenital anomaly/birth defect. Other important medical events, based upon appropriate medical judgment, may also be considered Serious Adverse Events if a trial participant's health is at risk and intervention is required to prevent an outcome mentioned." |
| Del Prato 2015 | IO Incremental cost‐effectiveness ratio, total costs |
SO/IO "Major hypoglycemia was defined as a symptomatic episode requiring external assistance due to severely impaired consciousness or behavior, with capillary or plasma glucose levels of 54 mg/dL (<3.0 mmol/L) and recovery after glucose or glucagon administration. Minor hypoglycemia was defined as a symptomatic episode with capillary or plasma glucose levels of 63 mg/dL (<3.5mmol/L), irrespective of the need for external assistance, or an asymptomatic episode with capillary or plasma glucose levels of 63 mg/dL (<3.5 mmol/L) that did not qualify as a major episode. Other hypoglycemia was defined as an episode with symptoms suggestive of hypoglycemia but without measurement confirmation." |
SO/IO "Major hypoglycemia was defined as a symptomatic episode requiring external assistance due to severely impaired consciousness or behavior, with capillary or plasma glucose levels of 54 mg/dL (<3.0 mmol/L) and recovery after glucose or glucagon administration." |
SO/IO "Other Adverse Events are adverse events that are not Serious Adverse Events but that exceed the indicated frequency threshold." |
IO "Serious Adverse Events include adverse events that result in death, require either inpatient hospitalization or the prolongation of hospitalization, are life‐threatening, result in a persistent or significant disability/incapacity or result in a congenital anomaly/birth defect. Other important medical events, based upon appropriate medical judgment, may also be considered Serious Adverse Events if a trial participant's health is at risk and intervention is required to prevent an outcome mentioned." |
| Schernthaner 2015 | N/R | SO/IO Confirmed hypoglycaemia was defined as a symptomatic or asymptomatic event with plasma glucose < 3.0 mmol/L, requiring no external assistance. Severe hypoglycaemia was defined as a symptomatic event requiring external assistance because of severe impairment in consciousness or behaviour, with or without plasma glucose < 3.0 mmol/L, but with prompt recovery after glucose/glucagon administration. |
SO/IO Severe hypoglycaemia was defined as a symptomatic event requiring external assistance because of severe impairment in consciousness or behaviour, with or without plasma glucose < 3.0 mmol/L, but with prompt recovery after glucose/glucagon administration. |
SO "Other Adverse Events are adverse events that are not Serious Adverse Events but that exceed the indicated frequency threshold." |
IO "Serious Adverse Events include adverse events that result in death, require either inpatient hospitalization or the prolongation of hospitalization, are life‐threatening, result in a persistent or significant disability/incapacity or result in a congenital anomaly/birth defect. Other important medical events, based upon appropriate medical judgment, may also be considered Serious Adverse Events if a trial participant's health is at risk and intervention is required to prevent an outcome mentioned." |
| Del Prato 2014 | IO Incremental cost‐effectiveness ratio |
SO "Mild to moderate hypoglycaemia was defined as blood glucose <3.33 mmol/L in the presence of symptoms, or blood glucose <2.78 mmol/L without symptoms. Severe hypoglycaemia was defined as requiring assistance to administer carbohydrate, glucagon or other resuscitative actions, with a documented blood glucose concentration <3.33mmol/l if the clinical situation allowed measurement of blood glucose." |
SO "Severe hypoglycaemia was defined as requiring assistance to administer carbohydrate, glucagon or other resuscitative actions, with a documented blood glucose concentration <3.33 mmol/L if the clinical situation allowed measurement of blood glucose." |
SO "Other Adverse Events are adverse events that are not Serious Adverse Events but that exceed the indicated frequency threshold." |
IO "Serious Adverse Events include adverse events that result in death, require either inpatient hospitalization or the prolongation of hospitalization, are life‐threatening, result in a persistent or significant disability/incapacity or result in a congenital anomaly/birth defect. Other important medical events, based upon appropriate medical judgment, may also be considered Serious Adverse Events if a trial participant's health is at risk and intervention is required to prevent an outcome mentioned." |
| Ahrén 2014 | N/R | SO/IO "Severity was derived using the American Diabetes Association guidelines for categorization of hypoglycemic events, as follows: severe = required assistance of another person; documented symptomatic = typical symptoms accompanied by a plasma glucose concentration of ≤3.9 mmol/L; and asymptomatic = no symptoms but plasma glucose concentration ≤3.9 mmol/L." |
SO/IO "Severity was derived using the American Diabetes Association guidelines for categorization of hypoglycemic events, as follows: severe = required assistance of another person..." |
SO "Other adverse events are adverse events that are not serious adverse events but that exceed the indicated frequency threshold" |
IO "Serious adverse events include adverse events that result in death, require either inpatient hospitalization or the prolongation of hospitalization, are life‐threatening, result in a persistent or significant disability/incapacity or result in a congenital anomaly/birth defect. Other important medical events, based upon appropriate medical judgment, may also be considered serious adverse events if a trial participant's health is at risk and intervention is required to prevent an outcome mentioned" |
| Ridderstråle 2014 | N/R | AO Hypoglycaemia (not including serious) Hypoglycaemia (serious AE) An independent data‐monitoring committee monitored safety of the participants throughout the trial |
AO Hypoglycaemia (serious AE) An independent data‐monitoring committee monitored safety of the participants throughout the trial |
AO "Other adverse events are adverse events that are not serious adverse events but that exceed the indicated frequency threshold" An independent data‐monitoring committee monitored safety of the participants throughout the trial. |
AO "Serious adverse events include adverse events that result in death, require either inpatient hospitalization or the prolongation of hospitalization, are life‐threatening, result in a persistent or significant disability/incapacity or result in a congenital anomaly/birth defect. Other important medical events, based upon appropriate medical judgment, may also be considered serious adverse events if a trial participant's health is at risk and intervention is required to prevent an outcome mentioned" An independent data‐monitoring committee monitored safety of the participants throughout the trial. |
| Göke 2013 | IO Cost per QALY, incremental cost |
SO Reported hypoglycaemia events were a combination of reports of either signs or symptoms consistent with hypoglycaemia with or without documented glucose levels or reported low glucose levels without any symptoms. Confirmed hypoglycaemia was defined as a finger‐stick glucose value ≤ 50 mg/dL with associated symptoms |
SO/IO Severe hypoglycaemia |
SO "Other adverse events are adverse events that are not serious adverse events but that exceed the indicated frequency threshold" |
IO "Serious adverse events include adverse events that result in death, require either inpatient hospitalization or the prolongation of hospitalization, are life‐threatening, result in a persistent or significant disability/incapacity or result in a congenital anomaly/birth defect. Other important medical events, based upon appropriate medical judgment, may also be considered serious adverse events if a trial participant's health is at risk and intervention is required to prevent an outcome mentioned" |
| Maffioli 2013 | N/R | N/R | N/R | N/R | N/R |
| Nauck 2013 | N/R | SO "Hypoglycaemic episodes were defined as major, minor, or symptoms only. Major if the subject was unable to treat her/himself. Minor if subject was able to treat her/himself and plasma glucose was below 3.1 mmol/L. Symptoms only if subject was able to treat her/himself and with no plasma glucose measurement or plasma glucose higher than or equal to 3.1 mmol/L." |
SO "Hypoglycaemic episodes were defined as... Major if the subject was unable to treat her/himself." |
SO/IO "Other adverse events are adverse events that are not serious adverse events but that exceed the indicated frequency threshold." |
IO "Serious adverse events include adverse events that result in death, require either inpatient hospitalization or the prolongation of hospitalization, are life‐threatening, result in a persistent or significant disability/incapacity or result in a congenital anomaly/birth defect. Other important medical events, based upon appropriate medical judgment, may also be considered serious adverse events if a trial participant's health is at risk and intervention is required to prevent an outcome mentioned." |
| Gallwitz 2012a | N/R | SO/IO A hypoglycaemic episode was defined as any time a participant experienced a sign or symptom associated with hypoglycaemia or had a blood glucose measurement of ≤ 3.9 mmol/L (≤ 70 mg/dL), even if not associated with a sign or symptom of hypoglycaemia; severe hypoglycaemia was defined as an event requiring assistance of another person. |
SO/IO Severe hypoglycaemia was defined as an event requiring assistance of another person. |
SO/IO "Other adverse events are adverse events that are not serious adverse events but that exceed the indicated frequency threshold." |
IO "Serious adverse events include adverse events that result in death, require either inpatient hospitalization or the prolongation of hospitalization, are life‐threatening, result in a persistent or significant disability/incapacity or result in a congenital anomaly/birth defect. Other important medical events, based upon appropriate medical judgment, may also be considered serious adverse events if a trial participant's health is at risk and intervention is required to prevent an outcome mentioned." |
| Gallwitz 2012b | N/R | SO/IO Hypoglycaemia (not including severe) Severe hypoglycaemia |
SO/IO Severe hypoglycaemia |
SO/IO "Other adverse events are adverse events that are not serious adverse events but that exceed the indicated frequency threshold." |
IO/AO "Serious adverse events include adverse events that result in death, require either inpatient hospitalization or the prolongation of hospitalization, are life‐threatening, result in a persistent or significant disability/incapacity or result in a congenital anomaly/birth defect. Other important medical events, based upon appropriate medical judgment, may also be considered serious adverse events if a trial participant's health is at risk and intervention is required to prevent an outcome mentioned." |
| Derosa 2011a | N/R | N/R | N/R | N/R | N/R |
| Derosa 2011b | N/R | N/R | N/R | N/R | N/R |
| Petrica 2011 | N/R | N/R | N/R | N/R | N/R |
| Derosa 2010 | N/R | N/R | N/R | N/R | N/R |
| Matthews 2010 | N/R | SO "... symptoms suggestive of hypoglycaemia and confirmed by self‐monitored plasma glucose <3.1 mmol/L..." |
IO "... any episode requiring the assistance of another party..." |
N/R | IO "SAE's were experienced by..." |
| Filozof 2010 | N/R | N/R | N/R | N/R | AO/IO Drug‐related SAE |
| Seck 2010 | N/R | SO Hypoglycaemia other (not including serious) adverse events Hypoglycaemia requiring medical intervention or exhibiting markedly depressed level of consciousness, including loss of consciousness or seizure |
SO/IO Hypoglycaemia requiring medical intervention or exhibiting markedly depressed level of consciousness, including loss of consciousness or seizure |
SO "Other Adverse Events are adverse events that are not Serious Adverse Events but that exceed the indicated frequency threshold." |
IO Serious adverse events |
| Home 2009 | N/R | SO Hypoglycaemia other (not including serious) adverse events Hypoglycaemia serious adverse events |
SO/IO Hypoglycaemia serious adverse events |
SO "Other Adverse Events are adverse events that are not Serious Adverse Events but that exceed the indicated frequency threshold." |
IO/AO "Serious Adverse Events include adverse events that result in death, require either inpatient hospitalization or the prolongation of hospitalization, are life‐threatening, result in a persistent or significant disability/incapacity or result in a congenital anomaly/birth defect. Other important medical events, based upon appropriate medical judgment, may also be considered Serious Adverse Events if a trial participant's health is at risk and intervention is required to prevent an outcome mentioned." |
| Derosa 2009a | N/R | N/R | N/R | N/R | N/R |
| Derosa 2009b | N/R | N/R | N/R | N/R | N/R |
| Petrica 2009 | N/R | N/R | N/R | N/R | N/R |
| NCT00367055 | N/R | SO/IO Hypoglycaemia |
N/R | SO/IO "Other Adverse Events are adverse events that are not Serious Adverse Events but that exceed the indicated frequency threshold." |
IO "Serious Adverse Events include adverse events that result in death, require either inpatient hospitalization or the prolongation of hospitalization, are life‐threatening, result in a persistent or significant disability/incapacity or result in a congenital anomaly/birth defect. Other important medical events, based upon appropriate medical judgment, may also be considered Serious Adverse Events if a trial participant's health is at risk and intervention is required to prevent an outcome mentioned." |
| Hamann 2008 | N/R | SO Participants were also asked to check their blood glucose levels at any time they experienced symptoms of hypoglycaemia and record the reading in their diary cards. |
SO Non‐fatal SAE: hypoglycaemia |
SO Non‐serious adverse events, excluding hypoglycaemic events, that led to withdrawal |
IO Non‐fatal serious adverse events |
| Ristic 2007 | N/R | N/R | N/R | N/R | N/R |
| Charbonnel 2005 | N/R | SO/IO Hypoglycaemia |
SO/IO Severe or serious hypoglycaemia |
N/R | IO Serious adverse events |
| Derosa 2005 | N/R | SO/IO Mild/moderate hypoglycaemia |
SO/IO Serious hypoglycaemia |
SO/IO "...side effects... transient headache... transient flatulence... aspartate aminotransferase... alanine aminotransferase values... increases..." |
N/R |
| Gerich 2005 | N/R | SO "Hypoglycemia was defined as symptoms consistent with low blood glucose confirmed by a self‐monitored blood glucose determination of 3.3 mmol/l plasma glucose equivalents." |
SO/IO "Severe hypoglycemia (grade 2, requiring assistance from an outside party..." |
N/R | IO "Includes deaths, grade 2 hypoglycemic events, and 1 subject with a laboratory abnormality leading to discontinuation" |
|
aIn addition to definition of endpoint measurement, description who measured the outcome (AO: adjudicated outcome measurement; IO: investigator‐assessed outcome measurement; SO: self‐reported outcome measurement) AE: adverse event; N/D: not defined; N/R: not reported; QALY: quality‐adjusted life year | |||||
Appendix 11. Adverse events (I)
| Trial ID | Intervention(s) and comparator(s) | Participants included in analysis (N) | Deaths (N) | Deaths (% of participants) | Participants with at least one adverse event (N) | Participants with at least one adverse event (%) | Participants with at least one severe/serious adverse event (N) | Participants with at least one severe/serious adverse event (%) |
| Handelsman 2017 | I: metformin ≥ 1500 mg/day + glimepiride 1‐6 mg/day + placebo | 375 | 0 | 0.0 | 231 | 61.6 | 18 | 4.8 |
| C: metformin ≥ 1500 mg/day + omarigliptin 25 mg/week + placebo | 375 | 2 | 0.5 | 205 | 54.7 | 24 | 6.4 | |
| Hollander 2017 | I: metformin ≥ 1500 mg/day + glimepiride 1‐8 mg/day + placebo | 437 | 1 | 0.2 | 269 | 61.6 | 12 | 2.7 |
| C1: metformin ≥ 1500 mg/day + ertugliflozin 5 mg/day + placebo | 448 | 5 | 1.1 | 263 | 58.7 | 28 | 6.3 | |
| C2: metformin ≥ 1500 mg/day + ertugliflozin 15 mg/day + placebo | 440 | 1 | 0.2 | 262 | 59.5 | 17 | 3.9 | |
| Vaccaro 2017 | I: metformin 2000 mg/day + sulphonylurea (glibenclamide 5‐15 mg/day, gliclazide 30‐120 mg/day or glimepiride 2‐6 mg/day) | 1493 | 50 | 3 | 360 | 24.1 | 195 | 13 |
| C: metformin 2000 mg/day + pioglitazone 15‐45 mg/day) | 1535 | 55 | 4 | 397 | 25.9 | 208 | 14 | |
| Dei Cas 2017 | I: metformin ≥ 1500 mg/day + glibenclamide 10 mg/day | 24 | ‐ | ‐ | 0 | 0 | 0 | 0 |
| C: metformin ≥ 1500 mg/day + vildagliptin 100 mg/day | 40 | ‐ | ‐ | 0 | 0 | 0 | 0 | |
| Leiter 2015 | I: metformin ≥ 1500 mg/day + glimepiride 1‐8 mg/day | 482 | 2 | 0.41 | 378 | 78.4 | 69 | 14.3 |
| C1: metformin ≥ 1500 mg/day + canagliflozin 100 mg/day | 483 | 3 | 0.62 | 354 | 73.3 | 47 | 9.7 | |
| C2: metformin ≥ 1500 mg/day + canagliflozin 300 mg/day | 485 | 3 | 0.62 | 378 | 77.9 | 47 | 9.7 | |
| Del Prato 2015 | I: metformin 1500‐2500 mg/day + glipizide 5‐20 mg/day | 408 | 5 | 1.2 | 355 | 87.0 | 81 | 19.9 |
| C: metformin 1500‐2500 mg/day + dapagliflozin 2.5‐10 mg/day | 406 | 2 | 0.5 | 356 | 87.7 | 75 | 18.5 | |
| Schernthaner 2015 | I: metformin at any dose + glimepiride 1‐6 mg/day + placebo | 359 | 1 | 0.3 | 213 | 59.3 | 32 | 8.9 |
| C: metformin at any dose + saxagliptin 5 mg/day + placebo | 359 | 1 | 0.3 | 213 | 59.3 | 41 | 11.4 | |
| Del Prato 2014 | I: metformin ≥ 1500 mg once daily or maximum tolerated dose + glipizide 5‐20 mg once daily | 869 | 5 | 0.6 | 668 | 76.9 | 81 | 9.3 |
| C1: metformin ≥ 1500 mg once daily or maximum tolerated dose + alogliptin 12.5 mg once daily | 873 | 3 | 0.3 | 688 | 78.8 | 86 | 9.9 | |
| C2: metformin ≥ 1500 mg once daily or maximum tolerated dose + alogliptin 25 mg once daily | 878 | 3 | 0.3 | 687 | 78.3 | 97 | 11.1 | |
| Ahrén 2014 | I: metformin ≥ 1500 mg daily + glimepiride 2‐4 mg once daily + placebo | 307 | 6 | 2.0 | 261 | 85 | 36 | 11.7 |
| C1: metformin ≥ 1500 mg daily + albiglutide 30‐50 mg once weekly + placebo | 302 | 4 | 1.3 | 263 | 87.1 | 44 | 14.6 | |
| C2: metformin ≥ 1500 mg daily + sitagliptin 100 mg once daily + placebo | 302 | 2 | 0.7 | 251 | 83.1 | 32 | 10.6 | |
| C3: metformin ≥ 1500 mg daily + placebo + placebo | 101 | 1 | 1.0 | 83 | 82.2 | 15 | 14.9 | |
| Ridderstråle 2014 | I: metformin immediate release ≥ 1500 mg/day + glimepiride 1‐4 mg/day | 780 | 5 | 0.6 | 673 | 86 | 153 | 19.6 |
| C: metformin immediate release ≥ 1500 mg/day + empagliflozin 25 mg/day | 765 | 5 | 0.7 | 661 | 86 | 161 | 21.1 | |
| Göke 2013 | I: metformin ≥ 1500 mg daily + glipizide 5‐20 mg/day | 430 | 2 | 0.5 | 312 | 72.6 | 55 | 12.8 |
| C: metformin ≥ 1500 mg daily + saxagliptin 5 mg/day | 428 | 4 | 0.9 | 287 | 67.1 | 54 | 12.6 | |
| Maffioli 2013 | I: metformin 2550 mg/day + glibenclamide 10 mg/day | ‐ | ‐ | ‐ | ‐ | ‐ | ‐ | ‐ |
| C: metformin 2550 mg/day + pioglitazone 30 mg/day | ‐ | ‐ | ‐ | ‐ | ‐ | ‐ | ‐ | |
| Nauck 2013 | I: metformin 1500‐2000 mg/day + glimepiride 1‐4 mg/day + placebo | 242 | 0 | 0 | 128 | 52.9 | 24 | 9.9 |
| C1: metformin 1500‐2000 mg/day + liraglutide 0.6 mg/day + placebo | 242 | 2 | 0.8 | 132 | 54.6 | 36 | 14.9 | |
| C2: metformin 1500‐2000 mg/day + liraglutide 1.2 mg/day + placebo | 240 | 0 | 0 | 144 | 60.0 | 25 | 10.4 | |
| C3: metformin 1500‐2000 mg/day + liraglutide 1.8 mg/day + placebo | 242 | 0 | 0 | 158 | 65.3 | 16 | 6.6 | |
| C4: metformin 1500‐2000 mg/day + placebo + placebo | 121 | 0 | 0 | 44 | 36.4 | 9 | 7.4 | |
| Gallwitz 2012a | I: metformin median dose 2000 mg/day + glimepiride mean dose 2.01 mg/day | 508 | 5 | 1.0 | 248 | 48.8 | 68 | 13.4 |
| C: metformin median dose 2000 mg/day + exenatide mean dose 17.35 μg/day | 511 | 5 | 1.0 | 311 | 60.9 | 73 | 14.3 | |
| Gallwitz 2012b | I: metformin ≥ 1500 mg/day + glimepiride 1‐4 mg/day + placebo | 775 | 4 | 1 | 706 | 91 | 162 | 21 |
| C: metformin ≥ 1500 mg/day + linagliptin 5 mg/day + placebo | 776 | 4 | 1 | 663 | 85 | 135 | 17 | |
| Derosa 2011a | I: metformin 1000‐2000 mg/day + glimepiride 6 mg/day | ‐ | ‐ | ‐ | ‐ | ‐ | ‐ | ‐ |
| C: metformin 1000‐2000 mg/day + exenatide 20 μg/day | ‐ | ‐ | ‐ | ‐ | ‐ | ‐ | ‐ | |
| Derosa 2011b | I: metformin 1700 ± 850 mg/day + glibenclamide 5‐15 mg/day | ‐ | ‐ | ‐ | ‐ | ‐ | ‐ | ‐ |
| C: metformin 1700 ± 850 mg/day + pioglitazone 15‐45 mg/day | ‐ | ‐ | ‐ | ‐ | ‐ | ‐ | ‐ | |
| Petrica 2011 | I: metformin 1700 mg/day + glimepiride 4 mg/day | 34 | ‐ | ‐ | ‐ | ‐ | ‐ | ‐ |
| C: metformin 1700 mg/day + pioglitazone 30 mg/day | 34 | ‐ | ‐ | ‐ | ‐ | ‐ | ‐ | |
| Derosa 2010 | I: metformin 1500 ± 500 mg/day + glibenclamide 15 mg/day | ‐ | ‐ | ‐ | ‐ | ‐ | ‐ | ‐ |
| C: metformin 1500 ± 500 mg/day + exenatide 20 μg/day | ‐ | ‐ | ‐ | ‐ | ‐ | ‐ | ‐ | |
| Matthews 2010 | I: metformin ≥ 1500 mg twice a day + glimepiride 2‐6 mg/day | 1546 | 6 | 0.4 | 1335 | 86.4 | 253 | 16.4 |
| C: metformin ≥ 1500 mg twice a day + vildagliptin 50 mg twice a day | 1553 | 7 | 0.5 | 1291 | 83.1 | 236 | 15.2 | |
| Filozof 2010 | I: metformin 1500 mg/day + gliclazide 80‐320 mg/day | 493 | 1 | 0.2 | 302 | 61.3 | 43 | 8.7 |
| C: metformin 1500 mg/day + vildagliptin 100 mg/day | 510 | 1 | 0.2 | 315 | 61.8 | 34 | 6.7 | |
| Seck 2010 | I: metformin ≥ 1500 mg/day + glipizide 5‐20 mg/day | 584 | 8 | 1.4 | 480 | 82.2 | 73 | 12.5 |
| C: metformin ≥ 1500 mg/day + sitagliptin 100 mg/day | 588 | 1 | 0.2 | 452 | 76.9 | 64 | 10.9 | |
| Home 2009 | I: metformin up to 2550 mg/day + glibenclamide (or equivalent for different preparations) up to 15 mg/day or gliclazide up to 240 mg/day or glimepiride up to 4 mg/day | 1105 | 67 | 6.1 | 1105 | 100 | 428 | 38.7 |
| C: metformin up to 2550 mg/day + rosiglitazone up to 8 mg/day | 1117 | 57 | 5.1 | 1117 | 100 | 424 | 38.0 | |
| Derosa 2009a | I: metformin 850 mg/day + glimepiride 2‐6 mg/day | ‐ | ‐ | ‐ | ‐ | ‐ | ‐ | ‐ |
| C1: metformin 850‐2550 mg/day + pioglitazone 15‐45 mg/day | ‐ | ‐ | ‐ | ‐ | ‐ | ‐ | ‐ | |
| C2: metformin 1000‐3000 mg/day | ‐ | ‐ | ‐ | ‐ | ‐ | ‐ | ‐ | |
| Derosa 2009b | I: metformin 1500‐3000 mg/day + glibenclamide 7.5‐15 mg/day | ‐ | ‐ | ‐ | ‐ | ‐ | ‐ | ‐ |
| C: metformin 1500‐3000 mg/day + nateglinide 180‐360 mg/day | ‐ | ‐ | ‐ | ‐ | ‐ | ‐ | ‐ | |
| Petrica 2009 | I: metformin 1700 mg/day + glimepiride 4 mg/day | 22 | ‐ | ‐ | ‐ | ‐ | ‐ | ‐ |
| C: metformin 1700 mg/day + rosiglitazone 4 mg/day | 22 | ‐ | ‐ | ‐ | ‐ | ‐ | ‐ | |
| NCT00367055 | I: metformin 2000 mg/day + gliclazide 80‐320 mg/day | 41 | 2 | 4.9 | 33 | 80 | 12 | 29 |
| C: metformin 2000 mg/day + rosiglitazone 4‐8 mg/day | 43 | 0 | 0 | 35 | 81 | 8 | 19 | |
| Hamann 2008 | I: metformin 2000 mg/day + glibenclamide 5‐15 mg/day or gliclazide 80‐320 mg/day | 301 | 2 | 0.7 | 175 | 58 | 11 | 4 |
| C: metformin 2000 mg/day + rosiglitazone 4‐8 mg/day | 294 | 2 | 0.7 | 165 | 56 | 16 | 5 | |
| Ristic 2007 | I: metformin > 1000 mg/day + gliclazide 80‐240 mg/day | 101 | 0 | 0 | ‐ | ‐ | ‐ | ‐ |
| C: metformin > 1000 mg/day + nateglinide 180‐540 mg/day | 112 | 0 | 0 | ‐ | ‐ | ‐ | ‐ | |
| Charbonnel 2005 | I: metformin at pre‐study dose + gliclazide 80‐320 mg/day | 313 | 2 | 0.6 | 182 | 58.1 | 20 | 6.4 |
| C: metformin at pre‐study dose + pioglitazone 15‐45 mg/day | 317 | 0 | 0 | 176 | 55.5 | 15 | 4.7 | |
| Derosa 2005 | I: metformin 1500 mg/day + glimepiride 2 mg/day | 47 | 0 | 0 | 4 | 8.5 | 0 | 0 |
| C: metformin 1500 mg/day + rosiglitazone 4 mg/day | 48 | 0 | 0 | 6 | 13.0 | 0 | 0 | |
| Gerich 2005 | I: metformin 500‐2000 mg/day + glyburide 1.25‐15 mg/day + placebo | 209 | 1 | 0.5 | 190 | 90.9 | 27 | 12.9 |
| C: metformin 500‐2000 mg/day + nateglinide 180‐540 mg/day + placebo | 219 | 1 | 0.5 | 201 | 91.8 | 25 | 11.4 | |
| ‐ denotes not reported C: comparator; I: intervention | ||||||||
Appendix 12. Adverse events (II)
| Trial ID | Intervention(s) and comparator(s) | Participants included in analysis (N) | Participants discontinuing trial due to an adverse event (N) | Participants discontinuing trial due to an adverse event (%) | Participants with at least one hospitalisation (N) | Participants with at least one hospitalisation (%) | Participants with at least one outpatient treatment (N) | Participants with at least one outpatient treatment (%) |
| Handelsman 2017 | I: metformin ≥ 1500 mg/day + glimepiride 1‐6 mg/day + placebo | 375 | 10 | 2.7 | ‐ | ‐ | ‐ | ‐ |
| C: metformin ≥ 1500 mg/day + omarigliptin 25 mg/week + placebo | 375 | 14 | 3.7 | ‐ | ‐ | ‐ | ‐ | |
| Hollander 2017 | I: metformin ≥ 1500 mg/day + glimepiride 1‐8 mg/day + placebo | 437 | 17 | 3.9 | ‐ | ‐ | ‐ | ‐ |
| C1: metformin ≥ 1500 mg/day + ertugliflozin 5 mg/day + placebo | 448 | 18 | 4.0 | ‐ | ‐ | ‐ | ‐ | |
| C2: metformin ≥ 1500 mg/day + ertugliflozin 15 mg/day + placebo | 440 | 25 | 5.7 | ‐ | ‐ | ‐ | ‐ | |
| Vaccaro 2017 | I: metformin 2000 mg/day + sulphonylurea (glibenclamide 5‐15 mg/day, gliclazide 30‐120 mg/day or glimepiride 2‐6 mg/day) | 1493 | 16 | 1.1 | ‐ | ‐ | ‐ | ‐ |
| C: metformin 2000 mg/day + pioglitazone 15‐45 mg/day) | 1535 | 62 | 4.0 | ‐ | ‐ | ‐ | ‐ | |
| Dei Cas 2017 | I: metformin ≥ 1500 mg/day + glibenclamide 10 mg/day | 24 | 5 | 20.8 | ‐ | ‐ | ‐ | ‐ |
| C: metformin ≥ 1500 mg/day + vildagliptin 100 mg/day | 50 | 0 | 0 | ‐ | ‐ | ‐ | ‐ | |
| Leiter 2015 | I: metformin ≥ 1500 mg/day + glimepiride 1‐8 mg/day | 482 | 35 | 7.3 | ‐ | ‐ | ‐ | ‐ |
| C1: metformin ≥ 1500 mg/day + canagliflozin 100 mg/day | 483 | 30 | 6.2 | ‐ | ‐ | ‐ | ‐ | |
| C2: metformin ≥ 1500 mg/day + canagliflozin 300 mg/day | 485 | 46 | 9.5 | ‐ | ‐ | ‐ | ‐ | |
| Del Prato 2015 | I: metformin 1500‐2500 mg/day + glipizide 5‐20 mg/day | 408 | 46 | 11.3 | ‐ | ‐ | ‐ | ‐ |
| C: metformin 1500‐2500 mg/day + dapagliflozin 2.5‐10 mg/day | 406 | 54 | 13.3 | ‐ | ‐ | ‐ | ‐ | |
| Schernthaner 2015 | I: metformin at any dose + glimepiride 1‐6 mg/day + placebo | 359 | 11 | 3.1 | ‐ | ‐ | ‐ | ‐ |
| C: metformin at any dose + saxagliptin 5 mg/day + placebo | 359 | 16 | 4.5 | ‐ | ‐ | ‐ | ‐ | |
| Del Prato 2014 | I: metformin ≥ 1500 mg once daily or maximum tolerated dose + glipizide 5‐20 mg once daily | 869 | 82 | 9.4 | ‐ | ‐ | ‐ | ‐ |
| C1: metformin ≥ 1500 mg once daily or maximum tolerated dose + alogliptin 12.5 mg once daily | 873 | 60 | 6.8 | ‐ | ‐ | ‐ | ‐ | |
| C2: metformin ≥ 1500 mg once daily or maximum tolerated dose + alogliptin 25 mg once daily | 878 | 74 | 8.4 | ‐ | ‐ | ‐ | ‐ | |
| Ahrén 2014 | I: metformin ≥ 1500 mg daily + glimepiride 2‐4 mg once daily + placebo + placebo | 307 | 17 | 5.5 | ‐ | ‐ | ‐ | ‐ |
| C1: metformin ≥ 1500 mg daily + albiglutide 30‐50 mg once weekly + placebo + placebo | 302 | 25 | 8.3 | ‐ | ‐ | ‐ | ‐ | |
| C2: metformin ≥ 1500 mg daily + sitagliptin 100 mg once daily + placebo + placebo | 302 | 13 | 4.3 | ‐ | ‐ | ‐ | ‐ | |
| C3: metformin ≥ 1500 mg daily + placebo + placebo | 101 | 5 | 5.0 | ‐ | ‐ | ‐ | ‐ | |
| Ridderstråle 2014 | I: metformin immediate release ≥ 1500 mg/day + glimepiride 1‐4 mg/day | 780 | 51 | 6.5 | ‐ | ‐ | ‐ | ‐ |
| C: metformin immediate release ≥ 1500 mg/day + empagliflozin 25 mg/day | 765 | 47 | 6.1 | ‐ | ‐ | ‐ | ‐ | |
| Göke 2013 | I: metformin ≥ 1500 mg daily + glipizide 5‐20 mg/day | 430 | 24 | 5.6 | ‐ | ‐ | ‐ | ‐ |
| C: metformin ≥ 1500 mg daily + saxagliptin 5 mg/day | 428 | 21 | 4.9 | ‐ | ‐ | ‐ | ‐ | |
| Maffioli 2013 | I: metformin 2550 mg/day + glibenclamide 10 mg/day | 84 | 4 | 4.8 | ‐ | ‐ | ‐ | ‐ |
| C: metformin 2550 mg/day + pioglitazone 30 mg/day | 86 | 4 | 4.7 | ‐ | ‐ | ‐ | ‐ | |
| Nauck 2013 | I: metformin 1500‐2000 mg/day + glimepiride 1‐4 mg/day + placebo | 244 | 14 | 5.7 | ‐ | ‐ | ‐ | ‐ |
| C1: metformin 1500‐2000 mg/day + liraglutide 0.6 mg/day + placebo | 242 | 22 | 9.1 | ‐ | ‐ | ‐ | ‐ | |
| C2: metformin 1500‐2000 mg/day + liraglutide 1.2 mg/day + placebo | 241 | 31 | 12.9 | ‐ | ‐ | ‐ | ‐ | |
| C3: metformin 1500‐2000 mg/day + liraglutide 1.8 mg/day + placebo | 242 | 35 | 14.5 | ‐ | ‐ | ‐ | ‐ | |
| C4: metformin 1500‐2000 mg/day + placebo + placebo | 122 | 3 | 2.5 | ‐ | ‐ | ‐ | ‐ | |
| Gallwitz 2012a | I: metformin median dose 2000 mg/day + glimepiride mean dose 2.01 mg/day | 508 | 17 | 3.3 | ‐ | ‐ | ‐ | ‐ |
| C: metformin median dose 2000 mg/day + exenatide mean dose 17.35 μg/day | 511 | 49 | 9.6 | ‐ | ‐ | ‐ | ‐ | |
| Gallwitz 2012b | I: metformin ≥ 1500 mg/day + glimepiride 1‐4 mg/day + placebo | 775 | 85 | 11 | ‐ | ‐ | ‐ | ‐ |
| C: metformin ≥ 1500 mg/day + linagliptin 5 mg/day + placebo | 776 | 60 | 8 | ‐ | ‐ | ‐ | ‐ | |
| Derosa 2011a | I: metformin 1000‐2000 mg/day + glimepiride 6 mg/day | 54 | 4 | 7.4 | ‐ | ‐ | ‐ | ‐ |
| C: metformin 1000‐2000 mg/day + exenatide 20 μg/day | 57 | 4 | 7.0 | ‐ | ‐ | ‐ | ‐ | |
| Derosa 2011b | I: metformin 1700 ± 850 mg/day + glibenclamide 5‐15 mg/day | 99 | 3 | 2.0 | ‐ | ‐ | ‐ | ‐ |
| C: metformin 1700 ± 850 mg/day + pioglitazone 15‐45 mg/day | 102 | 2 | 2.9 | ‐ | ‐ | ‐ | ‐ | |
| Petrica 2011 | I: metformin 1700 mg/day + glimepiride 4 mg/day | 34 | 4 | 11.8 | ‐ | ‐ | ‐ | ‐ |
| C: metformin 1700 mg/day + pioglitazone 30 mg/day | 34 | 3 | 8.8 | ‐ | ‐ | ‐ | ‐ | |
| Derosa 2010 | I: metformin 1500 ± 500 mg/day + glibenclamide 15 mg/day | 65 | 7 | 10.8 | ‐ | ‐ | ‐ | ‐ |
| C: metformin 1500 ± 500 mg/day + exenatide 20 μg/day | 63 | 4 | 6.3 | ‐ | ‐ | ‐ | ‐ | |
| Matthews 2010 | I: metformin ≥ 1500 mg twice a day + glimepiride 2‐6 mg/day | 1546 | 166 | 10.7 | ‐ | ‐ | ‐ | ‐ |
| C: metformin ≥ 1500 mg twice a day + vildagliptin 50 mg twice a day | 1553 | 130 | 8.4 | ‐ | ‐ | ‐ | ‐ | |
| Filozof 2010 | I: metformin 1500 mg/day + gliclazide 80‐320 mg/day | ‐ | 22 | 4.7 | ‐ | ‐ | ‐ | ‐ |
| C: metformin 1500 mg/day + vildagliptin 100 mg/day | ‐ | 33 | 6.7 | ‐ | ‐ | ‐ | ‐ | |
| Seck 2010 | I: metformin ≥ 1500 mg/day + glipizide 5‐20 mg/day | 584 | 36 | 6.2 | ‐ | ‐ | ‐ | ‐ |
| C: metformin ≥ 1500 mg/day + sitagliptin 100 mg/day | 588 | 35 | 6.0 | ‐ | ‐ | ‐ | ‐ | |
| Home 2009 | I: metformin up to 2550 mg/day + glibenclamide (or equivalent for different preparations) up to 15 mg/day or gliclazide up to 240 mg/day or glimepiride up to 4 mg/day | 1105 | 8 | 0.7 | ‐ | ‐ | ‐ | ‐ |
| C: metformin up to 2550 mg/day + rosiglitazone up to 8 mg/day | 1117 | 5 | 0.4 | ‐ | ‐ | ‐ | ‐ | |
| Derosa 2009a | I: metformin 850 mg/day + glimepiride 2‐6 mg/day | 66 | 3 | 4.6 | ‐ | ‐ | ‐ | ‐ |
| C1: metformin 850‐2550 mg/day + pioglitazone 15‐45 mg/day | 69 | 2 | 2.9 | ‐ | ‐ | ‐ | ‐ | |
| C2: metformin 1000‐3000 mg/day | 67 | 5 | 7.5 | ‐ | ‐ | ‐ | ‐ | |
| Derosa 2009b | I: metformin 1500‐3000 mg/day + glibenclamide 7.5‐15 mg/day | 124 | 0 | 0 | ‐ | ‐ | ‐ | ‐ |
| C: metformin 1500‐3000 mg/day + nateglinide 180‐360 mg/day | 124 | 0 | 0 | ‐ | ‐ | ‐ | ‐ | |
| Petrica 2009 | I: metformin 1700 mg/day + glimepiride 4 mg/day | 22 | 0 | 0 | ‐ | ‐ | ‐ | ‐ |
| C: metformin 1700 mg/day + rosiglitazone 4 mg/day | 22 | 3 | 13.6 | ‐ | ‐ | ‐ | ‐ | |
| NCT00367055 | I: metformin 2000 mg/day + gliclazide 80‐320 mg/day | 41 | 3 | 7 | ‐ | ‐ | ‐ | ‐ |
| C: metformin 2000 mg/day + rosiglitazone 4‐8 mg/day | 43 | 6 | 14 | ‐ | ‐ | ‐ | ‐ | |
| Hamann 2008 | I: metformin 2000 mg/day + glibenclamide 5‐15 mg/day or gliclazide 80‐320 mg/day | 301 | 12 | 4.0 | ‐ | ‐ | ‐ | ‐ |
| C: metformin 2000 mg/day + rosiglitazone 4‐8 mg/day | 294 | 11 | 3.7 | ‐ | ‐ | ‐ | ‐ | |
| Ristic 2007 | I: metformin > 1000 mg/day + gliclazide 80‐240 mg/day | |||||||
| C: metformin > 1000 mg/day + nateglinide 180‐540 mg/day | ||||||||
| Charbonnel 2005 | I: metformin at pre‐study dose + gliclazide 80‐320 mg/day | 313 | 22 | 7.0 | ‐ | ‐ | ‐ | ‐ |
| C: metformin at pre‐study dose + pioglitazone 15‐45 mg/day | 317 | 21 | 6.6 | ‐ | ‐ | ‐ | ‐ | |
| Derosa 2005 | I: metformin 1500 mg/day + glimepiride 2 mg/day | 47 | 0 | 0 | ‐ | ‐ | ‐ | ‐ |
| C: metformin 1500 mg/day + rosiglitazone 4 mg/day | 48 | 0 | 0 | ‐ | ‐ | ‐ | ‐ | |
| Gerich 2005 | I: metformin 500‐2000 mg/day + glyburide 1.25‐15 mg/day + placebo | 209 | 28 | 13.4 | ‐ | ‐ | ‐ | ‐ |
| C: metformin 500‐2000 mg/day + nateglinide 180‐540 mg/day + placebo | 219 | 27 | 12.3 | ‐ | ‐ | ‐ | ‐ | |
| ‐ denotes not reported C: comparator; I: intervention | ||||||||
Appendix 13. Adverse events (III)
| Trial ID | Intervention(s) and comparator(s) | Participants included in analysis (N) | Participants with a specific adverse event (description) | Participants with at least one specific adverse event (N) | Participants with at least one specific adverse event (%) |
| Handelsman 2017 | I: metformin ≥ 1500 mg/day + glimepiride 1‐6 mg/day + placebo | 375 | |||
| C: metformin ≥ 1500 mg/day + omarigliptin 25 mg/week + placebo | 375 | ||||
| Hollander 2017 | I: metformin ≥ 1500 mg/day + glimepiride 1‐8 mg/day + placebo | 437 | |||
| C1: metformin ≥ 1500 mg/day + ertugliflozin 5 mg/day + placebo | 448 | ||||
| C2: metformin ≥ 1500 mg/day + ertugliflozin 15 mg/day + placebo | 440 | ||||
| Vaccaro 2017 | I: metformin 2000 mg/day + sulphonylurea (glibenclamide 5‐15 mg/day, gliclazide 30‐120 mg/day or glimepiride 2‐6 mg/day) | 1493 | ‐ | ‐ | ‐ |
| C: metformin 2000 mg/day + pioglitazone 15‐45 mg/day) | 1535 | ‐ | ‐ | ‐ | |
| Dei Cas 2017 | I: metformin ≥ 1500 mg/day + glibenclamide 10 mg/day | 24 | ‐ | ‐ | ‐ |
| C: metformin ≥ 1500 mg/day + vildagliptin 100 mg/day | 40 | ‐ | ‐ | ‐ | |
| Leiter 2015 | I: metformin ≥ 1500 mg/day + glimepiride 1‐8 mg/day | 482 | |||
| C1: metformin ≥ 1500 mg/day + canagliflozin 100 mg/day | 483 | ||||
| C2: metformin ≥ 1500 mg/day + canagliflozin 300 mg/day | 485 | ||||
| Del Prato 2015 | I: metformin 1500‐2500 mg/day + glipizide 5‐20 mg/day | 408 | ‐ | ‐ | ‐ |
| C: metformin 1500‐2500 mg/day + dapagliflozin 2.5‐10 mg/day | 406 | ‐ | ‐ | ‐ | |
| Schernthaner 2015 | I: metformin at any dose + glimepiride 1‐6 mg/day + placebo | 359 | |||
| C: metformin at any dose + saxagliptin 5 mg/day + placebo | 359 | ||||
| Del Prato 2014 | I: metformin ≥ 1500 mg once daily or maximum tolerated dose + glipizide 5‐20 mg once daily | 869 | ‐ | ‐ | ‐ |
| C1: metformin ≥ 1500 mg once daily or maximum tolerated dose + alogliptin 12.5 mg once daily | 873 | ‐ | ‐ | ‐ | |
| C2: metformin ≥ 1500 mg once daily or maximum tolerated dose + alogliptin 25 mg once daily | 878 | ‐ | ‐ | ‐ | |
| Ahrén 2014 | I: metformin ≥ 1500 mg daily + glimepiride 2‐4 mg once daily + placebo + placebo | 307 | (1) injection site reaction (2) upper respiratory tract infection | (1) 9 (2) 32 | (1) 2.9 (2) 10.4 |
| C1: metformin ≥ 1500 mg daily + albiglutide 30‐50 mg once weekly + placebo + placebo | 302 | (1) injection site reaction (2) upper respiratory tract infection | (1) 33 (2) 58 | (1) 10.9 (2) 19.2 | |
| C2: metformin ≥ 1500 mg daily + sitagliptin 100 mg once daily + placebo + placebo | 302 | (1) injection site reaction (2) upper respiratory tract infection | (1) 5 (2) 33 | (1) 1.7 (2) 10.9 | |
| C3: metformin ≥ 1500 mg daily + placebo + placebo | 101 | (1) injection site reaction (2) upper respiratory tract infection | (1) 2 (2) 10 | (1) 2.0 (2) 9.9 | |
| Ridderstråle 2014 | I: metformin immediate release ≥ 1500 mg/day + glimepiride 1‐4 mg/day | 780 | |||
| C: metformin immediate release ≥ 1500 mg/day + empagliflozin 25 mg/day | 765 | ||||
| Göke 2013 | I: metformin ≥ 1500 mg daily + glipizide 5‐20 mg/day | 430 | |||
| C: metformin ≥ 1500 mg daily + saxagliptin 5 mg/day | 428 | ||||
| Maffioli 2013 | I: metformin 2550 mg/day + glibenclamide 10 mg/day | ‐ | |||
| C: metformin 2550 mg/day + pioglitazone 30 mg/day | ‐ | ||||
| Nauck 2013 | I: metformin 1500‐2000 mg/day + glimepiride 1‐4 mg/day + placebo | 242 | (1) Nausea (2) Diarhea (3) Vomiting | (1) 10 (2) 14 (3) 1 | (1) 4.1 (2) 5.8 (3) 0.4 |
| C1: metformin 1500‐2000 mg/day + liraglutide 0.6 mg/day + placebo | 242 | (1) Nausea (2) Diarhea (3) Vomiting | (1) 30 (2) 31 (3) 19 | (1) 12.4 (2) 12.8 (3) 7.9 | |
| C2: metformin 1500‐2000 mg/day + liraglutide 1.2 mg/day + placebo | 240 | (1) Nausea (2) Diarhea (3) Vomiting | (1) 42 (2) 27 (3) 18 | (1) 17.5 (2) 11.3 (3) 7.5 | |
| C3: metformin 1500‐2000 mg/day + liraglutide 1.8 mg/day + placebo | 242 | (1) Nausea (2) Diarhea (3) Vomiting | (1) 52 (2) 40 (3) 24 | (1) 21.5 (2) 15.5 (3) 9.9 | |
| C4: metformin 1500‐2000 mg/day + placebo + placebo | 121 | (1) Nausea (2) Diarhea (3) Vomiting | (1) 5 (2) 5 (3) 0 | (1) 4.1 (2) 4.1 (3) 0.0 | |
| Gallwitz 2012b | I: metformin median dose 2000 mg/day + glimepiride mean dose 2.01 mg/day | 775 | |||
| C: metformin median dose 2000 mg/day + exenatide mean dose 17.35 μg/day | 776 | ||||
| Gallwitz 2012a | I: metformin ≥ 1500 mg/day + glimepiride 1‐4 mg/day + placebo | 508 | Nausea | 11 | 2 |
| C: metformin ≥ 1500 mg/day + linagliptin 5 mg/day + placebo | 511 | Nausea | 147 | 29 | |
| Derosa 2011a | I: metformin 1000‐2000 mg/day + glimepiride 6 mg/day | ‐ | |||
| C: metformin 1000‐2000 mg/day + exenatide 20 μg/day | ‐ | ||||
| Derosa 2011b | I: metformin 1700 ± 850 mg/day + glibenclamide 5‐15 mg/day | ‐ | |||
| C: metformin 1700 ± 850 mg/day + pioglitazone 15‐45 mg/day | ‐ | ||||
| Petrica 2011 | I: metformin 1700 mg/day + glimepiride 4 mg/day | 34 | |||
| C: metformin 1700 mg/day + pioglitazone 30 mg/day | 34 | ||||
| Derosa 2010 | I: metformin 1500 ± 500 mg/day + glibenclamide 15 mg/day | ‐ | |||
| C: metformin 1500 ± 500 mg/day + exenatide 20 μg/day | ‐ | ||||
| Matthews 2010 | I: metformin ≥ 1500 mg twice a day + glimepiride 2‐6 mg/day | 1546 | Dizziness | 247 | 16.0 |
| C: metformin ≥ 1500 mg twice a day + vildagliptin 50 mg twice a day | 1553 | Dizziness | 128 | 8.2 | |
| Filozof 2010 | I: metformin 1500 mg/day + gliclazide 80‐320 mg/day | 493 | |||
| C: metformin 1500 mg/day + vildagliptin 100 mg/day | 510 | ||||
| Seck 2010 | I: metformin ≥ 1500 mg/day + glipizide 5‐20 mg/day | 584 | |||
| C: metformin ≥ 1500 mg/day + sitagliptin 100 mg/day | 588 | ||||
| Home 2009 | I: metformin up to 2550 mg/day + glibenclamide (or equivalent for different preparations) up to 15 mg/day or gliclazide up to 240 mg/day or glimepiride up to 4 mg/day | 1105 | ‐ | ‐ | ‐ |
| C: metformin up to 2550 mg/day + rosiglitazone up to 8 mg/day | 1117 | ‐ | ‐ | ‐ | |
| Derosa 2009a | I: metformin 850 mg/day + glimepiride 2‐6 mg/day | ‐ | |||
| C1: metformin 850‐2550 mg/day + pioglitazone 15‐45 mg/day | ‐ | ||||
| C2: metformin 1000‐3000 mg/day | ‐ | ||||
| Derosa 2009b | I: metformin 1500‐3000 mg/day + glibenclamide 7.5‐15 mg/day | ‐ | |||
| C: metformin 1500‐3000 mg/day + nateglinide 180‐360 mg/day | ‐ | ||||
| Petrica 2009 | I: metformin 1700 mg/day + glimepiride 4 mg/day | 22 | |||
| C: metformin 1700 mg/day + rosiglitazone 4 mg/day | 22 | ||||
| NCT00367055 | I: metformin 2000 mg/day + gliclazide 80‐320 mg/day | 41 | Bronchitis | 1 | 2 |
| C: metformin 2000 mg/day + rosiglitazone 4‐8 mg/day | 43 | Bronchitis | 8 | 19 | |
| Hamann 2008 | I: metformin 2000 mg/day + glibenclamide 5‐15 mg/day or gliclazide 80‐320 mg/day | 301 | |||
| C: metformin 2000 mg/day + rosiglitazone 4‐8 mg/day | 294 | ||||
| Ristic 2007 | I: metformin > 1000 mg/day + gliclazide 80‐240 mg/day | ||||
| C: metformin > 1000 mg/day + nateglinide 180‐540 mg/day | |||||
| Charbonnel 2005 | I: metformin at pre‐study dose + gliclazide 80‐320 mg/day | 313 | |||
| C: metformin at pre‐study dose + pioglitazone 15‐45 mg/day | 317 | ||||
| Derosa 2005 | I: metformin 1500 mg/day + glimepiride 2 mg/day | 47 | (1) (2) | (1) (2) | (1) (2) |
| C: metformin 1500 mg/day + rosiglitazone 4 mg/day | 48 | (1) (2) | (1) (2) | (1) (2) | |
| Gerich 2005 | I: metformin 500‐2000 mg/day + glyburide 1.25‐15 mg/day + placebo | 209 | (1) (2) | (1) (2) | (1) (2) |
| C: metformin 500‐2000 mg/day + nateglinide 180‐540 mg/day + placebo | 219 | (1) (2) | (1) (2) | (1) (2) | |
| ‐ denotes not reported C: comparator; I: intervention |
|||||
Appendix 14. Adverse events (IV)
| Trial ID | Intervention(s) and comparator(s) | Participants included in analysis (N) | Participants with at least one hypoglycaemic episode (N) | Participants with at least one hypoglycaemic episode (%) | Participants with at least one nocturnal hypoglycaemic episode (N) | Participants with at least one nocturnal hypoglycaemic episode (% participants) | Participants with at least one severe/serious hypoglycaemic episode (N) | Participants with at least one severe/serious hypoglycaemic episode (%) |
| Handelsman 2017 | I: metformin ≥ 1500 mg/day + glimepiride 1‐6 mg/day + placebo | 375 | 110 | 29.3 | ‐ | ‐ | 6 | 1.6 |
| C: metformin ≥ 1500 mg/day + omarigliptin 25 mg/week + placebo | 375 | 21 | 5.6 | ‐ | ‐ | 1 | 0.3 | |
| Hollander 2017 | I: metformin ≥ 1500 mg/day + glimepiride 1‐8 mg/day + placebo | 437 | 119 | 27.2 | ‐ | ‐ | 10 | 2.3 |
| C1: metformin ≥ 1500 mg/day + ertugliflozin 5 mg/day + placebo | 448 | 25 | 5.6 | ‐ | ‐ | 1 | 0.2 | |
| C2: metformin ≥ 1500 mg/day + ertugliflozin 15 mg/day + placebo | 440 | 36 | 8.2 | ‐ | ‐ | 1 | 0.2 | |
| Vaccaro 2017 | I: metformin 2000 mg/day + sulphonylurea (glibenclamide 5‐15 mg/day, gliclazide 30‐120 mg/day or glimepiride 2‐6 mg/day) | 1493 | ‐ | ‐ | ‐ | ‐ | 24 | 2 |
| C: metformin 2000 mg/day + pioglitazone 15‐45 mg/day) | 1535 | ‐ | ‐ | ‐ | ‐ | 1 | <1 | |
| Dei Cas 2017 | I: metformin ≥ 1500 mg/day + glibenclamide 10 mg/day | 24 | 5 | 20.8 | ‐ | ‐ | 1 | 4.2 |
| C: metformin ≥ 1500 mg/day + vildagliptin 100 mg/day | 40 | 0 | 0 | ‐ | ‐ | 0 | 0 | |
| Leiter 2015 | I: metformin ≥ 1500 mg/day + glimepiride 1‐8 mg/day | 482 | 197 | 40.9 | ‐ | ‐ | 16 | 3.3 |
| C1: metformin ≥ 1500 mg/day + canagliflozin 100 mg/day | 483 | 33 | 6.8 | ‐ | ‐ | 3 | 0.6 | |
| C2: metformin ≥ 1500 mg/day + canagliflozin 300 mg/day | 485 | 40 | 8.2 | ‐ | ‐ | 3 | 0.6 | |
| Del Prato 2015 | I: metformin 1500‐2500 mg/day + glipizide 5‐20 mg/day | 408 | 210 | 51.5 | ‐ | ‐ | 3 | 0.7 |
| C: metformin 1500‐2500 mg/day + dapagliflozin 2.5‐10 mg/day | 406 | 22 | 5.4 | ‐ | ‐ | 0 | 0.0 | |
| Schernthaner 2015 | I: metformin at any dose + glimepiride 1‐6 mg/day + placebo | 359 | 125 | 34.8 | ‐ | ‐ | 1 | 0.3 |
| C: metformin at any dose + saxagliptin 5 mg/day + placebo | 359 | 21 | 5.8 | ‐ | ‐ | 0 | 0 | |
| Del Prato 2014 | I: metformin ≥ 1500 mg once daily or maximum tolerated dose + glipizide 5‐20 mg once daily | 869 | 202 | 23.2 | ‐ | ‐ | 5 | 0.6 |
| C1: metformin ≥ 1500 mg once daily or maximum tolerated dose + alogliptin 12.5 mg once daily | 873 | 22 | 2.5 | ‐ | ‐ | 1 | 0.1 | |
| C2: metformin ≥ 1500 mg once daily or maximum tolerated dose + alogliptin 25 mg once daily | 878 | 12 | 1.4 | ‐ | ‐ | 0 | 0 | |
| Ahrén 2014 | I: metformin ≥ 1500 mg daily + glimepiride 2‐4 mg once daily + placebo + placebo | 307 | 102 | 33.2 | ‐ | ‐ | 1 | 0.3 |
| C1: metformin ≥ 1500 mg daily + albiglutide 30‐50 mg once weekly + placebo + placebo | 302 | 35 | 11.6 | ‐ | ‐ | 0 | 0 | |
| C2: metformin ≥ 1500 mg daily + sitagliptin 100 mg once daily + placebo + placebo | 302 | 25 | 8.3 | ‐ | ‐ | 1 | 0.3 | |
| C3: metformin ≥ 1500 mg daily + placebo + placebo | 101 | 18 | 17.2 | ‐ | ‐ | 0 | 0 | |
| Ridderstråle 2014 | I: metformin immediate release ≥ 1500 mg/day + glimepiride 1‐4 mg/day | 780 | 228 | 29.2 | ‐ | ‐ | 1 | 0.1 |
| C: metformin immediate release ≥ 1500 mg/day + empagliflozin 25 mg/day | 765 | 41 | 5.4 | ‐ | ‐ | 0 | 0 | |
| Göke 2013 | I: metformin ≥ 1500 mg daily + glipizide 5‐20 mg/day | 430 | 165 | 38.4 | ‐ | ‐ | 7 | 0 |
| C: metformin ≥ 1500 mg daily + saxagliptin 5 mg/day | 428 | 15 | 3.5 | ‐ | ‐ | 1 | 1.6 | |
| Maffioli 2013 | I: metformin 2550 mg/day + glibenclamide 10 mg/day | ‐ | ‐ | ‐ | ‐ | ‐ | ‐ | ‐ |
| C: metformin 2550 mg/day + pioglitazone 30 mg/day | ‐ | ‐ | ‐ | ‐ | ‐ | ‐ | ‐ | |
| Nauck 2013 | I: metformin 1500‐2000 mg/day + glimepiride 1‐4 mg/day + placebo | 242 | 58 | 24.0 | ‐ | ‐ | 0 | 0 |
| C1: metformin 1500‐2000 mg/day + liraglutide 0.6 mg/day + placebo | 242 | 12 | 5.0 | ‐ | ‐ | 0 | 0 | |
| C2: metformin 1500‐2000 mg/day + liraglutide 1.2 mg/day + placebo | 240 | 10 | 4.2 | ‐ | ‐ | 1 | 0.4 | |
| C3: metformin 1500‐2000 mg/day + liraglutide 1.8 mg/day + placebo | 242 | 10 | 4.1 | ‐ | ‐ | 0 | 0 | |
| C4: metformin 1500‐2000 mg/day + placebo + placebo | 121 | 3 | 2.5 | ‐ | ‐ | 0 | 0 | |
| Gallwitz 2012a | I: metformin median dose 2000 mg/day + glimepiride mean dose 2.01 mg/day | 508 | 338 | 67 | 82 | 16 | 0 | 0 |
| C: metformin median dose 2000 mg/day + exenatide mean dose 17.35 μg/day | 511 | 186 | 36 | 53 | 10 | 1 | 0.2 | |
| Gallwitz 2012b | I: metformin ≥ 1500 mg/day + glimepiride 1‐4 mg/day + placebo | 775 | 280 | 36 | ‐ | ‐ | 12 | 1.5 |
| C: metformin ≥ 1500 mg/day + linagliptin 5 mg/day + placebo | 776 | 58 | 7 | ‐ | ‐ | 1 | 0.1 | |
| Derosa 2011a | I: metformin 1000‐2000 mg/day + glimepiride 6 mg/day | ‐ | ‐ | ‐ | ‐ | ‐ | ‐ | ‐ |
| C: metformin 1000‐2000 mg/day + exenatide 20 μg/day | ‐ | ‐ | ‐ | ‐ | ‐ | ‐ | ‐ | |
| Derosa 2011b | I: metformin 1700 ± 850 mg/day + glibenclamide 5‐15 mg/day | ‐ | ‐ | ‐ | ‐ | ‐ | ‐ | ‐ |
| C: metformin 1700 ± 850 mg/day + pioglitazone 15‐45 mg/day | ‐ | ‐ | ‐ | ‐ | ‐ | ‐ | ‐ | |
| Petrica 2011 | I: metformin 1700 mg/day + glimepiride 4 mg/day | 34 | ‐ | ‐ | ‐ | ‐ | ‐ | ‐ |
| C: metformin 1700 mg/day + pioglitazone 30 mg/day | 34 | ‐ | ‐ | ‐ | ‐ | ‐ | ‐ | |
| Derosa 2010 | I: metformin 1500 ± 500 mg/day + glibenclamide 15 mg/day | ‐ | ‐ | ‐ | ‐ | ‐ | ‐ | ‐ |
| C: metformin 1500 ± 500 mg/day + exenatide 20 μg/day | ‐ | ‐ | ‐ | ‐ | ‐ | ‐ | ‐ | |
| Matthews 2010 | I: metformin ≥ 1500 mg twice a day + glimepiride 2‐6 mg/day | 1546 | 281 | 18.2 | ‐ | ‐ | 15 | 1.8 |
| C: metformin ≥ 1500 mg twice a day + vildagliptin 50 mg twice a day | 1553 | 35 | 2.3 | ‐ | ‐ | 0 | 0.0 | |
| Filozof 2010 | I: metformin 1500 mg/day + gliclazide 80‐320 mg/day | 493 | 11 | 2.2 | ‐ | ‐ | ‐ | ‐ |
| C: metformin 1500 mg/day + vildagliptin 100 mg/day | 510 | 6 | 1.2 | ‐ | ‐ | ‐ | ‐ | |
| Seck 2010 | I: metformin ≥ 1500 mg/day + glipizide 5‐20 mg/day | 584 | 199 | 34.1 | ‐ | ‐ | 9 | 1.5 |
| C: metformin ≥ 1500 mg/day + sitagliptin 100 mg/day | 588 | 31 | 5.3 | ‐ | ‐ | 1 | 0.2 | |
| Home 2009 | I: metformin up to 2550 mg/day + glibenclamide (or equivalent for different preparations) up to 15 mg/day or gliclazide up to 240 mg/day or glimepiride up to 4 mg/day | 1105 | 190 | 17.2 | ‐ | ‐ | 5 | 0.5 |
| C: metformin up to 2550 mg/day + rosiglitazone up to 8 mg/day | 1117 | 51 | 4.6 | ‐ | ‐ | 5 | 0.5 | |
| Derosa 2009a | I: metformin 850 mg/day + glimepiride 2‐6 mg/day | ‐ | 3 | ‐ | ‐ | ‐ | ‐ | ‐ |
| C1: metformin 850‐2550 mg/day + pioglitazone 15‐45 mg/day | ‐ | 2 | ‐ | ‐ | ‐ | ‐ | ‐ | |
| C2: metformin 1000‐3000 mg/day | ‐ | 0 | ‐ | ‐ | ‐ | ‐ | ‐ | |
| Derosa 2009b | I: metformin 1500‐3000 mg/day + glibenclamide 7.5‐15 mg/day | ‐ | ‐ | ‐ | ‐ | ‐ | ‐ | ‐ |
| C: metformin 1500‐3000 mg/day + nateglinide 180‐360 mg/day | ‐ | ‐ | ‐ | ‐ | ‐ | ‐ | ‐ | |
| Petrica 2009 | I: metformin 1700 mg/day + glimepiride 4 mg/day | 22 | ‐ | ‐ | ‐ | ‐ | ‐ | ‐ |
| C: metformin 1700 mg/day + rosiglitazone 4 mg/day | 22 | ‐ | ‐ | ‐ | ‐ | ‐ | ‐ | |
| NCT00367055 | I: metformin 2000 mg/day + gliclazide 80‐320 mg/day | 41 | 8 | 20 | ‐ | ‐ | ‐ | ‐ |
| C: metformin 2000 mg/day + rosiglitazone 4‐8 mg/day | 43 | 1 | 2 | ‐ | ‐ | ‐ | ‐ | |
| Hamann 2008 | I: metformin 2000 mg/day + glibenclamide 5‐15 mg/day or gliclazide 80‐320 mg/day | 301 | 91 | 30 | ‐ | ‐ | 1 | 0.3 |
| C: metformin 2000 mg/day + rosiglitazone 4‐8 mg/day | 294 | 19 | 6 | ‐ | ‐ | 0 | 0 | |
| Ristic 2007 | I: metformin > 1000 mg/day + gliclazide 80‐240 mg/day | |||||||
| C: metformin > 1000 mg/day + nateglinide 180‐540 mg/day | ||||||||
| Charbonnel 2005 | I: metformin at pre‐study dose + gliclazide 80‐320 mg/day | 313 | 35 | 11.2 | ‐ | ‐ | 0 | 0 |
| C: metformin at pre‐study dose + pioglitazone 15‐45 mg/day | 317 | 4 | 1.3 | ‐ | ‐ | 0 | 0 | |
| Derosa 2005 | I: metformin 1500 mg/day + glimepiride 2 mg/day | 47 | 4 | 8.5 | ‐ | ‐ | 0 | 0 |
| C: metformin 1500 mg/day + rosiglitazone 4 mg/day | 48 | 2 | 4.2 | ‐ | ‐ | 0 | 0 | |
| Gerich 2005 | I: metformin 500‐2000 mg/day + glyburide 1.25‐15 mg/day + placebo | 209 | 37 | 17.7 | ‐ | ‐ | 2 | 0.9 |
| C: metformin 500‐2000 mg/day + nateglinide 180‐540 mg/day + placebo | 219 | 18 | 8.2 | ‐ | ‐ | 0 | 0.0 | |
| ‐ denotes not reported C: comparator; I: intervention | ||||||||
Appendix 15. Survey of trial investigators providing information on studies
| Trial ID | Date trial author contacted | Date trial author replied | Date trial author was asked for additional information (short summary) | Date trial author provided data (short summary) |
| Handelsman 2017 | 6 March 2018 | No reply | N/A | N/A |
| Hollander 2017 | 5 March 2018 (email sent to last author Brett Lauring) | No reply | N/A | N/A |
| Vaccaro 2017 | 15 February 2018 27 February (author Sartore was contacted) |
15 February 2018 1 March 2018 (author Chilelli responded on behalf of author Sartore) |
16 February 2018 Additional material on the trial? Additional RCT to be included? Data on remaining outcomes? 5 March 2018 Author Chilelli was asked about a reference for which no full‐text was found | 22 February 2018
No additional material on the trial
No additional RCT to be included
Provided data on non‐serious adverse events 8 March 2018 (an unpublished substudy to the Vaccaro 2017 trial was received from author Chilelli) |
| Dei Cas 2017 | 5 July 2017 | 5 July 2017 | 6 July 2017 Additional material on the trial? Additional RCT to be included? Data on remaining outcomes? | 18 July 2017 (data on remaining outcomes) |
| Leiter 2015 | 2 February 2017 | No reply | N/A | N/A |
| Del Prato 2015 | 3 March 2017 | 10 March (mail not delivered due to problem with permission or security) | N/A | N/A |
| Schernthaner 2015 | 2 August 2017 | 2 August 2017 | 3 August 2017 Additional material on the trial? Additional RCT to be included? Data on remaining outcomes? | No reply |
| Del Prato 2014 | 5 January 2017 | No reply | N/A | N/A |
| Ahrén 2014 | 5 December 2016 | 8 December 2016 | 5 December 2016 | 8 December 2016: "I have forwarded you to the relevant person at GSK, who should be able to get the data you need. You should hear from him directly" Since then: no response |
| Ridderstråle 2014 | 18 July 2017 | 18 July 2017 ‐ mail not delivered | N/A | N/A |
| Göke 2013 | 10 July 2017 (contact person: Ingrid Gause‐Nilsson) | 14 July 2017 | 14 July 2017 Additional material on the trial? Additional RCT to be included? Imputation method? Data on remaining outcomes? | 9 August 2017 (will look in to some of the questions. Advised us to contact AZ in Denmark as well. Email sent to AZ Denmark 10 August 2017) 28 September (had questions regarding definition of hypoglycaemia) |
| Maffioli 2013 | 25 January 2017 | No reply | N/A | N/A |
| Nauck 2013 | 28 March 2017 | 28 March 2017 Mail not delivered |
N/A | N/A |
| Gallwitz 2012a | 6 July 2017 | 10 July 2017 | 10 July 2017 Additional material on the trial? Additional RCT to be included? Data on remaining outcomes? | 29 July 2017 (no additional publications on the trial) |
| Gallwitz 2012b | 7 July 2017 | 10 July 2017 | 10 July 2017 Additional material on the trial? Additional RCT to be included? Data on remaining outcomes? | 29 July 2017 (no additional publications on the trial, attached a review of linagliptin) |
| Derosa 2011a | 18 January 2017 | 25 January 2017 | 18 January 2017 | 14 March 2017 (answer provided by colleague Pamela Maffioli. Provided data on remaining outcomes, but did not mention number of participants included in safety‐analysis. No reply after this) |
| Derosa 2011b | 19 January 2017 | 25 January 2017 | 19 January 2017 | 14 March 2017 ‐ answer provided by colleague Pamela Maffioli. Provided data on remaining outcomes, but did not mention number of participants included in safety‐analysis. No reply after this |
| Petrica 2011 | 16 July 2017 | 17 July 2017 | 3 August 2017 Additional material on the trial? Additional RCT to be included? Trial protocol available? Data on remaining outcomes? | No reply |
| Derosa 2010 | 12 January 2017 | 12 January 2017 | 12 January 2017 | 12 January 2017: "Thank you very much for your consideration. Please, give me some few days and I will happy to send you an email with all the information that I can have" Since then: no response |
| Matthews 2010 | 11 March 2017 | No reply | N/A | N/A |
| Filozof 2010 | 4 February 2017 | 9 February 2017 | 21 February 2017 (the primary author does not have access to trial data any more) | N/A |
| Seck 2010 | 14 July 2017 | 14 July 2017 (email not found) | N/A | N/A |
| Home 2009 | 1 April 2017 | 1 April 2017 | 7 April 2017 Additional material on the trial? Additional RCT to be included? Imputation method? Data on missing outcomes? | 7 April 2017 (information on imputation method) 10 April 2017 (provided data for CV mortality) |
| Derosa 2009a | 20 January 2017 | 25 January 2017 | 25 January 2017 Additional material on the trial? Additional RCT to be included? Trial protocol available? Data on remaining outcomes? | No reply |
| Derosa 2009b | 24 January 2017 | 24 January 2017 | 25 January 2017 Additional material on the trial? Additional RCT to be included? Trial protocol available? Data on remaining outcomes? | 14 March 2017 (answer provided by colleague Pamela Maffioli. Provided data on remaining outcomes, but did not mention number of participants included in safety‐analysis. No reply after this) |
| Petrica 2009 | 16 July 2017 | 17 July 2017 | 3 August 2017 Additional material on the trial? Additional RCT to be included? Trial protocol available? Data on remaining outcomes? | No reply |
| NCT00367055 | No contact details available | No reply | N/A | N/A |
| Hamann 2008 | 12 July 2017 | 12 July 2017 (email not found) | N/A | N/A |
| Ristic 2007 | 17 July 2017 | 17 July 2017 (email not found) | N/A | N/A |
| Charbonnel 2005 | 13 July 2017 | No reply | N/A | N/A |
| Derosa 2005 | 10 January 2017 | 25 January 2017 | 25 January 2017 Additional material on the trial? Additional RCT to be included? Trial protocol available? Data on remaining outcomes? | 14 March 2017 (answer provided by colleague Pamela Maffioli. Provided data on remaining outcomes) |
| Gerich 2005 | 16 March 2017 | 16 March 2017 (email not found) | N/A | N/A |
| Cryer 2005 | 2 August 2017 (contacted the author if separate data are available) | No reply | N/A | N/A |
| N/A: not applicable; RCT: randomised controlled trial | ||||
Appendix 16. Checklist to aid consistency and reproducibility of GRADE assessments: metformin plus sulphonylurea compared with metformin plus placebo
| (1) All‐cause mortality | (2) Cardiovascular mortality | (3) Serious adverse events | (4) Non‐fatal stroke | (5) Non‐fatal myocardial infarction | (6) Microvascular complications (end‐stage renal disease, blindness or severe vision loss, amputation of lower extremity) | (7) Health‐related quality of life | ||
| Trial limitations (risk of bias)a | Was random sequence generation used (i.e. no potential for selection bias)? | Unclear | Unclear | Unclear | Not reported | Unclear | Yes | Not reported |
| Was allocation concealment used (i.e. no potential for selection bias)? | Unclear | Unclear | Unclear | Unclear | Yes | |||
| Was there blinding of participants and personnel (i.e. no potential for performance bias) or outcome not likely to be influenced by lack of blinding? | Yes | Yes | Yes | Yes | Yes | |||
| Was there blinding of outcome assessment (i.e. no potential for detection bias) or was outcome measurement not likely to be influenced by lack of blinding? | Yes | Yes | Yes | Yes | Yes | |||
| Was an objective outcome used? | Yes | Yes | Yes | Yes | Yes | |||
| Were > 80% of participants enrolled in trials included in the analysis (i.e. no potential reporting bias)?e | Yes | Yes | No (↓) | Yes | No (↓) | |||
| Were data reported consistently for the outcome of interest (i.e. no potential selective reporting)? | Yes | Yes | Yes | Yes | Yes | |||
| No other biases reported (i.e. no potential of other bias)? | Unclear | Unclear | Unclear | Unclear | Unclear | |||
| Did the trials end up as scheduled (i.e. not stopped early)? | Yes | Yes | Yes | Yes | Yes | |||
| Inconsistencyb | Point estimates did not vary widely? | N/A | N/A | No (↓) | No (↓) | N/A | ||
| To what extent did confidence intervals overlap (substantial: all confidence intervals overlap at least one of the included studies point estimate; some: confidence intervals overlap but not all overlap at least one point estimate; no: at least one outlier: where the confidence interval of some of the studies do not overlap with those of most included studies)? | N/A | N/A | Substantial | Substantial | N/A | |||
| Was the direction of effect consistent? | N/A | N/A | No (↓) | No (↓) | N/A | |||
| What was the magnitude of statistical heterogeneity (as measured by I²) ‐ low (I² < 40%), moderate (I² 40%‐60%), high I² > 60%)? | N/A | N/A | Low | Low | N/A | |||
| Was the test for heterogeneity statistically significant (P < 0.1)? | N/A | N/A | Not statistically significant | Not statistically significant | N/A | |||
| Indirectness | Were the populations in included studies applicable to the decision context? | Highly applicable | Highly applicable | Highly applicable | Highly applicable | Highly applicable | ||
| Were the interventions in the included studies applicable to the decision context? | Highly applicable | Highly applicable | Highly applicable | Highly applicable | Highly applicable | |||
| Was the included outcome not a surrogate outcome? | Yes | Yes | Yes | Yes | Yes | |||
| Was the outcome timeframe sufficient? | Sufficient | Sufficient | Sufficient | Sufficient | Sufficient | |||
| Were the conclusions based on direct comparisons? | Yes | Yes | Yes | Yes | Yes | |||
| Imprecisionc | Was the confidence interval for the (pooled) estimate not consistent with benefit and harm? | No (↓) | N/A | Yes | Yes | N/A | ||
| What is the magnitude of the median sample size (high: 300 participants, intermediate: 100‐300 participants, low: < 100 participants)?e | Intermediate | High | High | High | High | |||
| What was the magnitude of the number of included studies (large: > 10 studies, moderate: 5‐10 studies, small: < 5 studies)?e | Small (↓) | Small (↓) | Small (↓) | Small (↓) | Small (↓) | |||
| Was the outcome a common event (e.g. occurs > 1/100)? | No (↓) | No (↓) | No (↓) | No (↓) | No (↓) | |||
| Publication biasd | Was a comprehensive search conducted? | Yes | Yes | Yes | Yes | Yes | ||
| Was grey literature searched? | Yes | Yes | Yes | Yes | Yes | |||
| Were no restrictions applied to study selection on the basis of language? | Yes | Yes | Yes | Yes | Yes | |||
| There was no industry influence on studies included in the review? | Unclear | Unclear | Unclear | Unclear | Unclear | |||
| There was no evidence of funnel plot asymmetry? | N/A | N/A | N/A | N/A | N/A | |||
| There was no discrepancy in findings between published and unpublished trials? | N/A | N/A | N/A | N/A | N/A | |||
|
aQuestions on risk of bias are answered in relation to the majority of the aggregated evidence in the meta‐analysis rather than to individual trials.
bQuestions on inconsistency are primarily based on visual assessment of forest plots and the statistical quantification of heterogeneity based on I². cWhen judging the width of the confidence interval it is recommended to use a clinical decision threshold to assess whether the imprecision is clinically meaningful. dQuestions address comprehensiveness of the search strategy, industry influence, funnel plot asymmetry and discrepancies between published and unpublished trials. eDepends on the context of the systematic review area. (↓): key item for potential downgrading the quality of the evidence (GRADE) as shown in the footnotes of the 'Summary of finding' table(s); GRADE: Grading of Recommendations Assessment, Development and Evaluation; N/A: not applicable | ||||||||
Appendix 17. Checklist to aid consistency and reproducibility of GRADE assessments: metformin plus sulphonylurea compared with metformin plus GLP‐1 analogue
| (1) All‐cause mortality | (2) Cardiovascular mortality | (3) Serious adverse events | (4) Non‐fatal stroke | (5) Non‐fatal myocardial infarction | (6) Microvascular complications (end‐stage renal disease, blindness or severe vision loss, amputation of lower extremity) | (7) Health‐related quality of life | ||
| Trial limitations (risk of bias)a | Was random sequence generation used (i.e. no potential for selection bias)? | Yes | Yes | Yes | Not reported | Unclear | Yes | Not reported |
| Was allocation concealment used (i.e. no potential for selection bias)? | Yes | Yes | Yes | Unclear | Yes | |||
| Was there blinding of participants and personnel (i.e. no potential for performance bias) or outcome not likely to be influenced by lack of blinding? | Yes | Yes | Yes | Yes | Yes | |||
| Was there blinding of outcome assessment (i.e. no potential for detection bias) or was outcome measurement not likely to be influenced by lack of blinding? | Yes | Yes | Yes | Yes | Yes | |||
| Was an objective outcome used? | Yes | Yes | Yes | Yes | Yes | |||
| Were > 80% of participants enrolled in trials included in the analysis (i.e. no potential reporting bias)?e | Yes | Yes | Unclear | Unclear | Unclear | |||
| Were data reported consistently for the outcome of interest (i.e. no potential selective reporting)? | Yes | Yes | Yes | Yes | N/A | |||
| No other biases reported (i.e. no potential of other bias)? | Unclear | Unclear | Unclear | Unclear | Unclear | |||
| Did the trials end up as scheduled (i.e. not stopped early)? | Yes | Yes | Yes | Yes | Yes | |||
| Inconsistencyb | Point estimates did not vary widely? | N/A | N/A | N/A | N/A | N/A | ||
| To what extent did confidence intervals overlap (substantial: all confidence intervals overlap at least one of the included studies point estimate; some: confidence intervals overlap but not all overlap at least one point estimate; no: at least one outlier: where the confidence interval of some of the studies do not overlap with those of most included studies)? | Substantial | N/A | Substantial | Substantial | N/A | |||
| Was the direction of effect consistent? | Unclear | N/A | Yes | N/A | N/A | |||
| What was the magnitude of statistical heterogeneity (as measured by I²) ‐ low (I²< 40%), moderate (I² 40%‐60%), high I² > 60%)? | Low | N/A | Low | Low | N/A | |||
| Was the test for heterogeneity statistically significant (P < 0.1)? | Not statistically significant | N/A | Not statistically significant | Not statistically significant | N/A | |||
| Indirectness | Were the populations in included studies applicable to the decision context? | Highly applicable | Highly applicable | Highly applicable | Highly applicable | Highly applicable | ||
| Were the interventions in the included studies applicable to the decision context? | Highly applicable | Highly applicable | Highly applicable | Highly applicable | Highly applicable | |||
| Was the included outcome not a surrogate outcome? | Yes | Yes | Yes | Yes | Yes | |||
| Was the outcome timeframe sufficient? | Sufficient | Sufficient | Sufficient | Sufficient | Sufficient | |||
| Were the conclusions based on direct comparisons? | Yes | Yes | Yes | Yes | Yes | |||
| Imprecisionc | Was the confidence interval for the (pooled) estimate not consistent with benefit and harm? | No (↓) | No (↓) | No (↓) | No (↓) | N/A | ||
| What is the magnitude of the median sample size (high: 300 participants, intermediate: 100‐300 participants, low: < 100 participants)?e | High | High | High | High | High | |||
| What was the magnitude of the number of included studies (large: > 10 studies, moderate: 5‐10 studies, small: < 5 studies)?e | Small (↓) | Small (↓) | Small (↓) | Small (↓) | Small (↓) | |||
| Was the outcome a common event (e.g. occurs > 1/100)? | No (↓) | No (↓) | Yes | No (↓) | No (↓) | |||
| Publication biasd | Was a comprehensive search conducted? | Yes | Yes | Yes | Yes | Yes | ||
| Was grey literature searched? | Yes | Yes | Yes | Yes | Yes | |||
| Were no restrictions applied to study selection on the basis of language? | Yes | Yes | Yes | Yes | Yes | |||
| There was no industry influence on studies included in the review? | Unclear | Unclear | Unclear | Unclear | Unclear | |||
| There was no evidence of funnel plot asymmetry? | N/A | N/A | N/A | N/A | N/A | |||
| There was no discrepancy in findings between published and unpublished trials? | Yes | Yes | Yes | Yes | N/A | |||
|
aQuestions on risk of bias are answered in relation to the majority of the aggregated evidence in the meta‐analysis rather than to individual trials.
bQuestions on inconsistency are primarily based on visual assessment of forest plots and the statistical quantification of heterogeneity based on I². cWhen judging the width of the confidence interval it is recommended to use a clinical decision threshold to assess whether the imprecision is clinically meaningful. dQuestions address comprehensiveness of the search strategy, industry influence, funnel plot asymmetry and discrepancies between published and unpublished trials. eDepends on the context of the systematic review area. (↓): key item for potential downgrading the quality of the evidence (GRADE) as shown in the footnotes of the 'Summary of finding' table(s); GRADE: Grading of Recommendations Assessment, Development and Evaluation; N/A: not applicable | ||||||||
Appendix 18. Checklist to aid consistency and reproducibility of GRADE assessments: metformin plus sulphonylurea compared with metformin plus DPP4‐inhibitor
| (1) All‐cause mortality | (2) Cardiovascular mortality | (3) Serious adverse events | (4) Non‐fatal stroke | (5) Non‐fatal myocardial infarction | (6) Microvascular complications (end‐stage renal disease, blindness or severe vision loss, amputation of lower extremity) | (7) Health‐related quality of life | ||
| Trial limitations (risk of bias)a | Was random sequence generation used (i.e. no potential for selection bias)? | Yes | Unclear | Yes | Yes | Yes | Yes | Not reported |
| Was allocation concealment used (i.e. no potential for selection bias)? | Yes | Unclear | Yes | Yes | Yes | Yes | ||
| Was there blinding of participants and personnel (i.e. no potential for performance bias) or outcome not likely to be influenced by lack of blinding? | Yes | Yes | Yes | Yes | Yes | Yes | ||
| Was there blinding of outcome assessment (i.e. no potential for detection bias) or was outcome measurement not likely to be influenced by lack of blinding? | Yes | Yes | Yes | Yes | Yes | Yes | ||
| Was an objective outcome used? | Yes | Yes | Yes | Yes | Yes | Yes | ||
| Were > 80% of participants enrolled in trials included in the analysis (i.e. no potential reporting bias)?e | Yes | Yes | Unclear | Unclear | Unclear | Yes | ||
| Were data reported consistently for the outcome of interest (i.e. no potential selective reporting)? | Yes | Yes | Unclear | Yes | Yes | Yes | ||
| No other biases reported (i.e. no potential of other bias)? | Unclear | Unclear | Unclear | Unclear | Unclear | Unclear | ||
| Did the trials end up as scheduled (i.e. not stopped early)? | Yes | Yes | Yes | Yes | Yes | Yes | ||
| Inconsistencyb | Point estimates did not vary widely? | No (↓) | No (↓) | No (↓) | Yes | Yes | N/A | |
| To what extent did confidence intervals overlap (substantial: all confidence intervals overlap at least one of the included studies point estimate; some: confidence intervals overlap but not all overlap at least one point estimate; no: at least one outlier: where the confidence interval of some of the studies do not overlap with those of most included studies)? | Substantial | Substantial | Substantial | Substantial | Substantial | N/A | ||
| Was the direction of effect consistent? | No (↓) | No (↓) | No (↓) | Yes | Yes | N/A | ||
| What was the magnitude of statistical heterogeneity (as measured by I²) ‐ low (I² < 40%), moderate (I² 40%‐60%), high I² > 60%)? | Low | Low | Low | Low | Low | N/A | ||
| Was the test for heterogeneity statistically significant (P < 0.1)? | Not statistically significant | Not statistically significant | Not statistically significant | Not statistically significant | Not statistically significant | N/A | ||
| Indirectness | Were the populations in included studies applicable to the decision context? | Highly applicable | Highly applicable | Highly applicable | Highly applicable | Highly applicable | Highly applicable | |
| Were the interventions in the included studies applicable to the decision context? | Highly applicable | Highly applicable | Highly applicable | Highly applicable | Highly applicable | Highly applicable | ||
| Was the included outcome not a surrogate outcome? | Yes | Yes | Yes | Yes | Yes | Yes | ||
| Was the outcome timeframe sufficient? | Sufficient | Sufficient | Sufficient | Sufficient | Sufficient | Sufficient | ||
| Were the conclusions based on direct comparisons? | Yes | Yes | Yes | Yes | Yes | Yes | ||
| Imprecisionc | Was the confidence interval for the (pooled) estimate not consistent with benefit and harm? | No (↓) | No (↓) | No (↓) | No (↓) | No (↓) | N/A | |
| What is the magnitude of the median sample size (high: 300 participants, intermediate: 100‐300 participants, low: < 100 participants)?e | High | High | High | High | High | Low (↓) | ||
| What was the magnitude of the number of included studies (large: > 10 studies, moderate: 5‐10 studies, small: < 5 studies)?e | Moderate | Moderate | Moderate | Small (↓) | Moderate | Small (↓) | ||
| Was the outcome a common event (e.g. occurs > 1/100)? | No (↓) | No (↓) | Yes | No (↓) | No (↓) | No (↓) | ||
| Publication biasd | Was a comprehensive search conducted? | Yes | Yes | Yes | Yes | Yes | Yes | |
| Was grey literature searched? | Yes | Yes | Yes | Yes | Yes | Yes | ||
| Were no restrictions applied to study selection on the basis of language? | Yes | Yes | Yes | Yes | Yes | Yes | ||
| There was no industry influence on studies included in the review? | Unclear | Unclear | Unclear | Unclear | Unclear | Yes | ||
| There was no evidence of funnel plot asymmetry? | N/A | N/A | N/A | N/A | N/A | N/A | ||
| There was no discrepancy in findings between published and unpublished trials? | Yes | Yes | Yes | Yes | Yes | N/A | ||
|
aQuestions on risk of bias are answered in relation to the majority of the aggregated evidence in the meta‐analysis rather than to individual trials.
bQuestions on inconsistency are primarily based on visual assessment of forest plots and the statistical quantification of heterogeneity based on I². cWhen judging the width of the confidence interval it is recommended to use a clinical decision threshold to assess whether the imprecision is clinically meaningful. dQuestions address comprehensiveness of the search strategy, industry influence, funnel plot asymmetry and discrepancies between published and unpublished trials. eDepends on the context of the systematic review area. (↓): key item for potential downgrading the quality of the evidence (GRADE) as shown in the footnotes of the 'Summary of finding' table(s); GRADE: Grading of Recommendations Assessment, Development and Evaluation; N/A: not applicable | ||||||||
Appendix 19. Checklist to aid consistency and reproducibility of GRADE assessments: metformin plus sulphonylurea compared with metformin plus long acting DPP4‐inhibitor
| (1) All‐cause mortality | (2) Cardiovascular mortality | (3) Serious adverse events | (4) Non‐fatal stroke | (5) Non‐fatal myocardial infarction | (6) Microvascular complications (end‐stage renal disease, blindness or severe vision loss, amputation of lower extremity) | (7) Health‐related quality of life | ||
| Trial limitations (risk of bias)a | Was random sequence generation used (i.e. no potential for selection bias)? | Yes | Yes | Yes | Not reported | Yes | Not reported | Not reported |
| Was allocation concealment used (i.e. no potential for selection bias)? | Yes | Yes | Yes | Yes | ||||
| Was there blinding of participants and personnel (i.e. no potential for performance bias) or outcome not likely to be influenced by lack of blinding? | Yes | Yes | Yes | Yes | ||||
| Was there blinding of outcome assessment (i.e. no potential for detection bias) or was outcome measurement not likely to be influenced by lack of blinding? | Yes | Yes | Yes | Yes | ||||
| Was an objective outcome used? | Yes | Yes | Yes | Yes | ||||
| Were > 80% of participants enrolled inImpre trials included in the analysis (i.e. no potential reporting bias)?e | Yes | Yes | Yes | Yes | ||||
| Were data reported consistently for the outcome of interest (i.e. no potential selective reporting)? | Yes | Yes | Yes | Yes | ||||
| No other biases reported (i.e. no potential of other bias)? | Unclear | Unclear | Unclear | Unclear | ||||
| Did the trials end up as scheduled (i.e. not stopped early)? | Yes | Yes | Yes | Yes | ||||
| Inconsistencyb | Point estimates did not vary widely? | N/A | N/A | N/A | N/A | |||
| To what extent did confidence intervals overlap (substantial: all confidence intervals overlap at least one of the included studies point estimate; some: confidence intervals overlap but not all overlap at least one point estimate; no: at least one outlier: where the confidence interval of some of the studies do not overlap with those of most included studies)? | N/A | N/A | N/A | N/A | ||||
| Was the direction of effect consistent? | N/A | N/A | N/A | N/A | ||||
| What was the magnitude of statistical heterogeneity (as measured by I²) ‐ low (I² < 40%), moderate (I² 40%‐60%), high I² > 60%)? | N/A | N/A | N/A | N/A | ||||
| Was the test for heterogeneity statistically significant (P < 0.1)? | N/A | N/A | N/A | N/A | ||||
| Indirectness | Were the populations in included studies applicable to the decision context? | Highly applicable | Highly applicable | Highly applicable | Highly applicable | |||
| Were the interventions in the included studies applicable to the decision context? | Highly applicable | Highly applicable | Highly applicable | Highly applicable | ||||
| Was the included outcome not a surrogate outcome? | Yes | Yes | Yes | Yes | ||||
| Was the outcome timeframe sufficient? | Insufficient (↓) | Insufficient (↓) | Sufficient | Insufficient (↓) | ||||
| Were the conclusions based on direct comparisons? | Yes | Yes | Yes | Yes | ||||
| Imprecisionc | Was the confidence interval for the (pooled) estimate not consistent with benefit and harm? | No (↓) | No (↓) | No (↓) | No (↓) | |||
| What is the magnitude of the median sample size (high: 300 participants, intermediate: 100‐300 participants, low: < 100 participants)?e | High | High | High | High | ||||
| What was the magnitude of the number of included studies (large: > 10 studies, moderate: 5‐10 studies, small: < 5 studies)?e | Small (↓) | Small (↓) | Small (↓) | Small (↓) | ||||
| Was the outcome a common event (e.g. occurs > 1/100)? | No (↓) | No (↓) | No (↓) | No (↓) | ||||
| Publication biasd | Was a comprehensive search conducted? | Yes | Yes | Yes | Yes | |||
| Was grey literature searched? | Yes | Yes | Yes | Yes | ||||
| Were no restrictions applied to study selection on the basis of language? | Yes | Yes | Yes | Yes | ||||
| There was no industry influence on studies included in the review? | Yes | Yes | Yes | Unclear | ||||
| There was no evidence of funnel plot asymmetry? | N/A | N/A | N/A | N/A | ||||
| There was no discrepancy in findings between published and unpublished trials? | N/A | N/A | N/A | N/A | ||||
|
aQuestions on risk of bias are answered in relation to the majority of the aggregated evidence in the meta‐analysis rather than to individual trials.
bQuestions on inconsistency are primarily based on visual assessment of forest plots and the statistical quantification of heterogeneity based on I². cWhen judging the width of the confidence interval it is recommended to use a clinical decision threshold to assess whether the imprecision is clinically meaningful. dQuestions address comprehensiveness of the search strategy, industry influence, funnel plot asymmetry and discrepancies between published and unpublished trials. eDepends on the context of the systematic review area. (↓): key item for potential downgrading the quality of the evidence (GRADE) as shown in the footnotes of the 'Summary of finding' table(s); GRADE: Grading of Recommendations Assessment, Development and Evaluation; N/A: not applicable | ||||||||
Appendix 20. Checklist to aid consistency and reproducibility of GRADE assessments: metformin plus sulphonylurea compared with metformin plus thiazolinedione
| (1) All‐cause mortality | (2) Cardiovascular mortality | (3) Serious adverse events | (4) Non‐fatal stroke | (5) Non‐fatal myocardial infarction | (6) Microvascular complications (end‐stage renal disease, blindness or severe vision loss, amputation of lower extremity) | (7) Health‐related quality of life | ||
| Trial limitations (risk of bias)a | Was random sequence generation used (i.e. no potential for selection bias)? | Yes | Yes | Yes | Yes | Yes | Yes | Not reported |
| Was allocation concealment used (i.e. no potential for selection bias)? | Yes | Yes | Yes | Yes | Yes | Yes | ||
| Was there blinding of participants and personnel (i.e. no potential for performance bias) or outcome not likely to be influenced by lack of blinding? | Yes | Yes | Yes | Yes | Yes | Yes | ||
| Was there blinding of outcome assessment (i.e. no potential for detection bias) or was outcome measurement not likely to be influenced by lack of blinding? | Yes | Yes | Yes | Yes | Yes | Yes | ||
| Was an objective outcome used? | Yes | Yes | Yes | Yes | Yes | Yes | ||
| Were > 80% of participants enrolled in trials included in the analysis (i.e. no potential reporting bias)?e | Yes | Yes | No (↓) | Yes | No (↓) | No (↓) | ||
| Were data reported consistently for the outcome of interest (i.e. no potential selective reporting)? | Yes | Yes | Yes | Yes | Yes | Yes | ||
| No other biases reported (i.e. no potential of other bias)? | Unclear | Unclear | Unclear | Unclear | Unclear | Unclear | ||
| Did the trials end up as scheduled (i.e. not stopped early)? | Yes | Yes | Yes | Yes | Yes | Yes | ||
| Inconsistencyb | Point estimates did not vary widely? | Yes | Yes | Yes | N/A | Yes | N/A | |
| To what extent did confidence intervals overlap (substantial: all confidence intervals overlap at least one of the included studies point estimate; some: confidence intervals overlap but not all overlap at least one point estimate; no: at least one outlier: where the confidence interval of some of the studies do not overlap with those of most included studies)? | Substantial | Substantial | Substantial | N/A | Substantial | N/A | ||
| Was the direction of effect consistent? | Yes | Yes | No (↓) | N/A | Yes | N/A | ||
| What was the magnitude of statistical heterogeneity (as measured by I²) ‐ low (I² < 40%), moderate (I² 40%‐60%), high I² > 60%)? | Low | Low | Low | N/A | Low | N/A | ||
| Was the test for heterogeneity statistically significant (P < 0.1)? | Not statistically significant | Not statistically significant | Not statistically significant | N/A | Not statistically significant | N/A | ||
| Indirectness | Were the populations in included studies applicable to the decision context? | Highly applicable | Highly applicable | Highly applicable | Highly applicable | Highly applicable | Highly applicable | |
| Were the interventions in the included studies applicable to the decision context? | Highly applicable | Highly applicable | Highly applicable | Highly applicable | Highly applicable | Highly applicable | ||
| Was the included outcome not a surrogate outcome? | Yes | Yes | Yes | Yes | Yes | Yes | ||
| Was the outcome timeframe sufficient? | Sufficient | Sufficient | Sufficient | Sufficient | Sufficient | Sufficient | ||
| Were the conclusions based on direct comparisons? | Yes | Yes | Yes | Yes | Yes | Yes | ||
| Imprecisionc | Was the confidence interval for the (pooled) estimate not consistent with benefit and harm? | No (↓) | No (↓) | No (↓) | No (↓) | No (↓) | N/A | |
| What is the magnitude of the median sample size (high: 300 participants, intermediate: 100‐300 participants, low: < 100 participants)?e | High | High | High | High | High | Low (↓) | ||
| What was the magnitude of the number of included studies (large: > 10 studies, moderate: 5‐10 studies, small: < 5 studies)?e | Small (↓) | Small (↓) | Small (↓) | Small (↓) | Small (↓) | Small (↓) | ||
| Was the outcome a common event (e.g. occurs > 1/100)? | Yes | Yes | Yes | Yes | Yes | No (↓) | ||
| Publication biasd | Was a comprehensive search conducted? | Yes | Yes | Yes | Yes | Yes | Yes | |
| Was grey literature searched? | Yes | Yes | Yes | Yes | Yes | Yes | ||
| Were no restrictions applied to study selection on the basis of language? | Yes | Yes | Yes | Yes | Yes | Yes | ||
| There was no industry influence on studies included in the review? | Unclear | Unclear | Unclear | Yes | Unclear | Yes | ||
| There was no evidence of funnel plot asymmetry? | N/A | N/A | N/A | N/A | N/A | N/A | ||
| There was no discrepancy in findings between published and unpublished trials? | N/A | N/A | N/A | N/A | N/A | N/A | ||
|
aQuestions on risk of bias are answered in relation to the majority of the aggregated evidence in the meta‐analysis rather than to individual trials.
bQuestions on inconsistency are primarily based on visual assessment of forest plots and the statistical quantification of heterogeneity based on I². cWhen judging the width of the confidence interval it is recommended to use a clinical decision threshold to assess whether the imprecision is clinically meaningful. dQuestions address comprehensiveness of the search strategy, industry influence, funnel plot asymmetry and discrepancies between published and unpublished trials. eDepends on the context of the systematic review area. (↓): key item for potential downgrading the quality of the evidence (GRADE) as shown in the footnotes of the 'Summary of finding' table(s); GRADE: Grading of Recommendations Assessment, Development and Evaluation; N/A: not applicable | ||||||||
Appendix 21. Checklist to aid consistency and reproducibility of GRADE assessments: metformin plus sulphonylurea compared with metformin plus glinide
| (1) All‐cause mortality | (2) Cardiovascular mortality | (3) Serious adverse events | (4) Non‐fatal stroke | (5) Non‐fatal myocardial infarction | (6) Microvascular complications (end‐stage renal disease, blindness or severe vision loss, amputation of lower extremity) | (7) Health‐related quality of life | ||
| Trial limitations (risk of bias)a | Was random sequence generation used (i.e. no potential for selection bias)? | Yes | Yes | Unclear | Yes | Yes | Yes | Not reported |
| Was allocation concealment used (i.e. no potential for selection bias)? | Yes | Yes | Unclear | Yes | Yes | Yes | ||
| Was there blinding of participants and personnel (i.e. no potential for performance bias) or outcome not likely to be influenced by lack of blinding? | Yes | Yes | Yes | Yes | Yes | Yes | ||
| Was there blinding of outcome assessment (i.e. no potential for detection bias) or was outcome measurement not likely to be influenced by lack of blinding? | Yes | Yes | Yes | Yes | Yes | Yes | ||
| Was an objective outcome used? | Yes | Yes | Yes | Yes | Yes | Yes | ||
| Were > 80% of participants enrolled in trials included in the analysis (i.e. no potential reporting bias)?e | Yes | Yes | Unclear | Unclear | Unclear | Unclear | ||
| Were data reported consistently for the outcome of interest (i.e. no potential selective reporting)? | Yes | Unclear | Unclear | Unclear | Unclear | Unclear | ||
| No other biases reported (i.e. no potential of other bias)? | Unclear | Unclear | Unclear | Unclear | Unclear | Unclear | ||
| Did the trials end up as scheduled (i.e. not stopped early)? | Yes | Yes | Yes | Yes | Yes | Yes | ||
| Inconsistencyb | Point estimates did not vary widely? | N/A | N/A | Yes | N/A | N/A | N/A | |
| To what extent did confidence intervals overlap (substantial: all confidence intervals overlap at least one of the included studies point estimate; some: confidence intervals overlap but not all overlap at least one point estimate; no: at least one outlier: where the confidence interval of some of the studies do not overlap with those of most included studies)? | N/A | N/A | Substantial | N/A | N/A | N/A | ||
| Was the direction of effect consistent? | N/A | N/A | Yes | N/A | N/A | N/A | ||
| What was the magnitude of statistical heterogeneity (as measured by I²) ‐ low (I² < 40%), moderate (I² 40%‐60%), high I² > 60%)? | N/A | N/A | Moderate | N/A | N/A | N/A | ||
| Was the test for heterogeneity statistically significant (P < 0.1)? | N/A | N/A | Not statistically significant | N/A | N/A | N/A | ||
| Indirectness | Were the populations in included studies applicable to the decision context? | Highly applicable | Highly applicable | Highly applicable | Highly applicable | Highly applicable | Highly applicable | |
| Were the interventions in the included studies applicable to the decision context? | Highly applicable | Highly applicable | Highly applicable | Highly applicable | Highly applicable | Highly applicable | ||
| Was the included outcome not a surrogate outcome? | Yes | Yes | Yes | Yes | Yes | Yes | ||
| Was the outcome timeframe sufficient? | Sufficient | Sufficient | Sufficient | Sufficient | Sufficient | Sufficient | ||
| Were the conclusions based on direct comparisons? | Yes | Yes | Yes | Yes | Yes | Yes | ||
| Imprecisionc | Was the confidence interval for the (pooled) estimate not consistent with benefit and harm? | No (↓) | N/A | No (↓) | N/A | N/A | N/A | |
| What is the magnitude of the median sample size (high: 300 participants, intermediate: 100‐300 participants, low: < 100 participants)?e | Intermediate | Intermediate | Intermediate | Intermediate | Intermediate | Intermediate | ||
| What was the magnitude of the number of included studies (large: > 10 studies, moderate: 5‐10 studies, small: < 5 studies)?e | Small (↓) | Small (↓) | Small (↓) | Small (↓) | Small (↓) | Small (↓) | ||
| Was the outcome a common event (e.g. occurs > 1/100)? | No (↓) | No (↓) | Yes | No (↓) | No (↓) | No (↓) | ||
| Publication biasd | Was a comprehensive search conducted? | Yes | Yes | Yes | Yes | Yes | Yes | |
| Was grey literature searched? | Yes | Yes | Yes | Yes | Yes | Yes | ||
| Were no restrictions applied to study selection on the basis of language? | Yes | Yes | Yes | Yes | Yes | Yes | ||
| There was no industry influence on studies included in the review? | Unclear | Unclear | Unclear | Unclear | Unclear | Unclear | ||
| There was no evidence of funnel plot asymmetry? | N/A | N/A | N/A | N/A | N/A | N/A | ||
| There was no discrepancy in findings between published and unpublished trials? | N/A | N/A | N/A | N/A | N/A | N/A | ||
|
aQuestions on risk of bias are answered in relation to the majority of the aggregated evidence in the meta‐analysis rather than to individual trials.
bQuestions on inconsistency are primarily based on visual assessment of forest plots and the statistical quantification of heterogeneity based on I². cWhen judging the width of the confidence interval it is recommended to use a clinical decision threshold to assess whether the imprecision is clinically meaningful. dQuestions address comprehensiveness of the search strategy, industry influence, funnel plot asymmetry and discrepancies between published and unpublished trials. eDepends on the context of the systematic review area. (↓): key item for potential downgrading the quality of the evidence (GRADE) as shown in the footnotes of the 'Summary of finding' table(s); GRADE: Grading of Recommendations Assessment, Development and Evaluation; N/A: not applicable | ||||||||
Appendix 22. Checklist to aid consistency and reproducibility of GRADE assessments: metformin plus sulphonylurea compared with metformin plus SGLT‐2 inhibitor
| (1) All‐cause mortality | (2) Cardiovascular mortality | (3) Serious adverse events | (4) Non‐fatal stroke | (5) Non‐fatal myocardial infarction | (6) Microvascular complications (end‐stage renal disease, blindness or severe vision loss, amputation of lower extremity) | (7) Health‐related quality of life | ||
| Trial limitations (risk of bias)a | Was random sequence generation used (i.e. no potential for selection bias)? | Yes | Yes | Yes | Yes | Yes | Yes | Not reported |
| Was allocation concealment used (i.e. no potential for selection bias)? | Yes | Yes | Yes | Yes | Yes | Yes | ||
| Was there blinding of participants and personnel (i.e. no potential for performance bias) or outcome not likely to be influenced by lack of blinding? | Yes | Yes | Yes | Yes | Yes | Yes | ||
| Was there blinding of outcome assessment (i.e. no potential for detection bias) or was outcome measurement not likely to be influenced by lack of blinding? | Yes | Yes | Yes | Yes | Yes | Yes | ||
| Was an objective outcome used? | Yes | Yes | Yes | Yes | Yes | Yes | ||
| Were > 80% of participants enrolled in trials included in the analysis (i.e. no potential reporting bias)?e | Yes | Yes | No (↓) | No (↓) | No (↓) | Unclear | ||
| Were data reported consistently for the outcome of interest (i.e. no potential selective reporting)? | Yes | Yes | Yes | Yes | Yes | Yes | ||
| No other biases reported (i.e. no potential of other bias)? | Unclear | Unclear | Unclear | Unclear | Unclear | Unclear | ||
| Did the trials end up as scheduled (i.e. not stopped early)? | Yes | Yes | Yes | Yes | Yes | Yes | ||
| Inconsistencyb | Point estimates did not vary widely? | No (↓) | No (↓) | No (↓) | Yes | Yes | N/A | |
| To what extent did confidence intervals overlap (substantial: all confidence intervals overlap at least one of the included studies point estimate; some: confidence intervals overlap but not all overlap at least one point estimate; no: at least one outlier: where the confidence interval of some of the studies do not overlap with those of most included studies)? | Some | Substantial | Some | Substantial | Yes | N/A | ||
| Was the direction of effect consistent? | No (↓) | No (↓) | No (↓) | Yes | Yes | N/A | ||
| What was the magnitude of statistical heterogeneity (as measured by I²) ‐ low (I² < 40%), moderate (I² 40%‐60%), high I² > 60%)? | Low | Low | High (↓) | Low | Low | N/A | ||
| Was the test for heterogeneity statistically significant (P < 0.1)? | Not statistically significant | Not statistically significant | Statistically significant (↓) | Not statistically significant | Not statistically significant | N/A | ||
| Indirectness | Were the populations in included studies applicable to the decision context? | Highly applicable | Highly applicable | Highly applicable | Highly applicable | Highly applicable | Highly applicable | |
| Were the interventions in the included studies applicable to the decision context? | Highly applicable | Highly applicable | Highly applicable | Highly applicable | Highly applicable | Highly applicable | ||
| Was the included outcome not a surrogate outcome? | Yes | Yes | Yes | Yes | Yes | Yes | ||
| Was the outcome timeframe sufficient? | Sufficient | Sufficient | Sufficient | Sufficient | Sufficient | Sufficient | ||
| Were the conclusions based on direct comparisons? | Yes | Yes | Yes | Yes | Yes | Yes | ||
| Imprecisionc | Was the confidence interval for the (pooled) estimate not consistent with benefit and harm? | No (↓) | No (↓) | No (↓) | No (↓) | No (↓) | No (↓) | |
| What is the magnitude of the median sample size (high: 300 participants, intermediate: 100‐300 participants, low: < 100 participants)?e | High | High | High | High | High | High | ||
| What was the magnitude of the number of included studies (large: > 10 studies, moderate: 5‐10 studies, small: < 5 studies)?e | Small (↓) | Small (↓) | Small (↓) | Small (↓) | Small (↓) | Small (↓) | ||
| Was the outcome a common event (e.g. occurs > 1/100)? | No (↓) | No (↓) | Yes | No (↓) | No (↓) | No (↓) | ||
| Publication biasd | Was a comprehensive search conducted? | Yes | Yes | Yes | Yes | Yes | Yes | |
| Was grey literature searched? | Yes | Yes | Yes | Yes | Yes | Yes | ||
| Were no restrictions applied to study selection on the basis of language? | Yes | Yes | Yes | Yes | Yes | Yes | ||
| There was no industry influence on studies included in the review? | Unclear | Unclear | Unclear | Unclear | Unclear | Unclear | ||
| There was no evidence of funnel plot asymmetry? | N/A | N/A | N/A | N/A | N/A | N/A | ||
| There was no discrepancy in findings between published and unpublished trials? | N/A | N/A | N/A | N/A | N/A | N/A | ||
|
aQuestions on risk of bias are answered in relation to the majority of the aggregated evidence in the meta‐analysis rather than to individual trials.
bQuestions on inconsistency are primarily based on visual assessment of forest plots and the statistical quantification of heterogeneity based on I². cWhen judging the width of the confidence interval it is recommended to use a clinical decision threshold to assess whether the imprecision is clinically meaningful. dQuestions address comprehensiveness of the search strategy, industry influence, funnel plot asymmetry and discrepancies between published and unpublished trials. eDepends on the context of the systematic review area. (↓): key item for potential downgrading the quality of the evidence (GRADE) as shown in the footnotes of the 'Summary of finding' table(s); GRADE: Grading of Recommendations Assessment, Development and Evaluation; N/A: not applicable | ||||||||
Data and analyses
Comparison 1. Metformin plus sulphonylurea vs metformin plus placebo.
| Outcome or subgroup title | No. of studies | No. of participants | Statistical method | Effect size |
|---|---|---|---|---|
| 1 All‐cause mortality | 2 | Risk Ratio (M‐H, Fixed, 95% CI) | Subtotals only | |
| 2 Serious adverse events | 2 | 771 | Risk Ratio (M‐H, Random, 95% CI) | 0.97 [0.59, 1.61] |
| 3 Cardiovascular mortality | 2 | Risk Ratio (M‐H, Fixed, 95% CI) | Subtotals only | |
| 4 Non‐fatal myocardial infarction | 2 | 771 | Risk Ratio (M‐H, Random, 95% CI) | 0.63 [0.08, 5.10] |
| 5 Heart failure | 2 | Risk Ratio (M‐H, Fixed, 95% CI) | Subtotals only | |
| 6 Non‐serious adverse events | 2 | 771 | Risk Ratio (M‐H, Random, 95% CI) | 1.25 [0.96, 1.64] |
| 7 Mild/moderate hypoglycaemia | 2 | 771 | Risk Ratio (M‐H, Random, 95% CI) | 3.93 [0.71, 21.88] |
| 8 Serious hypoglycaemia | 2 | Risk Ratio (M‐H, Random, 95% CI) | Subtotals only | |
| 9 Weight change | 2 | 476 | Mean Difference (IV, Random, 95% CI) | 3.37 [1.35, 5.39] |
| 10 Change in HbA1c | 2 | 472 | Mean Difference (IV, Random, 95% CI) | ‐0.47 [‐1.07, 0.14] |
Comparison 2. Metformin plus sulphonylurea vs metformin plus GLP‐1 analogue.
| Outcome or subgroup title | No. of studies | No. of participants | Statistical method | Effect size |
|---|---|---|---|---|
| 1 All‐cause mortality | 3 | 2594 | Risk Ratio (M‐H, Random, 95% CI) | 1.15 [0.49, 2.67] |
| 2 Serious adverse events | 3 | 2594 | Risk Ratio (M‐H, Random, 95% CI) | 0.90 [0.73, 1.11] |
| 3 Cardiovascular mortality | 1 | Risk Ratio (M‐H, Fixed, 95% CI) | Totals not selected | |
| 4 Non‐fatal myocardial infarction | 2 | 1575 | Risk Ratio (M‐H, Random, 95% CI) | 0.57 [0.12, 2.82] |
| 5 Heart failure | 3 | 2594 | Risk Ratio (M‐H, Random, 95% CI) | 0.54 [0.10, 2.77] |
| 6 End‐stage renal disease | 1 | Risk Ratio (M‐H, Fixed, 95% CI) | Totals not selected | |
| 7 Non‐serious adverse events | 3 | Risk Ratio (M‐H, Random, 95% CI) | Totals not selected | |
| 8 Mild/moderate hypoglycaemia | 3 | 2594 | Risk Ratio (M‐H, Random, 95% CI) | 3.24 [2.05, 5.13] |
| 9 Serious hypoglycaemia | 3 | 2594 | Risk Ratio (M‐H, Random, 95% CI) | 1.00 [0.16, 6.30] |
| 10 Weight (change) | 5 | 1777 | Mean Difference (IV, Random, 95% CI) | 5.54 [3.62, 7.46] |
| 11 Change in HbA1c | 5 | 2346 | Mean Difference (IV, Random, 95% CI) | 0.01 [‐0.15, 0.17] |
Comparison 3. Metformin plus sulphonylurea vs metformin plus DPP‐4 inhibitor.
| Outcome or subgroup title | No. of studies | No. of participants | Statistical method | Effect size |
|---|---|---|---|---|
| 1 All‐cause mortality | 9 | 11694 | Risk Ratio (M‐H, Random, 95% CI) | 1.32 [0.76, 2.28] |
| 1.1 Trials with long duration (≥ 2 years) | 6 | 9909 | Risk Ratio (M‐H, Random, 95% CI) | 1.38 [0.72, 2.64] |
| 1.2 Trials with short duration (< 2 years) | 3 | 1785 | Risk Ratio (M‐H, Random, 95% CI) | 1.02 [0.14, 7.20] |
| 2 Serious adverse events | 9 | 11694 | Risk Ratio (M‐H, Random, 95% CI) | 1.07 [0.97, 1.18] |
| 2.1 Trials with long duration (≥ 2 years) | 6 | 9909 | Risk Ratio (M‐H, Random, 95% CI) | 1.08 [0.97, 1.19] |
| 2.2 Trials with short duration (< 2 years) | 3 | 1785 | Risk Ratio (M‐H, Random, 95% CI) | 1.01 [0.61, 1.68] |
| 3 Cardiovascular mortality | 6 | 6874 | Risk Ratio (M‐H, Random, 95% CI) | 1.54 [0.63, 3.79] |
| 3.1 Trials with long duration (≥ 2 years) | 5 | 6810 | Risk Ratio (M‐H, Random, 95% CI) | 1.54 [0.63, 3.79] |
| 3.2 Trials with short duration (< 2 years) | 1 | 64 | Risk Ratio (M‐H, Random, 95% CI) | 0.0 [0.0, 0.0] |
| 4 Non‐fatal myocardial infarction | 6 | 6874 | Risk Ratio (M‐H, Random, 95% CI) | 1.45 [0.69, 3.07] |
| 4.1 Trials with long duration (≥ 2 years) | 5 | 6810 | Risk Ratio (M‐H, Random, 95% CI) | 1.45 [0.69, 3.07] |
| 4.2 Trials with short duration (< 2 years) | 1 | 64 | Risk Ratio (M‐H, Random, 95% CI) | 0.0 [0.0, 0.0] |
| 5 Heart failure | 8 | 10691 | Risk Ratio (M‐H, Random, 95% CI) | 1.05 [0.47, 2.34] |
| 5.1 Trials with long duration (≥ 2 years) | 6 | 9909 | Risk Ratio (M‐H, Random, 95% CI) | 0.78 [0.33, 1.86] |
| 5.2 Trials with short duration (< 2 years) | 2 | 782 | Risk Ratio (M‐H, Random, 95% CI) | 6.00 [0.73, 49.59] |
| 6 Non‐fatal stroke | 4 | 5093 | Risk Ratio (M‐H, Random, 95% CI) | 2.21 [0.74, 6.58] |
| 6.1 Trials with long duration (≥ 2 years) | 3 | 5029 | Risk Ratio (M‐H, Random, 95% CI) | 2.21 [0.74, 6.58] |
| 6.2 Trials with short duration (< 2 years) | 1 | 64 | Risk Ratio (M‐H, Random, 95% CI) | 0.0 [0.0, 0.0] |
| 7 Non‐serious adverse events | 7 | 7592 | Risk Ratio (M‐H, Random, 95% CI) | 1.18 [1.03, 1.35] |
| 7.1 Trials with long duration (≥ 2 years) | 5 | 6810 | Risk Ratio (M‐H, Random, 95% CI) | 1.21 [1.04, 1.42] |
| 7.2 Trials with short duration (< 2 years) | 2 | 782 | Risk Ratio (M‐H, Random, 95% CI) | 0.99 [0.82, 1.21] |
| 8 Mild/moderate hypoglycaemia | 7 | 9973 | Risk Ratio (M‐H, Random, 95% CI) | 7.42 [4.77, 11.53] |
| 8.1 Trials with long duration (≥ 2 years) | 5 | 9051 | Risk Ratio (M‐H, Random, 95% CI) | 6.67 [4.32, 10.28] |
| 8.2 Trials with short duration (< 2 years) | 2 | 922 | Risk Ratio (M‐H, Random, 95% CI) | 39.09 [7.69, 198.82] |
| 9 Serious hypoglycaemia | 8 | 10691 | Risk Ratio (M‐H, Random, 95% CI) | 8.04 [3.31, 19.53] |
| 9.1 Trials with long duration (≥ 2 years) | 5 | 9051 | Risk Ratio (M‐H, Random, 95% CI) | 8.66 [3.10, 24.16] |
| 9.2 Trials with short duration (< 2 years) | 3 | 1640 | Risk Ratio (M‐H, Random, 95% CI) | 6.46 [1.10, 37.85] |
| 10 Weight change (kg) | 9 | 10228 | Mean Difference (IV, Random, 95% CI) | 2.15 [1.71, 2.58] |
| 10.1 Trials with long duration (≥ 2 years) | 6 | 8667 | Mean Difference (IV, Random, 95% CI) | 2.25 [1.71, 2.78] |
| 10.2 Trials with short duration (< 2 years) | 3 | 1561 | Mean Difference (IV, Random, 95% CI) | 1.78 [1.27, 2.30] |
| 11 Change in HbA1c | 9 | 9320 | Mean Difference (IV, Random, 95% CI) | ‐0.05 [‐0.13, 0.03] |
| 11.1 Trials with long duration (≥ 2 years) | 6 | 7779 | Mean Difference (IV, Random, 95% CI) | ‐0.03 [‐0.14, 0.07] |
| 11.2 Trials with short duration (< 2 years) | 3 | 1541 | Mean Difference (IV, Random, 95% CI) | ‐0.09 [‐0.25, 0.07] |
| 12 Fasting plasma glucose | 1 | Mean Difference (IV, Fixed, 95% CI) | Totals not selected | |
| 13 BMI | 1 | Mean Difference (IV, Fixed, 95% CI) | Totals not selected |
3.12. Analysis.
Comparison 3 Metformin plus sulphonylurea vs metformin plus DPP‐4 inhibitor, Outcome 12 Fasting plasma glucose.
3.13. Analysis.
Comparison 3 Metformin plus sulphonylurea vs metformin plus DPP‐4 inhibitor, Outcome 13 BMI.
Comparison 4. Metformin plus sulphonylurea vs metformin plus long‐acting DPP‐4 inhibitor.
| Outcome or subgroup title | No. of studies | No. of participants | Statistical method | Effect size |
|---|---|---|---|---|
| 1 All‐cause mortality | 1 | Risk Ratio (M‐H, Fixed, 95% CI) | Totals not selected | |
| 2 Serious adverse events | 1 | Risk Ratio (M‐H, Fixed, 95% CI) | Totals not selected | |
| 3 Cardiovascular mortality | 1 | Risk Ratio (M‐H, Fixed, 95% CI) | Totals not selected | |
| 4 Non‐fatal myocardial infarction | 1 | Risk Ratio (M‐H, Fixed, 95% CI) | Totals not selected | |
| 5 Non‐serious adverse events | 1 | Risk Ratio (M‐H, Fixed, 95% CI) | Totals not selected | |
| 6 Mild/moderate hypoglycaemia | 1 | Risk Ratio (M‐H, Fixed, 95% CI) | Totals not selected | |
| 7 Serious hypoglycaemia | 1 | Risk Ratio (M‐H, Fixed, 95% CI) | Totals not selected | |
| 8 Weight change (kg) | 1 | Mean Difference (IV, Fixed, 95% CI) | Totals not selected | |
| 9 Change in HbA1c (%) | 1 | Mean Difference (IV, Fixed, 95% CI) | Totals not selected |
Comparison 5. Metformin plus sulphonylurea vs metformin plus thiazolidinedione.
| Outcome or subgroup title | No. of studies | No. of participants | Statistical method | Effect size |
|---|---|---|---|---|
| 1 All‐cause mortality | 6 | 6654 | Risk Ratio (M‐H, Random, 95% CI) | 1.09 [0.85, 1.40] |
| 1.1 Rosiglitazone | 4 | 2996 | Risk Ratio (M‐H, Random, 95% CI) | 1.20 [0.86, 1.68] |
| 1.2 Pioglitazone | 2 | 3658 | Risk Ratio (M‐H, Random, 95% CI) | 1.09 [0.42, 2.80] |
| 2 Serious adverse events | 6 | 6654 | Risk Ratio (M‐H, Random, 95% CI) | 1.01 [0.93, 1.11] |
| 2.1 Rosiglitazone | 4 | 2996 | Risk Ratio (M‐H, Random, 95% CI) | 1.02 [0.81, 1.29] |
| 2.2 Pioglitazone | 2 | 3658 | Risk Ratio (M‐H, Random, 95% CI) | 0.99 [0.83, 1.18] |
| 3 Cardiovascular mortality | 4 | 5940 | Risk Ratio (M‐H, Random, 95% CI) | 0.78 [0.36, 1.67] |
| 3.1 Rosiglitazone | 3 | 2912 | Risk Ratio (M‐H, Random, 95% CI) | 0.91 [0.30, 2.72] |
| 3.2 Pioglitazone | 1 | 3028 | Risk Ratio (M‐H, Random, 95% CI) | 0.46 [0.14, 1.48] |
| 4 Non‐fatal myocardial infarction | 3 | 3718 | Risk Ratio (M‐H, Random, 95% CI) | 1.21 [0.68, 2.14] |
| 4.1 Rosiglitazone | 2 | 690 | Risk Ratio (M‐H, Random, 95% CI) | 2.93 [0.12, 71.65] |
| 4.2 Pioglitazone | 1 | 3028 | Risk Ratio (M‐H, Random, 95% CI) | 1.18 [0.66, 2.10] |
| 5 Heart failure | 5 | 6570 | Risk Ratio (M‐H, Random, 95% CI) | 0.67 [0.43, 1.04] |
| 5.1 Rosiglitazone | 3 | 2912 | Risk Ratio (M‐H, Random, 95% CI) | 0.74 [0.41, 1.33] |
| 5.2 Pioglitazone | 2 | 3658 | Risk Ratio (M‐H, Random, 95% CI) | 0.60 [0.31, 1.16] |
| 6 Non‐fatal stroke | 2 | 3123 | Risk Ratio (M‐H, Random, 95% CI) | 1.29 [0.67, 2.47] |
| 6.1 Rosiglitazone | 1 | 95 | Risk Ratio (M‐H, Random, 95% CI) | 0.0 [0.0, 0.0] |
| 6.2 Pioglitazone | 1 | 3028 | Risk Ratio (M‐H, Random, 95% CI) | 1.29 [0.67, 2.47] |
| 7 Amputation of lower extremity | 2 | 3123 | Risk Ratio (M‐H, Random, 95% CI) | 0.0 [0.0, 0.0] |
| 7.1 Rosiglitazone | 1 | 95 | Risk Ratio (M‐H, Random, 95% CI) | 0.0 [0.0, 0.0] |
| 7.2 Pioglitazone | 1 | 3028 | Risk Ratio (M‐H, Random, 95% CI) | 0.0 [0.0, 0.0] |
| 8 Blindness or severe vision loss | 1 | Risk Ratio (M‐H, Fixed, 95% CI) | Totals not selected | |
| 9 End‐stage renal disease | 1 | Risk Ratio (M‐H, Fixed, 95% CI) | Totals not selected | |
| 10 Non‐serious adverse events | 5 | 6024 | Risk Ratio (M‐H, Random, 95% CI) | 0.94 [0.44, 2.01] |
| 10.1 Rosiglitazone | 4 | 2996 | Risk Ratio (M‐H, Random, 95% CI) | 1.00 [0.92, 1.08] |
| 10.2 Pioglitazone | 1 | 3028 | Risk Ratio (M‐H, Random, 95% CI) | 0.93 [0.82, 1.05] |
| 11 Mild/moderate hypoglycaemia | 5 | 6059 | Risk Ratio (M‐H, Random, 95% CI) | 3.63 [2.98, 4.44] |
| 11.1 Rosiglitazone | 3 | 2401 | Risk Ratio (M‐H, Random, 95% CI) | 3.76 [2.81, 5.02] |
| 11.2 Pioglitazone | 2 | 3658 | Risk Ratio (M‐H, Random, 95% CI) | 4.78 [1.93, 11.87] |
| 12 Serious hypoglycaemia | 5 | 6570 | Risk Ratio (M‐H, Random, 95% CI) | 3.98 [0.34, 46.01] |
| 12.1 Rosiglitazone | 3 | 2912 | Risk Ratio (M‐H, Random, 95% CI) | 1.16 [0.37, 3.68] |
| 12.2 Pioglitazone | 2 | 3658 | Risk Ratio (M‐H, Random, 95% CI) | 24.68 [3.34, 182.16] |
| 13 Weight (change) | 7 | 6877 | Mean Difference (IV, Random, 95% CI) | ‐0.55 [‐2.75, 1.64] |
| 13.1 Rosiglitazone | 3 | 2865 | Mean Difference (IV, Random, 95% CI) | ‐0.96 [‐4.77, 2.86] |
| 13.2 Pioglitazone | 4 | 4012 | Mean Difference (IV, Random, 95% CI) | ‐0.44 [‐1.36, 0.47] |
| 14 Change in HbA1c | 10 | 7020 | Mean Difference (IV, Random, 95% CI) | 0.17 [0.04, 0.30] |
| 14.1 Rosiglitazone | 5 | 2940 | Mean Difference (IV, Random, 95% CI) | 0.20 [‐0.02, 0.42] |
| 14.2 Pioglitazone | 5 | 4080 | Mean Difference (IV, Random, 95% CI) | 0.15 [‐0.04, 0.34] |
Comparison 6. Metformin plus sulphonylurea vs metformin plus thiazolidinedione (subgroups duration of intervention).
| Outcome or subgroup title | No. of studies | No. of participants | Statistical method | Effect size |
|---|---|---|---|---|
| 1 All‐cause mortality | 6 | 6654 | Risk Ratio (M‐H, Random, 95% CI) | 1.09 [0.85, 1.40] |
| 1.1 Trials with long duration (≥ 2 years) | 4 | 5964 | Risk Ratio (M‐H, Random, 95% CI) | 1.09 [0.85, 1.40] |
| 1.2 Trials with short duration (< 2 years) | 2 | 690 | Risk Ratio (M‐H, Random, 95% CI) | 0.98 [0.14, 6.89] |
| 2 Serious adverse events | 6 | 6654 | Risk Ratio (M‐H, Random, 95% CI) | 1.01 [0.93, 1.11] |
| 2.1 Trials with long duration (≥ 2 years) | 4 | 5964 | Risk Ratio (M‐H, Random, 95% CI) | 1.02 [0.93, 1.11] |
| 2.2 Trials with short duration (< 2 years) | 2 | 690 | Risk Ratio (M‐H, Random, 95% CI) | 0.67 [0.32, 1.42] |
| 3 Cardiovascular mortality | 4 | 5940 | Risk Ratio (M‐H, Random, 95% CI) | 0.78 [0.36, 1.67] |
| 3.1 Trials with long duration (≥ 2 years) | 2 | 5250 | Risk Ratio (M‐H, Random, 95% CI) | 0.84 [0.38, 1.89] |
| 3.2 Trials with short duration (< 2 years) | 2 | 690 | Risk Ratio (M‐H, Random, 95% CI) | 0.20 [0.01, 4.05] |
| 4 Non‐fatal myocardial infarction | 3 | 3718 | Risk Ratio (M‐H, Random, 95% CI) | 1.21 [0.68, 2.14] |
| 4.1 Trials with long duration (≥ 2 years) | 1 | 3028 | Risk Ratio (M‐H, Random, 95% CI) | 1.18 [0.66, 2.10] |
| 4.2 Trials with short duration (< 2 years) | 2 | 690 | Risk Ratio (M‐H, Random, 95% CI) | 2.93 [0.12, 71.65] |
| 5 Heart failure | 5 | 6570 | Risk Ratio (M‐H, Random, 95% CI) | 0.67 [0.43, 1.04] |
| 5.1 Trials with long duration (≥ 2 years) | 3 | 5880 | Risk Ratio (M‐H, Random, 95% CI) | 0.67 [0.43, 1.04] |
| 5.2 Trials with short duration (< 2 years) | 2 | 690 | Risk Ratio (M‐H, Random, 95% CI) | 0.98 [0.06, 15.54] |
| 6 Non‐fatal stroke | 2 | Risk Ratio (M‐H, Random, 95% CI) | Totals not selected | |
| 6.1 Trials with long duration (≥ 2 years) | 1 | Risk Ratio (M‐H, Random, 95% CI) | 0.0 [0.0, 0.0] | |
| 6.2 Trials with short duration (< 2 years) | 1 | Risk Ratio (M‐H, Random, 95% CI) | 0.0 [0.0, 0.0] | |
| 7 Non‐serious adverse events | 5 | 6024 | Risk Ratio (M‐H, Random, 95% CI) | 0.94 [0.44, 2.01] |
| 7.1 Trials with long duration (≥ 2 years) | 3 | 5334 | Risk Ratio (M‐H, Random, 95% CI) | 0.97 [0.39, 2.42] |
| 7.2 Trials with short duration (< 2 years) | 2 | 690 | Risk Ratio (M‐H, Random, 95% CI) | 0.93 [0.48, 1.81] |
| 8 Mild/moderate hypoglycaemia | 5 | 6059 | Risk Ratio (M‐H, Random, 95% CI) | 3.63 [2.98, 4.44] |
| 8.1 Trials with long duration (≥ 2 years) | 4 | 5964 | Risk Ratio (M‐H, Random, 95% CI) | 3.73 [2.95, 4.72] |
| 8.2 Trials with short duration (< 2 years) | 1 | 95 | Risk Ratio (M‐H, Random, 95% CI) | 2.04 [0.39, 10.63] |
| 9 Serious hypoglycaemia | 5 | 6570 | Risk Ratio (M‐H, Random, 95% CI) | 3.98 [0.34, 46.01] |
| 9.1 Trials with long duration (≥ 2 years) | 3 | 5880 | Risk Ratio (M‐H, Random, 95% CI) | 4.61 [0.14, 149.68] |
| 9.2 Trials with short duration (< 2 years) | 2 | 690 | Risk Ratio (M‐H, Random, 95% CI) | 2.93 [0.12, 71.65] |
| 10 Weight change | 7 | 6877 | Mean Difference (IV, Random, 95% CI) | ‐0.55 [‐2.75, 1.64] |
| 10.1 Trials with long duration (≥ 2 years) | 3 | 5833 | Mean Difference (IV, Random, 95% CI) | ‐1.49 [‐4.79, 1.81] |
| 10.2 Trials with short duration (< 2 years) | 4 | 1044 | Mean Difference (IV, Random, 95% CI) | 0.20 [‐2.15, 2.56] |
| 11 Change in HbA1c | 10 | 7020 | Mean Difference (IV, Random, 95% CI) | 0.17 [0.04, 0.30] |
| 11.1 Trials with long duration (≥ 2 years) | 4 | 5896 | Mean Difference (IV, Random, 95% CI) | 0.17 [‐0.04, 0.39] |
| 11.2 Trials with short duration (< 2 years) | 6 | 1124 | Mean Difference (IV, Random, 95% CI) | 0.17 [‐0.02, 0.37] |
6.10. Analysis.
Comparison 6 Metformin plus sulphonylurea vs metformin plus thiazolidinedione (subgroups duration of intervention), Outcome 10 Weight change.
Comparison 7. Metformin plus sulphonylurea vs metformin plus glinide.
| Outcome or subgroup title | No. of studies | No. of participants | Statistical method | Effect size |
|---|---|---|---|---|
| 1 All‐cause mortality | 3 | Risk Ratio (M‐H, Fixed, 95% CI) | Totals not selected | |
| 2 Serious adverse events | 3 | 874 | Risk Ratio (M‐H, Random, 95% CI) | 1.68 [0.54, 5.21] |
| 3 Cardiovascular mortality | 2 | 446 | Risk Ratio (M‐H, Fixed, 95% CI) | 0.0 [0.0, 0.0] |
| 4 Mild/moderate hypoglycaemia | 1 | Risk Ratio (M‐H, Fixed, 95% CI) | Totals not selected | |
| 5 Serious hypoglycaemia | 2 | Risk Ratio (M‐H, Fixed, 95% CI) | Totals not selected | |
| 6 Weight change | 2 | 619 | Mean Difference (IV, Fixed, 95% CI) | 1.11 [‐0.06, 2.29] |
| 7 Change in HbA1c | 3 | 852 | Mean Difference (IV, Random, 95% CI) | 0.16 [‐0.64, 0.96] |
Comparison 8. Metformin plus sulphonylurea vs metformin plus SGLT‐2 inhibitor.
| Outcome or subgroup title | No. of studies | No. of participants | Statistical method | Effect size |
|---|---|---|---|---|
| 1 All‐cause mortality | 4 | 5134 | Risk Ratio (M‐H, Random, 95% CI) | 0.96 [0.44, 2.09] |
| 2 Serious adverse events | 4 | 5134 | Risk Ratio (M‐H, Random, 95% CI) | 1.02 [0.76, 1.37] |
| 3 Cardiovascular mortality | 3 | 3589 | Risk Ratio (M‐H, Random, 95% CI) | 1.22 [0.33, 4.41] |
| 4 Non‐fatal myocardial infarction | 2 | 2264 | Risk Ratio (M‐H, Random, 95% CI) | 1.43 [0.49, 4.18] |
| 5 Heart failure | 3 | 3809 | Peto Odds Ratio (Peto, Fixed, 95% CI) | 9.21 [1.26, 67.24] |
| 6 Non‐fatal stroke | 2 | 2775 | Risk Ratio (M‐H, Random, 95% CI) | 0.87 [0.22, 3.34] |
| 7 Amputation of lower extremity | 1 | Risk Ratio (M‐H, Fixed, 95% CI) | Totals not selected | |
| 8 Non‐serious adverse events | 3 | 3809 | Risk Ratio (M‐H, Random, 95% CI) | 1.27 [1.01, 1.59] |
| 9 Mild/moderate hypoglycaemia | 3 | 3309 | Risk Ratio (M‐H, Random, 95% CI) | 5.60 [2.38, 13.14] |
| 10 Serious hypoglycaemia | 4 | 5134 | Risk Ratio (M‐H, Random, 95% CI) | 6.16 [2.92, 12.97] |
| 11 Weight change | 3 | 3294 | Mean Difference (IV, Random, 95% CI) | 4.41 [4.05, 4.77] |
| 12 Change in HbA1c | 4 | 4182 | Mean Difference (IV, Random, 95% CI) | 0.09 [‐0.07, 0.24] |
Characteristics of studies
Characteristics of included studies [ordered by study ID]
Ahrén 2014.
| Methods |
Study design: randomised, double‐blind, placebo‐ and active‐controlled parallel‐group study Randomisation ratio: eligible participants were stratified by HbA1c level (< 8.0% versus ≥ 8.0%), history of MI, and age (< 65 versus ≥ 65 years) and were randomly assigned (3:3:3:1) to receive, in addition to metformin, 1 of 4 treatments at baseline: albiglutide 30 mg, sitagliptin 100 mg, glimepiride 2 mg or placebo Non‐inferiority and superiority design: the planned sample size provided >90% power to demonstrate superiority versus placebo and non‐inferiority versus sitagliptin and glimepiride (non‐inferiority margin = 0.3%). Superiority of albiglutide versus sitagliptin and glimepiride was tested if non‐inferiority was established |
|
| Participants |
Inclusion criteria: ≥ 18 years of age, T2DM, inadequate glycaemic control while taking background metformin (≥ 1500 mg or MTD) ≥ 3 months before screening. Baseline HbA1c of 7.0% (53.0 mmol/mol)‐10.0% (85.8 mmol/mol); BMI 20‐45 kg/m²; creatinine clearance > 60 mL/min; normal TSH or were clinically euthyroid Exclusion criteria: current ongoing symptomatic biliary disease or history of pancreatitis, recent clinically significant cardiovascular and/or cerebrovascular disease (≤ 2 months before screening), treated gastroparesis, history of gastrointestinal surgery thought to significantly affect upper gastrointestinal function, history of most cancers not in remission for at least 3 years, personal or family history of medullary thyroid carcinoma or multiple endocrine neoplasia type 2, resting SBP > 160 mmHg and/or DBP > 100 mmHg, lipase above the ULN, haemoglobinopathy that could affect HbA1c, and ALT or AST more than 2.5 x ULN Diagnostic criteria: not reported |
|
| Interventions |
Number of study centres: 289 Run‐in period: 4 weeks Extension period: yes; all participants were assessed 8 weeks after the end of the intervention |
|
| Outcomes | Composite outcome measures reported: no | |
| Study details |
Trial terminated early: no Trial ID:NCT00838903 |
|
| Publication details |
Language of publication: English Funding: commercial funding, GlaxoSmithKline (specify product): albiglutide Publication status: peer‐reviewed journal |
|
| Stated aim for study | Quote from publication: "To compare the efficacy and safety of weekly albiglutide with daily sitagliptin, daily glimepiride, and placebo" | |
| Notes | ‐ | |
| Risk of bias | ||
| Bias | Authors' judgement | Support for judgement |
| Random sequence generation (selection bias) | Unclear risk |
Quote from publication: "Eligible patients were ... randomly assigned..." "Demographics and baseline characteristics were similar among the ... treatment groups." Comment: insufficient information about the sequence generation process to permit judgement of 'low risk or 'high risk' |
| Allocation concealment (selection bias) | Unclear risk |
Quote from publication: "Eligible patients were ... randomly assigned..." "Demographics and baseline characteristics were similar among the ... treatment groups." Comment: insufficient information about the allocation concealment to permit judgement of 'low risk' or 'high risk' |
| Blinding of participants and personnel (performance bias) all‐cause/cardiovascular mortality | Low risk |
Quote from publication: "Double blind (subject, investigator)". "Matching placebos for albiglutide, sitagliptin, and glimepiride were used to maintain blinding to treatment." "Possible cardiovascular events were prospectively recorded and adjudicated by an independent clinical endpoint committee masked to treatment allocation" Comment: adjudicated/investigator‐assessed outcome measurement. Blinding of key study personnel ensured |
| Blinding of participants and personnel (performance bias) hypoglycaemia | Low risk |
Quote from publication: "Double blind (subject, investigator)". "Matching placebos for albiglutide, sitagliptin, and glimepiride were used to maintain blinding to treatment". Comment: investigator‐assessed or self‐reported outcome measurement. Blinding of participants and key study personnel ensured |
| Blinding of participants and personnel (performance bias) non‐fatal myocardial infarction/heart failure/non‐fatal stroke | Low risk |
Quote from publication: "Double blind (subject, investigator)." "Matching placebos for albiglutide, sitagliptin, and glimepiride were used to maintain blinding to treatment". "Possible cardiovascular events were prospectively recorded and adjudicated by an independent clinical endpoint committee masked to treatment allocation" Comment: adjudicated outcome measurement. Blinding of key study personnel ensured |
| Blinding of participants and personnel (performance bias) non‐serious adverse events | Low risk |
Quote from publication: "Double blind (subject, investigator)." "Matching placebos for albiglutide, sitagliptin, and glimepiride were used to maintain blinding to treatment". Comment: self‐reported outcome measurement. Blinding of participants ensured |
| Blinding of participants and personnel (performance bias) serious adverse events | Low risk |
Quote from publication: "Double blind (subject, investigator)." "Matching placebos for albiglutide, sitagliptin, and glimepiride were used to maintain blinding to treatment". "Possible cardiovascular events were prospectively recorded and adjudicated by an independent clinical endpoint committee masked to treatment allocation". "An independent, blinded pancreatitis adjudication committee comprising three gastro intestinal specialists adjudicated adverse events suggesting pancreatitis and all laboratory elevations of lipase and/or amylase more than or equal to three times the ULN. The pancreatitis adjudication committee adjudicated both the probability of events being pancreatitis (definite, probable, possible, not likely) and the likelihood of a relationship to the study drug (definite, probable, possible, unlikely alternate etiology)" Comment: adjudicated/investigator‐assessed outcome measurement. Blinding of key study personnel ensured |
| Blinding of participants and personnel (performance bias) weight (kg) | Low risk |
Quote from publication: "Double blind (subject, investigator)." "Matching placebos for albiglutide, sitagliptin, and glimepiride were used to maintain blinding to treatment" Comment: investigator‐assessed or self‐reported outcome measurement. Blinding of participants and key study personnel ensured |
| Blinding of participants and personnel (performance bias) HbA1c | Low risk |
Quote from publication: "Double blind (subject, investigator)." "Matching placebos for albiglutide, sitagliptin, and glimepiride were used to maintain blinding to treatment" Comment: investigator‐assessed outcome measurement. Blinding of key study personnel ensured |
| Blinding of outcome assessment (detection bias) all‐cause/cardiovascular mortality | Low risk |
Quote from publication: "Double blind (subject, investigator)". "Matching placebos for albiglutide, sitagliptin, and glimepiride were used to maintain blinding to treatment." "Possible cardiovascular events were prospectively recorded and adjudicated by an independent clinical endpoint committee masked to treatment allocation" Comment: adjudicated/investigator‐assessed outcome measurement. Blinding of key study personnel ensured |
| Blinding of outcome assessment (detection bias) hypoglycaemia | Low risk |
Quote from publication: "Double blind (subject, investigator)". "Matching placebos for albiglutide, sitagliptin, and glimepiride were used to maintain blinding to treatment" Comment: investigator‐assessed or self‐reported outcome measurement. Blinding of participants and key study personnel ensured |
| Blinding of outcome assessment (detection bias) non‐fatal myocardial infarction/heart failure/non‐fatal stroke | Low risk |
Quote from publication: "Double blind (subject, investigator)." "Matching placebos for albiglutide, sitagliptin, and glimepiride were used to maintain blinding to treatment". "Possible cardiovascular events were prospectively recorded and adjudicated by an independent clinical endpoint committee masked to treatment allocation" Comment: adjudicated outcome measurement. Blinding of key study personnel ensured |
| Blinding of outcome assessment (detection bias) non‐serious adverse events | Low risk |
Quote from publication: "Double blind (subject, investigator)." "Matching placebos for albiglutide, sitagliptin, and glimepiride were used to maintain blinding to treatment" Comment: self‐reported outcome measurement. Blinding of participants ensured |
| Blinding of outcome assessment (detection bias) serious adverse events | Low risk |
Quote from publication: "Double blind (subject, investigator)." "Matching placebos for albiglutide, sitagliptin, and glimepiride were used to maintain blinding to treatment". "Possible cardiovascular events were prospectively recorded and adjudicated by an independent clinical endpoint committee masked to treatment allocation". "An independent, blinded pancreatitis adjudication committee comprising three gastro intestinal specialists adjudicated adverse events suggesting pancreatitis and all laboratory elevations of lipase and/or amylase more than or equal to three times the ULN. The pancreatitis adjudication committee adjudicated both the probability of events being pancreatitis (definite, probable, possible, not likely) and the likelihood of a relationship to the study drug (definite, probable, possible, unlikely alternate etiology)" Comment: adjudicated/investigator‐assessed outcome measurement. Blinding of key study personnel ensured |
| Blinding of outcome assessment (detection bias) weight (kg) | Low risk |
Quote from publication: "Double blind (subject, investigator)." "Matching placebos for albiglutide, sitagliptin, and glimepiride were used to maintain blinding to treatment" Comment: investigator‐assessed or self‐reported outcome measurement. Blinding of participants and key study personnel ensured |
| Blinding of outcome assessment (detection bias) HbA1c | Low risk |
Quote from publication: "Double blind (subject, investigator)." "Matching placebos for albiglutide, sitagliptin, and glimepiride were used to maintain blinding to treatment" Comment: investigator‐assessed outcome measurement. Blinding of key study personnel ensured |
| Incomplete outcome data (attrition bias) all‐cause/cardiovascular mortality | Low risk |
Quote from publication: "SAEs and non‐serious AEs are reported for members of the Safety Population, comprised of all participants who received at least one dose of study treatment." Comment: > 95% of the randomised participants were included in the analyses. There was a high dropout rate (53%‐61% of the participants completed the study), however, the dropout rate was balanced between groups. We assumed that mortality status was searched in registers at the end of the trial. About 5% of the participants in each intervention group were lost to follow‐up. Not clarified how these missing data were imputed. The proportion of missingness is small and judged not to give raise to risk of attrition bias |
| Incomplete outcome data (attrition bias) hypoglycaemia | High risk |
Quote from publication: "SAEs and non‐serious AEs are reported for members of the Safety Population, comprised of all participants who received at least one dose of study treatment." Comment: > 95% of the participants in all treatment groups were included in the analyses. There was a high dropout rate (53%‐61% of the participants completed the study), however, the dropout rate was balanced between groups. We do not know how the trial authors imputed missing data from the participants not completing the study. The reasons for dropouts were balanced among the intervention groups. The proportion of missing outcomes compared with observed event risk enough to induce clinically relevant bias in intervention effect estimate |
| Incomplete outcome data (attrition bias) non‐fatal myocardial infarction/heart failure/non‐fatal stroke | High risk |
Quote from publication: "SAEs and non‐serious AEs are reported for members of the Safety Population, comprised of all participants who received at least one dose of study treatment." Comment: > 95% of the participants in all treatment groups were included in the analyses. There was a high dropout rate (53%‐61% of the participants completed the study), however, the dropout rate was balanced between groups. We do not know how the trial authors imputed missing data from the participants not completing the study. The reasons for dropouts were balanced among the intervention groups. The proportion of missing outcomes compared with observed event risk enough to induce clinically relevant bias in intervention effect estimate |
| Incomplete outcome data (attrition bias) non‐serious adverse events | Low risk |
Quote from publication: "SAEs and non‐serious AEs are reported for members of the Safety Population, comprised of all participants who received at least one dose of study treatment." Comment: > 95% of the participants in all treatment groups were included in the analyses. There was a high dropout rate (53%‐61% of the participants completed the study), however, the dropout rate was balanced between groups. We do not know how the trial authors imputed missing data from the participants not completing the study. The reasons for dropouts were balanced among the intervention groups. The proportion of missing outcomes compared with observed event risk was not enough to induce clinically relevant bias in intervention effect estimate |
| Incomplete outcome data (attrition bias) serious adverse events | High risk |
Quote from publication: "SAEs and non‐serious AEs are reported for members of the Safety Population, comprised of all participants who received at least one dose of study treatment." Comment: > 95% of the participants in all treatment groups were included in the analyses. There was a high dropout rate (53%‐61% of the participants completed the study), however, the dropout rate was balanced between groups. We do not know how the trial authors imputed missing data from the participants not completing the study. The reasons for dropouts were balanced among the intervention groups. The proportion of missing outcomes compared with observed event risk enough to induce clinically relevant bias in intervention effect estimate |
| Incomplete outcome data (attrition bias) weight (kg) | High risk |
Quote from publication: "ITT Population with observed values. Only those participants who were available at the indicated time points were analyzed." Comment: 15%‐37% of the randomised participants were included in the analyses. There was a high dropout rate (53%‐61% of the participants completed the study), however, the dropout rate was balanced between groups. The reasons for dropouts were balanced among the intervention groups. Only participants who were available at the indicated time points were analysed. Plausible effect size among missing outcomes enough to induce clinically relevant bias in observed effect size |
| Incomplete outcome data (attrition bias) HbA1c | High risk |
Quote from publication: "Intent‐to‐Treat (ITT) Population with observed values. Only those par. with a value at Baseline and at the specified visit were analyzed." Comment: 15%‐37% of the randomised participants were included in the analyses. There was a high dropout rate (53%‐61% of the participants completed the study), however, the dropout rate was balanced between groups. The reasons for dropouts were balanced among the intervention groups. Only participants with a value at baseline and at the specified visit were analysed. Plausible effect size among missing outcomes enough to induce clinically relevant bias in observed effect size |
| Selective reporting (reporting bias) | Low risk | Comment: all of the trial's primary and secondary outcomes as specified in the protocol have been reported |
| Other bias | Unclear risk |
Quote from publication: "The sponsor of the study participated in the study design, data collection, data review, data analysis, and writing of the report." Comment: The sponsor was a pharmaceutical company |
Charbonnel 2005.
| Methods |
Study design: randomised, double‐blind, double‐dummy, parallel‐group study Randomisation ratio: 1:1 to receive pioglitazone or gliclazide in addition to metformin |
|
| Participants |
Inclusion criteria: T2DM, inadequately managed with metformin alone (at ≥ 50% of the maximum recommended dose or at the MTD for ≥ 3 months), aged 35‐75 years, HbA1c of ≥ 7.5% or ≤ 11.0%, fasting C‐peptide of ≥ 1.5 ng/mL (0.50 nmol/L), stable or worsening glycaemic control for ≥ 3 months prior to screening Exclusion criteria: T1DM, ketoacidosis, MI, transient ischaemic attacks or stroke in the previous 6 months, symptomatic heart failure, acute malabsorption or chronic pancreatitis, familial polyposis coli, malignant disease in the previous 10 years or substance abuse, female participants had to be postmenopausal, sterilised or using satisfactory contraception, pregnant or breastfeeding women were excluded, previous treatment with insulin, gliclazide, pioglitazone or other sulphonylureas or TZDs Diagnostic criteria: not reported |
|
| Interventions |
Number of study centres: 75 Run‐in period: no Extension period: yes, the study was continued to 2 years |
|
| Outcomes | Composite outcome measures reported: no | |
| Study details |
Trial terminated early: no Trial ID: ‐ |
|
| Publication details |
Language of publication: English Funding: the work was supported by Takeda Europe R&D Centre and Eli Lilly and Company, USA Publication status: peer‐reviewed journal |
|
| Stated aim for study | Quote from publication: "The aim of this analysis was to examine the long‐term effects of pioglitazone or gliclazide addition to failing metformin monotherapy..." | |
| Notes | ‐ | |
| Risk of bias | ||
| Bias | Authors' judgement | Support for judgement |
| Random sequence generation (selection bias) | Low risk |
Quote from publication: "Patients were randomised using block randomisation via a central telephone system (QTONE)" Comment: adequate generation of random sequence ensured |
| Allocation concealment (selection bias) | Low risk |
Quote from publication: "Patients were randomised using block randomisation via a central telephone system (QTONE)" Comment: adequate concealment ensured |
| Blinding of participants and personnel (performance bias) all‐cause/cardiovascular mortality | Low risk |
Quote from publication: "double‐blind..., double dummy" Comment: investigator‐assessed outcome measurement. Blinding of study personnel ensured |
| Blinding of participants and personnel (performance bias) hypoglycaemia | Low risk |
Quote from publication: "double‐blind..., double dummy" Comment: investigator‐assessed/self‐reported outcome measurement. Blinding of participant and study personnel ensured. |
| Blinding of participants and personnel (performance bias) non‐fatal myocardial infarction/heart failure/non‐fatal stroke | Low risk |
Quote from publication: "double‐blind..., double dummy" Comment: investigator‐assessed outcome measurement. Blinding of study personnel ensured |
| Blinding of participants and personnel (performance bias) serious adverse events | Low risk |
Quote from publication: "double‐blind..., double dummy" Comment: investigator‐assessed outcome measurement. Blinding of study personnel ensured |
| Blinding of participants and personnel (performance bias) weight (kg) | Low risk |
Quote from publication: "double‐blind..., double dummy" Comment: investigator‐assessed/self‐reported outcome measurement. Blinding of participants and study personnel ensured. |
| Blinding of participants and personnel (performance bias) HbA1c | Low risk |
Quote from publication: "double‐blind..., double dummy" Comment: investigator‐assessed outcome measurement. Blinding of study personnel ensured |
| Blinding of outcome assessment (detection bias) all‐cause/cardiovascular mortality | Low risk |
Quote from publication: "double‐blind..., double dummy" Comment: investigator‐assessed outcome measurement. Blinding of study personnel ensured |
| Blinding of outcome assessment (detection bias) hypoglycaemia | Low risk |
Quote from publication: "double‐blind..., double dummy" Comment: investigator‐assessed/self‐reported outcome measurement. Blinding of participants and study personnel ensured |
| Blinding of outcome assessment (detection bias) non‐fatal myocardial infarction/heart failure/non‐fatal stroke | Low risk |
Quote from publication: "double‐blind..., double dummy" Comment: investigator‐assessed outcome measurement. Blinding of study personnel ensured. |
| Blinding of outcome assessment (detection bias) serious adverse events | Low risk |
Quote from publication: "double‐blind..., double dummy" Comment: investigator‐assessed outcome measurement. Blinding of study personnel ensured |
| Blinding of outcome assessment (detection bias) weight (kg) | Low risk |
Quote from publication: "double‐blind..., double dummy" Comment: investigator‐assessed/self‐reported outcome measurement. Blinding of participants and study personnel ensured |
| Blinding of outcome assessment (detection bias) HbA1c | Low risk |
Quote from publication: "double‐blind..., double dummy" Comment: investigator‐assessed outcome measurement. Blinding of study personnel ensured |
| Incomplete outcome data (attrition bias) all‐cause/cardiovascular mortality | Low risk |
Quote from publication: "All patients who had taken at least one dose of study medication were included in the safety analysis." Comment: > 99% of randomised participants were included in the analyses. There was a high dropout rate (74%‐76% of randomised participants completed the study), however, the dropout rate was balanced between groups. We assumed that trial authors searched registers for mortality status at the end of the trial. |
| Incomplete outcome data (attrition bias) hypoglycaemia | High risk |
Quote from publication: "All patients who had taken at least one dose of study medication were included in the safety analysis." Comment: > 99% of the participants were included in the analyses. There was a high dropout rate (74%‐76% of the participants completed the study), however, the dropout rate was balanced between groups. We do not know how the trial authors imputed missing data from the participants not completing the study. The reasons for dropouts were balanced. The proportion of missing outcomes compared with observed event risk enough to induce clinically relevant bias in intervention effect estimate. |
| Incomplete outcome data (attrition bias) non‐fatal myocardial infarction/heart failure/non‐fatal stroke | High risk |
Quote from publication: "All patients who had taken at least one dose of study medication were included in the safety analysis." Comment: > 99% of the participants were included in the analyses. There was a high dropout rate (74%‐76% of the participants completed the study), however, the dropout rate was balanced between groups. We do not know how the trial authors imputed missing data from the participants not completing the study. The reasons for dropouts were balanced. The proportion of missing outcomes compared with observed event risk enough to induce clinically relevant bias in intervention effect estimate. |
| Incomplete outcome data (attrition bias) serious adverse events | High risk |
Quote from publication: "All patients who had taken at least one dose of study medication were included in the safety analysis." Comment: > 99% of the participants were included in the analyses. There was a high dropout rate (74%‐76% of the participants completed the study), however, the dropout rate was balanced between groups. We do not know how the trial authors imputed missing data from the participants not completing the study. The reasons for dropouts were balanced. The proportion of missing outcomes compared with observed event risk enough to induce clinically relevant bias in intervention effect estimate. |
| Incomplete outcome data (attrition bias) weight (kg) | Unclear risk |
Quote from publication: "All patients who had taken at least one dose of study medication were included in the safety analysis." Comment: > 99% of the participants were included in the analyses. There was a high dropout rate (74%‐76% of the participants completed the study), however, the dropout rate was balanced between groups. We do not know how the trial authors imputed missing data from the participants not completing the study. The reasons for dropouts were balanced. |
| Incomplete outcome data (attrition bias) HbA1c | Unclear risk |
Quote from publication: "The analysis was carried out on the intention‐to‐treat (ITT) population, which included all patients who had taken at least one dose of study medication and had HbA1c recorded at baseline and at least once post‐baseline." Comment: > 99% of the participants were included in the analyses. There was a high dropout rate (74%‐76% of the participants completed the study), however, the dropout rate was balanced between groups. We do not know how the trial authors imputed missing data from the participants not completing the study. The reasons for dropouts were balanced. |
| Selective reporting (reporting bias) | Low risk | Comment: all of the trial's prespecified primary and secondary outcomes (methods section) have been reported |
| Other bias | Unclear risk | Comment: the trial was supported by pharmaceutical companies |
Dei Cas 2017.
| Methods |
Study design: randomised, open‐label, active‐controlled parallel‐group study Randomisation ratio: 1:2 |
|
| Participants |
Inclusion criteria: men and women aged ≥ 35 years, T2DM (ADA 1997 criteria) with at least 1 year of disease duration at the time of the screening visit, in metformin failure (HbA1c 7.0%–9.0%; 53–75 mmol/mol) and BMI ≥ 20 or ≤ 40 kg/m²; treatment with metformin in monotherapy at a stable dose of at least 1.5 g/day (or MTD) in the 3 months prior to the screening visit Exclusion criteria: T1DM or secondary diabetes, significant progression of diabetic macro‐ (acute cerebro‐vascular event or any revascularisation procedure, clinically relevant peripheral artery disease, onset of a diabetic foot) or micro‐ (retinopathy progression, increase of ≥ 0.5 mg/dL of plasma creatinine or progression to macro‐proteinuria, onset of clinically relevant neuropathy) angiopathy in the 6 months prior to study visit; history of acute or chronic pancreatitis, pancreatectomy, gastric surgery, inflammatory bowel disease, organ failure or other severe diseases limiting life expectancy; drugs interfering with glucose levels (i.e. corticosteroids) or acute diseases (i.e. infections) in the 3 months before screening visit, history of inflammatory/infective/autoimmune chronic disease, contraindications to the maintenance of the background therapy (metformin), including—but not limited to—chronic kidney failure or plasma creatinine concentrations > 1.5 mg/dL, severe respiratory failure, etc.; contraindications to the use of a sulphonylurea or DPP‐4 inhibitors, clinically relevant psychiatric disorders, any clinically significant abnormality identified in physical examination, laboratory tests (known chronic liver diseases) or vital signs at screening, pregnancy, uncontrolled or inadequately controlled hypertension at screening and history of low compliance Diagnostic criteria: ADA 1997 criteria |
|
| Interventions |
Number of study centres: 1 Run‐in period: none Extension period: none |
|
| Outcomes | Composite outcome measures reported: no | |
| Study details |
Trial terminated early: no Trial ID:NCT01822548 |
|
| Publication details |
Language of publication: English Funding: non‐commercial funding; Research program Regione‐Emilia Romagna‐University 2007–2009; Italian Ministry of Health Ricerca Finalizzata GR‐2011‐02347600 Commercial funding: unconditional grant from Novartis Italia Publication status: peer‐reviewed journal |
|
| Stated aim for study | Quote from publication: "The purpose of this study is to evaluate the effect of DPP‐IV inhibitor Vildagliptin vs. Glibenclamide on circulating endothelial progenitor cells (EPCs) number in type 2 diabetes patients in metformin failure." | |
| Notes | ‐ | |
| Risk of bias | ||
| Bias | Authors' judgement | Support for judgement |
| Random sequence generation (selection bias) | Low risk |
Quote from publication: "Randomization was based on random numbers generated by a statistical software. Randomization numbers and sequence were kept by the data manager. Randomization list was concealed to study investigators. Principal investigator and collaborators investigator enrolled the participants." Comment: adequate generation of random sequence ensured |
| Allocation concealment (selection bias) | Low risk |
Quote from publication: "Randomization was based on random numbers generated by a statistical software. Randomization numbers and sequence were kept by the data manager. Randomization list was concealed to study investigators. Principal investigator and collaborators investigator enrolled the participants." Comment: adequate concealment ensured |
| Blinding of participants and personnel (performance bias) all‐cause/cardiovascular mortality | Low risk |
Quote from publication: "... open‐label..." Comment: investigator‐assessed outcome measurement. Incomplete blinding, but outcome unlikely to be influenced by lack of blinding |
| Blinding of participants and personnel (performance bias) amputation of lower extremity/blindness or severe vision loss/end‐stage renal disease | Low risk |
Quote from publication: "... open‐label..." Comment: investigator‐assessed outcome measurement. Incomplete blinding, but outcome unlikely to be influenced by lack of blinding |
| Blinding of participants and personnel (performance bias) hypoglycaemia | High risk |
Quote from publication: "....on the basis of the clinical judgment of their physician, owing to hypoglycemic (4 mild and 1 severe) events." Comment: investigator‐assessed/self‐reported outcome measurement. No blinding of participants or investigators. Outcome likely to be influenced by lack of blinding |
| Blinding of participants and personnel (performance bias) non‐fatal myocardial infarction/heart failure/non‐fatal stroke | Low risk |
Quote from publication: "... open‐label..." Comment: investigator‐assessed outcome measurement. Incomplete blinding, but outcome unlikely to be influenced by lack of blinding |
| Blinding of participants and personnel (performance bias) non‐serious adverse events | High risk |
Quote from publication: "..No adverse events were reported in the V arm during the whole study period..." Comment: investigator‐assessed/self‐reported outcome measurement. No blinding of participants or investigators. Outcome likely to be influenced by lack of blinding |
| Blinding of participants and personnel (performance bias) serious adverse events | Low risk |
Quote from publication: "No adverse events were reported in the V arm during the whole study period..." Comment: investigator‐assessed/self‐reported outcome measurement. No blinding of participants or investigators. Outcome unlikely to be influenced by lack of blinding |
| Blinding of participants and personnel (performance bias) weight (kg) | High risk |
Quote from publication: "...open‐label..." Comment: investigator‐assessed/self‐reported outcome measurement. No blinding of participants or investigators. Outcome likely to be influenced by lack of blinding |
| Blinding of participants and personnel (performance bias) HbA1c | Low risk |
Quote from publication: "... open‐label..." Comment: investigator‐assessed outcome measurement. Incomplete blinding, but outcome unlikely to be influenced by lack of blinding |
| Blinding of outcome assessment (detection bias) all‐cause/cardiovascular mortality | Low risk |
Quote from publication: "... open‐label..." Comment: investigator‐assessed outcome measurement. Incomplete blinding, but outcome unlikely to be influenced by lack of blinding |
| Blinding of outcome assessment (detection bias) amputation of lower extremity/blindness or severe vision loss/end‐stage renal disease | Low risk |
Quote from publication: "... open‐label..." Comment: investigator‐assessed outcome measurement. Incomplete blinding, but outcome unlikely to be influenced by lack of blinding |
| Blinding of outcome assessment (detection bias) hypoglycaemia | High risk |
Quote from publication: "....on the basis of the clinical judgment of their physician, owing to hypoglycemic (4 mild and 1 severe) events." Comment: investigator‐assessed/self‐reported outcome measurement. No blinding of participants or investigators. Outcome likely to be influenced by lack of blinding |
| Blinding of outcome assessment (detection bias) non‐fatal myocardial infarction/heart failure/non‐fatal stroke | Low risk |
Quote from publication: "... open‐label..." Comment: investigator‐assessed outcome measurement. Incomplete blinding, but outcome unlikely to be influenced by lack of blinding |
| Blinding of outcome assessment (detection bias) non‐serious adverse events | High risk |
Quote from publication: "No adverse events were reported in the V arm during the whole study period..." Comment: investigator‐assessed/self‐reported outcome measurement. No blinding of participants or investigators. Outcome likely to be influenced by lack of blinding |
| Blinding of outcome assessment (detection bias) serious adverse events | Low risk |
Quote from publication: "No adverse events were reported in the V arm during the whole study period..." Comment: investigator‐assessed/self‐reported outcome measurement. No blinding of participants or investigators. Outcome likely to be influenced by lack of blinding |
| Blinding of outcome assessment (detection bias) weight (kg) | High risk |
Quote from publication: "...open‐label..." Comment: investigator‐assessed/self‐reported outcome measurement. No blinding of participants or investigators. Outcome likely to be influenced by lack of blinding |
| Blinding of outcome assessment (detection bias) HbA1c | Low risk |
Quote from publication: "... open‐label..." Comment: investigator‐assessed outcome measurement. Incomplete blinding, but outcome unlikely to be influenced by lack of blinding |
| Incomplete outcome data (attrition bias) all‐cause/cardiovascular mortality | Low risk | Comment: data obtained from trial author. Data were available on all randomised participants, all randomised participants were analysed in the intervention group they had been randomised to initially. |
| Incomplete outcome data (attrition bias) amputation of lower extremity/blindness or severe vision loss/end‐stage renal disease | Low risk | Comment: data obtained from author. Data were available on all randomised participants, all randomised participants were analysed in the intervention group they had been randomised to initially |
| Incomplete outcome data (attrition bias) hypoglycaemia | Low risk | Comment: data were available on all randomised participants, all randomised participants were analysed in the intervention group they had been randomised to initially |
| Incomplete outcome data (attrition bias) non‐fatal myocardial infarction/heart failure/non‐fatal stroke | Low risk | Comment: data obtained from author. Data were available on all randomised participants, all randomised participants were analysed in the intervention group they had been randomised to initially |
| Incomplete outcome data (attrition bias) non‐serious adverse events | Low risk | Comment: data were available on all randomised participants, all randomised participants were analysed in the intervention group they had been randomised to initially |
| Incomplete outcome data (attrition bias) serious adverse events | Low risk | Comment: data were available on all randomised participants, all randomised participants were analysed in the intervention group they had been randomised to initially |
| Incomplete outcome data (attrition bias) weight (kg) | Low risk | Comment: data obtained from author. Data were available on all randomised participants, all randomised participants were analysed in the intervention group they had been randomised to initially |
| Incomplete outcome data (attrition bias) HbA1c | Low risk | Comment: data obtained from author. Data were available on all randomised participants, all randomised participants were analysed in the intervention group they had been randomised to initially |
| Selective reporting (reporting bias) | Low risk | Comment: all of the trial's primary and secondary outcomes as specified in the protocol have been reported |
| Other bias | Unclear risk | Comment: the trial received funding from a pharmaceutical company |
Del Prato 2014.
| Methods |
Study design: double‐blind, randomised, active‐controlled, 3‐arm, parallel‐group study Randomisation ratio: 1:1:1 to receive 104 weeks of double‐blind treatment with either alogliptin 12.5 mg once daily, alogliptin 25 mg once daily or glipizide 5 mg once daily (with titration up to 20 mg once daily up to week 20 as needed, based on the predefined hyperglycaemia criteria detailed below) in addition to metformin Non‐inferiority design and superiority design: non‐inferiority of alogliptin doses to glipizide was established sequentially if the upper limit of the one‐sided 98.75% confidence interval for the difference in change from baseline between alogliptin 25 mg and glipizide, then alogliptin 12.5 mg and glipizide, was < 0.3%. Superiority of either dose of alogliptin to glipizide was established if the upper limit of the one‐sided 98.75% confidence interval for the difference in change from baseline between that alogliptin dose and glipizide was < 0% |
|
| Participants |
Inclusion criteria and diagnostic criteria: adults aged 18–80 years with a historical diagnosis of T2DM, BMI ≥ 23 and ≤ 45 kg/m² (if Asian, ≥ 20 and ≤ 35 kg/m²), and inadequate glycaemic control defined in one of two ways: (i) HbA1c 7%–9% with FPG < 15.3 mmol/L on stable metformin (≥ 1500 mg or MTD), or (ii) HbA1c of 7.5%–10% on metformin < 1500 mg without documented MTD, with HbA1c 7.0%–9.0% and FPG < 15.3 mmol/L after metformin stabilization (≥ 1500 mg or MTD) for 8 weeks Exclusion criteria: treatment with other antidiabetic agents within the previous 2 months; SBP ≥ 150 mmHg and/or DBP ≥ 90 mmHg; history of cancer (other than squamous cell or basal cell carcinoma of the skin in full remission for ≥ 5 years); NYHA III–IV; receiving alogliptin in a previous investigational study; and history of coronary angioplasty, coronary stent placement, coronary bypass surgery, MI, stroke or transient ischaemic attack in the previous 3 months |
|
| Interventions |
Number of study centres: 310 Run‐in period: each participant's schedule depended on the metformin dosage at screening: schedule A (participants with HbA1c 7.0%–9.0% on stable metformin at ≥ 1500 mg or MTD) consisted of screening (up to 2 weeks), stabilisation (4 weeks). Schedule B (participants with HbA1c 7.5%–10.0% on metformin < 1500 mg and below MTD) consisted of pre‐screening (up to 2 weeks), titration (to metformin ≥ 1500 mg or MTD, 8 weeks), screening (up to 1 week), stabilisation (4 weeks) Extension period: no |
|
| Outcomes | Composite outcome measures reported: no | |
| Study details |
Trial terminated early: no Trial ID:NCT00856284 |
|
| Publication details |
Language of publication: English Funding: commercial funding by Takeda Pharmaceutical Company (specify product): alogliptin Publication status: peer‐reviewed journal |
|
| Stated aim for study | Quote from publication: "To evaluate the long‐term durability of the efficacy of alogliptin compared with glipizide in combination with metformin in people with type 2 diabetes inadequately controlled on stable‐dose metformin" | |
| Notes | ‐ | |
| Risk of bias | ||
| Bias | Authors' judgement | Support for judgement |
| Random sequence generation (selection bias) | Unclear risk |
Quote from publication: "... patients were randomized ..." "Demographic and other baseline characteristics of randomized patients were similar among the treatment groups" Comment: insufficient information about the sequence generation process |
| Allocation concealment (selection bias) | Unclear risk |
Quote from publication: "Demographic and other baseline characteristics of randomized patients were similar among the treatment groups" Comment: insufficient information about the allocation concealment |
| Blinding of participants and personnel (performance bias) all‐cause/cardiovascular mortality | Low risk |
Quote from publication: "Double blind (subject, investigator)." "The occurrence of major adverse cardiovascular events (MACE) was assessed by an independent adjudication committee comprising three independent subject‐area experts. The members blindly reviewed and adjudicated all deaths, all serious cardiovascular events, and selected non‐serious potential cardiovascular events. MACE was defined according to standard criteria as cardiovascular death, non‐fatal myocardial infarction and non‐fatal stroke" Comment: adjudicator‐assessed outcome measurement. Blinding of participant and key study personnel ensured |
| Blinding of participants and personnel (performance bias) hypoglycaemia | Low risk |
Quote from publication: "Double blind (subject, investigator)" "Episodes of hypoglycaemia were monitored by use of glucometers and diaries issued to all patients. For each incident, patients were asked to record any signs or symptoms of hypoglycaemia, blood glucose at the time of the event and any assistance needed to treat the event. For recurrent episodes, the patient was instructed to notify the investigator as soon as possible. Patients were also encouraged to measure their blood glucose at least once per day" Comment: self‐reported outcome measurement. Blinding of participants ensured |
| Blinding of participants and personnel (performance bias) non‐fatal myocardial infarction/heart failure/non‐fatal stroke | Low risk |
Quote from publication: "Double blind (subject, investigator)." "The occurrence of major adverse cardiovascular events (MACE) was assessed by an independent adjudication committee comprising three independent subject‐area experts. The members blindly reviewed and adjudicated all deaths, all serious cardiovascular events, and selected non‐serious potential cardiovascular events. MACE was defined according to standard criteria as cardiovascular death, non‐fatal myocardial infarction and non‐fatal stroke" Comment: adjudicator‐assessed outcome measurement. Blinding of participant and key study personnel ensured |
| Blinding of participants and personnel (performance bias) non‐serious adverse events | Low risk |
Quote from publication: "Double blind (subject, investigator)" Comment: self‐reported outcome measurement. Blinding of participants ensured |
| Blinding of participants and personnel (performance bias) serious adverse events | Low risk |
Quote from publication: "Double blind (subject, investigator)" "Patients were carefully monitored for pancreatitis, and urged to seek follow‐up if experiencing persistent nausea and/or vomiting for ≥3 days, with or without abdominal pain. Diagnosis was established by central laboratory analysis of pancreatic enzymes (repeated until resolution) and appropriate imaging tests" Comment: investigator‐assessed outcome measurement. Blinding of participants and key study personnel ensured |
| Blinding of participants and personnel (performance bias) weight (kg) | Low risk |
Quote from publication: "Double blind (subject, investigator)" Comment: investigator‐assessed or self‐reported outcome measurement. Blinding of participants and key study personnel ensured |
| Blinding of participants and personnel (performance bias) HbA1c | Low risk |
Quote from publication: "Double blind (subject, investigator)" "Antihyperglycaemic efficacy was assessed using standard laboratory measures and assessments of weight throughout the study" Comment: investigator‐assessed outcome measurement. Blinding of investigators ensured |
| Blinding of outcome assessment (detection bias) all‐cause/cardiovascular mortality | Low risk |
Quote from publication: "Double blind (subject, investigator)." "The occurrence of major adverse cardiovascular events (MACE) was assessed by an independent adjudication committee comprising three independent subject‐area experts. The members blindly reviewed and adjudicated all deaths, all serious cardiovascular events, and selected non‐serious potential cardiovascular events. MACE was defined according to standard criteria as cardiovascular death, non‐fatal myocardial infarction and non‐fatal stroke" Comment: adjudicator‐assessed outcome measurement. Blinding of outcome assessment ensured |
| Blinding of outcome assessment (detection bias) hypoglycaemia | Low risk |
Quote from publication: "Double blind (subject, investigator)" "Episodes of hypoglycaemia were monitored by use of glucometers and diaries issued to all patients. For each incident, patients were asked to record any signs or symptoms of hypoglycaemia, blood glucose at the time of the event and any assistance needed to treat the event. For recurrent episodes, the patient was instructed to notify the investigator as soon as possible. Patients were also encouraged to measure their blood glucose at least once per day" Comment: self‐reported outcome measurement. Blinding of outcome assessment ensured |
| Blinding of outcome assessment (detection bias) non‐fatal myocardial infarction/heart failure/non‐fatal stroke | Low risk |
Quote from publication: "Double blind (subject, investigator)." "The occurrence of major adverse cardiovascular events (MACE) was assessed by an independent adjudication committee comprising three independent subject‐area experts. The members blindly reviewed and adjudicated all deaths, all serious cardiovascular events, and selected non‐serious potential cardiovascular events. MACE was defined according to standard criteria as cardiovascular death, non‐fatal myocardial infarction and non‐fatal stroke" Comment: adjudicator‐assessed outcome measurement. Blinding of outcome assessment ensured |
| Blinding of outcome assessment (detection bias) non‐serious adverse events | Low risk |
Quote from publication: "Double blind (subject, investigator)" Comment: self‐reported outcome measurement. Blinding of outcome assessment ensured |
| Blinding of outcome assessment (detection bias) serious adverse events | Low risk |
Quote from publication: "Double blind (subject, investigator)" "Patients were carefully monitored for pancreatitis, and urged to seek follow‐up if experiencing persistent nausea and/or vomiting for ≥3 days, with or without abdominal pain. Diagnosis was established by central laboratory analysis of pancreatic enzymes (repeated until resolution) and appropriate imaging tests" Comment: investigator‐assessed outcome measurement. Blinding of outcome assessment ensured |
| Blinding of outcome assessment (detection bias) weight (kg) | Low risk |
Quote from publication: "Double blind (subject, investigator)" Comment: investigator‐assessed or self‐reported outcome measurement. Blinding of outcome assessment ensured |
| Blinding of outcome assessment (detection bias) HbA1c | Low risk |
Quote from publication: "Double blind (subject, investigator)" "Antihyperglycaemic efficacy was assessed using standard laboratory measures and assessments of weight throughout the study" Comment: investigator‐assessed outcome measurement. Blinding of outcome assessment ensured |
| Incomplete outcome data (attrition bias) all‐cause/cardiovascular mortality | Low risk |
Quote from publication: "The safety set used for safety endpoints included all patients who took at least one dose of study medication". Comment: > 99% of the randomised participants were included in the analyses. There was a high dropout rate (49%‐56% of the participants completed the study), however, the dropout rate was balanced between groups. We assumed that trial authors searched registers for mortality status at the end of the trial. About 2.5% of the participants in each intervention group were lost to follow‐up. Not clarified how these missing data were imputed. The proportion of missingness is small and judged not to give rise to risk of attrition bias |
| Incomplete outcome data (attrition bias) hypoglycaemia | High risk |
Quote from publication: "The safety set used for safety endpoints included all patients who took at least one dose of study medication". Comment: > 99% of the participants in all treatment groups were included in the analyses. There was a high dropout rate (49%‐56% of the participants completed the study), however, the dropout rate was balanced between groups. We do not know how the trial authors imputed missing data from the participants not completing the study. The reasons for dropouts were balanced among the intervention groups. The proportion of missing outcomes compared with observed event risk was enough to induce clinically relevant bias in intervention effect estimate |
| Incomplete outcome data (attrition bias) non‐fatal myocardial infarction/heart failure/non‐fatal stroke | High risk |
Quote from publication: "The safety set used for safety endpoints included all patients who took at least one dose of study medication". Comment: > 99% of the participants in all treatment groups were included in the analyses. There was a high dropout rate (49%‐56% of the participants completed the study), however, the dropout rate was balanced between groups. We do not know how the trial authors imputed missing data from the participants not completing the study. The reasons for dropouts were balanced among the intervention groups. The proportion of missing outcomes compared with observed event risk was enough to induce clinically relevant bias in intervention effect estimate |
| Incomplete outcome data (attrition bias) non‐serious adverse events | Low risk |
Quote from publication: "The safety set used for safety endpoints included all patients who took at least one dose of study medication". Comment: > 99% of the participants in all treatment groups were included in the analyses. There was a high dropout rate (49%‐56% of the participants completed the study), however, the dropout rate was balanced between groups. We do not know how the trial authors imputed missing data from the participants not completing the study. The reasons for dropouts were balanced among the intervention groups. The proportion of missing outcomes compared with observed event risk was not enough to induce clinically relevant bias in intervention effect estimate |
| Incomplete outcome data (attrition bias) serious adverse events | High risk |
Quote from publication: "The safety set used for safety endpoints included all patients who took at least one dose of study medication". Comment: > 99% of the participants in all treatment groups were included in the analyses. There was a high dropout rate (49%‐56% of the participants completed the study), however, the dropout rate was balanced between groups. We do not know how the trial authors imputed missing data from the participants not completing the study. The reasons for dropouts were balanced among the intervention groups. The proportion of missing outcomes compared with observed event risk was enough to induce clinically relevant bias in intervention effect estimate |
| Incomplete outcome data (attrition bias) weight (kg) | High risk |
Quote from publication: "... secondary and exploratory analyses used the full analysis set. For any given variable, the full analysis set included all patients receiving study medication with a baseline and at least one post‐baseline assessment." "Missing values were extrapolated using the last observation carried forward in all efficacy analyses except PPG, for which no extrapolation was done." Comment: > 98% of the participants were included in the analyses. There was a high dropout rate (49%‐56% of the participants completed the study), however, the dropout rate was balanced between groups. The reasons for dropouts were balanced among the intervention groups. Inappropriate method of imputation for missing data was used (LOCF). Plausible effect size among missing outcomes was enough to induce clinically relevant bias in observed effect size |
| Incomplete outcome data (attrition bias) HbA1c | High risk |
Quote from publication: "The primary efficacy analysis was performed in the per‐protocol set..." "The per‐protocol set included all randomized patients who took at least 1 dose of double‐blind study drug, with a baseline assessment and at least 1 post‐baseline assessment for that variable and who had no major protocol violations. Last observation carried forward was used." Comment: around 40% of the participants were included in the analyses. There was a high dropout rate (49%‐56% of the participants completed the study), however, the dropout rate was balanced between groups. The reasons for dropouts were balanced among the intervention groups. Inappropriate method of imputation for missing data was used (LOCF). Plausible effect size among missing outcomes was enough to induce clinically relevant bias in observed effect size |
| Selective reporting (reporting bias) | Low risk | Comment: all of the trial's primary and secondary outcomes as specified in the protocol have been reported |
| Other bias | Unclear risk |
Quote from publication: "This study was sponsored by Takeda Development Center Americas, Inc.,Deerfield, IL, USA. Manuscript writing and editorial assistance was provided by Lyndsey Wood and Clare Gurton (on behalf of Rx Communications, UK). Support for this assistance was funded by Takeda." Comment: the trial received funding from a pharmaceutical company |
Del Prato 2015.
| Methods |
Study design: randomised, double‐blind, parallel‐group, active‐controlled study Randomisation ratio: 1:1 to receive double‐blind treatment with dapagliflozin or glipizide in addition to metformin Non‐inferiority and superiority design: "A hierarchic closed‐testing procedure was used to control the type I error rate across the primary and key secondary end points at the 0.05 level (two‐sided). Thus, if non‐inferiority was established for the primary end point at a one‐sided 0.025 significance level, then key secondary end point testing for superiority could proceed in the sequence described previously. If the first key secondary end point was significant at a two‐sided 0.05 significance level, then the second secondary end point could be evaluated, and so forth." |
|
| Participants |
Inclusion criteria: men and women aged ≥ 18 years, inadequately controlled T2DM (HbA1c > 6.5 and ≤ 10%), receiving metformin or metformin and one other OAD administered up to half‐maximal dose for at least 8 weeks before enrolment. Further criteria included FPG ≤ 15mmol/L and C‐peptide concentration of ≥ 0.33 nmol/L Exclusion criteria: T1DM; diabetes insipidus; corticosteroid‐induced T2DM; a history of diabetic ketoacidosis or hyperosmolar non‐ketotic coma; poorly controlled diabetes characterised by polyuria/polydipsia with > 10% weight loss; use of insulin within 1 year of enrolment, except in the case of hospitalisation or use in gestational diabetes, BMI > 45.0 kg/m²; calculated creatinine clearance < 60 mL/min; urine albumin:creatinine ratio > 203.4 mg/mmol; AST and/or AST and/or creatine kinase ≥ 3 x ULN range; serum total bilirubin > 34 μmol/L; haemoglobin ≤ 11 g/dL for men and ≤ 10 g/dL for women; abnormal TSH; systolic BP ≥ 180 mmHg and/or diastolic BP ≥ 110 mmHg; CV within 6 months of enrolment; congestive heart failure; congenital renal glycosuria; significant renal, hepatic, respiratory, haematological, oncological, endocrine, immunological (including hypersensitivity to study medications), and alcohol and/or substance misuse disorders; pregnancy and/or lactation; use of systemic corticosteroids equivalent to > 10 mg of oral prednisolone within 30 days of enrolment; a history of bariatric surgery; and use of weight loss medication within 30 days of enrolment Diagnostic criteria: not reported |
|
| Interventions |
Number of study centres: 95 Run‐in period: eligible participants receiving metformin monotherapy at a stable dose of < 1500 mg/day or at a variable dose, or combined with another OAD, entered an 8‐week stabilisation period during which other OADs were discontinued and the metformin dose was stabilised to 1500–2500 mg/day in all participants. Participants who were already receiving a stable dose of metformin monotherapy (1500–2500 mg/day) for at least 8 weeks before enrolment skipped the dose‐stabilisation period. A 2‐week, single‐blind, placebo‐lead in period followed the stabilisation period. Extension period: yes, 156‐week extension period |
|
| Outcomes | Composite outcome measures reported: no | |
| Study details |
Trial terminated early: no Trial ID:NCT00660907 |
|
| Publication details |
Language of publication: English and Spanish Funding: commercial funding by AstraZeneca and Bristol‐Myers Squibb Publication status: peer‐reviewed journal |
|
| Stated aim for study | Quote from publication: "To assess the long‐term glycaemic durability, safety and tolerability of dapagliflozin versus glipizide as add‐on therapies in patients with type 2 diabetes inadequately controlled by metformin alone" | |
| Notes | ‐ | |
| Risk of bias | ||
| Bias | Authors' judgement | Support for judgement |
| Random sequence generation (selection bias) | Low risk |
Quote from publication: "Patients were randomized sequentially at study level according to a predefined computer‐generated randomization scheme provided by AstraZeneca." Comment: adequate generation of random sequence ensured |
| Allocation concealment (selection bias) | Low risk |
Quote from publication: "Allocation of study treatments was performed via an Interactive Web Response System in balanced block sizes of 4 to ensure approximate balance among treatment groups." Comment: adequate concealment ensured |
| Blinding of participants and personnel (performance bias) all‐cause/cardiovascular mortality | Low risk |
Quote from publication: "Blinding of patients and investigators to study treatment was achieved using a double‐dummy technique. Metformin was administered as an open‐label treatment throughout the study." Comment: investigator‐assessed outcome measurement. Blinding of investigator ensured |
| Blinding of participants and personnel (performance bias) hypoglycaemia | Low risk |
Quote from publication: "Blinding of patients and investigators to study treatment was achieved using a double‐dummy technique. Metformin was administered as an open‐label treatment throughout the study." Comment: investigator‐assessed/self‐reported outcome measurement. Blinding of investigator and participant ensured |
| Blinding of participants and personnel (performance bias) non‐fatal myocardial infarction/heart failure/non‐fatal stroke | Low risk |
Quote from publication: "Blinding of patients and investigators to study treatment was achieved using a double‐dummy technique. Metformin was administered as an open‐label treatment throughout the study." Comment: investigator‐assessed outcome measurement. Blinding of investigator ensured |
| Blinding of participants and personnel (performance bias) non‐serious adverse events | Low risk |
Quote from publication: "Blinding of patients and investigators to study treatment was achieved using a double‐dummy technique. Metformin was administered as an open‐label treatment throughout the study." Comment: investigator‐assessed/self‐reported outcome measurement. Blinding of investigator and participant ensured |
| Blinding of participants and personnel (performance bias) serious adverse events | Low risk |
Quote from publication: "Blinding of patients and investigators to study treatment was achieved using a double‐dummy technique. Metformin was administered as an open‐label treatment throughout the study." Comment: investigator‐assessed outcome measurement. Blinding of investigator ensured |
| Blinding of participants and personnel (performance bias) weight (kg) | Low risk |
Quote from publication: "Blinding of patients and investigators to study treatment was achieved using a double‐dummy technique. Metformin was administered as an open‐label treatment throughout the study." Comment: investigator‐assessed/self‐reported outcome measurement. Blinding of investigator and participant ensured |
| Blinding of participants and personnel (performance bias) HbA1c | Low risk |
Quote from publication: "Blinding of patients and investigators to study treatment was achieved using a double‐dummy technique. Metformin was administered as an open‐label treatment throughout the study." Comment: investigator‐assessed outcome measurement. Blinding of investigator ensured |
| Blinding of outcome assessment (detection bias) all‐cause/cardiovascular mortality | Low risk |
Quote from publication: "Blinding of patients and investigators to study treatment was achieved using a double‐dummy technique. Metformin was administered as an open‐label treatment throughout the study." Comment: investigator‐assessed outcome measurement. Blinding of investigator ensured |
| Blinding of outcome assessment (detection bias) hypoglycaemia | Low risk |
Quote from publication: "Blinding of patients and investigators to study treatment was achieved using a double‐dummy technique. Metformin was administered as an open‐label treatment throughout the study." Comment: investigator‐assessed/self‐reported outcome measurement. Blinding of investigator and participant ensured |
| Blinding of outcome assessment (detection bias) non‐fatal myocardial infarction/heart failure/non‐fatal stroke | Low risk |
Quote from publication: "Blinding of patients and investigators to study treatment was achieved using a double‐dummy technique. Metformin was administered as an open‐label treatment throughout the study." Comment: investigator‐assessed outcome measurement. Blinding of investigator ensured |
| Blinding of outcome assessment (detection bias) non‐serious adverse events | Low risk |
Quote from publication: "Blinding of patients and investigators to study treatment was achieved using a double‐dummy technique. Metformin was administered as an open‐label treatment throughout the study." Comment: investigator‐assessed/self‐reported outcome measurement. Blinding of investigator and participant ensured |
| Blinding of outcome assessment (detection bias) serious adverse events | Low risk |
Quote from publication: "Blinding of patients and investigators to study treatment was achieved using a double‐dummy technique. Metformin was administered as an open‐label treatment throughout the study." Comment: investigator‐assessed outcome measurement. Blinding of investigator ensured |
| Blinding of outcome assessment (detection bias) weight (kg) | Low risk |
Quote from publication: "Blinding of patients and investigators to study treatment was achieved using a double‐dummy technique. Metformin was administered as an open‐label treatment throughout the study." Comment: investigator‐assessed/self‐reported outcome measurement. Blinding of investigator and participant ensured |
| Blinding of outcome assessment (detection bias) HbA1c | Low risk |
Quote from publication: "Blinding of patients and investigators to study treatment was achieved using a double‐dummy technique. Metformin was administered as an open‐label treatment throughout the study." Comment: investigator‐assessed outcome measurement. Blinding of investigator ensured |
| Incomplete outcome data (attrition bias) all‐cause/cardiovascular mortality | Low risk |
Quote from publication: "All analyses during the extension periods were considered exploratory." "Rates of AEs were evaluated using the safety population, which comprised all patients who had received ≥1 dose of study medication." Comment: > 99% of the randomised participants were included in the analyses. There was a high dropout rate (34%‐40% of randomised participants completed the study), however, the dropout rate was balanced between groups. No information on method to impute missing data. We assumed that trial authors searched registers for mortality status at the end of the trial. The proportion of missingness is small and judged not to give rise to risk of attrition bias |
| Incomplete outcome data (attrition bias) hypoglycaemia | Low risk |
Quote from publication: "All analyses during the extension periods were considered exploratory." "Rates of AEs were evaluated using the safety population, which comprised all patients who had received ≥1 dose of study medication." Comment: > 99% of the randomised participants were included in the analyses. There was a high dropout rate (34%‐40% of randomised participants completed the study), however, the dropout rate was balanced between groups. The reasons for dropouts were balanced among the intervention groups. No information on method to impute missing data. The proportion of missing outcomes compared with observed event risk was not enough to induce clinically relevant bias in intervention effect estimate |
| Incomplete outcome data (attrition bias) non‐fatal myocardial infarction/heart failure/non‐fatal stroke | High risk |
Quote from publication: "... the safety analysis set, consisting of all patients who received one or more doses of the investigational product..." "Missing values at week 52 were replaced using the LOCF method" Comment: > 99% of the randomised participants were included in the analyses. There was a high dropout rate (to week 52, 77%‐79% of randomised participants completed the study), however, the dropout rate was balanced between groups. The reasons for dropouts were balanced among the intervention groups. Inappropiate method of imputing missing data was used (LOCF). The proportion of missing outcomes compared with observed event risk was enough to induce clinically relevant bias in intervention effect estimate |
| Incomplete outcome data (attrition bias) non‐serious adverse events | Low risk |
Quote from publication: "... the safety analysis set, consisting of all patients who received one or more doses of the investigational product..." "Missing values at week 52 were replaced using the LOCF method" Comment: > 99% of the randomised participants were included in the analyses. There was a high dropout rate (to week 52, 77%‐79% of randomised participants completed the study), however, the dropout rate was balanced between groups. The reasons for dropouts were balanced among the intervention groups. Inappropiate method of imputing missing data was used (LOCF). The proportion of missing outcomes compared with observed event risk was not enough to induce clinically relevant bias in intervention effect estimate |
| Incomplete outcome data (attrition bias) serious adverse events | High risk |
Quote from publication: "All analyses during the extension periods were considered exploratory." "Rates of AEs were evaluated using the safety population, which comprised all patients who had received ≥1 dose of study medication." Comment: > 99% of the randomised participants were included in the analyses. There was a high dropout rate (34%‐40% of randomised participants completed the study), however, the dropout rate was balanced between groups. The reasons for dropouts were balanced among the intervention groups. No information on method to impute missing data. The proportion of missing outcomes compared with observed event risk was enough to induce clinically relevant bias in intervention effect estimate |
| Incomplete outcome data (attrition bias) weight (kg) | High risk |
Quote from publication: "All analyses during the extension periods were considered exploratory" "Efficacy was evaluated using the full analysis set, which comprised all randomized patients who received at least one dose of study medication, and who had a non‐missing baseline value and a value for ≥1 of the efficacy variables. Primary and continuous key efficacy endpoints were analysed using longitudinal
repeated‐measures analysis, with the fixed categorical effects of treatment, week and treatment‐by‐week interaction, as well as the continuous fixed covariates of baseline value and baseline value‐by‐week interaction." Comment: 34%‐39% of the randomised participants were included in the analyses. There was a high dropout rate (34%‐40% of randomised participants completed the study), however, the dropout rate was balanced between groups. The reasons for dropouts were balanced among the intervention groups. Only participants who completed the study (including participants receiving rescue therapy) were included in the analysis. Plausible effect size among missing outcomes was enough to induce clinically relevant bias in observed effect size |
| Incomplete outcome data (attrition bias) HbA1c | High risk |
Quote from publication: "All analyses during the extension periods were considered exploratory" "Efficacy was evaluated using the full analysis set, which comprised all randomized patients who received at least one dose of study medication, and who had a non‐missing baseline value and a value for ≥1 of the efficacy variables. Primary and continuous key efficacy endpoints were analysed using longitudinal
repeated‐measures analysis, with the fixed categorical effects of treatment, week and treatment‐by‐week interaction, as well as the continuous fixed covariates of baseline value and baseline value‐by‐week interaction." Comment: 17%‐20% of the randomised participants were included in the analyses. There was a high dropout rate (34%‐40% of randomised participants completed the study), however, the dropout rate was balanced between groups. The reasons for dropouts were balanced among the intervention groups. Only participants who completed the study (excluding participants receiving rescue therapy) were included in the analysis. Plausible effect size among missing outcomes was enough to induce clinically relevant bias in observed effect size |
| Selective reporting (reporting bias) | Low risk | Comment: all of the trial's primary and secondary outcomes as specified in the protocol have been reported |
| Other bias | Unclear risk | Comment: the trial received funding from a pharmaceutical company |
Derosa 2005.
| Methods |
Study design: multicentre, double‐blind, RCT Randomisation ratio: 1:1 to receive glimepiride or rosiglitazone in addition to metformin |
|
| Participants |
Inclusion criteria: T2DM for at least 6 months and inadequate glycaemic control with diet and oral glucose‐lowering drugs such as sulphonylureas or metformin, both to the MTD. No participants were taking glimepiride or thiazolidinediones. All participants had a fasting C‐peptide level > 1.0 ng/mL, were overweight (BMI mean 25.3 kg/m²), hypertensive (according to WHO 1999) and had triglyceridaemia (according to National Cholesterol Education Program Expert Panel 2001) Exclusion criteria: history of ketoacidosis or unstable or rapidly progressive diabetic background retinopathy, nephropathy (microalbuminuria, evaluated by proteinuria < 300 mg/24 h) or neuropathy (evaluated by electromyography). Participants with impaired liver function (transaminases > 40 U/L), impaired kidney function (creatinine > 1.5 mg/dL) or anaemia (Hb < 115 gm/L). Participants with unstable cardiovascular conditions (e.g. NYHA class III‐IV or a history of MI or stroke) or cerebrovascular conditions within 6 months of study enrolment. Women who were pregnant, lactating, or of child‐bearing potential while not taking adequate contraceptive precautions Diagnostic criteria: ADA 2001 |
|
| Interventions |
Number of study centres: 2 Run‐in period: 1 week of washout from other previous different treatments Extension period: no |
|
| Outcomes | Composite outcome measures reported: no | |
| Study details |
Trial terminated early: no Trial ID: ‐ |
|
| Publication details |
Language of publication: English Funding: non‐commercial funding Publication status: peer‐reviewed journal |
|
| Stated aim for study | Quote from publication: "... to evaluate the differential effect on glucose and lipid parameters of the association between glimepiride plus metformin and rosiglitazone plus metformin in patients affected by type 2 diabetes and metabolic syndrome"; "To evaluate the differential effect on coagulation and fibrinolysis parameters of combination therapy with glimepiride‐metformin and with rosiglitazone‐metformin beyond their effect on glucose metabolism in patients with type 2 diabetes and metabolic syndrome"; "... to compare the effect of long‐term (12‐month) combination treatment with glimepiride or rosiglitazone plus metformin on blood pressure in patients with type 2 diabetes mellitus (DM‐2) and the metabolic syndrome. Secondary end points were glycemic control and improvement in insulin sensitivity"; "... to evaluate the differential effect on a wide range of metabolic parameters and non‐conventional cardiovascular risk factors (plasma Lp[a] levels and basal homocysteinaemia) of glimepiride and rosiglitazone in such patients" | |
| Notes | ‐ | |
| Risk of bias | ||
| Bias | Authors' judgement | Support for judgement |
| Random sequence generation (selection bias) | Low risk |
Quote from publication: "Randomization was done by drawing envelopes containing randomization codes prepared by an independent statistician. The envelopes were then further mixed and distributed to the investigators, who consecutively assigned the randomization codes to the enrolled patients. A copy of the code was provided only to the statistician. The code was not to be broken until database lock or in case of emergency. Glimepiride and rosiglitazone were supplied as matching opaque white capsules in bottles coded to ensure the double‐blind status of the study." Comment: adequate generation of random sequence ensured |
| Allocation concealment (selection bias) | Low risk |
Quote from publication: "Randomization was done by drawing envelopes containing randomization codes prepared by an independent statistician. The envelopes were then further mixed and distributed to the investigators, who consecutively assigned the randomization codes to the enrolled patients. A copy of the code was provided only to the statistician. The code was not to be broken until database lock or in case of emergency. Glimepiride and rosiglitazone were supplied as matching opaque white capsules in bottles coded to ensure the double‐blind status of the study." Comment: adequate concealment of allocation prior to assignment ensured |
| Blinding of participants and personnel (performance bias) all‐cause/cardiovascular mortality | Low risk |
Quote from publication: "double‐blind", "Glimepiride and rosiglitazone were supplied as matching opaque white capsules in coded bottles to ensure the double‐blind status of the study" Comment: investigator‐assessed outcome measurement. Blinding of key study personnel ensured |
| Blinding of participants and personnel (performance bias) amputation of lower extremity/blindness or severe vision loss/end‐stage renal disease | Low risk |
Quote from publication: "double‐blind", "Glimepiride and rosiglitazone were supplied as matching opaque white capsules in coded bottles to ensure the double‐blind status of the study" Comment: investigator‐assessed outcome measurement. Blinding of key study personnel ensured |
| Blinding of participants and personnel (performance bias) hypoglycaemia | Low risk |
Quote from publication: "double‐blind", "Glimepiride and rosiglitazone were supplied as matching opaque white capsules in coded bottles to ensure the double‐blind status of the study" Comment: investigator‐assessed/self‐reported outcome measurement. Blinding of participants and key study personnel ensured |
| Blinding of participants and personnel (performance bias) non‐fatal myocardial infarction/heart failure/non‐fatal stroke | Low risk |
Quote from publication: "double‐blind", "Glimepiride and rosiglitazone were supplied as matching opaque white capsules in coded bottles to ensure the double‐blind status of the study" Comment: investigator‐assessed outcome measurement. Blinding of key study personnel ensured |
| Blinding of participants and personnel (performance bias) non‐serious adverse events | Low risk |
Quote from publication: "double‐blind", "Glimepiride and rosiglitazone were supplied as matching opaque white capsules in coded bottles to ensure the double‐blind status of the study" Comment: investigator‐assessed/self‐reported outcome measurement. Blinding of participants and key study personnel ensured |
| Blinding of participants and personnel (performance bias) serious adverse events | Low risk |
Quote from publication: "double‐blind", "Glimepiride and rosiglitazone were supplied as matching opaque white capsules in coded bottles to ensure the double‐blind status of the study" Comment: investigator‐assessed outcome measurement. Blinding of key study personnel ensured |
| Blinding of participants and personnel (performance bias) weight (kg) | Low risk |
Quote from publication: "double‐blind", "Glimepiride and rosiglitazone were supplied as matching opaque white capsules in coded bottles to ensure the double‐blind status of the study" Comment: investigator‐assessed outcome measurement. Blinding of key study personnel ensured |
| Blinding of participants and personnel (performance bias) HbA1c | Low risk |
Quote from publication: "double‐blind", "Glimepiride and rosiglitazone were supplied as matching opaque white capsules in coded bottles to ensure the double‐blind status of the study" Comment: investigator‐assessed outcome measurement. Blinding of key study personnel ensured |
| Blinding of outcome assessment (detection bias) all‐cause/cardiovascular mortality | Low risk |
Quote from publication: "double‐blind", "Glimepiride and rosiglitazone were supplied as matching opaque white capsules in coded bottles to ensure the double‐blind status of the study" Comment: investigator‐assessed outcome measurement. Blinding of outcome assessor ensured |
| Blinding of outcome assessment (detection bias) amputation of lower extremity/blindness or severe vision loss/end‐stage renal disease | Low risk |
Quote from publication: "double‐blind", "Glimepiride and rosiglitazone were supplied as matching opaque white capsules in coded bottles to ensure the double‐blind status of the study" Comment: investigator‐assessed outcome measurement. Blinding of outcome assessor ensured |
| Blinding of outcome assessment (detection bias) hypoglycaemia | Low risk |
Quote from publication: "double‐blind", "Glimepiride and rosiglitazone were supplied as matching opaque white capsules in coded bottles to ensure the double‐blind status of the study" Comment: investigator‐assessed/self‐reported outcome measurement. Blinding of outcome assessor ensured |
| Blinding of outcome assessment (detection bias) non‐fatal myocardial infarction/heart failure/non‐fatal stroke | Low risk |
Quote from publication: "double‐blind", "Glimepiride and rosiglitazone were supplied as matching opaque white capsules in coded bottles to ensure the double‐blind status of the study" Comment: investigator‐assessed outcome measurement. Blinding of outcome assessor ensured |
| Blinding of outcome assessment (detection bias) non‐serious adverse events | Low risk |
Quote from publication: "double‐blind", "Glimepiride and rosiglitazone were supplied as matching opaque white capsules in coded bottles to ensure the double‐blind status of the study" Comment: investigator‐assessed/self‐reported outcome measurement. Blinding of outcome assessor ensured |
| Blinding of outcome assessment (detection bias) serious adverse events | Low risk |
Quote from publication: "double‐blind", "Glimepiride and rosiglitazone were supplied as matching opaque white capsules in coded bottles to ensure the double‐blind status of the study" Comment: investigator‐assessed outcome measurement. Blinding of outcome assessor ensured |
| Blinding of outcome assessment (detection bias) weight (kg) | Low risk |
Quote from publication: "double‐blind", "Glimepiride and rosiglitazone were supplied as matching opaque white capsules in coded bottles to ensure the double‐blind status of the study" Comment: investigator‐assessed outcome measurement. Blinding of investigator ensured |
| Blinding of outcome assessment (detection bias) HbA1c | Low risk |
Quote from publication: "double‐blind", "Glimepiride and rosiglitazone were supplied as matching opaque white capsules in coded bottles to ensure the double‐blind status of the study" Comment: investigator‐assessed outcome measurement. Blinding of investigator ensured |
| Incomplete outcome data (attrition bias) all‐cause/cardiovascular mortality | Low risk |
Quote from publication: "Patients were included in the safety analysis if they had received at least 1 dose of trial medication and tolerability data were available from at least 1 follow‐up visit" Comment: 96% of randomised participants completed the study. 96% of the randomised participants were included in the analysis. Only participants who completed the study were included in the analysis. The number of participants who dropped out was balanced between groups. The reasons for dropouts were balanced among the intervention groups. We assumed that trial authors searched registers for mortality status at the end of the trial. |
| Incomplete outcome data (attrition bias) amputation of lower extremity/blindness or severe vision loss/end‐stage renal disease | Low risk |
Quote from publication: "Patients were included in the safety analysis if they had received at least 1 dose of trial medication and tolerability data were available from at least 1 follow‐up visit" Comment: 96% of randomised participants completed the study. 96% of the randomised participants were included in the analysis. Only participants who completed the study were included in the analysis. The number of participants who dropped out was balanced between groups. The reasons for dropouts were balanced among the intervention groups. No information on imputation. The proportion of missing outcomes compared with observed event risk was not enough to have a clinically relevant impact on the intervention effect estimate |
| Incomplete outcome data (attrition bias) hypoglycaemia | Low risk |
Quote from publication: "Patients were included in the safety analysis if they had received at least 1 dose of trial medication and tolerability data were available from at least 1 follow‐up visit" Comment: 96% of randomised participants completed the study. 96% of the randomised participants were included in the analysis. Only participants who completed the study were included in the analysis. The number of participants who dropped out was balanced between groups. The reasons for dropouts were balanced among the intervention groups. No information on imputation. The proportion of missing outcomes compared with observed event risk was not enough to have a clinically relevant impact on the intervention effect estimate |
| Incomplete outcome data (attrition bias) non‐fatal myocardial infarction/heart failure/non‐fatal stroke | Low risk |
Quote from publication: "Patients were included in the safety analysis if they had received at least 1 dose of trial medication and tolerability data were available from at least 1 follow‐up visit" Comment: 96% of randomised participants completed the study. 96% of the randomised participants were included in the analysis. Only participants who completed the study were included in the analysis. The number of participants who dropped out was balanced between groups. The reasons for dropouts were balanced among the intervention groups. No information on imputation. The proportion of missing outcomes compared with observed event risk was not enough to have a clinically relevant impact on the intervention effect estimate |
| Incomplete outcome data (attrition bias) non‐serious adverse events | Low risk |
Quote from publication: "Patients were included in the safety analysis if they had received at least 1 dose of trial medication and tolerability data were available from at least 1 follow‐up visit" Comment: 96% of randomised participants completed the study. 96% of the randomised participants were included in the analysis. Only participants who completed the study were included in the analysis. The number of participants who dropped out was balanced between groups. The reasons for dropouts were balanced among the intervention groups. No information on imputation. The proportion of missing outcomes compared with observed event risk was not enough to have a clinically relevant impact on the intervention effect estimate |
| Incomplete outcome data (attrition bias) serious adverse events | Low risk |
Quote from publication: "Patients were included in the safety analysis if they had received at least 1 dose of trial medication and tolerability data were available from at least 1 follow‐up visit" Comment: 96% of randomised participants completed the study. 96% of the randomised participants were included in the analysis. Only participants who completed the study were included in the analysis. The number of participants who dropped out was balanced between groups. The reasons for dropouts were balanced among the intervention groups. No information on imputation. The proportion of missing outcomes compared with observed event risk was not enough to have a clinically relevant impact on the intervention effect estimate |
| Incomplete outcome data (attrition bias) weight (kg) | Low risk |
Quote from publication: "An intention‐to‐treat analysis was conducted in patients who had received at least one dose of study medication and had a subsequent efficacy observation" Comment: 96% of randomised participants completed the study. 96% of the randomised participants were included in the analysis. Only participants who completed the study were included in the analysis. The number of participants who dropped out was balanced between groups. The reasons for dropouts were balanced among the intervention groups. Plausible effect size among missing outcomes was not enough to have a clinically relevant impact on observed effect size |
| Incomplete outcome data (attrition bias) HbA1c | Low risk |
Quote from publication: "An intention‐to‐treat analysis was conducted in patients who had received at least one dose of study medication and had a subsequent efficacy observation" Comment: 96% of randomised participants completed the study. 96% of the randomised participants were included in the analysis. Only participants who completed the study were included in the analysis. The number of participants who dropped out was balanced between groups. The reasons for dropouts were balanced among the intervention groups. Plausible effect size among missing outcomes was not enough to have a clinically relevant impact on observed effect size |
| Selective reporting (reporting bias) | High risk | Comment: no protocol available. All of the trial's prespecified primary and secondary outcomes (methods section) have been reported. Unclear whether common outcomes (all‐cause mortality, hypoglycaemia) were measured; not mentioned, but clinical judgement says likely to have been measured and analysed but not reported on the basis of non‐significant results |
Derosa 2009a.
| Methods |
Study design: multicentre, double‐blind, RCT Randomisation ratio: 1:1:1:1 to receive pioglitazone, metformin, pioglitazone + metformin or glimepiride + metformin |
|
| Participants |
Inclusion criteria: white people, ≥ 18 years of age with T2DM according to the ESC and the EASD guidelines criteria 2007 who were naive and with poor glycaemic control, expressed as HbA1c level > 6.5%, and were overweight BMI ≥ 25 and < 30 kg/m² Exclusion criteria: history of ketoacidosis or unstable or rapidly progressive diabetic retinopathy, nephropathy, or neuropathy; impaired hepatic function (defined as plasma aminotransferase and/or γ‐glutamyltransferase level higher than the ULN for age and sex); impaired renal function (defined as serum creatinine level > ULN for age and sex); or severe anaemia. Participants with serious cardiovascular disease (e.g. NYHA class I‐IV or a history of MI or stroke) or cerebrovascular conditions within 6 months before study enrolment. Women who were pregnant, breastfeeding, or of childbearing potential and not taking adequate contraceptive precautions Diagnostic criteria: ESC and the EASD 2007 |
|
| Interventions |
Number of study centres: 2 Run‐in period: no Extension period: no |
|
| Outcomes | Composite outcome measures reported: no | |
| Study details |
Trial terminated early: no Trial ID: ‐ |
|
| Publication details |
Language of publication: English Funding: not reported Publication status: peer‐reviewed journal |
|
| Stated aim for study | Quote from publication: "The aim of this study was to directly compare the longterm effect of 4 antidiabetic treatment protocols on insulin resistance evaluated by euglycemic hyperinsulinemic clamp in type 2 diabetes mellitus patients. In particular, we aimed to evaluate if the combination of 2 insulin‐sensitizing agents (pioglitazone and metformin) could significantly improve the insulin resistance when compared with single agent–based protocols and with a protocol including an insulin secretagogue (glimepiride)." | |
| Notes | ‐ | |
| Risk of bias | ||
| Bias | Authors' judgement | Support for judgement |
| Random sequence generation (selection bias) | Low risk |
Quote from publication: "Randomization was done using a drawing of envelopes containing randomization codes prepared by a statistician. A copy of the code was provided only to the responsible person performing the statistical analysis. The code was only broken after database lock, but could have been broken for individual subjects in cases of an emergency." "The treatments were supplied as matching opaque white capsules in coded bottles to ensure the double‐blind status of the study." Comment: adequate generation of random sequence ensured |
| Allocation concealment (selection bias) | Low risk |
Quote from publication: "Randomization was done using a drawing of envelopes containing randomization codes prepared by a statistician. A copy of the code was provided only to the responsible person performing the statistical analysis. The code was only broken after database lock, but could have been broken for individual subjects in cases of an emergency." "The treatments were supplied as matching opaque white capsules in coded bottles to ensure the double‐blind status of the study." Comment: adequate concealment of allocation ensured |
| Selective reporting (reporting bias) | High risk | Comment: no trial protocol was available. All of the trial's prespecified primary and secondary outcomes (methods section) have been reported. Unclear whether common outcomes (all‐cause mortality) were measured; not mentioned, but clinical judgement says likely to have been measured and analysed but not reported on the basis of non‐significant results. Incomplete reporting of adverse events and hypoglycaemia, only events leading to discontinuation are mentioned. Incomplete reporting of HbA1c due to missing information of participants included in analysis |
| Other bias | Unclear risk | Comment: the primary author had performed a similar study four years earlier (Derosa 2005) |
Derosa 2009b.
| Methods |
Study design: multicentre, double‐blind, parallel‐group RCT Randomisation ratio: 1:1 to receive nateglinide or glibenclamide in addition to metformin |
|
| Participants |
Inclusion criteria: white, ≥ 18 years of age with T2DM according to ADA criteria (duration ≥ 6 months), poor glycaemic control (HbA1c level > 7.0%), hypertension according to the WHO criteria (systolic/diastolic BP, ≥ 130/ ≥ 85 mmHg), overweight (BMI 25.0–28.0 kg/m²). None of the participants were taking hypolipidaemic drugs, diuretics, beta‐blockers or thyroxin Exclusion criteria: history of ketoacidosis or unstable or rapidly progressive diabetic retinopathy, nephropathy, or neuropathy; impaired hepatic function (defined as plasma aminotransferase and/or gamma‐glutamyltransferase level > ULN for age and sex), impaired renal function (defined as serum creatinine level > ULN for age and sex), or severe anaemia. People with serious cardiovascular disease (e.g. NYHA class I–IV or a history of MI or stroke) or cerebrovascular conditions within 6 months before study enrolment. Women who were pregnant or breastfeeding or of childbearing potential and not taking adequate contraceptive precautions Diagnostic criteria: ADA 2001, WHO 1999 |
|
| Interventions |
Number of study centres: 3 Run‐in period: yes, 6‐month of run‐in which nateglinide and glibenclamide were titrated. Metformin was added in each arm after 1‐month of run‐in Extension period: no |
|
| Outcomes | Composite outcome measures reported: no | |
| Study details |
Trial terminated early: no Trial ID: ‐ |
|
| Publication details |
Language of publication: English Funding: not reported Publication status: peer‐reviewed journal |
|
| Stated aim for study | Quote from publication: Derosa 2009: "The aim of our study is to directly compare the long‐term metabolic effects of nateglinide and glibenclamide in naïve type 2 diabetic patients treated with metformin"; Derosa 2007: "... the aim of our study is to evaluate the differential effect on coagulation and fibrinolysis parameters and on non conventional cardiovascular risk factors of the association between metformin plus nateglinide or glibenclamide in naïve type 2 diabetes patients" | |
| Notes | ‐ | |
| Risk of bias | ||
| Bias | Authors' judgement | Support for judgement |
| Random sequence generation (selection bias) | Low risk |
Quote from publication: "Patients were randomized using envelopes containing randomization codes prepared by a statistician. A copy of the randomization code was provided only to the person responsible for performing the statistical analysis. The code was only broken after database lock, but could have been broken for individual patients in cases of emergency, such as hospitalization or suspect of a serious adverse event. Nateglinide, glibenclamide and metformin were supplied as identical, opaque, white capsules in coded bottles to ensure the double‐blind status of the study." Comment: adequate generation of random sequence ensured |
| Allocation concealment (selection bias) | Low risk |
Quote from publication: "Patients were randomized using envelopes containing randomization codes prepared by a statistician. A copy of the randomization code was provided only to the person responsible for performing the statistical analysis. The code was only broken after database lock, but could have been broken for individual patients in cases of emergency, such as hospitalization or suspect of a serious adverse event. Nateglinide, glibenclamide and metformin were supplied as identical, opaque, white capsules in coded bottles to ensure the double‐blind status of the study." Comment: adequate concealment of allocation ensured |
| Blinding of participants and personnel (performance bias) HbA1c | Low risk |
Quote from publication: "... double‐blind.. " "Nateglinide, glibenclamide and metformin were supplied as identical, opaque, white capsules in coded bottles to ensure the double‐blind status of the study." Comment: investigator‐assessed outcome measurement. Blinding of key study personnel ensured |
| Blinding of outcome assessment (detection bias) HbA1c | Low risk |
Quote from publication: "... double‐blind.. " "Nateglinide, glibenclamide and metformin were supplied as identical, opaque, white capsules in coded bottles to ensure the double‐blind status of the study." Comment: investigator‐assessed outcome measurement. Blinding of investigator ensured |
| Incomplete outcome data (attrition bias) HbA1c | Low risk |
Quote from publication: "An intention‐to‐treat analysis was conducted in patients who had received ≥ 1 dose of study medication
and had a subsequent efficacy observation." Comment: 94% of randomised participants completed the study. 94% of the randomised participants were included in the analysis. Only participants who completed the study were included in the analysis. The number of participants who dropped out was balanced between groups. The reasons for dropouts were balanced among the intervention groups. Plausible effect size among missing outcomes was not enough to have a clinically relevant impact on observed effect size |
| Selective reporting (reporting bias) | High risk | Comment: no protocol available. All of the trial's prespecified primary and secondary outcomes (methods section) have been reported. Unclear whether common outcomes (all‐cause mortality, hypoglycaemia) were measured; not mentioned, but clinical judgement says likely to have been measured and analysed but not reported on the basis of non‐significant results. Clear that outcomes (non‐serious adverse events, serious adverse events) were measured but was not necessarily analysed; judgement says likely to have been analysed but not reported because of non‐significant results |
Derosa 2010.
| Methods |
Study design: multicentre, randomised, single‐blind, controlled study Randomisation ratio: 1:1 to receive exenatide or glibenclamide in addition to metformin |
|
| Participants |
Inclusion criteria: T2DM, white, ≥ 18 years of age with poor glycaemic control (expressed as HbA1c level > 8.0%) and overweight (BMI ≥ 25 and < 30 kg/m²) receiving therapy with metformin at the mean dosage of 1500 ± 500 mg/day. They were intolerant to metformin at maximum dosage (3000 mg/day) with the onset of gastrointestinal disorders like diarrhoea and significant meteorism when metformin was titrated to the maximum level Exclusion criteria: history of ketoacidosis or unstable or rapidly progressive diabetic retinopathy, nephropathy, or neuropathy, impaired hepatic function (defined as plasma aminotransferase and/or γ‐glutamyltransferase level > ULN for age and sex), impaired renal function (defined as serum creatinine level > ULN for age and sex), or severe anaemia. Participants with serious cardiovascular disease (e.g. NYHA class I–IV or a history of MI or stroke) or cerebrovascular conditions within 6 months before study enrolment. Women who were pregnant or breastfeeding or of childbearing potential and not taking adequate contraceptive precautions Diagnostic criteria: ESC and EASD 2007 |
|
| Interventions |
Number of study centres: 8 Run‐in period: no Extension period: no |
|
| Outcomes | Composite outcome measures reported: no | |
| Study details |
Trial terminated early: no Trial ID: ‐ |
|
| Publication details |
Language of publication: English Funding: non‐commercial funding Publication status: peer‐reviewed journal |
|
| Stated aim for study | Quote from publication: "The aim of this study was to evaluate the effects of a 1‐year treatment with exenatide compared to glibenclamide in type 2 diabetes patients on body weight, glycemic control, and β‐cell function but also on insulin resistance and inflammatory state parameters like resistin, retinol binding protein‐4 (RBP‐4), and high‐sensitivity C‐reactive protein (Hs‐CRP)" | |
| Notes | ‐ | |
| Risk of bias | ||
| Bias | Authors' judgement | Support for judgement |
| Random sequence generation (selection bias) | Low risk |
Quote from publication: "Randomization was done using a drawing of envelopes containing randomization codes prepared by a statistician" Comment: adequate generation of random sequence ensured. |
| Allocation concealment (selection bias) | Low risk |
Quote from publication: "Randomization was done using a drawing of envelopes containing randomization codes prepared by a statistician" Comment: insufficient information about the allocation concealment. Since early studies from the same investigators (Derosa 2005; Derosa 2009a; Derosa 2009b), clearly describe an adequate concealment of allocation prior to assignment, this is probably done in this study too |
| Blinding of participants and personnel (performance bias) weight (kg) | Low risk |
Quote from publication: "single‐blind" Comment: investigator‐assessed outcome measurement. Blinding of investigator ensured |
| Blinding of participants and personnel (performance bias) HbA1c | Low risk |
Quote from publication: "single‐blind" Comment: investigator‐assessed outcome measurement. Blinding of investigator ensured |
| Blinding of outcome assessment (detection bias) weight (kg) | Low risk |
Quote from publication: "single‐blind" Comment: investigator‐assessed outcome measurement. Blinding of investigator ensured |
| Blinding of outcome assessment (detection bias) HbA1c | Low risk |
Quote from publication: "single‐blind" Comment: investigator‐assessed outcome measurement. Blinding of investigator ensured |
| Incomplete outcome data (attrition bias) weight (kg) | Low risk |
Quote from publication: "Every patient who had received at least one dose of the study medication underwent a tolerability observation to exclude the presence of acute adverse reactions. After that an intention‐to‐treat analysis was conducted in patients who had received one or more doses of study medication, did not show any acute adverse reaction, and had a subsequent efficacy observation" Comment: 87% of randomised participants completed the study. 87% of the randomised participants were included in the analysis. Only participants who completed the study were included in the analysis. The number of participants who dropped out was balanced between groups. The reasons for dropouts were balanced among the intervention groups. Plausible effect size among missing outcomes was not enough to have a clinically relevant impact on observed effect size |
| Incomplete outcome data (attrition bias) HbA1c | Low risk |
Quote from publication: "Every patient who had received at least one dose of the study medication underwent a tolerability observation to exclude the presence of acute adverse reactions. After that an intention‐to‐treat analysis was conducted in patients who had received one or more doses of study medication, did not show any acute adverse reaction, and had a subsequent efficacy observation" Comment: 87% of randomised participants completed the study. 87% of the randomised participants were included in the analysis. Only participants who completed the study were included in the analysis. The number of participants who dropped out was balanced between groups. The reasons for dropouts were balanced among the intervention groups. Plausible effect size among missing outcomes was not enough to have a clinically relevant impact on observed effect size |
| Selective reporting (reporting bias) | High risk | Comment: no protocol available. All of the trial's prespecified primary and secondary outcomes (methods section) have been reported. Unclear whether common outcomes (all‐cause mortality) were measured; not mentioned, but clinical judgement says likely to have been measured and analysed but not reported on the basis of non‐significant results. Incomplete reporting of adverse events and hypoglycaemia, only events leading to discontinuation are mentioned |
Derosa 2011a.
| Methods |
Study design: multicentre, randomised, single‐blind, controlled study Randomisation ratio: 1:1 to receive exenatide or glimepiride in addition to metformin |
|
| Participants |
Inclusion criteria: white, T2DM, ≥ 18 years of age with poor glycaemic control, expressed as HbA1c level > 8.0%, and overweight (BMI ≥ 25, and < 30 kg/m²). They were taking metformin at various different doses (1000–2000 mg/day) and were intolerant to metformin at the highest dosages (2500–3000 mg/day) Exclusion criteria: history of ketoacidosis or unstable or rapidly progressive diabetic retinopathy, nephropathy, or neuropathy; impaired hepatic function (defined as plasma aminotransferase and/or gamma‐glutamyltransferase level > ULN for age and sex), impaired renal function (defined as serum creatinine level > ULN for age and sex), or severe anaemia. Participants with serious cardiovascular disease (e.g. NYHA classes I–IV or a history of MI or stroke) or cerebrovascular conditions within 6 months before study enrolment. Women who were pregnant or breastfeeding or of childbearing potential and not taking adequate contraceptive precautions Diagnostic criteria: ESC and EASD 2007 |
|
| Interventions |
Number of study centres: 7 Run‐in period: not reported Extension period: no |
|
| Outcomes | Composite outcome measures reported: no | |
| Study details |
Trial terminated early: no Trial ID: ‐ |
|
| Publication details |
Language of publication: English Funding: non‐commercial funding Publication status: peer‐reviewed journal |
|
| Stated aim for study | Quote from publication: "The aim of this study was to evaluate the effect of exenatide compared to glimepiride on body weight, glycemic control and insulin resistance in type 2 diabetic patients taking metformin" | |
| Notes | ‐ | |
| Risk of bias | ||
| Bias | Authors' judgement | Support for judgement |
| Random sequence generation (selection bias) | Low risk |
Quote from publication: "Randomization was done using a drawing of envelopes containing randomization codes prepared by a statistician" Comment: adequate generation of random sequence ensured |
| Allocation concealment (selection bias) | Low risk |
Quote from publication: "Randomization was done using a drawing of envelopes containing randomization codes prepared by a statistician" Comment: insufficient information about the allocation concealment. Since an early study from the same investigators (Derosa 2005; Derosa 2009a; Derosa 2009b) clearly describes an adequate concealment of allocation prior to assignment, this is probably done in this study too |
| Blinding of participants and personnel (performance bias) weight (kg) | Low risk |
Quote from publication: "single‐blind" Comment: investigator‐assessed outcome measurement. Blinding of investigator ensured |
| Blinding of participants and personnel (performance bias) HbA1c | Low risk |
Quote from publication: "single‐blind" Comment: investigator‐assessed outcome measurement. Blinding of investigator ensured |
| Blinding of outcome assessment (detection bias) weight (kg) | Low risk |
Quote from publication: "single‐blind" Comment: investigator‐assessed outcome measurement. Blinding of investigator ensured |
| Blinding of outcome assessment (detection bias) HbA1c | Low risk |
Quote from publication: "single‐blind" Comment: investigator‐assessed outcome measurement. Blinding of investigator ensured |
| Incomplete outcome data (attrition bias) weight (kg) | Low risk |
Quote from publication: "Every patient who had received at least one dose of the study medication underwent a tolerability observation to exclude the presence of acute adverse reactions ... After that an intention‐to‐treat analysis was conducted in patients who had received one or more doses of study medication, did not show any acute adverse reaction, and had a subsequent efficacy observation." Comment: 91% of randomised participants completed the study. 91% of randomised participants were included in the analysis. Only participants who completed the study were included in the analysis. The number of participants who dropped out was balanced between groups. The reasons for dropouts were balanced among the intervention groups. Plausible effect size among missing outcomes was not enough to have a clinically relevant impact on observed effect size |
| Incomplete outcome data (attrition bias) HbA1c | Low risk |
Quote from publication: "Every patient who had received at least one dose of the study medication underwent a tolerability observation to exclude the presence of acute adverse reactions ... After that an intention‐to‐treat analysis was conducted in patients who had received one or more doses of study medication, did not show any acute adverse reaction, and had a subsequent efficacy observation." Comment: 91% of randomised participants completed the study. 91% of randomised participants were included in the analysis. Only participants who completed the study were included in the analysis. The number of participants who dropped out was balanced between groups. The reasons for dropouts were balanced among the intervention groups. Plausible effect size among missing outcomes was not enough to have a clinically relevant impact on observed effect size |
| Selective reporting (reporting bias) | High risk | Comment: no trial protocol available. All of the trial's prespecified primary and secondary outcomes (methods section) have been reported. Unclear whether common outcomes (all‐cause mortality) were measured; not mentioned, but clinical judgement says likely to have been measured and analysed but not reported on the basis of non‐significant results. Incomplete reporting of adverse events and hypoglycaemia, only events leading to discontinuation are mentioned |
| Other bias | Unclear risk | Comment: one year earlier the primary author had performed a similar study (Derosa 2010) |
Derosa 2011b.
| Methods |
Study design: multicentre, randomised, double‐blind, controlled study Randomisation ratio: 1:1 to receive pioglitazone or glibenclamide in addition to metformin |
|
| Participants |
Inclusion criteria: white, ≥ 18 years of age with uncontrolled T2DM (HbA1c > 62 mmol/mol or 7.0%) with diet, physical activity, and metformin (mean dosage: 1 700 ± 850 mg/day) Exclusion criteria: history of ketoacidosis or unstable or rapidly progressive diabetic retinopathy, nephropathy (defined by onset of albumin excretion > 300 mg/24 h or albumin excretion rate > 200 μg/min over a 6‐month period), or neuropathy; impaired hepatic function (defined as plasma aminotransferase and/or gamma‐glutamyltransferase level > ULN for age and sex), impaired renal function (defined as serum creatinine level > ULN for age and sex), or severe anaemia (defined as haemoglobin level < 8 g/dL), serious cardiovascular disease or cardiac failure or history of cardiac failure (NYHA Class I‐IV) or a history of MI or stroke or cerebrovascular conditions (stroke or transient ischaemic attack) within 6 months before study enrolment. Post‐menopausal women with a history of osteoporosis for the increased risk of distal upper limb (forearm, hand, and wrist) or distal lower limb (foot, ankle, fibula and tibia) fractures reported with pioglitazone. Women who were pregnant or breastfeeding or of childbearing potential and not taking adequate contraceptive precautions Diagnostic criteria: ESC and EASD 2007 |
|
| Interventions |
Number of study centres: 2 Run‐in period: no Extension period: no |
|
| Outcomes | Composite outcome measures reported: no | |
| Study details |
Trial terminated early: no Trial ID: ‐ |
|
| Publication details |
Language of publication: English Funding: not reported Publication status: peer‐reviewed journal |
|
| Stated aim for study | Quote from publication: "The aim of the study was to evaluate the effect of pioglitazone and glibenclamide on lipid profile and inflammatory parameters during an oral fat load (OFL)." | |
| Notes | ‐ | |
| Risk of bias | ||
| Bias | Authors' judgement | Support for judgement |
| Random sequence generation (selection bias) | Low risk |
Quote from publication: "Pioglitazone and glibenclamide were supplied as identical, opaque, white capsules in coded bottles to ensure the blind status of the study. Randomization was done using a drawing of envelopes containing randomization codes prepared by a statistician. A copy of the code was provided only to the responsible person performing the statistical analysis. The code was only broken after database lock, but could have been broken for individual subjects in cases of an emergency." Comment: adequate generation of random sequence ensured |
| Allocation concealment (selection bias) | Low risk |
Quote from publication: "Pioglitazone and glibenclamide were supplied as identical, opaque, white capsules in coded bottles to ensure the blind status of the study. Randomization was done using a drawing of envelopes containing randomization codes prepared by a statistician. A copy of the code was provided only to the responsible person performing the statistical analysis. The code was only broken after database lock, but could have been broken for individual subjects in cases of an emergency." Comment: adequate concealment of allocation prior to assignment ensured |
| Blinding of participants and personnel (performance bias) weight (kg) | Low risk |
Quote from publication: "double‐blind" Comment: investigator‐assessed outcome measurement. Blinding of investigator ensured |
| Blinding of participants and personnel (performance bias) HbA1c | Low risk |
Quote from publication: "double‐blind" Comment: investigator‐assessed outcome measurement. Blinding of investigator ensured |
| Blinding of outcome assessment (detection bias) weight (kg) | Low risk |
Quote from publication: "double‐blind" Comment: investigator‐assessed outcome measurement. Blinding of investigator ensured |
| Blinding of outcome assessment (detection bias) HbA1c | Low risk |
Quote from publication: "double‐blind" Comment: investigator‐assessed outcome measurement. Blinding of investigator ensured |
| Incomplete outcome data (attrition bias) weight (kg) | Low risk |
Quote from publication: "An intention to treat analysis was conducted in patients who had received ≥ 1 dose of study medication and had a subsequent efficacy observation" Comment: 97% of randomised participants completed the study. 97% of the randomised participants were included in the analysis. Only participants who completed the study were included in the analysis. The number of participants who dropped out was balanced between groups. The reasons for dropouts were balanced among the intervention groups. Plausible effect size among missing outcomes was not enough to have a clinically relevant impact on observed effect size |
| Incomplete outcome data (attrition bias) HbA1c | Low risk |
Quote from publication: "An intention to treat analysis was conducted in patients who had received ≥ 1 dose of study medication and had a subsequent efficacy observation" Comment: 97% of randomised participants completed the study. 97% of the randomised participants were included in the analysis. Only participants who completed the study were included in the analysis. The number of participants who dropped out was balanced between groups. The reasons for dropouts were balanced among the intervention groups. Plausible effect size among missing outcomes was not enough to have a clinically relevant impact on observed effect size |
| Selective reporting (reporting bias) | High risk | Comment: no protocol available. All of the trial's prespecified primary and secondary outcomes (methods section) have been reported. Unclear whether common outcomes (all‐cause mortality) were measured; not mentioned, but clinical judgement says likely to have been measured and analysed but not reported on the basis of non‐significant results. Incomplete reporting of adverse events and hypoglycaemia, only events leading to discontinuation were mentioned |
| Other bias | Unclear risk | Comment: one year earlier the primary author had performed a similar study (Derosa 2005) |
Filozof 2010.
| Methods |
Study design: multicentre, randomised, double‐blind, active‐controlled study Randomisation ratio: 1:1 to receive vildagliptin or gliclazide in addition to metformin Non‐inferiority design: 1‐sided confidence interval |
|
| Participants |
Inclusion criteria: non‐fertile or using a medically approved birth control method, 18‐78 years with T2DM and HbA1c 7.5%–11%, who had received metformin for at least 3 months and were on a stable dose of ≥ 1500 mg daily for ≥ 4 weeks prior to visit 1 Exclusion criteria: history of T1DM, diabetes as a result of pancreatic injury or secondary forms of diabetes (Cushing’s syndrome and acromegaly) and participants experiencing acute metabolic diabetic complications (ketoacidosis or hyperosmolar state) within the past 6 months. Participants with serious cardiac conditions (torsades de pointes, sustained and clinically relevant ventricular tachycardia or ventricular fibrillation, percutaneous coronary intervention within the past 3 months, MI, coronary artery bypass surgery, unstable angina; or stroke within the last 6 months and congestive heart failure requiring pharmacological treatment, second‐ or third‐degree atrioventricular block or prolonged QTC) or clinically significant renal or liver disease ). ALT or AST > 2 x ULN range, total bilirubin > 2 x ULN range, positive hepatitis B surface antigen and/or hepatitis C antibody, serum creatinine ≥ 132 μmol/L in male participants and ≥ 123 μmol/L in female participants, or a history of abnormal creatinine clearance, clinically significant TSH values outside of normal range at screening, or fasting triglycerides > 7.9 mmol ⁄ L at screening Diagnostic criteria: not reported |
|
| Interventions |
Number of study centres: 220 Run‐in period: 4 weeks of run‐in with metformin ≥ 1500 mg daily at stable dose Extension period: no |
|
| Outcomes | Composite outcome measures reported: yes, cardiovascular and cerebrovascular outcomes | |
| Study details |
Trial terminated early: no Trial ID:NCT00102466 |
|
| Publication details |
Language of publication: English Funding: commercial funding (vildagliptin), Novartis Pharma AG Publication status: peer‐reviewed journal |
|
| Stated aim for study | Quote from publication: "To demonstrate non‐inferiority of vildagliptin compared with gliclazide, as an add‐on therapy, in patients with Type 2 diabetes inadequately controlled with metformin in a 52‐week, randomized, double‐blind, active‐controlled study." | |
| Notes | ‐ | |
| Risk of bias | ||
| Bias | Authors' judgement | Support for judgement |
| Random sequence generation (selection bias) | Unclear risk |
Quote from publication: "Eligible patients were randomized..." Comment: insufficient information about the sequence generation process to permit judgement of 'low risk or 'high risk' |
| Allocation concealment (selection bias) | Unclear risk |
Quote from publication: "Eligible patients were randomized..." Comment: insufficient information about the allocation concealment to permit judgement of 'low risk' or 'high risk' |
| Blinding of participants and personnel (performance bias) all‐cause/cardiovascular mortality | Low risk |
Quote from publication: "... double blind..." "All the randomized patients were blinded using a double‐dummy design." "The number and percentage of AEs confirmed by the Cardiovascular and Cerebrovascular Safety Committee and the Internal Medicine Committee were summarized by treatment. Both of these committees independently and blindly reviewed, assessed and categorized cardiovascular and cerebrovascular events and prespecified clinical events (as defined by the panel) that might have been observed during the study." Comment: adjudicated/investigator‐assessed outcome measurement. Blinding of participants and study personnel ensured |
| Blinding of participants and personnel (performance bias) serious adverse events | Low risk |
Quote from publication: "... double blind..." "All the randomized patients were blinded using a double‐dummy design." "The number and percentage of AEs confirmed by the Cardiovascular and Cerebrovascular Safety Committee and the Internal Medicine
Committee were summarized by treatment. Both of these committees independently and blindly reviewed, assessed and categorized cardiovascular and cerebrovascular events and prespecified clinical events (as defined by the panel) that might have been observed during the study." Comment: adjudicated/investigator‐assessed outcome measurement. Blinding of participants and study personnel ensured |
| Blinding of participants and personnel (performance bias) weight (kg) | Unclear risk |
Quote from publication: "... double blind..." "All the randomized patients were blinded using a double‐dummy design." Comment: investigator‐assessed outcome measurement. Blinding of study personnel ensured |
| Blinding of participants and personnel (performance bias) HbA1c | Low risk |
Quote from publication: "... double blind..." "All the randomized patients were blinded using a double‐dummy design." Comment: investigator‐assessed outcome measurement. Blinding of study personnel ensured |
| Blinding of outcome assessment (detection bias) all‐cause/cardiovascular mortality | Low risk |
Quote from publication: "... double blind..." "The number and percentage of AEs confirmed by the Cardiovascular and Cerebrovascular Safety Committee and the Internal Medicine Committee were summarized by treatment. Both of these committees independently and blindly reviewed, assessed and categorized cardiovascular and cerebrovascular events and prespecified clinical events (as defined by the panel) that might have been observed during the study." Comment: adjudicated/investigator‐assessed outcome measurement. Blinding of outcome assessor ensured |
| Blinding of outcome assessment (detection bias) serious adverse events | Low risk |
Quote from publication: "... double blind..." "The number and percentage of AEs confirmed by the Cardiovascular and Cerebrovascular Safety Committee and the Internal Medicine Committee were summarized by treatment. Both of these committees independently and blindly reviewed, assessed and categorized cardiovascular and cerebrovascular events and prespecified clinical events (as defined by the panel) that might have been observed during the study." Comment: adjudicated/investigator‐assessed outcome measurement. Blinding of outcome assessor ensured |
| Blinding of outcome assessment (detection bias) weight (kg) | Unclear risk |
Quote from publication: "... double blind..." Comment: investigator‐assessed outcome measurement. Blinding of outcome assessor ensured |
| Blinding of outcome assessment (detection bias) HbA1c | Low risk |
Quote from publication: "... double blind..." Comment: investigator‐assessed outcome measurement. Blinding of outcome assessor ensured |
| Incomplete outcome data (attrition bias) all‐cause/cardiovascular mortality | Low risk |
Quote from publication: "Safety (SAF) population: patients who received at least one dose of study drug and had at least one post‐baseline safety assessment." "Safety summaries were tabulated using data from the SAF population." "For analysis, the last available post‐baseline assessment (last observation carried forward; LOCF) was used." Comment: > 99% of the randomised participants were included in the analyses. There was a high dropout rate (79%‐83% of randomised participants completed the study), however, the dropout rate was balanced between groups. Inappropriate method of imputing missing data was used (LOCF). We assumed that trial authors searched registers for mortality status at the end of the trial |
| Incomplete outcome data (attrition bias) serious adverse events | High risk |
Quote from publication: "Safety (SAF) population: patients who received at least one dose of study drug and had at least one post‐baseline safety assessment." "Safety summaries were tabulated using data from the SAF population." "For analysis, the last available post‐baseline assessment (last observation carried forward; LOCF) was used." Comment: > 99% of the randomised participants were included in the analyses. There was a high dropout rate (79%‐83% of randomised participants completed the study), however, the dropout rate was balanced between groups. The reasons for dropouts were balanced among the intervention groups. Inappropriate method of imputing missing data was used (LOCF). The proportion of missing outcomes compared with observed event risk was enough to induce clinically relevant bias in intervention effect estimate |
| Incomplete outcome data (attrition bias) weight (kg) | High risk |
Quote from publication: "Per protocol (PP) population: included patients in the ITT population with more than 24 weeks of treatment, with no major protocol violations, and who underwent the final valid assessment of the primary efficacy variable HbA1c within 7 days after the last dose of study drug and either (i) completed more than 48 weeks of treatment or (ii) had < 48 weeks of treatment but discontinued from study drug because of unsatisfactory therapeutic response." "The analysis of the primary and secondary efficacy variables were based on the PP population." "For analysis, the last available post‐baseline assessment (last observation carried forward; LOCF) was used." Comment: 75%‐80% of the randomised participants were included in the analyses. There was a high dropout rate (79%‐83% of randomised participants completed the study), however, the dropout rate was balanced between groups. The reasons for dropouts were balanced among the intervention groups. Inappropriate method of imputing missing data was used (LOCF). Analyses based on per protocol population |
| Incomplete outcome data (attrition bias) HbA1c | High risk |
Quote from publication: "Per protocol (PP) population: included patients in the ITT population with more than 24 weeks of treatment, with no major protocol violations, and who underwent the final valid assessment of the primary efficacy variable HbA1c within 7 days after the last dose of study drug and either (i) completed more than 48 weeks of treatment or (ii) had < 48 weeks of treatment but discontinued from study drug because of unsatisfactory therapeutic response." "The analysis of the primary and secondary efficacy variables were based on the PP population." "For analysis, the last available post‐baseline assessment (last observation carried forward; LOCF) was used." Comment: 75%‐80% of the randomised participants were included in the analyses. There was a high dropout rate (79%‐83% of randomised participants completed the study), however, the dropout rate was balanced between groups. The reasons for dropouts were balanced among the intervention groups. Inappropriate method of imputing missing data was used (LOCF). Analyses based on per protocol population |
| Selective reporting (reporting bias) | High risk | Comment: discrepancy between protocol (ClinicalTrials.gov) and full article. Of outcomes of interest in the review, the full article has change in body weight as a secondary outcome. Change in body weight is not mentioned in the protocol |
| Other bias | Unclear risk | Comment: the trial received funding from a pharmaceutical company and some authors have received payment from a pharmaceutical company |
Gallwitz 2012a.
| Methods |
Study design: open‐label, randomised, controlled study Randomisation ratio: 1:1 to receive exenatide or glimepiride in addition to metformin Non‐inferiority design and superiority design: non‐inferiority of exenatide to glimepiride if the 97.5% CI for the hazard ratio, with a Cox proportional hazards model with baseline HbA1c as covariate, excluded 1.25, thus rejecting the hypothesis that risk of treatment failure with exenatide was > 25% greater than that with glimepiride. If non‐inferiority was shown, we tested superiority with 95% CI (excluding 1) |
|
| Participants |
Inclusion criteria: aged 18‐85 years of age, T2DM as defined by WHO criteria, have been on stable metformin MTD (either immediate or extended‐release), with suboptimal glycaemic control evident from HbA1c ≥ 6.5% and ≤ 9.0%. Body weight had to be stable (not > 10% variation) for the previous 3 months and BMI had to be ≥ 25 kg/m² and < 40 kg/m² Exclusion criteria: previous or current malignancy, active, symptomatic proliferative retinopathy or macular oedema, liver or gastrointestinal disease, renal failure, previously been treated with TZDs, insulin, alpha‐glucosidase inhibitors, SUs or meglitinides Diagnostic criteria: WHO criteria |
|
| Interventions |
Number of study centres: 128 Run‐in period: no Extension period: yes, participants who experience treatment failure and, thus, reach the primary end point will be entered into an extension period of the study. Participants who were initially randomised to exenatide will be re‐randomised to further add‐on treatment (third‐line) with either glimepiride or pioglitazone, and participants initially randomised to glimepiride will receive add‐on treatment with exenatide |
|
| Outcomes | Composite outcome measures reported: no | |
| Study details |
Trial terminated early: no Trial ID:NCT00359762 |
|
| Publication details |
Language of publication: English Funding: commercial funding by Eli Lilly and Co; Amylin Pharmaceuticals Publication status: peer‐reviewed journal |
|
| Stated aim for study | Quote from publication: "We aimed to assess durability of glycaemic control achieved with GLP‐1 receptor agonist exenatide twice a day and sulphonylurea glimepiride in patients with type 2 diabetes inadequately controlled by metformin alone." | |
| Notes | ‐ | |
| Risk of bias | ||
| Bias | Authors' judgement | Support for judgement |
| Random sequence generation (selection bias) | Low risk |
Quote from publication: "We used a computer‐generated randomisation sequence to randomly assign patients... Before database lock the study team were masked to group assignment and statistical analyses were planned with no knowledge of groups." Comment: adequate generation of random sequence ensured |
| Allocation concealment (selection bias) | Low risk |
Quote from publication: "We used a computer‐generated randomisation sequence to randomly assign patients... Before database lock the study team were masked to group assignment and statistical analyses were planned with no knowledge of groups." Comment: adequate concealment ensured |
| Blinding of participants and personnel (performance bias) all‐cause/cardiovascular mortality | Low risk |
Quote from publication: "... open‐label..." Comment: investigator‐assessed outcome measurement. Incomplete blinding, the outcome is unlikely to be influenced by lack of blinding |
| Blinding of participants and personnel (performance bias) hypoglycaemia | High risk |
Quote from publication: "... open‐label..." Comment: self‐reported outcome measurement. Incomplete blinding, the outcome is likely to be influenced by lack of blinding |
| Blinding of participants and personnel (performance bias) non‐fatal myocardial infarction/heart failure/non‐fatal stroke | Low risk |
Quote from publication: "... open‐label..." Comment: investigator‐assessed outcome measurement. Incomplete blinding, the outcome is unlikely to be influenced by lack of blinding |
| Blinding of participants and personnel (performance bias) non‐serious adverse events | High risk |
Quote from publication: "... open‐label..." Comment: self‐reported outcome measurement. Incomplete blinding, the outcome is likely to be influenced by lack of blinding |
| Blinding of participants and personnel (performance bias) serious adverse events | Low risk |
Quote from publication: "... open‐label..." Comment: investigator‐assessed outcome measurement. Incomplete blinding, the outcome is unlikely to be influenced by lack of blinding |
| Blinding of participants and personnel (performance bias) weight (kg) | High risk |
Quote from publication: "... open‐label..." Comment: investigator‐assessed outcome measurement. Incomplete blinding, the outcome is likely to be influenced by lack of blinding |
| Blinding of participants and personnel (performance bias) HbA1c | Low risk |
Quote from publication: "... open‐label..." Comment: investigator‐assessed outcome measurement. Incomplete blinding, the outcome is unlikely to be influenced by lack of blinding |
| Blinding of outcome assessment (detection bias) all‐cause/cardiovascular mortality | Low risk |
Quote from publication: "... open‐label..." Comment: investigator‐assessed outcome measurement. Incomplete blinding, the outcome is unlikely to be influenced by lack of blinding |
| Blinding of outcome assessment (detection bias) hypoglycaemia | High risk |
Quote from publication: "... open‐label..." Comment: self‐reported outcome measurement. Incomplete blinding, the outcome is likely to be influenced by lack of blinding |
| Blinding of outcome assessment (detection bias) non‐fatal myocardial infarction/heart failure/non‐fatal stroke | Low risk |
Quote from publication: "... open‐label..." Comment: investigator‐assessed outcome measurement. Incomplete blinding, the outcome is unlikely to be influenced by lack of blinding |
| Blinding of outcome assessment (detection bias) non‐serious adverse events | High risk |
Quote from publication: "... open‐label..." Comment: self‐reported outcome measurement. Incomplete blinding, the outcome is likely to be influenced by lack of blinding |
| Blinding of outcome assessment (detection bias) serious adverse events | Low risk |
Quote from publication: "... open‐label..." Comment: investigator‐assessed outcome measurement. Incomplete blinding, the outcome is unlikely to be influenced by lack of blinding |
| Blinding of outcome assessment (detection bias) weight (kg) | High risk |
Quote from publication: "... open‐label..." Comment: investigator‐assessed outcome measurement. Incomplete blinding, the outcome is likely to be influenced by lack of blinding |
| Blinding of outcome assessment (detection bias) HbA1c | Low risk |
Quote from publication: "... open‐label..." Comment: investigator‐assessed outcome measurement. Incomplete blinding, the outcome is unlikely to be influenced by lack of blinding |
| Incomplete outcome data (attrition bias) all‐cause/cardiovascular mortality | Low risk |
Quote from publication: "ITT Safety Population: Enrolled patients receiving at least one dose of study medication..." Comment: > 99% of randomised participants were included in the analyses. There was a high dropout rate (66%‐75% of randomised participants completed the study), however, the dropout rate was balanced between groups. We assumed that trial authors searched registers for mortality status at the end of the trial |
| Incomplete outcome data (attrition bias) hypoglycaemia | Low risk |
Quote from publication: "ITT Safety Population: Enrolled patients receiving at least one dose of study medication..." Comment: > 99% of the randomised participants were included in the analyses. There was a high dropout rate (66%‐75% of randomised participants completed the study), however, the dropout rate was balanced between groups. The reasons for dropouts were not balanced among the intervention groups (in the exenatide group more discontinued the trial due to adverse events). No information on imputation method. The proportion of missing outcomes compared with observed event risk was not enough to induce clinically relevant bias in intervention effect estimate |
| Incomplete outcome data (attrition bias) non‐fatal myocardial infarction/heart failure/non‐fatal stroke | High risk |
Quote from publication: "ITT Safety Population: Enrolled patients receiving at least one dose of study medication..." Comment: > 99% of the randomised participants were included in the analyses. There was a high dropout rate (66%‐75% of randomised participants completed the study), however, the dropout rate was balanced between groups. The reasons for dropouts were not balanced among the intervention groups (in the exenatide group more discontinued trial due to adverse events). No information on imputation method. The proportion of missing outcomes compared with observed event risk was enough to induce clinically relevant bias in intervention effect estimate |
| Incomplete outcome data (attrition bias) non‐serious adverse events | Low risk |
Quote from publication: "ITT Safety Population: Enrolled patients receiving at least one dose of study medication..." Comment: > 99% of the randomised participants were included in the analyses. There was a high dropout rate (66%‐75% of randomised participants completed the study), however, the dropout rate was balanced between groups. The reasons for dropouts were not balanced among the intervention groups (in the exenatide group more discontinued trial due to adverse events). No information on imputation method. The proportion of missing outcomes compared with observed event risk was not enough to induce clinically relevant bias in intervention effect estimate |
| Incomplete outcome data (attrition bias) serious adverse events | High risk |
Quote from publication: "ITT Safety Population: Enrolled patients receiving at least one dose of study medication..." Comment: > 99% of the randomised participants were included in the analyses. There was a high dropout rate (66%‐75% of randomised participants completed the study), however, the dropout rate was balanced between groups. The reasons for dropouts were not balanced among the intervention groups (in the exenatide group more discontinued trial due to adverse events). No information on imputation method. The proportion of missing outcomes compared with observed event risk was enough to induce clinically relevant bias in intervention effect estimate |
| Incomplete outcome data (attrition bias) weight (kg) | High risk |
Quote from publication: "ITT Safety Population: Enrolled patients receiving at least one dose of study medication in Study Period II with patients analyzed according to treatment actually received. The analysis included only time points up to that week where at least 25% of the originally enrolled population was still in the study. Missing data at Year 3 was not imputed." Comment: 35%‐39% of the randomised participants were included in the analyses. There was a high dropout rate (66%‐75% of randomised participants completed the study), however, the dropout rate was balanced between groups. The reasons for dropouts were not balanced among the intervention groups (in the exenatide group more discontinued trial due to adverse events). No imputation method. Plausible effect size among missing outcomes is enough to induce clinically relevant bias in observed effect size |
| Incomplete outcome data (attrition bias) HbA1c | Unclear risk |
Quote from publication: "Intention to treat... only randomly assigned patients receiving at least one dose of study treatment, and with baseline and at least one post‐baseline HbA1c measurement were included." "Change in HbA1c from baseline to endpoint. Endpoint for HbA1c was defined as the HbA1c measured at the treatment failure for patients reaching primary endpoint and was the last observation in study period II for other patients (either followed until the end of the study period II or discontinuing the study)." Comment: 94% of the randomised participants were included in the analyses. There was a high dropout rate (66%‐75% of randomised participants completed the study), however, the dropout rate was balanced between groups. The reasons for dropouts were not balanced among the intervention groups (in the exenatide group more discontinued trial due to adverse events). LOCF used. Plausible effect size among missing outcomes is not enough to induce clinically relevant bias in observed effect size |
| Selective reporting (reporting bias) | Low risk | Comment: all of the trial's primary and secondary outcomes as specified in the protocol have been reported |
| Other bias | Unclear risk | Comment: the trial was funded by a pharmaceutical company |
Gallwitz 2012b.
| Methods |
Study design: randomised, double‐blind, double‐dummy, parallel‐group, active‐controlled, non‐inferiority trial Randomisation ratio: 1:1 to receive linagliptin or glimepiride in addition to metformin Non‐inferiority design: 1‐sided confidence interval |
|
| Participants |
Inclusion criteria: aged 18–80 years, T2DM, receiving metformin at a stable dose of ≥1500 mg/day (or a MTD < 1500 mg/day) alone or with one other oral antidiabetic drug, HbA1c 6.5%–10% (on metformin alone) or 6%–9% (on metformin and 1 additional oral antidiabetic drug), BMI ≤ 40 kg/m² irrespective of ethnicity Exclusion criteria: diagnoses of MI, stroke, or transient ischaemic attack in the 6 months before screening, impaired hepatic function at screening, and treatment with rosiglitazone, pioglitazone, a glucagon‐like peptide 1 analogue or agonist, insulin, or an anti‐obesity drug in the 3 months before screening Diagnostic criteria: not reported |
|
| Interventions |
Number of study centres: 209 Run‐in period: participants receiving metformin monotherapy entered a 2‐week open‐label placebo run‐in period. Those receiving metformin and 1 additional oral antidiabetic drug entered a 6‐week washout period followed by the 2‐week open‐label placebo run‐in Extension period: no |
|
| Outcomes | Composite outcome measures reported: yes, composite outcome of target HbA1c < 7% with no hypoglycaemia and no weight gain over 2 years | |
| Study details |
Trial terminated early: no Trial ID:NCT00622284 |
|
| Publication details |
Language of publication: English Funding: commercial funding by Boehringer Ingelheim Publication status: peer‐reviewed journal |
|
| Stated aim for study | Quote from publication: "The aim of this hypothesis‐driven study was to assess the long‐term efficacy and safety of linagliptin compared with a commonly used sulphonylurea (glimepiride) as second‐line treatment in participants with type 2 diabetes inadequately controlled on metformin. Additionally, as part of a large phase 3 programme, this study prospectively assessed cardiovascular safety." | |
| Notes | ‐ | |
| Risk of bias | ||
| Bias | Authors' judgement | Support for judgement |
| Random sequence generation (selection bias) | Low risk |
Quote from publication: "Treatment assignment was done with a computer generated random sequence... Assignment used a central interactive voice or web response system with randomisation codes generated by the study sponsor. Study investigators and participants were masked to treatment assignment for the duration of the trial. Placebo and active treatments were identical in appearance. Only dedicated personnel could access the randomisation codes for treatment assignment, and could provide access in an emergency only" Comment: adequate generation of random sequence ensured |
| Allocation concealment (selection bias) | Low risk |
Quote from publication: "Treatment assignment was done with a computer generated random sequence... Assignment used a central interactive voice or web response system with randomisation codes generated by the study sponsor. Study investigators and participants were masked to treatment assignment for the duration of the trial. Placebo and active treatments were identical in appearance. Only dedicated personnel could access the randomisation codes for treatment assignment, and could provide access in an emergency only" Comment: adequate concealment ensured |
| Blinding of participants and personnel (performance bias) all‐cause/cardiovascular mortality | Low risk |
Quote from publication: "...Double blind, double dummy..." "Additionally, a masked independent clinical event committee prospectively reviewed all reported treatment‐emergent fatal events, suspected events of stroke, myocardial ischaemia (including myocardial infarction), admission to hospital for heart failure, stent thrombosis, and re‐vascularisation procedures. The committee members evaluated whether prespecified criteria for adjudication endpoints (cardiovascular death, stroke, myocardial infarction, and admission to hospital for unstable angina) were met." Comment: adjudicated/investigator‐assessed outcome measurement. Blinding of study personnel ensured |
| Blinding of participants and personnel (performance bias) hypoglycaemia | Low risk |
Quote from publication: "...Double blind, double dummy..." Comment: investigator‐assessed/self‐reported outcome measurement. Blinding of participant and study personnel ensured |
| Blinding of participants and personnel (performance bias) non‐fatal myocardial infarction/heart failure/non‐fatal stroke | Low risk |
Quote from publication: "...Double blind, double dummy..." "Additionally, a masked independent clinical event committee prospectively reviewed all reported treatment‐emergent fatal events, suspected events of stroke, myocardial ischaemia (including myocardial infarction), admission to hospital for heart failure, stent thrombosis, and re‐vascularisation procedures. The committee members evaluated whether prespecified criteria for adjudication endpoints (cardiovascular death, stroke, myocardial infarction, and admission to hospital for unstable angina) were met." Comment: adjudicated/investigator‐assessed outcome measurement. Blinding of study personnel ensured |
| Blinding of participants and personnel (performance bias) non‐serious adverse events | Low risk |
Quote from publication: "...Double blind, double dummy..." Comment: self‐reported outcome measurement. Blinding of participant ensured |
| Blinding of participants and personnel (performance bias) serious adverse events | Low risk |
Quote from publication: "...Double blind, double dummy..." "Additionally, a masked independent clinical event committee prospectively reviewed all reported treatment‐emergent fatal events, suspected events of stroke, myocardial ischaemia (including myocardial infarction), admission to hospital for heart failure, stent thrombosis, and re‐vascularisation procedures. The committee members evaluated whether prespecified criteria for adjudication endpoints (cardiovascular death, stroke, myocardial infarction, and admission to hospital for unstable angina) were met." Comment: adjudicated/investigator‐assessed outcome measurement. Blinding of study personnel ensured |
| Blinding of participants and personnel (performance bias) weight (kg) | Low risk |
Quote from publication: "...Double blind, double dummy..." Comment: investigator‐assessed/self‐reported outcome measurement. Blinding of participant and study personnel ensured |
| Blinding of participants and personnel (performance bias) HbA1c | Low risk |
Quote from publication: "...Double blind, double dummy..." Comment: investigator‐assessed. Blinding of study personnel ensured |
| Blinding of outcome assessment (detection bias) all‐cause/cardiovascular mortality | Low risk |
Quote from publication: "...Double blind, double dummy..." "Additionally, a masked independent clinical event committee prospectively reviewed all reported treatment‐emergent fatal events, suspected events of stroke, myocardial ischaemia (including myocardial infarction), admission to hospital for heart failure, stent thrombosis, and re‐vascularisation procedures. The committee members evaluated whether prespecified criteria for adjudication endpoints (cardiovascular death, stroke, myocardial infarction, and admission to hospital for unstable angina) were met." Comment: adjudicated/investigator‐assessed outcome measurement. Blinding of study personnel ensured |
| Blinding of outcome assessment (detection bias) hypoglycaemia | Low risk |
Quote from publication: "...Double blind, double dummy..." Comment: investigator‐assessed/self‐reported outcome measurement. Blinding of participant and study personnel ensured |
| Blinding of outcome assessment (detection bias) non‐fatal myocardial infarction/heart failure/non‐fatal stroke | Low risk |
Quote from publication: "...Double blind, double dummy..." "Additionally, a masked independent clinical event committee prospectively reviewed all reported treatment‐emergent fatal events, suspected events of stroke, myocardial ischaemia (including myocardial infarction), admission to hospital for heart failure, stent thrombosis, and re‐vascularisation procedures. The committee members evaluated whether prespecified criteria for adjudication endpoints (cardiovascular death, stroke, myocardial infarction, and admission to hospital for unstable angina) were met." Comment: adjudicated/investigator‐assessed outcome measurement. Blinding of study personnel ensured |
| Blinding of outcome assessment (detection bias) non‐serious adverse events | Low risk |
Quote from publication: "...Double blind, double dummy..." Comment: self‐reported outcome measurement. Blinding of participant ensured |
| Blinding of outcome assessment (detection bias) serious adverse events | Low risk |
Quote from publication: "...Double blind, double dummy..." "Additionally, a masked independent clinical event committee prospectively reviewed all reported treatment‐emergent fatal events, suspected events of stroke, myocardial ischaemia (including myocardial infarction), admission to hospital for heart failure, stent thrombosis, and re‐vascularisation procedures. The committee members evaluated whether prespecified criteria for adjudication endpoints (cardiovascular death, stroke, myocardial infarction, and admission to hospital for unstable angina) were met." Comment: adjudicated/investigator‐assessed outcome measurement. Blinding of study personnel ensured |
| Blinding of outcome assessment (detection bias) weight (kg) | Low risk |
Quote from publication: "...Double blind, double dummy..." Comment: investigator‐assessed/self‐reported outcome measurement. Blinding of participant and study personnel ensured |
| Blinding of outcome assessment (detection bias) HbA1c | Low risk |
Quote from publication: "...Double blind, double dummy..." Comment: investigator‐assessed. Blinding of study personnel ensured |
| Incomplete outcome data (attrition bias) all‐cause/cardiovascular mortality | Low risk |
Quote from publication: "Safety analyses were done on the treated set with descriptive statistics" "Treated set included randomised patients who received at least one dose of treatment." Comment: > 99% of randomised participants were included in the analyses. There was a high dropout rate (77% of randomised participants completed the study), however, the dropout rate was balanced between groups. We assumed that trial authors searched registers for mortality status at the end of the trial |
| Incomplete outcome data (attrition bias) hypoglycaemia | High risk |
Quote from publication: "Safety analyses were done on the treated set with descriptive statistics" "Treated set included randomised patients who received at least one dose of treatment." Comment: > 99% of the participants were included in the analyses. There was a high dropout rate (77% of the participants completed the study), however, the dropout rate was balanced between groups. We do not know how the trial authors imputed missing data from the participants not completing the study. The reasons for dropouts were not balanced (more dropouts in the linagliptin group due to lack of efficacy and more dropouts in the glimepiride group due to adverse events) |
| Incomplete outcome data (attrition bias) non‐fatal myocardial infarction/heart failure/non‐fatal stroke | High risk |
Quote from publication: "Safety analyses were done on the treated set with descriptive statistics" "Treated set included randomised patients who received at least one dose of treatment." Comment: > 99% of the participants were included in the analyses. There was a high dropout rate (77% of the participants completed the study), however, the dropout rate was balanced between groups. We do not know how the trial authors imputed missing data from the participants not completing the study. The reasons for dropouts were not balanced (more dropouts in the linagliptin group due to lack of efficacy and more dropouts in the glimepiride group due to adverse events). The proportion of missing outcomes compared with observed event risk was enough to induce clinically relevant bias in intervention effect estimate |
| Incomplete outcome data (attrition bias) non‐serious adverse events | Low risk |
Quote from publication: "Safety analyses were done on the treated set with descriptive statistics" "Treated set included randomised patients who received at least one dose of treatment." Comment: > 99% of the participants were included in the analyses. There was a high dropout rate (77% of the participants completed the study), however, the dropout rate was balanced between groups. We do not know how the trial authors imputed missing data from the participants not completing the study. The reasons for dropouts were not balanced (more dropouts in the linagliptin group due to lack of efficacy and more dropouts in the glimepiride group due to adverse events). The proportion of missing outcomes compared with observed event risk was not enough to induce clinically relevant bias in intervention effect estimate |
| Incomplete outcome data (attrition bias) serious adverse events | High risk |
Quote from publication: "Safety analyses were done on the treated set with descriptive statistics" "Treated set included randomised patients who received at least one dose of treatment." Comment: > 99% of the participants were included in the analyses. There was a high dropout rate (77% of the participants completed the study), however, the dropout rate was balanced between groups. We do not know how the trial authors imputed missing data from the participants not completing the study. The reasons for dropouts were not balanced (more dropouts in the linagliptin group due to lack of efficacy and more dropouts in the glimepiride group due to adverse events). The proportion of missing outcomes compared with observed event risk was enough to induce clinically relevant bias in intervention effect estimate |
| Incomplete outcome data (attrition bias) weight (kg) | Unclear risk |
Quote from publication: "This population includes the FAS (full analysis set) further restricted to patients with a baseline body weight and one on‐treatment body weight measurement. Last observation carried forward (LOCF) was used as imputation rule." Comment: > 93% of the participants were included in the analyses. There was a high dropout rate (77% of the participants completed the study), however, the dropout rate was balanced between groups. The reasons for dropouts were not balanced (more dropouts in the linagliptin group due to lack of efficacy and more dropouts in the glimepiride group due to adverse events). Inappropriate method of imputation missing data was used (LOCF). Plausible effect size among missing outcomes was not enough to induce clinically relevant bias in observed effect size |
| Incomplete outcome data (attrition bias) HbA1c | High risk |
Quote from publication: "The Full Analysis Set (FAS) included all treated and randomized patients with a baseline and at least one on‐treatment HbA1c measurement. Last observation carried forward (LOCF) was used as imputation rule." Comment: > 97% of the participants were included in the analyses. There was a high dropout rate (77% of the participants completed the study), however, the dropout rate was balanced between groups. The reasons for dropouts were not balanced (more dropouts in the linagliptin group due to lack of efficacy and more dropouts in the glimepiride group due to adverse events). Inappropriate method of imputation missing data was used (LOCF). |
| Selective reporting (reporting bias) | Low risk | Comment: all of the trial's primary and secondary outcomes as specified in the protocol have been reported |
| Other bias | High risk | Comment: the trial was funded by a pharmaceutical company. The sponsor was involved in study design, data collection, data review, and data analysis |
Gerich 2005.
| Methods |
Study design: randomised, multicentre, double‐blind, active‐controlled study Randomisation ratio: 1:1 to receive glyburide or nateglinide in addition to metformin |
|
| Participants |
Inclusion criteria: men and women, T2DM, inadequately controlled by diet and exercise, drug naive, aged 18–77 years, baseline hbA1C ≥ 7.0% and ≤ 11.0%, FPG ≤ 15 mmol/L, BMI between 22‐45 kg/m². Women of childbearing potential were required to practice a medically approved birth control method Exclusion criteria: T1DM or any secondary forms of diabetes, symptomatic hyperglycaemia with > 10% weight loss in the previous 8 weeks, abnormal renal function or significant diabetes complications, history of lactic acidosis or congestive heart failure requiring pharmacologic treatment, liver disease or persistent elevations (2 x ULN) of liver enzymes or other medical conditions that could interfere with interpretation of results or pose significant risk to the participant Diagnostic criteria: not reported |
|
| Interventions |
Number of study centres: 102 Run‐in period: 4 weeks maintenance period Extension period: no |
|
| Outcomes | Composite outcome measures reported: no | |
| Study details |
Trial terminated early: no Trial ID:CDJN608A US07 |
|
| Publication details |
Language of publication: English Funding: commercial funding, Novartis Pharmaceuticals Publication status: peer‐reviewed journal |
|
| Stated aim for study | Quote from publication: "To compare long‐term efficacy and safety of initial combination therapy with nateglinide/metformin versus glyburide/metformin." | |
| Notes | ‐ | |
| Risk of bias | ||
| Bias | Authors' judgement | Support for judgement |
| Random sequence generation (selection bias) | Unclear risk |
Quote from publication: "Patients were then randomized..." Comment: insufficient information about the sequence generation process |
| Allocation concealment (selection bias) | Unclear risk |
Quote from publication: "Patients were then randomized..." Comment: insufficient information about the allocation concealment |
| Blinding of participants and personnel (performance bias) all‐cause/cardiovascular mortality | Low risk |
Quote from publication: "double‐blind" "The blind was maintained by the use of matching placebo for nateglinide and glyburide" Comment: investigator‐assessed outcome measurement. Blinding of key study personnel ensured |
| Blinding of participants and personnel (performance bias) hypoglycaemia | Low risk |
Quote from publication: "double‐blind" "The blind was maintained by the use of matching placebo for nateglinide and glyburide" Comment: investigator‐assessed/self‐reported outcome measurement. Blinding of participant and key study personnel ensured |
| Blinding of participants and personnel (performance bias) serious adverse events | Low risk |
Quote from publication: "double‐blind" "The blind was maintained by the use of matching placebo for nateglinide and glyburide" Comment: investigator‐assessed outcome measurement. Blinding of key study personnel ensured |
| Blinding of participants and personnel (performance bias) weight (kg) | Low risk |
Quote from publication: "double‐blind" "The blind was maintained by the use of matching placebo for nateglinide and glyburide" Comment: investigator‐assessed/self‐reported outcome measurement. Blinding of participant and key study personnel ensured |
| Blinding of participants and personnel (performance bias) HbA1c | Low risk |
Quote from publication: "double‐blind" "The blind was maintained by the use of matching placebo for nateglinide and glyburide" Comment: investigator‐assessed outcome measurement. Blinding of key study personnel ensured |
| Blinding of outcome assessment (detection bias) all‐cause/cardiovascular mortality | Low risk |
Quote from publication: "double‐blind" "The blind was maintained by the use of matching placebo for nateglinide and glyburide" Comment: investigator‐assessed outcome measurement. Blinding of outcome assessor ensured |
| Blinding of outcome assessment (detection bias) hypoglycaemia | Low risk |
Quote from publication: "double‐blind" "The blind was maintained by the use of matching placebo for nateglinide and glyburide" Comment: investigator‐assessed/self‐reported outcome measurement. Blinding of outcome assessor ensured |
| Blinding of outcome assessment (detection bias) serious adverse events | Low risk |
Quote from publication: "double‐blind" "The blind was maintained by the use of matching placebo for nateglinide and glyburide" Comment: investigator‐assessed outcome measurement. Blinding of outcome assessor ensured |
| Blinding of outcome assessment (detection bias) weight (kg) | Low risk |
Quote from publication: "double‐blind" "The blind was maintained by the use of matching placebo for nateglinide and glyburide" Comment: investigator‐assessed/self‐reported outcome measurement. Blinding of outcome assessor ensured |
| Blinding of outcome assessment (detection bias) HbA1c | Low risk |
Quote from publication: "double‐blind" "The blind was maintained by the use of matching placebo for nateglinide and glyburide" Comment: investigator‐assessed outcome measurement. Blinding of outcome assessor ensured |
| Incomplete outcome data (attrition bias) all‐cause/cardiovascular mortality | Low risk |
Quote from publication: "Received study drug (safety population)" Comment: 100% of randomised participants were included in the analysis. There was a high dropout rate (58%‐64% of randomised participants completed the study), however, the dropout rate was balanced between groups. No information on imputation method. We assumed that trial authors searched registers for mortality status at the end of the trial |
| Incomplete outcome data (attrition bias) hypoglycaemia | High risk |
Quote from publication: "Received study drug (safety population)" Comment: 100% of randomised participants were included in the analysis. There was a high dropout rate (58%‐64% of randomised participants completed the study), however, the dropout rate was balanced between groups. The reasons for dropouts were balanced among the intervention groups. No information on imputation method. The proportion of missing outcomes compared with observed event risk was enough to induce clinically relevant bias in intervention effect estimate |
| Incomplete outcome data (attrition bias) serious adverse events | High risk |
Quote from publication: "Received study drug (safety population)" Comment: 100% of randomised participants were included in the analysis. There was a high dropout rate (58%‐64% of randomised participants completed the study), however, the dropout rate was balanced between groups. The reasons for dropouts were balanced among the intervention groups. No information on imputation method. The proportion of missing outcomes compared with observed event risk was enough to induce clinically relevant bias in intervention effect estimate |
| Incomplete outcome data (attrition bias) weight (kg) | High risk |
Quote from publication: "Secondary efficacy variables... in the ITT population, with last observation carried forward." Comment: 95% of the randomised participants were included in the analyses. There was a high dropout rate (58%‐64% of randomised participants completed the study), however, the dropout rate was balanced between groups. The reasons for dropouts were balanced among the intervention groups. Inappropriate method of imputing missing data was used (LOCF). Plausible effect size among missing outcomes was enough to induce clinically relevant bias in observed effect size |
| Incomplete outcome data (attrition bias) HbA1c | High risk |
Quote from publication: "The primary efficacy variable... in the intent‐to‐treat (ITT) population with last observation carried forward." Comment: 95% of the randomised participants were included in the analyses. There was a high dropout rate (58%‐64% of randomised participants completed the study), however, the dropout rate was balanced between groups. The reasons for dropouts were balanced among the intervention groups. Inappropriate method of imputing missing data was used (LOCF). Plausible effect size among missing outcomes was enough to induce clinically relevant bias in observed effect size |
| Selective reporting (reporting bias) | High risk | Comment: no protocol available. According to Novartis trial document the safety assessments consisted of recording major adverse cardiac events (MACE). No results for MACE are reported |
| Other bias | Unclear risk | Comment: the trial received funding from a pharmaceutical company |
Göke 2013.
| Methods |
Study design: phase 3b, international, multicentre, randomised, parallel‐group, active‐controlled, double‐blind, double‐dummy, non‐inferiority trial Randomisation ratio: 1:1 to receive saxagliptin or glipizide in addition to metformin Non‐inferiority design |
|
| Participants |
Inclusion criteria: men and women aged ≥ 18 years with T2DM and HbA1c > 6.5%–10.0% on a stable dose of metformin monotherapy ≥ 1500 mg/day for at least 8 weeks prior to enrolment Exclusion criteria: T1DM; history of diabetic ketoacidosis or hyperosmolar non‐ketotic coma; insulin therapy within 1 year of enrolment; treatment with a thiazolidinedione within the 12 weeks prior to enrolment; treatment with systemic glucocorticoids other than replacement therapy; previous DPP‐4 inhibitor treatment; donation of blood, plasma or platelets within the 3 months prior to enrolment; congestive heart failure defined as NYHA class III‐IV and/or known left ventricular ejection fraction ≤ 40%; significant cardiovascular history within the past 6 months defined as MI, coronary angioplasty or bypass graft(s), valvular disease or repair, unstable angina pectoris, transient ischaemic attack or cerebrovascular accident; history of haemoglobinopathies; significant alcohol or drug abuse within the year prior to enrolment; treatment with HIV/antiviral drugs or cytochrome P450 3A4‐inducers; serum creatinine ≥ 1.5 mg⁄ dL (≥ 133 μmol/L) for men or ≥ 1.4 mg/dL (≥ 124 μmol/L) for women; active liver disease and/or significant abnormal liver function (AST > 2 x ULN and/or ALT > 2 x ULN and/or total bilirubin > 2.0 mg/ dL (> 34 μmol / L)) or any clinically significant laboratory abnormality upon screening Diagnostic criteria: not reported |
|
| Interventions |
Number of study centres: 130 Run‐in period: 2‐week single‐blind, placebo‐controlled lead‐in period that included advice on diet and exercise Extension period: yes, 52‐week extension receiving the same double‐blind and background treatment |
|
| Outcomes | Composite outcome measures reported: yes, composite outcome measure of participants reaching the therapeutic goal (HbA1c < 7% observed at week 104 in participants with HbA1c ≥ 7% at baseline) without hypoglycaemic episodes and without weight gain (i.e. weight increase < 2% from baseline, calculated using LOCF methods) | |
| Study details |
Trial terminated early: no Trial ID:NCT00575588 |
|
| Publication details |
Language of publication: English Funding: commercial funding by Bristol‐Myers Squibb and AstraZeneca Publication status: peer‐reviewed journal |
|
| Stated aim for study | Quote from publication: "To compare the long‐term safety, tolerability and efficacy of saxagliptin vs. glipizide as add‐on therapy to metformin" | |
| Notes | ‐ | |
| Risk of bias | ||
| Bias | Authors' judgement | Support for judgement |
| Random sequence generation (selection bias) | Low risk |
Quote from publication: "... eligible patients were randomised (1 : 1) via an interactive Web‐response system using a balanced block randomisation schedule... " Comment: adequate generation of random sequence ensured |
| Allocation concealment (selection bias) | Low risk |
Quote from publication: "... eligible patients were randomised (1 : 1) via an interactive Web‐response system using a balanced block randomisation schedule... " Comment: adequate concealment ensured |
| Blinding of participants and personnel (performance bias) all‐cause/cardiovascular mortality | Low risk |
Quote from publication: "... double‐blind..." "Blinding was ensured using a double‐dummy technique." Comment: investigator‐assessed outcome measurement. Blinding of study personnel ensured |
| Blinding of participants and personnel (performance bias) hypoglycaemia | Low risk |
Quote from publication: "... double‐blind..." "Blinding was ensured using a double‐dummy technique." Comment: self‐reported outcome measurement. Blinding of participant ensured |
| Blinding of participants and personnel (performance bias) non‐fatal myocardial infarction/heart failure/non‐fatal stroke | Low risk |
Quote from publication: "... double‐blind..." "Blinding was ensured using a double‐dummy technique." Comment: investigator‐assessed outcome measurement. Blinding of study personnel ensured |
| Blinding of participants and personnel (performance bias) non‐serious adverse events | Low risk |
Quote from publication: "... double‐blind..." "Blinding was ensured using a double‐dummy technique." Comment: self‐reported outcome measurement. Blinding of participant ensured |
| Blinding of participants and personnel (performance bias) serious adverse events | Low risk |
Quote from publication: "... double‐blind..." "Blinding was ensured using a double‐dummy technique." Comment: investigator‐assessed outcome measurement. Blinding of study personnel ensured |
| Blinding of participants and personnel (performance bias) weight (kg) | Low risk |
Quote from publication: "... double‐blind..." "Blinding was ensured using a double‐dummy technique." Comment: investigator‐assessed. Blinding of study personnel ensured |
| Blinding of participants and personnel (performance bias) HbA1c | Low risk |
Quote from publication: "... double‐blind..." "Blinding was ensured using a double‐dummy technique." Comment: investigator‐assessed outcome measurement. Blinding of study personnel ensured |
| Blinding of outcome assessment (detection bias) all‐cause/cardiovascular mortality | Low risk |
Quote from publication: "... double‐blind..." "Blinding was ensured using a double‐dummy technique." Comment: investigator‐assessed outcome measurement. Blinding of study personnel ensured |
| Blinding of outcome assessment (detection bias) hypoglycaemia | Low risk |
Quote from publication: "... double‐blind..." "Blinding was ensured using a double‐dummy technique." Comment: self‐reported outcome measurement. Blinding of participant ensured |
| Blinding of outcome assessment (detection bias) non‐fatal myocardial infarction/heart failure/non‐fatal stroke | Low risk |
Quote from publication: "... double‐blind..." "Blinding was ensured using a double‐dummy technique." Comment: investigator‐assessed outcome measurement. Blinding of study personnel ensured |
| Blinding of outcome assessment (detection bias) non‐serious adverse events | Low risk |
Quote from publication: "... double‐blind..." "Blinding was ensured using a double‐dummy technique." Comment: self‐reported outcome measurement. Blinding of participant ensured |
| Blinding of outcome assessment (detection bias) serious adverse events | Low risk |
Quote from publication: "... double‐blind..." "Blinding was ensured using a double‐dummy technique." Comment: investigator‐assessed outcome measurement. Blinding of study personnel ensured |
| Blinding of outcome assessment (detection bias) weight (kg) | Low risk |
Quote from publication: "... double‐blind..." "Blinding was ensured using a double‐dummy technique." Comment: investigator‐assessed. Blinding of study personnel ensured |
| Blinding of outcome assessment (detection bias) HbA1c | Low risk |
Quote from publication: "... double‐blind..." "Blinding was ensured using a double‐dummy technique." Comment: investigator‐assessed outcome measurement. Blinding of study personnel ensured |
| Incomplete outcome data (attrition bias) all‐cause/cardiovascular mortality | Low risk |
Quote from publication: "Safety and tolerability were analysed using descriptive statistics in all patients who took ≥ 1 dose of study drug" Comment: 100% of randomised participants were included in the analyses. There was a high dropout rate (34%‐37% of randomised participants completed the study), however, the dropout rate was balanced between groups. We assumed that trial authors searched registers for mortality status at the end of the trial |
| Incomplete outcome data (attrition bias) hypoglycaemia | High risk |
Quote from publication: "Safety and tolerability were analysed using descriptive statistics in all patients who took ≥ 1 dose of study drug" Comment: 100% of the participants were included in the analyses. There was a high dropout rate (34%‐37% of the participants completed the study), however, the dropout rate was balanced between groups. We do not know how the trial authors imputed missing data from the participants not completing the study. The reasons for dropouts were balanced. The proportion of missing outcomes compared with observed event risk was enough to induce clinically relevant bias in intervention effect estimate |
| Incomplete outcome data (attrition bias) non‐fatal myocardial infarction/heart failure/non‐fatal stroke | High risk |
Quote from publication: "Safety and tolerability were analysed using descriptive statistics in all patients who took ≥ 1 dose of study drug" Comment: 100% of the participants were included in the analyses. There was a high dropout rate (34%‐37% of the participants completed the study), however, the dropout rate was balanced between groups. We do not know how the trial authors imputed missing data from the participants not completing the study. The reasons for dropouts were balanced. The proportion of missing outcomes compared with observed event risk was enough to induce clinically relevant bias in intervention effect estimate |
| Incomplete outcome data (attrition bias) non‐serious adverse events | High risk |
Quote from publication: "Safety and tolerability were analysed using descriptive statistics in all patients who took ≥ 1 dose of study drug" Comment: 100% of the participants were included in the analyses. There was a high dropout rate (34%‐37% of the participants completed the study), however, the dropout rate was balanced between groups. We do not know how the trial authors imputed missing data from the participants not completing the study. The reasons for dropouts were balanced. The proportion of missing outcomes compared with observed event risk was enough to induce clinically relevant bias in intervention effect estimate |
| Incomplete outcome data (attrition bias) serious adverse events | High risk |
Quote from publication: "Safety and tolerability were analysed using descriptive statistics in all patients who took ≥ 1 dose of study drug" Comment: 100% of the participants were included in the analyses. There was a high dropout rate (34%‐37% of the participants completed the study), however, the dropout rate was balanced between groups. We do not know how the trial authors imputed missing data from the participants not completing the study. The reasons for dropouts were balanced. The proportion of missing outcomes compared with observed event risk was enough to induce clinically relevant bias in intervention effect estimate |
| Incomplete outcome data (attrition bias) weight (kg) | High risk |
Quote from publication: "Efficacy variables were analysed in the full analysis set, defined as all randomised patients who received ≥ 1 dose of randomised study drug and had ≥ 1 non‐missing baseline and ≥ 1 post baseline efficacy data assessment." "Number of subjects with observed values at week 104 was N=186 for saxagliptin + metformin and N=165 for glipizide + metformin" Comment: > 99% of the randomised participants were included in the analyses. 38%‐43% of the randomised participants had observed values at week 104. Unknown, how the missing data were imputed. Plausible effect size among missing outcomes was enough to induce clinically relevant bias in observed effect size |
| Incomplete outcome data (attrition bias) HbA1c | High risk |
Quote from publication: "Efficacy variables were analysed in the full analysis set, defined as all randomised patients who received ≥ 1 dose of randomised study drug and had ≥ 1 non‐missing baseline and ≥ 1 post baseline efficacy data assessment." "Number of subjects with observed values at week 104 was N=184 for saxagliptin + metformin and N=160 for glipizide + metformin" Comment: > 99% of the randomised participants were included in the analyses. 37%‐43% of the randomised participants had observed values at week 104. Unknown, how the missing data were imputed. Plausible effect size among missing outcomes enough to induce clinically relevant bias in observed effect size |
| Selective reporting (reporting bias) | Low risk | Comment: all of the trial's primary and secondary outcomes as specified in the protocol have been reported |
| Other bias | Unclear risk | Comment: the trial was funded by a pharmaceutical company |
Hamann 2008.
| Methods |
Study design: multicentre, randomised, double‐blind, parallel‐group, active‐controlled, flexible‐dose study Randomisation ratio: 2:1:1 to receive rosiglitazone/metformin fixed‐dose combination, glibenclamide + metformin and gliclazide + metformin Non‐inferiority design |
|
| Participants |
Inclusion criteria: BMI ≥ 25 kg/m², T2DM, HbA1c ≥ 7% and ≤ 10% having received metformin ( ≥ 0.85 g/day) for at least 8 weeks prior to screening Exclusion criteria: had used any oral antidiabetic drug other than metformin in the prior 12 weeks, or insulin at any time other than during pregnancy or for emergency treatment, history of metabolic acidosis, oedema requiring pharmacological treatment (either ongoing or within the prior 12 months), anaemia (haemoglobin < 11.0 g/dL for men and < 10.0 g/dL for women), renal or hepatic disease, known congestive heart failure (all NYHA grades), unstable or severe angina, or a history of MI, percutaneous transluminal coronary angioplasty, coronary artery bypass graft or cerebrovascular accident within 3 months, or left ventricular dysfunction within 6 months, of screening, fasting C‐peptide ≤ 0.5 nmol/L, or with systolic BP > 170 mmHg or diastolic BP > 100 mmHg while on antihypertensive medication Diagnostic criteria: WHO 1999 criteria |
|
| Interventions |
Number of study centres: 118 Run‐in period: at screening, eligible individuals currently receiving ≥ 1.5 g/day metformin entered a 4‐week, single‐blind run‐in period during which they received metformin 2 g/day. Those currently receiving < 1.5 g/day metformin underwent an additional 1‐week titration step, during which they received metformin 1.5 g/day before entering the 4‐week run‐in period of treatment with metformin 2 g/day Extension period: no |
|
| Outcomes | Composite outcome measures reported: no | |
| Study details |
Trial terminated early: no Trial ID:NCT00359112 |
|
| Publication details |
Language of publication: English Funding: commercial funding by GlaxoSmithKline Publication status: peer‐reviewed journal |
|
| Stated aim for study | Quote from publication: "... to compare rosiglitazone / metformin fixed‐dose combination therapy with combination sulphonylurea plus metformin therapy in overweight individuals with inadequately controlled type 2 diabetes mellitus." | |
| Notes | ‐ | |
| Risk of bias | ||
| Bias | Authors' judgement | Support for judgement |
| Random sequence generation (selection bias) | Low risk |
Quote from publication: "Investigators used RAMOS, a telephone‐based interactive voice response system involving computer‐generated randomization." Comment: adequate generation of random sequence ensured |
| Allocation concealment (selection bias) | Low risk |
Quote from publication: "Investigators used RAMOS, a telephone‐based interactive voice response system involving computer‐generated randomization." Comment: adequate concealment ensured |
| Blinding of participants and personnel (performance bias) all‐cause/cardiovascular mortality | Low risk |
Quote from publication: "double‐blind" Comment: investigator‐assessed outcome measurement. Blinding of study personnel ensured |
| Blinding of participants and personnel (performance bias) hypoglycaemia | Low risk |
Quote from publication: "double blind" Comment: self‐reported outcome measurement. Blinding of participant ensured |
| Blinding of participants and personnel (performance bias) non‐fatal myocardial infarction/heart failure/non‐fatal stroke | Low risk |
Quote from publication: "double‐blind" Comment: investigator‐assessed outcome measurement. Blinding of study personnel ensured |
| Blinding of participants and personnel (performance bias) non‐serious adverse events | Low risk |
Quote from publication: "double blind" Comment: self‐reported outcome measurement. Blinding of participant ensured |
| Blinding of participants and personnel (performance bias) serious adverse events | Low risk |
Quote from publication: "double‐blind" Comment: investigator‐assessed outcome measurement. Blinding of study personnel ensured |
| Blinding of participants and personnel (performance bias) weight (kg) | Low risk |
Quote from publication: "double‐blind" Comment: investigator‐assessed/self‐reported outcome measurement. Blinding of participant and study personnel ensured |
| Blinding of participants and personnel (performance bias) HbA1c | Low risk |
Quote from publication: "double‐blind" Comment: investigator‐assessed. Blinding of study personnel ensured |
| Blinding of outcome assessment (detection bias) all‐cause/cardiovascular mortality | Low risk |
Quote from publication: "double‐blind" Comment: investigator‐assessed outcome measurement. Blinding of study personnel ensured |
| Blinding of outcome assessment (detection bias) hypoglycaemia | Low risk |
Quote from publication: "double blind" Comment: self‐reported outcome measurement. Blinding of participant ensured |
| Blinding of outcome assessment (detection bias) non‐fatal myocardial infarction/heart failure/non‐fatal stroke | Low risk |
Quote from publication: "double‐blind" Comment: investigator‐assessed outcome measurement. Blinding of study personnel ensured |
| Blinding of outcome assessment (detection bias) non‐serious adverse events | Low risk |
Quote from publication: "double blind" Comment: self‐reported outcome measurement. Blinding of participant ensured |
| Blinding of outcome assessment (detection bias) serious adverse events | Low risk |
Quote from publication: "double‐blind" Comment: investigator‐assessed outcome measurement. Blinding of study personnel ensured |
| Blinding of outcome assessment (detection bias) weight (kg) | Low risk |
Quote from publication: "double‐blind" Comment: investigator‐assessed/self‐reported outcome measurement. Blinding of participant and study personnel ensured |
| Blinding of outcome assessment (detection bias) HbA1c | Low risk |
Quote from publication: "double‐blind" Comment: investigator‐assessed. Blinding of study personnel ensured |
| Incomplete outcome data (attrition bias) all‐cause/cardiovascular mortality | Low risk |
Quote from publication: "The safety population consisted of all randomized subjects who received at least one dose of double‐blind study medication." Comment: > 99% of randomised participants were included in the analyses. There was a high dropout rate (76%‐79% of randomised participants completed the study), however, the dropout rate was balanced between groups. We assumed that trial authors searched registers for mortality status at the end of the trial |
| Incomplete outcome data (attrition bias) hypoglycaemia | Low risk |
Quote from publication: "The safety population consisted of all randomized subjects who received at least one dose of double‐blind study medication." Comment: > 99% of the participants were included in the analyses. There was a high dropout rate (76%‐79% of the participants completed the study), however, the dropout rate was balanced between groups. We do not know how the trial authors imputed missing data from the participants not completing the study. The reasons for dropouts were balanced. The proportion of missing outcomes compared with observed event risk was not enough to induce clinically relevant bias in intervention effect estimate |
| Incomplete outcome data (attrition bias) non‐fatal myocardial infarction/heart failure/non‐fatal stroke | High risk |
Quote from publication: "The safety population consisted of all randomized subjects who received at least one dose of double‐blind study medication." Comment: > 99% of the participants were included in the analyses. There was a high dropout rate (76%‐79% of the participants completed the study), however, the dropout rate was balanced between groups. We do not know how the trial authors imputed missing data from the participants not completing the study. The reasons for dropouts were balanced. The proportion of missing outcomes compared with observed event risk was enough to induce clinically relevant bias in intervention effect estimate |
| Incomplete outcome data (attrition bias) non‐serious adverse events | Low risk |
Quote from publication: "The safety population consisted of all randomized subjects who received at least one dose of double‐blind study medication." Comment: > 99% of the participants were included in the analyses. There was a high dropout rate (76%‐79% of the participants completed the study), however, the dropout rate was balanced between groups. We do not know how the trial authors imputed missing data from the participants not completing the study. The reasons for dropouts were balanced. The proportion of missing outcomes compared with observed event risk was not enough to induce clinically relevant bias in intervention effect estimate |
| Incomplete outcome data (attrition bias) serious adverse events | High risk |
Quote from publication: "The safety population consisted of all randomized subjects who received at least one dose of double‐blind study medication." Comment: > 99% of the participants were included in the analyses. There was a high dropout rate (76%‐79% of the participants completed the study), however, the dropout rate was balanced between groups. We do not know how the trial authors imputed missing data from the participants not completing the study. The reasons for dropouts were balanced. The proportion of missing outcomes compared with observed event risk was enough to induce clinically relevant bias in intervention effect estimate |
| Incomplete outcome data (attrition bias) weight (kg) | Unclear risk |
Quote from publication: "The safety population consisted of all randomized subjects who received at least one dose of double‐blind study medication." Comment: > 99% of the participants were included in the analyses. There was a high dropout rate (76%‐79% of the participants completed the study), however, the dropout rate was balanced between groups. We do not know how the trial authors imputed missing data from the participants not completing the study. The reasons for dropouts were balanced. Not sure if plausible effect size among missing outcomes is enough to induce clinically relevant bias in observed effect size |
| Incomplete outcome data (attrition bias) HbA1c | Unclear risk |
Quote from publication: "The intention‐to‐treat (ITT) population consisted of all randomized subjects who received at least one dose of study medication, had a baseline assessment and at least one corresponding on‐therapy assessment for HbA 1c , FPG, C‐peptide, insulin or proinsulin." "The primary efficacy endpoint, biomarker and health outcome endpoints were evaluated in ITT without LOCF population..." Comment: 76%‐78% of the participants were included in the analyses. There was a high dropout rate (76%‐79% of the participants completed the study), however, the dropout rate was balanced between groups. No imputation used. The reasons for dropouts were balanced. Not sure if plausible effect size among missing outcomes is enough to induce clinically relevant bias in observed effect size |
| Selective reporting (reporting bias) | Low risk | Comment: all of the trial's primary and secondary outcomes as specified in the protocol have been reported |
| Other bias | Unclear risk | Comment: the trial was funded by a pharmaceutical company |
Handelsman 2017.
| Methods |
Study design: multi‐national, double‐blind, double‐dummy, randomised, active‐controlled, non‐inferiority study Randomisation ratio: 1:1 to receive omarigliptin or glimepiride in addition to metformin Non‐inferiority design |
|
| Participants |
Inclusion criteria: T2DM, ≥ 18 years of age, on a stable dose of metformin (≥ 1500 mg/day) for ≥ 12 weeks, with an HbA1c ≥ 6.5% and ≤ 9.0% at screening, and a fasting finger‐stick glucose > 7.0 mmol/L (126 mg/dL) and < 14.4 mmol/L (260 mg/dL) at randomisation Exclusion criteria: T1DM, history of ketoacidosis, active liver disease, new or worsening signs or symptoms of coronary heart disease or congestive heart failure within the past 3 months, history of malignancy or haematological disorders, previously treated with any glucose‐lowering agent other than metformin within 12 weeks prior to screening or with omarigliptin at any time prior to signing informed consent. Laboratory exclusion criteria included serum ALT or AST levels > 2‐x ULN, triglycerides > 600 mg/dL (> 6.8 mmol/L) or TSH outside the central laboratory normal range. Due to the use of metformin in the study (and varying recommendations for its use in different countries), participants with estimated GFR (based on modification of diet in renal disease formula) < 60 mL/min/1.73 m², or creatinine ≥ 1.4 mg/dL (123.8 μmol/L) (men) or ≥ 1.3 mg/dL (114.9 μmol/L) (women) were also excluded Diagnostic criteria: not reported |
|
| Interventions |
Number of study centres: 127 Run‐in period: 2‐week single‐blind placebo run‐in Extension period: no |
|
| Outcomes | Composite outcome measures reported: yes, composite end‐point of an HbA1c decrease > 0.5% with no symptomatic hypoglycaemia and no body weight gain, after 54 weeks of treatment | |
| Study details |
Trial terminated early: no Trial ID:NCT01682759 |
|
| Publication details |
Language of publication: English Funding: commercial funding by Merck & Co Publication status: peer‐reviewed journal |
|
| Stated aim for study | Quote from publication: "The primary objectives of this study were to assess the safety and tolerability of omarigliptin and to compare its efficacy with glimepiride after 54 weeks of treatment" | |
| Notes | ‐ | |
| Risk of bias | ||
| Bias | Authors' judgement | Support for judgement |
| Random sequence generation (selection bias) | Low risk |
Quote from publication: "...patients were randomised centrally, using an interactive voice response system..." Comment: adequate generation of random sequence ensured |
| Allocation concealment (selection bias) | Low risk |
Quote from publication: "...patients were randomised centrally, using an interactive voice response system..." Comment: adequate concealment ensured |
| Blinding of participants and personnel (performance bias) all‐cause/cardiovascular mortality | Low risk |
Quote from publication: "...double‐blind, double‐dummy..." Comment: investigator‐assessed outcome measurement. Blinding ensured |
| Blinding of participants and personnel (performance bias) hypoglycaemia | Low risk |
Quote from publication: "...double‐blind, double‐dummy..." Comment: investigator‐assessed/self‐reported outcome measurement. Blinding ensured |
| Blinding of participants and personnel (performance bias) non‐fatal myocardial infarction/heart failure/non‐fatal stroke | Low risk |
Quote from publication: "...double‐blind, double‐dummy..." Comment: investigator‐assessed outcome measurement. Blinding ensured |
| Blinding of participants and personnel (performance bias) non‐serious adverse events | Low risk |
Quote from publication: "...double‐blind, double‐dummy..." Comment: self‐reported outcome measurement. Blinding ensured |
| Blinding of participants and personnel (performance bias) serious adverse events | Low risk |
Quote from publication: "...double‐blind, double‐dummy..." Comment: investigator‐assessed outcome measurement. Blinding ensured |
| Blinding of participants and personnel (performance bias) weight (kg) | Low risk |
Quote from publication: "...double‐blind, double‐dummy..." Comment: investigator‐assessed outcome measurement. Blinding ensured |
| Blinding of participants and personnel (performance bias) HbA1c | Low risk |
Quote from publication: "...double‐blind, double‐dummy..." Comment: investigator‐assessed outcome measurement. Blinding ensured |
| Blinding of outcome assessment (detection bias) all‐cause/cardiovascular mortality | Low risk |
Quote from publication: "...double‐blind, double‐dummy..." Comment: investigator‐assessed outcome measurement. Blinding ensured |
| Blinding of outcome assessment (detection bias) hypoglycaemia | Low risk |
Quote from publication: "...double‐blind, double‐dummy..." Comment: investigator‐assessed/self‐reported outcome measurement. Blinding ensured |
| Blinding of outcome assessment (detection bias) non‐fatal myocardial infarction/heart failure/non‐fatal stroke | Low risk |
Quote from publication: "...double‐blind, double‐dummy..." Comment: investigator‐assessed outcome measurement. Blinding ensured |
| Blinding of outcome assessment (detection bias) non‐serious adverse events | Low risk |
Quote from publication: "...double‐blind, double‐dummy..." Comment: self‐reported outcome measurement. Blinding ensured |
| Blinding of outcome assessment (detection bias) serious adverse events | Low risk |
Quote from publication: "...double‐blind, double‐dummy..." Comment: investigator‐assessed outcome measurement. Blinding ensured |
| Blinding of outcome assessment (detection bias) weight (kg) | Low risk |
Quote from publication: "...double‐blind, double‐dummy..." Comment: investigator‐assessed outcome measurement. Blinding ensured |
| Blinding of outcome assessment (detection bias) HbA1c | Low risk |
Quote from publication: "...double‐blind, double‐dummy..." Comment: investigator‐assessed outcome measurement. Blinding ensured |
| Incomplete outcome data (attrition bias) all‐cause/cardiovascular mortality | Low risk |
Quote from publication: "Analysis of safety data used the population of all randomised patients who received at least one dose of study treatment." "Serious adverse events are presented, regardless of time from last dose of blinded study medication, including data after glycaemic rescue. Non‐serious adverse events are presented, regardless of time from last dose of blinded study medication, excluding data after glycaemic rescue." "Participants were included in the treatment group corresponding to the study treatment they actually received." Comment: > 99% of randomised participants were included in the analyses. There was a high dropout rate (76%‐77% of randomised participants completed the study), however, the dropout rate was balanced between groups. We assumed that trial authors searched registers for mortality status at the end of the trial |
| Incomplete outcome data (attrition bias) hypoglycaemia | Low risk |
Quote from publication: "Analysis of safety data used the population of all randomised patients who received at least one dose of study treatment." "Serious adverse events are presented, regardless of time from last dose of blinded study medication, including data after glycaemic rescue. Non‐serious adverse events are presented, regardless of time from last dose of blinded study medication, excluding data after glycaemic rescue." "Participants were included in the treatment group corresponding to the study treatment they actually received." Comment: > 99% of randomised participants were included in the analyses. There was a high dropout rate (76%‐77% of randomised participants completed the study), however, the dropout rate was balanced between the intervention groups. We do not know how the trial authors imputed missing data from the participants not completing the study. The reasons for dropouts were balanced. The proportion of missing outcomes compared with observed event risk was not enough to induce clinically relevant bias in intervention effect estimate |
| Incomplete outcome data (attrition bias) non‐fatal myocardial infarction/heart failure/non‐fatal stroke | High risk |
Quote from publication: "Analysis of safety data used the population of all randomised patients who received at least one dose of study treatment." "Serious adverse events are presented, regardless of time from last dose of blinded study medication, including data after glycaemic rescue. Non‐serious adverse events are presented, regardless of time from last dose of blinded study medication, excluding data after glycaemic rescue." "Participants were included in the treatment group corresponding to the study treatment they actually received." Comment: > 99% of randomised participants were included in the analyses. There was a high dropout rate (76%‐77% of randomised participants completed the study), however, the dropout rate was balanced between groups. We do not know how the trial authors imputed missing data from the participants not completing the study. The reasons for dropouts were balanced. The proportion of missing outcomes compared with observed event risk was enough to induce clinically relevant bias in intervention effect estimate |
| Incomplete outcome data (attrition bias) non‐serious adverse events | Low risk |
Quote from publication: "Analysis of safety data used the population of all randomised patients who received at least one dose of study treatment." "Serious adverse events are presented, regardless of time from last dose of blinded study medication, including data after glycaemic rescue. Non‐serious adverse events are presented, regardless of time from last dose of blinded study medication, excluding data after glycaemic rescue." "Participants were included in the treatment group corresponding to the study treatment they actually received." Comment: > 99% of randomised participants were included in the analyses. There was a high dropout rate (76%‐77% of randomised participants completed the study), however, the dropout rate was balanced between groups. We do not know how the trial authors imputed missing data from the participants not completing the study. The reasons for dropouts were balanced. The proportion of missing outcomes compared with observed event risk was not enough to induce clinically relevant bias in intervention effect estimate |
| Incomplete outcome data (attrition bias) serious adverse events | High risk |
Quote from publication: "Analysis of safety data used the population of all randomised patients who received at least one dose of study treatment." "Serious adverse events are presented, regardless of time from last dose of blinded study medication, including data after glycaemic rescue. Non‐serious adverse events are presented, regardless of time from last dose of blinded study medication, excluding data after glycaemic rescue." "Participants were included in the treatment group corresponding to the study treatment they actually received." Comment: > 99% of randomised participants were included in the analyses. There was a high dropout rate (76%‐77% of randomised participants completed the study), however, the dropout rate was balanced between groups. We do not know how the trial authors imputed missing data from the participants not completing the study. The reasons for dropouts were balanced. The proportion of missing outcomes compared with observed event risk was enough to induce clinically relevant bias in intervention effect estimate |
| Incomplete outcome data (attrition bias) weight (kg) | Unclear risk |
Quote from publication: "Analysis of safety data used the population of all randomised patients who received at least one dose of study treatment." "Serious adverse events are presented, regardless of time from last dose of blinded study medication, including data after glycaemic rescue. Non‐serious adverse events are presented, regardless of time from last dose of blinded study medication, excluding data after glycaemic rescue." "Participants were included in the treatment group corresponding to the study treatment they actually received." Comment: > 99% of the randomised participants were included in the analyses. There was a high dropout rate (76%‐77% of randomised participants completed the study), however, the dropout rate was balanced between groups. The reasons for dropouts were balanced among the intervention groups. No information on imputation method. Not sure if plausible effect size among missing outcomes was enough to induce clinically relevant bias in observed effect size |
| Incomplete outcome data (attrition bias) HbA1c | Unclear risk |
Quote from publication: "The population of all randomised patients who received at least one dose of study treatment and had a baseline or a post‐randomisation measurement served as the primary population for efficacy analyses." Comment: > 99% of the randomised participants were included in the analyses. There was a high dropout rate (76%‐77% of randomised participants completed the study), however, the dropout rate was balanced between groups. The reasons for dropouts were balanced among the intervention groups. No information on imputation method. Not sure if plausible effect size among missing outcomes was enough to induce clinically relevant bias in observed effect size |
| Selective reporting (reporting bias) | Low risk | Comment: all of the trial's primary and secondary outcomes as specified in the protocol have been reported |
| Other bias | Unclear risk | Comment: the trial was funded by a pharmaceutical company |
Hollander 2017.
| Methods |
Study design: multicentre, randomised, double‐blind, active‐controlled, parallel‐group, phase lll clinical study Randomisation ratio: 1:1:1 to receive ertugliflozin 5 mg, ertugliflozin 15 mg or glimepiride 1 mg‐8 mg in addition to metformin Non‐inferiority design |
|
| Participants |
Inclusion criteria: age ≥ 18 years, T2DM, HbA1c ≥ 53 and ≤ 75 mmol/mol (≥ 7.0% and ≤ 9.0%), on ≥ 1500 mg/day of metformin monotherapy for at least 8 weeks at screening. Participants on this regimen for < 8 weeks, on lower doses of metformin, or on any dose of metformin with another glucose‐lowering agent at screening were eligible if they met the above criteria after the appropriate dose/medication adjustment, stabilisation, or washout period Exclusion criteria: history of T1DM or ketoacidosis; ≥ 5% change in body weight in previous 6 months; treatment in previous 12 weeks with insulin or any other type of injectable a glucose‐lowering agent, pioglitazone or rosiglitazone, other SGLT2 inhibitors, bromocriptine, or colesevelam, or any other glucose‐lowering agents, with the exceptions of SUs administered at < 50% of the maximum approved dose, DPP‐4 inhibitors, meglitinides, and alpha‐glucosidase inhibitors; history of myocardial infarction, unstable angina, arterial revascularization, stroke, transient ischaemic attack, or NYHA class III–IV heart failure within 3 months of screening; any active, obstructive uropathy or indwelling urinary catheter; mean value for triplicate sitting systolic BP > 160 mmHg and/or diastolic BP > 90 mmHg (participants on BP medication must have been on a stable regimen for at least 4 weeks prior to randomisation); estimated GFR < 55 mL/min/ 1.73 m²; serum creatinine ≥ 115 μmol/L (1.3 mg/dL) in men or ≥ 106 μmol/L (1.2 mg/ dL) in women Diagnostic criteria: ADA guidelines |
|
| Interventions |
Number of study centres: 232 Run‐in period: 2‐week single‐blind placebo run‐in Extension period: the study was conducted over 104 weeks in two 52‐week phases. 104‐week results not available yet |
|
| Outcomes | Composite outcome measures reported: yes, HbA1c reduction > 5.5 mmol/mol (0.5%) with no symptomatic hypoglycaemia or body weight gain, and HbA1c < 53 mmol/mol (7.0%) with no symptomatic hypoglycaemia | |
| Study details |
Trial terminated early: no Trial ID:NCT01999218 |
|
| Publication details |
Language of publication: English Funding: commercial funding by Merck Sharp & Dohme Corp. Publication status: peer‐reviewed journal |
|
| Stated aim for study | Quote from publication: "The primary hypothesis was that the glycemic efficacy of ertugliflozin 15 mg, as an add‐on to metformin, was non‐inferior to that of glimepiride after 52 weeks of treatment." | |
| Notes | ‐ | |
| Risk of bias | ||
| Bias | Authors' judgement | Support for judgement |
| Random sequence generation (selection bias) | Low risk |
Quote from publication: "Randomization was performed using a central electronic randomization system." Comment: adequate generation of random sequence ensured |
| Allocation concealment (selection bias) | Low risk |
Quote from publication: "Randomization was performed using a central electronic randomization system." Comment: adequate concealment ensured |
| Blinding of participants and personnel (performance bias) all‐cause/cardiovascular mortality | Low risk |
Quote from publication: "Ertugliflozin and glimepiride tablets were packaged identically relative to their matching placebos. Study personnel, including patients, investigators, study site, central laboratory, and the sponsor remained blinded throughout the 52‐week phase A treatment period." Comment: investigator‐assessed outcome measurement. Blinding of participant and study personnel ensured |
| Blinding of participants and personnel (performance bias) amputation of lower extremity/blindness or severe vision loss/end‐stage renal disease | Low risk |
Quote from publication: "Ertugliflozin and glimepiride tablets were packaged identically relative to their matching placebos. Study personnel, including patients, investigators, study site, central laboratory, and the sponsor remained blinded throughout the 52‐week phase A treatment period Comment: investigator‐assessed outcome measurement. Blinding of participant and study personnel ensured |
| Blinding of participants and personnel (performance bias) hypoglycaemia | Low risk |
Quote from publication: "Ertugliflozin and glimepiride tablets were packaged identically relative to their matching placebos. Study personnel, including patients, investigators, study site, central laboratory, and the sponsor remained blinded throughout the 52‐week phase A treatment period." Comment: investigator‐assessed/self‐reported outcome measurement. Blinding of participant and study personnel ensured |
| Blinding of participants and personnel (performance bias) non‐fatal myocardial infarction/heart failure/non‐fatal stroke | Low risk |
Quote from publication: "Ertugliflozin and glimepiride tablets were packaged identically relative to their matching placebos. Study personnel, including patients, investigators, study site, central laboratory, and the sponsor remained blinded throughout the 52‐week phase A treatment period." Comment: investigator‐assessed outcome measurement. Blinding of participant and study personnel ensured |
| Blinding of participants and personnel (performance bias) serious adverse events | Low risk |
Quote from publication: "Ertugliflozin and glimepiride tablets were packaged identically relative to their matching placebos. Study personnel, including patients, investigators, study site, central laboratory, and the sponsor remained blinded throughout the 52‐week phase A treatment period." Comment: investigator‐assessed outcome measurement. Blinding of participant and study personnel ensured |
| Blinding of participants and personnel (performance bias) HbA1c | Low risk |
Quote from publication: "Ertugliflozin and glimepiride tablets were packaged identically relative to their matching placebos. Study personnel, including patients, investigators, study site, central laboratory, and the sponsor remained blinded throughout the 52‐week
phase A treatment period." Comment: investigator‐assessed outcome measurement. Blinding of participant and study personnel ensured |
| Blinding of outcome assessment (detection bias) all‐cause/cardiovascular mortality | Low risk |
Quote from publication: "Ertugliflozin and glimepiride tablets were packaged identically relative to their matching placebos. Study personnel, including patients, investigators, study site, central laboratory, and the sponsor remained blinded throughout the 52‐week phase A treatment period." Comment: investigator‐assessed outcome measurement. Blinding of investigator ensured |
| Blinding of outcome assessment (detection bias) amputation of lower extremity/blindness or severe vision loss/end‐stage renal disease | Low risk |
Quote from publication: "Ertugliflozin and glimepiride tablets were packaged identically relative to their matching placebos. Study personnel, including patients, investigators, study site, central laboratory, and the sponsor remained blinded throughout the 52‐week phase A treatment period." Comment: investigator‐assessed outcome measurement. Blinding of investigator ensured |
| Blinding of outcome assessment (detection bias) hypoglycaemia | Low risk |
Quote from publication: "Ertugliflozin and glimepiride tablets were packaged identically relative to their matching placebos. Study personnel, including patients, investigators, study site, central laboratory, and the sponsor remained blinded throughout the 52‐week phase A treatment period." Comment: investigator‐assessed/self‐reported outcome measurement. Blinding of participant and investigator ensured |
| Blinding of outcome assessment (detection bias) non‐fatal myocardial infarction/heart failure/non‐fatal stroke | Low risk |
Quote from publication: "Ertugliflozin and glimepiride tablets were packaged identically relative to their matching placebos. Study personnel, including patients, investigators, study site, central laboratory, and the sponsor remained blinded throughout the 52‐week phase A treatment period." Comment: investigator‐assessed outcome measurement. Blinding of investigator ensured |
| Blinding of outcome assessment (detection bias) serious adverse events | Low risk |
Quote from publication: "Ertugliflozin and glimepiride tablets were packaged identically relative to their matching placebos. Study personnel, including patients, investigators, study site, central laboratory, and the sponsor remained blinded throughout the 52‐week phase A treatment period." Comment: investigator‐assessed outcome measurement. Blinding of investigator ensured |
| Blinding of outcome assessment (detection bias) HbA1c | Low risk |
Quote from publication: "Ertugliflozin and glimepiride tablets were packaged identically relative to their matching placebos. Study personnel, including patients, investigators, study site, central laboratory, and the sponsor remained blinded throughout the 52‐week phase A treatment period." Comment: investigator‐assessed outcome measurement. Blinding of investigator ensured |
| Incomplete outcome data (attrition bias) all‐cause/cardiovascular mortality | Low risk |
Quote from publication: "Safety analyses included all randomized, treated patients. Data following initiation of glycemic rescue were included for the analysis of SAEs, discontinuations due to AEs, and excluded for the other endpoints." Comment: > 99% of randomised participants were included in the analyses. There was a high dropout rate (76%‐81% of randomised participants completed the study), however, the dropout rate was balanced between groups. We assumed that trial authors searched registers for mortality status at the end of the trial |
| Incomplete outcome data (attrition bias) amputation of lower extremity/blindness or severe vision loss/end‐stage renal disease | High risk |
Quote from publication: "Safety analyses included all randomized, treated patients. Data following initiation of glycemic rescue were included for the analysis of SAEs, discontinuations due to AEs, and excluded for the other endpoints." Comment: > 99% of randomised participants were included in the analyses. There was a high dropout rate (76%‐81% of randomised participants completed the study), however, the dropout rate was balanced between groups. We do not know how the trial authors imputed missing data from the participants not completing the study. The reasons for dropouts were balanced. The proportion of missing outcomes compared with observed event risk was enough to induce clinically relevant bias in intervention effect estimate |
| Incomplete outcome data (attrition bias) hypoglycaemia | High risk |
Quote from publication: "Safety analyses included all randomized, treated patients. Data following initiation of glycemic rescue were included for the analysis of SAEs, discontinuations due to AEs, and excluded for the other endpoints." Comment: > 99% of randomised participants were included in the analyses. There was a high dropout rate (76%‐81% of randomised participants completed the study), however, the dropout rate was balanced between groups. We do not know how the trial authors imputed missing data from the participants not completing the study. The reasons for dropouts were balanced. The proportion of missing outcomes compared with observed event risk was enough to induce clinically relevant bias in intervention effect estimate |
| Incomplete outcome data (attrition bias) non‐fatal myocardial infarction/heart failure/non‐fatal stroke | High risk |
Quote from publication: "Safety analyses included all randomized, treated patients. Data following initiation of glycemic rescue were included for the analysis of SAEs, discontinuations due to AEs, and excluded for the other endpoints." Comment: > 99% of randomised participants were included in the analyses. There was a high dropout rate (76%‐81% of randomised participants completed the study), however, the dropout rate was balanced between groups. We do not know how the trial authors imputed missing data from the participants not completing the study. The reasons for dropouts were balanced. The proportion of missing outcomes compared with observed event risk was enough to induce clinically relevant bias in intervention effect estimate |
| Incomplete outcome data (attrition bias) serious adverse events | High risk |
Quote from publication: "Safety analyses included all randomized, treated patients. Data following initiation of glycemic rescue were included for the analysis of SAEs, discontinuations due to AEs, and excluded for the other endpoints." Comment: > 99% of randomised participants were included in the analyses. There was a high dropout rate (76%‐81% of randomised participants completed the study), however, the dropout rate was balanced between groups. We do not know how the trial authors imputed missing data from the participants not completing the study. The reasons for dropouts were balanced. The proportion of missing outcomes compared with observed event risk was enough to induce clinically relevant bias in intervention effect estimate |
| Incomplete outcome data (attrition bias) HbA1c | Unclear risk |
Quote from publication: "Efficacy analyses excluded results following initiation of glycemic rescue therapy to avoid the confounding influence of rescue therapy. The full analysis set (FAS; all randomized patients who took at least one dose of study drug and had at least one measurement of the respective endpoint) was the primary population for efficacy analyses." "HbA1c reduction from baseline at week 52 was assessed in categorical subgroups using a repeated measures analysis of covariance (ANCOVA) model." Comment: 77%‐81% of the participants were included in the analyses. There was a high dropout rate (76%‐81% of the participants completed the study), however, the dropout rate was balanced between groups. No information on imputation method. The reasons for dropouts were balanced. Not sure if plausible effect size among missing outcomes was enough to induce clinically relevant bias in observed effect size |
| Selective reporting (reporting bias) | Low risk | Comment: all of the trial's primary and secondary outcomes as specified in the protocol have been reported |
| Other bias | Unclear risk | Comment: the trial was funded by a pharmaceutical company |
Home 2009.
| Methods |
Study design: prospective, multicentre, randomised, open‐label trial Randomisation ratio: 1:1 to receive rosiglitazone or sulphonylurea (glibenclamide, gliclazide or glimepiride) in addition to metformin Non‐inferiority design |
|
| Participants |
Inclusion criteria: T2DM, age 40–75 years, BMI > 25.0 kg/m², HbA1c > 7.0% and ≤ 9.0%, on maximum tolerated dose/MPD of background monotherapy of metformin, on oral glucose‐lowering drugs for ≥ 6 months and on current drug at the maximum tolerated dose/MPD for ≥ 2 months. If female, then post‐menopausal, sterilised or using effective contraceptive measures Exclusion criteria: using other glucose‐lowering therapies; use of a combination of ≥ 2 oral glucose‐lowering agents within 6 months; use of insulin, except for pregnancy, intercurrent illness or stabilisation; previous use of any PPAR‐γ agonist; hospitalisation for a major CV event in the last 3 months; scheduled major CV intervention, or gangrene; diagnosed or receiving medication specifically for heart failure (except diuretics alone); systolic or diastolic BP > 180/105 mmHg, on therapy if used; fasting serum triglycerides > 12.0 mmol/L; serum creatinine > 130 μmol/L (> 1.47 mg/dL); ALT, AST, total bilirubin or alkaline phosphatase ≥ 2.5 x ULN; haemoglobin < 11.0 g/dL for men or < 10.0 g/dL for women or haemoglobinopathy interfering with valid HbA1c assay; contraindication/intolerance to metformin, glyburide, gliclazide or glimepiride; pre‐existing medical condition judged to preclude safe participation in the study; abuse of alcohol or drugs, or presence of any condition that may lead to poor adherence to study protocols; recent use of an investigational drug; pregnancy, breast feeding or planning pregnancy Diagnostic criteria: 1999 WHO criteria |
|
| Interventions |
Number of study centres: 364 Run‐in period: 4‐week run‐in period that included reinforcement of lifestyle education. Participants continued to take metformin Extension period: yes, 4 years of observational follow‐up was added to the study to monitor the occurrence of cancer and bone fractures. At the end of the main study, all study medication was stopped. Participants were not provided with study medication in the observational follow‐up; instead, anti‐diabetic treatment was prescribed at the investigator's discretion. |
|
| Outcomes | Composite outcome measures reported: no | |
| Study details |
Trial terminated early: no Trial ID:NCT00379769 |
|
| Publication details |
Language of publication: English Funding: commercial funding by GlaxoSmithKline plc, UK Publication status: peer‐reviewed journal |
|
| Stated aim for study | Quote from publication: "Our aim was to assess non‐inferiority of rosiglitazone in combination with metformin or sulfonylurea compared with metformin and sulfonylurea dual therapy for cardiovascular outcomes." | |
| Notes | ‐ | |
| Risk of bias | ||
| Bias | Authors' judgement | Support for judgement |
| Random sequence generation (selection bias) | Low risk |
Quote from publication: "The treatment allocation schedule was computer generated in blocks and stratified according to background glucose‐lowering medication (metformin or sulphonylurea). Participants were randomised centrally using an interactive voice response telephone system." Comment: adequate generation of random sequence ensured |
| Allocation concealment (selection bias) | Low risk |
Quote from publication: "The treatment allocation schedule was computer generated in blocks and stratified according to background glucose‐lowering medication (metformin or sulphonylurea). Participants were randomised centrally using an interactive voice response telephone system." Comment: adequate concealment ensured |
| Blinding of participants and personnel (performance bias) all‐cause/cardiovascular mortality | Low risk |
Quote from publication: "...open‐label trial..." "The study was monitored by a clinical trials organisation (Quintiles, Bracknell, UK), which also coordinated data collection." "An independent data safety and monitoring board reviewed conduct of the study and unblinded data at about 6‐month intervals." "Deaths and investigator‐diagnosed cardiovascular events were identified through adverse‐event reporting, direct questioning, or both, at study visits with trial record forms. Data from all relevant clinical sources were obtained by Quintiles and provided to an independent clinical endpoints committee who were blind to treatment allocation. All deaths were adjudicated with predefined criteria." Comment: adjudicated outcome measurement. Incomplete blinding of participant and investigator, but the outcome is not likely to be influenced by lack of blinding |
| Blinding of participants and personnel (performance bias) hypoglycaemia | High risk |
Quote from publication: "...open‐label trial..." Comment: self‐reported outcome measurement. Incomplete blinding, the outcome is likely to be influenced by lack of blinding |
| Blinding of participants and personnel (performance bias) non‐fatal myocardial infarction/heart failure/non‐fatal stroke | Low risk |
Quote from publication: "...open‐label trial..." "The study was monitored by a clinical trials organisation (Quintiles, Bracknell, UK), which also coordinated data collection." "An independent data safety and monitoring board reviewed conduct of the study and unblinded data at about 6‐month intervals." "Deaths and investigator‐diagnosed cardiovascular events were identified through adverse‐event reporting, direct questioning, or both, at study visits with trial record forms. Data from all relevant clinical sources were obtained by Quintiles and provided to an independent clinical endpoints committee who were blind to treatment allocation. All deaths were adjudicated with predefined criteria." Comment: adjudicated outcome measurement. Incomplete blinding of participant and investigator, but the outcome is not likely to be influenced by lack of blinding |
| Blinding of participants and personnel (performance bias) non‐serious adverse events | High risk |
Quote from publication: "...open‐label trial..." Comment: self‐reported outcome measurement. Incomplete blinding, the outcome is likely to be influenced by lack of blinding |
| Blinding of participants and personnel (performance bias) serious adverse events | Low risk |
Quote from publication: "...open‐label trial..." "The study was monitored by a clinical trials organisation (Quintiles, Bracknell, UK), which also coordinated data collection." "An independent data safety and monitoring board reviewed conduct of the study and unblinded data at about 6‐month intervals." "Deaths and investigator‐diagnosed cardiovascular events were identified through adverse‐event reporting, direct questioning, or both, at study visits with trial record forms. Data from all relevant clinical sources were obtained by Quintiles and provided to an independent clinical endpoints committee who were blind to treatment allocation. All deaths were adjudicated with predefined criteria." Comment: adjudicated/investigator‐assessed outcome measurement. Incomplete blinding of participant and investigator, but the outcome is not likely to be influenced by lack of blinding |
| Blinding of participants and personnel (performance bias) weight (kg) | High risk |
Quote from publication: "...open‐label trial..." Comment: investigator‐assessed/self‐reported outcome measurement. Incomplete blinding of participant and investigator, the outcome is likely to be influenced by lack of blinding |
| Blinding of participants and personnel (performance bias) HbA1c | Low risk |
Quote from publication: "...open‐label trial..." Comment: investigator‐assessed outcome measurement. Incomplete blinding of participant and investigator, but the outcome is not likely to be influenced by lack of blinding |
| Blinding of outcome assessment (detection bias) all‐cause/cardiovascular mortality | Low risk |
Quote from publication: "...open‐label trial..." "The study was monitored by a clinical trials organisation (Quintiles, Bracknell, UK), which also coordinated data collection." "An independent data safety and monitoring board reviewed conduct of the study and unblinded data at about 6‐month intervals." "Deaths and investigator‐diagnosed cardiovascular events were identified through adverse‐event reporting, direct questioning, or both, at study visits with trial record forms. Data from all relevant clinical sources were obtained by Quintiles and provided to an independent clinical endpoints committee who were blind to treatment allocation. All deaths were adjudicated with predefined criteria." Comment: adjudicated outcome measurement. Blinding of clinical endpoint committee ensured |
| Blinding of outcome assessment (detection bias) hypoglycaemia | High risk |
Quote from publication: "...open‐label trial..." Comment: self‐reported outcome measurement. Incomplete blinding of outcome assessor, the outcome is likely to be influenced by lack of blinding |
| Blinding of outcome assessment (detection bias) non‐fatal myocardial infarction/heart failure/non‐fatal stroke | Low risk |
Quote from publication: "...open‐label trial..." "The study was monitored by a clinical trials organisation (Quintiles, Bracknell, UK), which also coordinated data collection." "An independent data safety and monitoring board reviewed conduct of the study and unblinded data at about 6‐month intervals." "Deaths and investigator‐diagnosed cardiovascular events were identified through adverse‐event reporting, direct questioning, or both, at study visits with trial record forms. Data from all relevant clinical sources were obtained by Quintiles and provided to an independent clinical endpoints committee who were blind to treatment allocation. All deaths were adjudicated with predefined criteria." Comment: adjudicated outcome measurement. Blinding of clinical endpoint committee ensured |
| Blinding of outcome assessment (detection bias) non‐serious adverse events | High risk |
Quote from publication: "...open‐label trial..." Comment: self‐reported outcome measurement. Incomplete blinding, the outcome is likely to be influenced by lack of blinding |
| Blinding of outcome assessment (detection bias) serious adverse events | Low risk |
Quote from publication: "...open‐label trial..." "The study was monitored by a clinical trials organisation (Quintiles, Bracknell, UK), which also coordinated data collection." "An independent data safety and monitoring board reviewed conduct of the study and unblinded data at about 6‐month intervals." "Deaths and investigator‐diagnosed cardiovascular events were identified through adverse‐event reporting, direct questioning, or both, at study visits with trial record forms. Data from all relevant clinical sources were obtained by Quintiles and provided to an independent clinical endpoints committee who were blind to treatment allocation. All deaths were adjudicated with predefined criteria." Comment: adjudicated/investigator‐assessed outcome measurement. Blinding of clinical endpoint committee ensured |
| Blinding of outcome assessment (detection bias) weight (kg) | High risk |
Quote from publication: "...open‐label trial..." Comment: investigator‐assessed/self‐reported outcome measurement. Incomplete blinding of outcome assessor, the outcome is likely to be influenced by lack of blinding |
| Blinding of outcome assessment (detection bias) HbA1c | Low risk |
Quote from publication: "...open‐label trial..." Comment: investigator‐assessed outcome measurement. Incomplete blinding of outcome assessor, but the outcome is not likely to be influenced by lack of blinding |
| Incomplete outcome data (attrition bias) all‐cause/cardiovascular mortality | Low risk |
Quote from publication: "All individuals who receive at least one dose of randomised study medication will be assessed for clinical safety and tolerability" "The primary endpoint is the time to first CV hospitalisation or death ... Participants who do not achieve the endpoint during their time in the study will have their data censored based on the date of final observed contact." Comment: > 99% of the randomised participants were included in the analyses. There was a high dropout rate (82%‐84% of randomised participants completed the study), however, the dropout rate was balanced between groups. We assumed that trial authors searched registers for mortality status at the end of the trial. Data were censored |
| Incomplete outcome data (attrition bias) hypoglycaemia | High risk |
Quote from publication: "All individuals who receive at least one dose of randomised study medication will be assessed for clinical safety and tolerability" Comment: > 99% of the randomised participants were included in the analyses. There was a high dropout rate (82%‐84% of randomised participants completed the study), however, the dropout rate was balanced between groups. The reasons for dropouts were balanced among the intervention groups. No information on imputation method. The proportion of missing outcomes compared with observed event risk was enough to induce clinically relevant bias in intervention effect estimate |
| Incomplete outcome data (attrition bias) non‐fatal myocardial infarction/heart failure/non‐fatal stroke | Low risk |
Quote from publication: "All individuals who receive at least one dose of randomised study medication will be assessed for clinical safety and tolerability" "The primary endpoint is the time to first CV hospitalisation or death ... Participants who do not achieve the endpoint during their time in the study will have their data censored based on the date of final observed contact." Comment: > 99% of the randomised participants were included in the analyses. There was a high dropout rate (82%‐84% of randomised participants completed the study), however, the dropout rate was balanced between groups. The reasons for dropouts were balanced among the intervention groups. The data were censored |
| Incomplete outcome data (attrition bias) non‐serious adverse events | Low risk |
Quote from publication: "All individuals who receive at least one dose of randomised study medication will be assessed for clinical safety and tolerability" Comment: > 99% of the randomised participants were included in the analyses. There was a high dropout rate (82%‐84% of randomised participants completed the study), however, the dropout rate was balanced between groups. The reasons for dropouts were balanced among the intervention groups. No information on imputation method. The proportion of missing outcomes compared with observed event risk was not enough to induce clinically relevant bias in intervention effect estimate |
| Incomplete outcome data (attrition bias) serious adverse events | Low risk |
Quote from publication: "All individuals who receive at least one dose of randomised study medication will be assessed for clinical safety and tolerability" "The primary endpoint is the time to first CV hospitalisation or death ... Participants who do not achieve the endpoint during their time in the study will have their data censored based on the date of final observed contact." Comment: > 99% of the randomised participants were included in the analyses. There was a high dropout rate (82%‐84% of randomised participants completed the study), however, the dropout rate was balanced between groups. The reasons for dropouts were balanced among the intervention groups. No information on imputation method. The proportion of missing outcomes compared with observed event risk was not enough to induce clinically relevant bias in intervention effect estimate. Data for death and CV hospitalisation were censored |
| Incomplete outcome data (attrition bias) weight (kg) | Unclear risk |
Quote from publication: "Analyses of changes in HbA1c and other quantitative measures at 5 years used a repeated measures model (based on all available data and assuming data were missing at random), including terms for baseline and baseline by visit interaction, with an unstructured covariance matrix for the within‐patient variability in each treatment group." Comment: > 97% of the randomised participants were included in the analyses. There was a high dropout rate (82%‐84% of randomised participants completed the study), however, the dropout rate was balanced between groups. The reasons for dropouts were balanced among the intervention groups. Imputation by repeated measures model. Not sure if plausible effect size among missing outcomes is enough to induce clinically relevant bias in observed effect size |
| Incomplete outcome data (attrition bias) HbA1c | Unclear risk |
Quote from publication: "Analyses of changes in HbA1c and other quantitative measures at 5 years used a repeated measures model (based on all available data and assuming data were missing at random), including terms for baseline and baseline by visit interaction, with an unstructured covariance matrix for the within‐patient variability in each treatment group." Comment: > 97% of the randomised participants were included in the analyses. There was a high dropout rate (82%‐84% of randomised participants completed the study), however, the dropout rate was balanced between groups. The reasons for dropouts were balanced among the intervention groups. Imputation by repeated measures model. Not sure if plausible effect size among missing outcomes is enough to induce clinically relevant bias in observed effect size |
| Selective reporting (reporting bias) | Low risk | Comment: all of the trial's primary and secondary outcomes as specified in the protocol have been reported |
| Other bias | Unclear risk | Comment: the trial received funding from a pharmaceutical company. Sponsor statisticians were involved in the design, reporting plan, and data analysis. The steering committee had responsibility for study conduct, data collected, data analysis, the writing of reports, and the decision to publish |
Leiter 2015.
| Methods |
Study design: randomised, double‐blind, active‐controlled, phase 3, non‐inferiority trial Randomisation ratio: 1:1:1 to receive canagliflozin 100 mg, canagliflozin 300 mg or glimepiride in addition to metformin Non‐inferiority and superiority design: non‐inferiority of canagliflozin 100 mg or 300 mg, or both, to glimepiride for HbA1c reduction at week 52. Assessment of non‐inferiority of canagliflozin to glimepiride was based on a prespecified non‐inferiority margin of 0.3%. If non‐inferiority was shown, the protocol specified a step‐down assessment of superiority, on the basis of an upper bound of the 95% CI for the difference of each canagliflozin dose versus glimepiride of < 0.0%. All statistical tests were interpreted at a two‐sided significance level of 5%, and all CIs at a two‐sided confidence level of 95%. For body composition descriptive statistics and 95% CIs for changes from baseline were provided |
|
| Participants |
Inclusion criteria: 18–80 years, T2DM, HbA1c of 7.0%‐9.5%, receiving stable metformin therapy (≥ 2000 mg/day or ≥ 1500 mg/day if unable to tolerate a higher dose) for at least 10 weeks. Participants who were receiving metformin in combination with 1 other oral non‐thiazolidinedione antihyperglycaemic drug at screening discontinued the second antihyperglycaemic drug and, if needed, had their metformin dose increased Exclusion criteria: history of > 1 severe hypoglycaemic episode (within 6 months); repeated measurements of FPG or fasting self‐monitored blood glucose, or both, of 15.0 mmol/L or more during the pretreatment phase; an estimated GFR of < 55 mL/min/1.73 m² (or < 60 mL/min/1.73 m² if based on restriction of metformin use in local label) or serum creatinine concentrations of ≥ 124 μmol/L for men and ≥ 115 μmol/L for women; or were given thiazolidinedione within 16 weeks before screening Diagnostic criteria: not reported |
|
| Interventions |
Number of study centres: 157 Run‐in period: 2‐week, single‐blind, placebo run‐in period. Participants who were receiving metformin at doses lower than specified in the protocol had their metformin dose increased before entering an up to 12 week metformin dose‐stable run‐in period before the 2‐week, placebo run‐in period Extension period: yes, 52‐week, double‐blind extension period |
|
| Outcomes | Composite outcome measures reported: HbA1c and weight are reported as separate and as composite outcome measures | |
| Study details |
Trial terminated early: no Trial ID:NCT00968812 |
|
| Publication details |
Language of publication: English Funding: commercial funding, canagliflozin is marketed under license by Janssen Research & Development, LLC Publication status: peer‐reviewed journal |
|
| Stated aim for study | Quote from publication: "... we assessed the efficacy and safety of canagliflozin compared with glimepiride as add‐on therapy in patients with type 2 diabetes inadequately controlled with metformin." | |
| Notes | ‐ | |
| Risk of bias | ||
| Bias | Authors' judgement | Support for judgement |
| Random sequence generation (selection bias) | Low risk |
Quote from publication: "The sponsor prepared the computer‐generated randomisation schedule before the study. Randomisation was balanced with the use of permuted blocks of three patients per block and stratified by whether the patient was taking a stable, protocol‐specified dose of metformin before screening versus whether they had either undergone metformin
dose adjustment or discontinued use of a second antihyperglycaemic drug, or both, and by country." Comment: adequate generation of random sequence ensured |
| Allocation concealment (selection bias) | Low risk |
Quote from publication: "Participants were then randomly assigned, in a 1:1:1 ratio, by an interactive voice or web response system to be given canagliflozin 100 mg or 300 mg or glimepiride." Comment: adequate concealment ensured |
| Blinding of participants and personnel (performance bias) all‐cause/cardiovascular mortality | Low risk |
Quote from publication: "... double‐blind..." "After randomisation, HbA1c and fasting plasma glucose values were masked to staff at the study centres unless values met glycaemic rescue criteria (and were subsequently provided unmasked). Patients, study investigators, and local sponsor personnel were masked to treatment assignment until final database lock. To maintain masked treatment, study drug was supplied in levels (levels one to five) to allow for masked increases and decreases of glimepiride throughout the double‐blind treatment period." Comment: investigator‐assessed outcome measurement. Blinding of investigator ensured |
| Blinding of participants and personnel (performance bias) hypoglycaemia | Low risk |
Quote from publication: "... double‐blind..." "After randomisation, HbA1c and fasting plasma glucose values were masked to staff at the study centres unless values met glycaemic rescue criteria (and were subsequently provided unmasked). Patients, study investigators, and local sponsor personnel were masked to treatment assignment until final database lock. To maintain masked treatment, study drug was supplied in levels (levels one to five) to allow for masked increases and decreases of glimepiride throughout the double‐blind treatment period." Comment: investigator‐assessed/self‐reported outcome measurement. Blinding of investigator and participant ensured |
| Blinding of participants and personnel (performance bias) non‐fatal myocardial infarction/heart failure/non‐fatal stroke | Low risk |
Quote from publication: "... double‐blind..." "After randomisation, HbA1c and fasting plasma glucose values were masked to staff at the study centres unless values met glycaemic rescue criteria (and were subsequently provided unmasked). Patients, study investigators, and local sponsor personnel were masked to treatment assignment until final database lock. To maintain masked treatment, study drug was supplied in levels (levels one to five) to allow for masked increases and decreases of glimepiride throughout the double‐blind treatment period." Comment: investigator‐assessed outcome measurement. Blinding of investigator ensured |
| Blinding of participants and personnel (performance bias) non‐serious adverse events | Low risk |
Quote from publication: "... double‐blind..." "After randomisation, HbA1c and fasting plasma glucose values were masked to staff at the study centres unless values met glycaemic rescue criteria (and were subsequently provided unmasked). Patients, study investigators, and local sponsor personnel were masked to treatment assignment until final database lock. To maintain masked treatment, study drug was supplied in levels (levels one to five) to allow for masked increases and decreases of glimepiride throughout the double‐blind treatment period." Comment: investigator‐assessed/self‐reported outcome measurement. Blinding of investigator and participant ensured |
| Blinding of participants and personnel (performance bias) serious adverse events | Low risk |
Quote from publication: "... double‐blind..." "After randomisation, HbA1c and fasting plasma glucose values were masked to staff at the study centres unless values met glycaemic rescue criteria (and were subsequently provided unmasked). Patients, study investigators, and local sponsor personnel were masked to treatment assignment until final database lock. To maintain masked treatment, study drug was supplied in levels (levels one to five) to allow for masked increases and decreases of glimepiride throughout the double‐blind treatment period." Comment: investigator‐assessed outcome measurement. Blinding of investigator ensured |
| Blinding of participants and personnel (performance bias) weight (kg) | Low risk |
Quote from publication: "... double‐blind..." "After randomisation, HbA1c and fasting plasma glucose values were masked to staff at the study centres unless values met glycaemic rescue criteria (and were subsequently provided unmasked). Patients, study investigators, and local sponsor personnel were masked to treatment assignment until final database lock. To maintain masked treatment, study drug was supplied in levels (levels one to five) to allow for masked increases and decreases of glimepiride throughout the double‐blind treatment period." Comment: investigator‐assessed/self‐reported outcome measurement. Blinding of investigator and participant ensured |
| Blinding of participants and personnel (performance bias) HbA1c | Low risk |
Quote from publication: "... double‐blind..." "After randomisation, HbA1c and fasting plasma glucose values were masked to staff at the study centres unless values met glycaemic rescue criteria (and were subsequently provided unmasked). Patients, study investigators, and local sponsor personnel were masked to treatment assignment until final database lock. To maintain masked treatment, study drug was supplied in levels (levels one to five) to allow for masked increases and decreases of glimepiride throughout the double‐blind treatment period." Comment: investigator‐assessed outcome measurement. Blinding of investigator ensured |
| Blinding of outcome assessment (detection bias) all‐cause/cardiovascular mortality | Low risk |
Quote from publication: "... double‐blind..." "After randomisation, HbA1c and fasting plasma glucose values were masked to staff at the study centres unless values met glycaemic rescue criteria (and were subsequently provided unmasked). Patients, study investigators, and local sponsor personnel were masked to treatment assignment until final database lock. To maintain masked treatment, study drug was supplied in levels (levels one to five) to allow for masked increases and decreases of glimepiride throughout the double‐blind treatment period." Comment: investigator‐assessed outcome measurement. Blinding of investigator ensured |
| Blinding of outcome assessment (detection bias) hypoglycaemia | Low risk |
Quote from publication: "... double‐blind..." "After randomisation, HbA1c and fasting plasma glucose values were masked to staff at the study centres unless values met glycaemic rescue criteria (and were subsequently provided unmasked). Patients, study investigators, and local sponsor personnel were masked to treatment assignment until final database lock. To maintain masked treatment, study drug was supplied in levels (levels one to five) to allow for masked increases and decreases of glimepiride throughout the double‐blind treatment period." Comment: investigator‐assessed/self‐reported outcome measurement. Blinding of investigator and participant ensured |
| Blinding of outcome assessment (detection bias) non‐fatal myocardial infarction/heart failure/non‐fatal stroke | Low risk |
Quote from publication: "... double‐blind..." "After randomisation, HbA1c and fasting plasma glucose values were masked to staff at the study centres unless values met glycaemic rescue criteria (and were subsequently provided unmasked). Patients, study investigators, and local sponsor personnel were masked to treatment assignment until final database lock. To maintain masked treatment, study drug was supplied in levels (levels one to five) to allow for masked increases and decreases of glimepiride throughout the double‐blind treatment period." Comment: investigator‐assessed outcome measurement. Blinding of investigator ensured |
| Blinding of outcome assessment (detection bias) non‐serious adverse events | Low risk |
Quote from publication: "... double‐blind..." "After randomisation, HbA1c and fasting plasma glucose values were masked to staff at the study centres unless values met glycaemic rescue criteria (and were subsequently provided unmasked). Patients, study investigators, and local sponsor personnel were masked to treatment assignment until final database lock. To maintain masked treatment, study drug was supplied in levels (levels one to five) to allow for masked increases and decreases of glimepiride throughout the double‐blind treatment period." Comment: investigator‐assessed/self‐reported outcome measurement. Blinding of investigator and participant ensured |
| Blinding of outcome assessment (detection bias) serious adverse events | Low risk |
Quote from publication: "... double‐blind..." "After randomisation, HbA1c and fasting plasma glucose values were masked to staff at the study centres unless values met glycaemic rescue criteria (and were subsequently provided unmasked). Patients, study investigators, and local sponsor personnel were masked to treatment assignment until final database lock. To maintain masked treatment, study drug was supplied in levels (levels one to five) to allow for masked increases and decreases of glimepiride throughout the double‐blind treatment period." Comment: investigator‐assessed outcome measurement. Blinding of investigator ensured |
| Blinding of outcome assessment (detection bias) weight (kg) | Low risk |
Quote from publication: "... double‐blind..." "After randomisation, HbA1c and fasting plasma glucose values were masked to staff at the study centres unless values met glycaemic rescue criteria (and were subsequently provided unmasked). Patients, study investigators, and local sponsor personnel were masked to treatment assignment until final database lock. To maintain masked treatment, study drug was supplied in levels (levels one to five) to allow for masked increases and decreases of glimepiride throughout the double‐blind treatment period." Comment: investigator‐assessed/self‐reported outcome measurement. Blinding of investigator and participant ensured |
| Blinding of outcome assessment (detection bias) HbA1c | Low risk |
Quote from publication: "... double‐blind..." "After randomisation, HbA1c and fasting plasma glucose values were masked to staff at the study centres unless values met glycaemic rescue criteria (and were subsequently provided unmasked). Patients, study investigators, and local sponsor personnel were masked to treatment assignment until final database lock. To maintain masked treatment, study drug was supplied in levels (levels one to five) to allow for masked increases and decreases of glimepiride throughout the double‐blind treatment period." Comment: investigator‐assessed outcome measurement. Blinding of investigator ensured |
| Incomplete outcome data (attrition bias) all‐cause/cardiovascular mortality | Low risk |
Quote from publication: "We did primary efficacy analyses in the modified intention‐to‐treat population, according to randomised treatment assignment. We did safety analyses in the same population according to the predominant treatment received (no patients received treatment other than that to which they were randomly assigned, so the modified intention‐to‐treat and safety analysis populations were identical). Missing data were imputed with the LOCF approach; in patients given glycaemic rescue drug, the last observation before rescue initiation was used." "The proportions of patients who received glycemic rescue therapy during the entire 104‐week treatment period were 19.9%, 13.0%, and 20.9%, respectively, in the canagliflozin 100 and 300 mg and glimepiride groups therapy." Comment: > 99% of the randomised participants were included in the analyses. There was a high dropout rate (65%‐71% of randomised participants completed the study), however, the dropout rate was balanced between groups. Inappropriate method of imputing missing data was used (LOCF). We assumed that trial authors searched registers for mortality status at the end of the trial |
| Incomplete outcome data (attrition bias) hypoglycaemia | Low risk |
Quote from publication: "We did primary efficacy analyses in the modified intention‐to‐treat population, according to randomised treatment assignment. We did safety analyses in the same population according to the predominant treatment received (no patients received treatment other than that to which they were randomly assigned, so the modified intention‐to‐treat and safety analysis populations were identical). Missing data were imputed with the LOCF approach; in patients given glycaemic rescue drug, the last observation before rescue initiation was used." "The proportions of patients who received glycemic rescue therapy during the entire 104‐week treatment period were 19.9%, 13.0%, and 20.9%, respectively, in the canagliflozin 100 and 300 mg and glimepiride groups therapy." Comment: > 99% of the randomised participants were included in the analyses. There was a high dropout rate (65%‐71% of randomised participants completed the study), however, the dropout rate was balanced between groups. The reasons for dropouts were balanced among the intervention groups. Inappropriate method of imputing missing data was used (LOCF). The proportion of missing outcomes compared with observed event risk was not enough to have a clinically relevant impact on the intervention effect estimate |
| Incomplete outcome data (attrition bias) non‐fatal myocardial infarction/heart failure/non‐fatal stroke | High risk |
Quote from publication: "We did primary efficacy analyses in the modified intention‐to‐treat population, according to randomised treatment assignment. We did safety analyses in the same population according to the predominant treatment received (no patients received treatment other than that to which they were randomly assigned, so the modified intention‐to‐treat and safety analysis populations were identical). Missing data were imputed with the LOCF approach; in patients given glycaemic rescue drug, the
last observation before rescue initiation was used." "The proportions of patients who received glycemic rescue therapy during the entire 104‐week treatment period were 19.9%, 13.0%, and 20.9%, respectively, in the canagliflozin 100 and 300 mg and glimepiride groups therapy." Comment: > 99% of the randomised participants were included in the analyses. There was a high dropout rate (65%‐71% of randomised participants completed the study), however, the dropout rate was balanced between groups. The reasons for dropouts were balanced among the intervention groups. Inappropriate method of imputing missing data was used (LOCF). The proportion of missing outcomes compared with observed event risk was enough to induce clinically relevant bias in intervention effect estimate |
| Incomplete outcome data (attrition bias) non‐serious adverse events | Low risk |
Quote from publication: "We did primary efficacy analyses in the modified intention‐to‐treat population, according to randomised treatment assignment. We did safety analyses in the same population according to the predominant treatment received (no patients received treatment other than that to which they were randomly assigned, so the modified intention‐to‐treat and safety analysis populations were identical). Missing data were imputed with the LOCF approach; in patients given glycaemic rescue drug, the last observation before rescue initiation was used." "The proportions of patients who received glycemic rescue therapy during the entire 104‐week treatment period were 19.9%, 13.0%, and 20.9%, respectively, in the canagliflozin 100 and 300 mg and glimepiride groups therapy." Comment: > 99% of the randomised participants were included in the analyses. There was a high dropout rate (65%‐71% of randomised participants completed the study), however, the dropout rate was balanced between groups. The reasons for dropouts were balanced among the intervention groups. Inappropriate method of imputing missing data was used (LOCF). The proportion of missing outcomes compared with observed event risk was not enough to have a clinically relevant impact on the intervention effect estimate |
| Incomplete outcome data (attrition bias) serious adverse events | High risk |
Quote from publication: "We did primary efficacy analyses in the modified intention‐to‐treat population, according to randomised treatment assignment. We did safety analyses in the same population according to the predominant treatment received (no patients received treatment other than that to which they were randomly assigned, so the modified intention‐to‐treat and safety analysis populations were identical). Missing data were imputed with the LOCF approach; in patients given glycaemic rescue drug, the last observation before rescue initiation was used." "The proportions of patients who received glycemic rescue therapy during the entire 104‐week treatment period were 19.9%, 13.0%, and 20.9%, respectively, in the canagliflozin 100 and 300 mg and glimepiride groups therapy." Comment: > 99% of the randomised participants were included in the analyses. There was a high dropout rate (65%‐71% of randomised participants completed the study), however, the dropout rate was balanced between groups. The reasons for dropouts were balanced among the intervention groups. Inappropriate method of imputing missing data was used (LOCF). The proportion of missing outcomes compared with observed event risk was enough to induce clinically relevant bias in intervention effect estimate |
| Incomplete outcome data (attrition bias) weight (kg) | Unclear risk |
Quote from publication: "We did primary efficacy analyses in the modified intention‐to‐treat population, according to randomised treatment assignment. We did safety analyses in the same population according to the predominant treatment received (no patients received treatment other than that to which they were randomly assigned, so the modified intention‐to‐treat and safety analysis populations were identical). Missing data were imputed with the LOCF approach; in patients given glycaemic rescue drug, the last observation before rescue initiation was used." "The proportions of patients who received glycemic rescue therapy during the entire 104‐week treatment period were 19.9%, 13.0%, and 20.9%, respectively, in the canagliflozin 100 and 300 mg and glimepiride groups therapy." Comment: > 99% of the randomised participants were included in the analyses. There was a high dropout rate (65%‐71% of randomised participants completed the study), however, the dropout rate was balanced between groups. The reasons for dropouts were balanced among the intervention groups. Inappropriate method of imputing missing data was used (LOCF). Not sure if plausible effect size among missing outcomes is enough to induce clinically relevant bias in observed effect size |
| Incomplete outcome data (attrition bias) HbA1c | Unclear risk |
Quote from publication: "We did primary efficacy analyses in the modified intention‐to‐treat population, according to randomised treatment assignment. We did safety analyses in the same population according to the predominant treatment received (no patients received treatment other than that to which they were randomly assigned, so the modified intention‐to‐treat and safety analysis populations were identical). Missing data were imputed with the LOCF approach; in patients given glycaemic rescue drug, the last observation before rescue initiation was used." "The proportions of patients who received glycemic rescue therapy during the entire 104‐week treatment period were 19.9%, 13.0%, and 20.9%, respectively, in the canagliflozin 100 and 300 mg and glimepiride groups therapy." Comment: > 99% of the randomised participants were included in the analyses. There was a high dropout rate (65%‐71% of randomised participants completed the study), however, the dropout rate was balanced between groups. The reasons for dropouts were balanced among the intervention groups. Inappropriate method of imputing missing data was used (LOCF). Not sure if plausible effect size among missing outcomes is enough to induce clinically relevant bias in observed effect size |
| Selective reporting (reporting bias) | Low risk | Comment: all of the trial's primary and secondary outcomes as specified in the protocol have been reported |
| Other bias | Unclear risk | Comment: the trial received funding from a pharmaceutical company |
Maffioli 2013.
| Methods |
Study design: randomised, double‐blind, parallel‐study Randomisation ratio: 1:1 to receive pioglitazone or glibenclamide alone or in combination with rosuvastatin in addition to metformin therapy |
|
| Participants |
Inclusion criteria: T2DM, ≥ 18 years of age, naive to treatment, and with poor glycaemic control, expressed as HbA1c level > 8.0%, and in overweight or obese (BMI 25.0–34.9 kg/m²) with hepatic steatosis (ultrasonography diagnosis) Exclusion criteria: history of ketoacidosis or rapidly progressive diabetic retinopathy (defined by the presence of cotton wool spots on the retina at the ophthalmic examination), nephropathy (defined by the onset of albumin excretion > 300 mg/24 h or albumin excretion rate > 200 mg/min over a 6‐month period), or neuropathy (diagnosed both clinically and by electrophysiologic testing). People with impaired renal function (defined as serum creatinine level > ULN for age and sex) or muscle toxicity or serum creatine phosphokinase values > 2 x ULN or severe anaemia (defined as haemoglobin level < 8 g/dL). People with T1DM, people with valvular heart disease, and people with hypertensive retinopathy of III or IV grade by Keith–Wagener–Barker. People with unstable cardiovascular conditions (e.g. NYHA class I–IV congestive heart failure or a history of MI or stroke) or past incidences of cerebrovascular conditions within 6 months of study enrolment. Women who were pregnant or breastfeeding or who might become pregnant (because of inadequate contraceptive precautions). People with known contraindications to pioglitazone (osteoporosis and heart failure) or glibenclamide (frequent hypoglycaemia) or HMG‐CoA inhibitors (previous rhabdomyolysis, muscular pathologies) Diagnostic criteria: ESC and EASD 2007 |
|
| Interventions |
Number of study centres:1 Run‐in period: yes, 3‐month run‐in period with metformin 850 mg 3 x/day Extension period: no |
|
| Outcomes | Composite outcome measures reported: no | |
| Study details |
Trial terminated early: no Trial ID: ‐ |
|
| Publication details |
Language of publication: English Funding: non‐commercial funding Publication status: peer‐reviewed journal |
|
| Stated aim for study | Quote from publication: " ... the aim of this study was to evaluate the effects of pioglitazone or glibenclamide alone and in combination with rosuvastatin on hepatic steatosis, evaluated by abdominal ultrasonography, in type 2 diabetic patients." | |
| Notes | ‐ | |
| Risk of bias | ||
| Bias | Authors' judgement | Support for judgement |
| Random sequence generation (selection bias) | Low risk |
Quote from publication: "Pioglitazone, glibenclamide, and rosuvastatin were supplied as identical, opaque, white capsules in coded bottles to ensure the blind status of the study. Randomization was carried out using a drawing of envelopes containing randomization codes prepared by a statistician. A copy of the code was provided only to the responsible individual carrying out the statistical analysis. The code was only broken after database lock, but could have been broken for individual patients in cases of an emergency." Comment: adequate generation of random sequence ensured |
| Allocation concealment (selection bias) | Low risk |
Quote from publication: "Pioglitazone, glibenclamide, and rosuvastatin were supplied as identical, opaque, white capsules in coded bottles to ensure the blind status of the study. Randomization was carried out using a drawing of envelopes containing randomization codes prepared by a statistician. A copy of the code was provided only to the responsible individual carrying out the statistical analysis. The code was only broken after database lock, but could have been broken for individual patients in cases of an emergency." Comment: adequate concealment of allocation ensured |
| Blinding of participants and personnel (performance bias) weight (kg) | Low risk |
Quote from publication: "double‐blind". "Pioglitazone, glibenclamide, and rosuvastatin were supplied as identical, opaque, white capsules in coded bottles to ensure the blind status of the study." Comment: investigator‐assessed outcome measurement. Blinding of investigator ensured |
| Blinding of participants and personnel (performance bias) HbA1c | Low risk |
Quote from publication: "double‐blind". "Pioglitazone, glibenclamide, and rosuvastatin were supplied as identical, opaque, white capsules in coded bottles to ensure the blind status of the study." Comment: investigator‐assessed outcome measurement. Blinding of investigator ensured |
| Blinding of outcome assessment (detection bias) weight (kg) | Low risk |
Quote from publication: "double‐blind". "Pioglitazone, glibenclamide, and rosuvastatin were supplied as identical, opaque, white capsules in coded bottles to ensure the blind status of the study." Comment: investigator‐assessed outcome measurement. Blinding of investigator ensured |
| Blinding of outcome assessment (detection bias) HbA1c | Low risk |
Quote from publication: "double‐blind". "Pioglitazone, glibenclamide, and rosuvastatin were supplied as identical, opaque, white capsules in coded bottles to ensure the blind status of the study." Comment: investigator‐assessed outcome measurement. Blinding of investigator ensured |
| Incomplete outcome data (attrition bias) weight (kg) | Low risk |
Quote from publication: "Every patient who had received at least one dose of the study medication underwent a tolerability observation to exclude the presence of acute adverse reactions"; "Then, an intention‐to‐treat analysis was carried out in patients who had received one or more doses of study medication, did not show any acute adverse reaction, and had undergone a subsequent efficacy observation." Comment: 94% of randomised participants completed the study. 94% of randomised participants were included in the analysis. Only participants who completed the study were included in the analysis. The number of participants who dropped out was balanced between groups. The reasons for dropouts were balanced among the intervention groups. Plausible effect size among missing outcomes was not enough to have a clinically relevant impact on observed effect size |
| Incomplete outcome data (attrition bias) HbA1c | Low risk |
Quote from publication: "Every patient who had received at least one dose of the study medication underwent a tolerability observation to exclude the presence of acute adverse reactions"; "Then, an intention‐to‐treat analysis was carried out in patients who had received one or more doses of study medication, did not show any acute adverse reaction, and had undergone a subsequent efficacy observation." Comment: 94% of randomised participants completed the study. 94% of randomised participants were included in the analysis. Only participants who completed the study were included in the analysis. The number of participants who dropped out was balanced between groups. The reasons for dropouts were balanced among the intervention groups. Plausible effect size among missing outcomes was not enough to have a clinically relevant impact on observed effect size |
| Selective reporting (reporting bias) | High risk | Comment: no trial protocol available. All of the trial's prespecified primary and secondary outcomes (methods section) have been reported. Unclear whether common outcomes (all‐cause mortality) were measured; not mentioned, but clinical judgement says likely to have been measured and analysed but not reported on the basis of non‐significant results. Incomplete reporting of adverse events and hypoglycaemia, only events leading to discontinuation are mentioned |
| Other bias | Unclear risk | Comment: in 2011 the primary author performed a similar study (Derosa 2011b) |
Matthews 2010.
| Methods |
Study design: multicentre, randomised, double‐blind, double‐dummy, active‐controlled study Randomisation ratio: 1:1 to receive glimepiride or vildagliptin in addition to metformin Non‐inferiority design: 1‐sided confidence interval |
|
| Participants |
Inclusion criteria: male and female participants (non‐fertile or using a medically approved birth control method) with T2DM and HbA1c of 6.5%–8.5%, who had received metformin for ≥ 3 months and were on a stable dose of ≥ 1500 mg daily for a minimum of ≥ 4 weeks prior to visit 1, aged 18–73 years, BMI of 22–45 kg/m² Exclusion criteria: T1DM or secondary forms of diabetes, acute metabolic diabetic complications in the past 6 months, acute infections that might affect blood glucose control in the 4 weeks prior to visit 1, serious cardiac conditions (history of torsades de pointes or ventricular tachycardia; percutaneous coronary intervention in the past 3 months; myocardial infarction, coronary artery bypass surgery, unstable angina or stroke in the past 6 months; congestive heart failure requiring pharmacological treatment; second‐ or third‐degree atrioventricular block or prolonged QTc) or clinically significant liver or renal disease, ALT or AST > 3 x ULN, direct bilirubin > 1.3 x ULN, serum creatinine levels ≥ 132 mmol/L in men or ≥ 123 mmol/L in women, clinically significant TSH outside of normal range at screening; or fasting triglycerides > 7.9 mmol/L Diagnostic criteria: not reported |
|
| Interventions |
Number of study centres: 402 Run‐in period: no Extension period: no |
|
| Outcomes | Composite outcome measures reported: yes, composite outcome measure of cardiovascular and cerebrovascular outcomes | |
| Study details |
Trial terminated early: yes. "The study was originally planned to last for up to 5 years to assess treatment durability, and had a primary endpoint of risk of failure of glycaemic control defined as HbA1 >8%. However, the scope of the study was later modified because of a much higher than expected discontinuation rate and fewer participants than expected reaching the endpoint of HbA1c >8% (because of a change in standards of care, meaning that participants dropped out of the study to receive additional therapy before reaching this endpoint). The power was re‐estimated using a blinded sample population and found to be insufficient. The study purpose was therefore amended to a 2‐year non‐inferiority study and the primary endpoint altered to ‘change in HbA1c from baseline to week 104 endpoint’. The trial ended when the last randomized participant had been in the study for 2 years." Trial ID:NCT00106340, EudraCT2004‐004559‐21, CLAF237A2308 |
|
| Publication details |
Language of publication: English Funding: commercial funding by Novartis Pharmaceuticals Corporation Publication status: peer‐reviewed journal |
|
| Stated aim for study | Quote from publication: "To show that vildagliptin added to metformin is non‐inferior to glimepiride in reducing HbA1c levels from baseline over 2 years" | |
| Notes | ‐ | |
| Risk of bias | ||
| Bias | Authors' judgement | Support for judgement |
| Random sequence generation (selection bias) | Unclear risk |
Quote from publication: "...patients were randomized..." Comment: insufficient information about the sequence generation |
| Allocation concealment (selection bias) | Unclear risk |
Quote from publication: "...patients were randomized..." Comment: insufficient information about the allocation concealment to permit judgement of 'low risk' or 'high risk' |
| Blinding of participants and personnel (performance bias) all‐cause/cardiovascular mortality | Low risk |
Quote from publication: "Masking: Double Blind (Subject, Caregiver, Investigator, Outcomes Assessor)" "...double‐dummy..." "An independent cardiovascular and cerebrovascular (CCV) adjudication committee reviewed all occurrences af CCV events in a blinded fashion." Comment: adjudicated and investigator‐assessed outcome measurement. Blinding of adjudication committee and study personnel ensured |
| Blinding of participants and personnel (performance bias) hypoglycaemia | Low risk |
Quote from publication: "Masking: Double Blind (Subject, Caregiver, Investigator, Outcomes Assessor)" "...double‐dummy..." "...self‐monitored plasma glucose..." Comment: investigator‐assessed and self‐reported outcome measurement. Blinding of participant and study personnel ensured |
| Blinding of participants and personnel (performance bias) non‐fatal myocardial infarction/heart failure/non‐fatal stroke | Low risk |
Quote from publication: "Masking: Double Blind (Subject, Caregiver, Investigator, Outcomes Assessor)" "...double‐dummy..." "An independent cardiovascular and cerebrovascular (CCV) adjudication committee reviewed all occurrences af CCV events in a blinded fashion." Comment: adjudicated outcome measurement. Blinding of adjudication committee ensured |
| Blinding of participants and personnel (performance bias) serious adverse events | Low risk |
Quote from publication: "Masking: Double Blind (Subject, Caregiver, Investigator, Outcomes Assessor)" "...double‐dummy..." "An independent cardiovascular and cerebrovascular (CCV) adjudication committee reviewed all occurrences af CCV events in a blinded fashion." Comment: adjudicated and investigator‐assessed outcome measurement. Blinding of adjudication committee and study personnel ensured |
| Blinding of participants and personnel (performance bias) weight (kg) | Low risk |
Quote from publication: "Masking: Double Blind (Subject, Caregiver, Investigator, Outcomes Assessor)" "...double‐dummy..." Comment: investigator‐assessed and self‐reported outcome measurement. Blinding of participant and study personnel ensured |
| Blinding of participants and personnel (performance bias) HbA1c | Low risk |
Quote from publication: "Masking: Double Blind (Subject, Caregiver, Investigator, Outcomes Assessor)" "...double‐dummy..." Comment: investigator‐assessed outcome measurement. Blinding of study personnel ensured |
| Blinding of outcome assessment (detection bias) all‐cause/cardiovascular mortality | Low risk |
Quote from publication: "Masking: Double Blind (Subject, Caregiver, Investigator, Outcomes Assessor)" "...double‐dummy..." "An independent cardiovascular and cerebrovascular (CCV) adjudication committee reviewed all occurrences af CCV events in a blinded fashion." Comment: adjudicated and investigator‐assessed outcome measurement. Blinding of outcome assessor ensured |
| Blinding of outcome assessment (detection bias) hypoglycaemia | Low risk |
Quote from publication: "Masking: Double Blind (Subject, Caregiver, Investigator, Outcomes Assessor)" "...double‐dummy..." "...self‐monitored plasma glucose..." Comment: investigator‐assessed and self‐reported outcome measurement. Blinding of outcome assessor ensured |
| Blinding of outcome assessment (detection bias) non‐fatal myocardial infarction/heart failure/non‐fatal stroke | Low risk |
Quote from publication: "Masking: Double Blind (Subject, Caregiver, Investigator, Outcomes Assessor)" "...double‐dummy..." "An independent cardiovascular and cerebrovascular (CCV) adjudication committee reviewed all occurrences af CCV events in a blinded fashion." Comment: adjudicated outcome measurement. Blinding of outcome assessor ensured |
| Blinding of outcome assessment (detection bias) serious adverse events | Low risk |
Quote from publication: "Masking: Double Blind (Subject, Caregiver, Investigator, Outcomes Assessor)" "...double‐dummy..." "An independent cardiovascular and cerebrovascular (CCV) adjudication committee reviewed all occurrences af CCV events in a blinded fashion." Comment: adjudicated and investigator‐assessed outcome measurement. Blinding of outcome assessor ensured |
| Blinding of outcome assessment (detection bias) weight (kg) | Low risk |
Quote from publication: "Masking: Double Blind (Subject, Caregiver, Investigator, Outcomes Assessor)" "...double‐dummy..." Comment: investigator‐assessed and self‐reported outcome measurement. Blinding of outcome assessor ensured |
| Blinding of outcome assessment (detection bias) HbA1c | Low risk |
Quote from publication: "Masking: Double Blind (Subject, Caregiver, Investigator, Outcomes Assessor)" "...double‐dummy..." Comment: investigator‐assessed outcome measurement. Blinding of outcome assessor ensured |
| Incomplete outcome data (attrition bias) all‐cause/cardiovascular mortality | Low risk |
Quote from publication: "Safety population: All patients who received at least one dose of study drug and had at least one post baseline safety assessment (including patients on rescue medication)." Comment: > 99% of the randomised participants were included in the analyses. There was a high dropout rate (61%‐64% of randomised participants completed the study), however, the dropout rate was balanced between groups. No information on imputation method. We assumed that trial authors searched registers for mortality status at the end of the trial |
| Incomplete outcome data (attrition bias) hypoglycaemia | High risk |
Quote from publication: "Safety population: All patients who received at least one dose of study drug and had at least one post baseline safety assessment (including patients on rescue medication)." Comment: > 99% of the randomised participants were included in the analyses. There was a high dropout rate (61%‐64% of randomised participants completed the study), however, the dropout rate was balanced between groups. The reasons for dropouts were balanced among the intervention groups. No information on imputation method. The proportion of missing outcomes compared with observed event risk was enough to have a clinically relevant impact on the intervention effect estimate |
| Incomplete outcome data (attrition bias) non‐fatal myocardial infarction/heart failure/non‐fatal stroke | High risk |
Quote from publication: "Safety population: All patients who received at least one dose of study drug and had at least one post baseline safety assessment (including patients on rescue medication)." Comment: > 99% of the randomised participants were included in the analyses. There was a high dropout rate (61%‐64% of randomised participants completed the study), however, the dropout rate was balanced between groups. The reasons for dropouts were balanced among the intervention groups. No information on imputation method. The proportion of missing outcomes compared with observed event risk was enough to induce clinically relevant bias in intervention effect estimate |
| Incomplete outcome data (attrition bias) serious adverse events | High risk |
Quote from publication: "Safety population: All patients who received at least one dose of study drug and had at least one post baseline safety assessment (including patients on rescue medication)." Comment: > 99% of the randomised participants were included in the analyses. There was a high dropout rate (61%‐64% of randomised participants completed the study), however, the dropout rate was balanced between groups. The reasons for dropouts were balanced among the intervention groups. No information on imputation method. The proportion of missing outcomes compared with observed event risk was enough to induce clinically relevant bias in intervention effect estimate |
| Incomplete outcome data (attrition bias) weight (kg) | Unclear risk |
Quote from publication: "Intent‐to‐ treat (ITT) population: All patients who received at least one dose of study drug and had at least one post baseline efficacy assessment (primary or secondary). Assessments made while on rescue medication were not included." Comment: > 97% of the randomised participants were included in the analyses. There was a high dropout rate (61%‐64% of randomised participants completed the study), however, the dropout rate was balanced between groups. The reasons for dropouts were balanced among the intervention groups. No information on imputation method. Not sure if plausible effect size among missing outcomes is enough to induce clinically relevant bias in observed effect size |
| Incomplete outcome data (attrition bias) HbA1c | Unclear risk |
Quote from publication: "Intent‐to‐ treat (ITT) population: All patients who received at least one dose of study drug and had at least one post baseline efficacy assessment (primary or secondary). Assessments made while on rescue medication were not included." "The primary efficacy assessment was change from baseline in HbA1c at study endpoint, using last observation carried forward for patients who discontinued early. For patients who received rescue medication, the week 104 endpoint was defined as the measurement obtained at the last visit before rescue medication." Comment: > 94% of the randomised participants were included in the analyses. There was a high dropout rate (61%‐64% of randomised participants completed the study), however, the dropout rate was balanced between groups. The reasons for dropouts were balanced among the intervention groups. Inappropriate method of imputing missing data was used (LOCF). Not sure if plausible effect size among missing outcomes is enough to induce clinically relevant bias in observed effect size |
| Selective reporting (reporting bias) | Low risk | Comment: all of the trial's primary and secondary outcomes as specified in the protocol have been reported |
| Other bias | Unclear risk | Comment: the trial received funding from a pharmaceutical company |
Nauck 2013.
| Methods |
Study design: double‐blind, double‐dummy, active‐control, parallel‐group, multicentre, multinational trial Randomisation ratio: 2:2:2:1:2 to receive one of three doses of liraglutide (0.6, 1.2 or 1.8 mg/day) in addition to metformin, metformin plus placebo (liraglutide or glimepiride) or glimepiride in addition to metformin Superiority design or non‐inferiority design: superiority of glycaemic control with liraglutide was determined if the upper limit of the two‐sided 95% confidence interval for the treatment difference was < 0%, non‐inferiority was concluded if < 0.4%. Significance was P < 0.05 |
|
| Participants |
Inclusion criteria: T2DM, 18–80 years of age, HbA1c between 7% and 11% (prestudy OAD monotherapy for ≥ 3 months) or between 7% and 10% (prestudy combination OAD therapy for ≥ 3 months), BMI ≤ 40 kg/m² Exclusion criteria: used insulin during the previous 3 months (except short‐term treatment), any serious medical condition, women of child bearing potential who were pregnant, breast‐feeding or intending to become pregnant or not using adequate contraceptive methods, participants using any drug (except for OADs), which in the Investigator's opinion could interfere with the glucose level (e.g. systemic corticosteroids) Diagnostic criteria: not reported |
|
| Interventions |
Number of study centres: 170 Run‐in period: 3‐week forced titration period followed by a 3‐week metformin maintenance period. Particiapnts taking metformin at enrolment could go through a modified titration period or advance directly to the metformin maintenance period. After randomisation participants underwent a 2‐ and 3‐week titration period of for liraglutide and glimepiride Extension period: yes, participants completing the 26‐week double‐blind core period could enrol in an 18‐month open‐label extension period |
|
| Outcomes | Composite outcome measures reported: yes, composite endpoint of HbA1c < 7.0% (< 53mmol/mol), no weight gain and no hypoglycaemia | |
| Study details |
Trial terminated early: no Trial ID:NCT00318461 |
|
| Publication details |
Language of publication: English Funding: commercial funding, sponsored by Novo Nordisk A/S Publication status: peer‐reviewed journal |
|
| Stated aim for study | Quote from publication: "To investigate efficacy and safety of dual therapy with liraglutide and metformin in comparison to glimepiride and metformin, and metformin monotherapy over 2 years in patients with type 2 diabetes." | |
| Notes | ‐ | |
| Risk of bias | ||
| Bias | Authors' judgement | Support for judgement |
| Random sequence generation (selection bias) | Low risk |
Quote from publication: "Randomization was performed using a telephone‐based or web‐based randomization system. Subjects were randomly assigned to the lowest available randomization number and stratified with respect to their previous use of OAD monotherapy or combination therapy." Comment: adequate generation of random sequence ensured |
| Allocation concealment (selection bias) | Low risk |
Quote from publication: "Randomization was performed using a telephone‐based or web‐based randomization system. Subjects were randomly assigned to the lowest available randomization number and stratified with respect to their previous use of OAD monotherapy or combination therapy." Comment: adequate concealment ensured |
| Blinding of participants and personnel (performance bias) all‐cause/cardiovascular mortality | Low risk |
Quote from publication: "... double‐dummy... The double‐dummy design required that subjects in the liraglutide and placebo groups received a glimepiride placebo, whereas subjects in the glimepiride and placebo groups received an injection of liraglutide placebo." "Subjects completing the study could enroll in an 18‐month open‐label extension period." Comment: investigator‐assessed outcome measurement. Incomplete blinding, but the outcome is not likely to be influenced by lack of blinding due to objective assessment of the outcome |
| Blinding of participants and personnel (performance bias) amputation of lower extremity/blindness or severe vision loss/end‐stage renal disease | Low risk |
Quote from publication: "... double‐dummy... The double‐dummy design required that subjects in the liraglutide and placebo groups received a glimepiride placebo, whereas subjects in the glimepiride and placebo groups received an injection of liraglutide placebo." "Subjects completing the study could enroll in an 18‐month open‐label extension period." Comment: investigator‐assessed outcome measurement. Incomplete blinding, but the outcome is not likely to be influenced by lack of blinding due to objective assessment of the outcome |
| Blinding of participants and personnel (performance bias) hypoglycaemia | Low risk |
Quote from publication: "... double‐dummy... The double‐dummy design required that subjects in the liraglutide and placebo groups received a glimepiride placebo, whereas subjects in the glimepiride and placebo groups received an injection of liraglutide placebo." "Subjects completing the study could enroll in an 18‐month open‐label extension period." "Hypoglycaemic episodes were defined as major, minor, or symptoms only. Major if the subject was unable to treat her/himself. Minor if subject was able to treat her/himself and plasma glucose was below 3.1 mmol/L." Comment: self‐reported outcome measurement. Incomplete blinding, but the outcome is not likely to be influenced by lack of blinding due to objective assessment of the outcome |
| Blinding of participants and personnel (performance bias) non‐fatal myocardial infarction/heart failure/non‐fatal stroke | Low risk |
Quote from publication: "... double‐dummy... The double‐dummy design required that subjects in the liraglutide and placebo groups received a glimepiride placebo, whereas subjects in the glimepiride and placebo groups received an injection of liraglutide placebo." "Subjects completing the study could enroll in an 18‐month open‐label extension period." Comment: investigator‐assessed outcome measurement. Incomplete blinding, but the outcome is not likely to be influenced by lack of blinding due to objective assessment of the outcome |
| Blinding of participants and personnel (performance bias) non‐serious adverse events | High risk |
Quote from publication: "... double‐dummy... The double‐dummy design required that subjects in the liraglutide and placebo groups received a glimepiride placebo, whereas subjects in the glimepiride and placebo groups received an injection of liraglutide placebo." "Subjects completing the study could enroll in an 18‐month open‐label extension period." Comment: self‐reported outcome measurement. Incomplete blinding, the outcome is likely to be influenced by lack of blinding due to subjective assessment of the outcome |
| Blinding of participants and personnel (performance bias) serious adverse events | Low risk |
Quote from publication: "... double‐dummy... The double‐dummy design required that subjects in the liraglutide and placebo groups received a glimepiride placebo, whereas subjects in the glimepiride and placebo groups received an injection of liraglutide placebo." "Subjects completing the study could enroll in an 18‐month open‐label extension period." Comment: investigator‐assessed outcome measurement. Incomplete blinding, but the outcome is not likely to be influenced by lack of blinding due to objective assessment of the outcome |
| Blinding of participants and personnel (performance bias) weight (kg) | Low risk |
Quote from publication: "... double‐dummy... The double‐dummy design required that subjects in the liraglutide and placebo groups received a glimepiride placebo, whereas subjects in the glimepiride and placebo groups received an injection of liraglutide placebo." "Subjects completing the study could enroll in an 18‐month open‐label extension period." Comment: self‐reported or investigator‐assessed outcome measurement. Incomplete blinding, but the outcome is not likely to be influenced by lack of blinding due to objective assessment of the outcome |
| Blinding of participants and personnel (performance bias) HbA1c | Low risk |
Quote from publication: "... double‐dummy... The double‐dummy design required that subjects in the liraglutide and placebo groups received a glimepiride placebo, whereas subjects in the glimepiride and placebo groups received an injection of liraglutide placebo." "Subjects completing the study could enroll in an 18‐month open‐label extension period." Comment: investigator‐assessed outcome measurement. Incomplete blinding, but the outcome is not likely to be influenced by lack of blinding due to objective assessment of the outcome |
| Blinding of outcome assessment (detection bias) all‐cause/cardiovascular mortality | Low risk |
Quote from publication: "... double‐dummy... The double‐dummy design required that subjects in the liraglutide and placebo groups received a glimepiride placebo, whereas subjects in the glimepiride and placebo groups received an injection of liraglutide placebo." "Subjects completing the study could enroll in an 18‐month open‐label extension period." Comment: investigator‐assessed outcome measurement. Incomplete blinding, but the outcome is not likely to be influenced by lack of blinding due to objective assessment of the outcome |
| Blinding of outcome assessment (detection bias) amputation of lower extremity/blindness or severe vision loss/end‐stage renal disease | Low risk |
Quote from publication: "... double‐dummy... The double‐dummy design required that subjects in the liraglutide and placebo groups received a glimepiride placebo, whereas subjects in the glimepiride and placebo groups received an injection of liraglutide placebo." "Subjects completing the study could enroll in an 18‐month open‐label extension period." Comment: investigator‐assessed outcome measurement. Incomplete blinding, but the outcome is not likely to be influenced by lack of blinding due to objective assessment of the outcome |
| Blinding of outcome assessment (detection bias) hypoglycaemia | Low risk |
Quote from publication: "... double‐dummy... The double‐dummy design required that subjects in the liraglutide and placebo groups received a glimepiride placebo, whereas subjects in the glimepiride and placebo groups received an injection of liraglutide placebo." "Subjects completing the study could enroll in an 18‐month open‐label extension period." "Hypoglycaemic episodes were defined as major, minor, or symptoms only. Major if the subject was unable to treat her/himself. Minor if subject was able to treat her/himself and plasma glucose was below 3.1 mmol/L." Comment: self‐reported outcome measurement. Incomplete blinding, but the outcome is not likely to be influenced by lack of blinding due to objective assessment of the outcome |
| Blinding of outcome assessment (detection bias) non‐fatal myocardial infarction/heart failure/non‐fatal stroke | Low risk |
Quote from publication: "... double‐dummy... The double‐dummy design required that subjects in the liraglutide and placebo groups received a glimepiride placebo, whereas subjects in the glimepiride and placebo groups received an injection of liraglutide placebo." "Subjects completing the study could enroll in an 18‐month open‐label extension period." Comment: investigator‐assessed outcome measurement. Incomplete blinding, but the outcome is not likely to be influenced by lack of blinding due to objective assessment of the outcome |
| Blinding of outcome assessment (detection bias) non‐serious adverse events | High risk |
Quote from publication: "... double‐dummy... The double‐dummy design required that subjects in the liraglutide and placebo groups received a glimepiride placebo, whereas subjects in the glimepiride and placebo groups received an injection of liraglutide placebo." "Subjects completing the study could enroll in an 18‐month open‐label extension period." Comment: self‐reported outcome measurement. Incomplete blinding, the outcome is likely to be influenced by lack of blinding due to subjective assessment of the outcome |
| Blinding of outcome assessment (detection bias) serious adverse events | Low risk |
Quote from publication: "... double‐dummy... The double‐dummy design required that subjects in the liraglutide and placebo groups received a glimepiride placebo, whereas subjects in the glimepiride and placebo groups received an injection of liraglutide placebo." "Subjects completing the study could enroll in an 18‐month open‐label extension period." Comment: investigator‐assessed outcome measurement. Incomplete blinding, but the outcome is not likely to be influenced by lack of blinding due to objective assessment of the outcome |
| Blinding of outcome assessment (detection bias) weight (kg) | Low risk |
Quote from publication: "... double‐dummy... The double‐dummy design required that subjects in the liraglutide and placebo groups received a glimepiride placebo, whereas subjects in the glimepiride and placebo groups received an injection of liraglutide placebo." "Subjects completing the study could enroll in an 18‐month open‐label extension period." Comment: self‐reported or investigator‐assessed outcome measurement. Incomplete blinding, but the outcome is not likely to be influenced by lack of blinding due to objective assessment of the outcome |
| Blinding of outcome assessment (detection bias) HbA1c | Low risk |
Quote from publication: "... double‐dummy... The double‐dummy design required that subjects in the liraglutide and placebo groups received a glimepiride placebo, whereas subjects in the glimepiride and placebo groups received an injection of liraglutide placebo." "Subjects completing the study could enroll in an 18‐month open‐label extension period." Comment: investigator‐assessed outcome measurement. Incomplete blinding, but the outcome is not likely to be influenced by lack of blinding due to objective assessment of the outcome |
| Incomplete outcome data (attrition bias) all‐cause/cardiovascular mortality | Low risk |
Quote from publication: "Safety analysis set is all randomised subjects who were exposed to at least one dose of study product." Comment: > 99% of the randomised participants were included in the analyses. There was a high dropout rate and it was not balanced (25%‐57% of randomised participants completed the study). No information on imputation method. We assumed that trial authors searched registers for mortality status at the end of the trial |
| Incomplete outcome data (attrition bias) amputation of lower extremity/blindness or severe vision loss/end‐stage renal disease | High risk |
Quote from publication: "Safety analysis set is all randomised subjects who were exposed to at least one dose of study product." Comment: > 99% of the randomised participants were included in the analyses. There was a high dropout rate and it was not balanced (25% to 57% of randomised participants completed the study). The reasons for dropouts were not balanced among the intervention groups (a difference of > 10% in dropouts due to adverse events between the liraglutide 1.8 mg group and metformin + placebo group and a difference of > 10% in dropouts due to lack of efficacy between the metformin + placebo group compared to all other groups and between the glimepiride group and the liraglutide 1.2 mg group). No information on imputation method. The proportion of missing outcomes compared with observed event risk was enough to induce clinically relevant bias in intervention effect estimate |
| Incomplete outcome data (attrition bias) hypoglycaemia | High risk |
Quote from publication: "Safety analysis set is all randomised subjects who were exposed to at least one dose of study product." Comment: > 99% of the randomised participants were included in the analyses. There was a high dropout rate and it was not balanced (25%‐57% of randomised participants completed the study). The reasons for dropouts were not balanced among the intervention groups (a difference of > 10% in dropouts due to adverse events between the liraglutide 1.8 mg group and metformin + placebo group and a difference of > 10% in dropouts due to lack of efficacy between the metformin + placebo group compared to all other groups and between the glimepiride group and the liraglutide 1.2 mg group). No information on imputation method. The proportion of missing outcomes compared with observed event risk was enough to induce clinically relevant bias in intervention effect estimate |
| Incomplete outcome data (attrition bias) non‐fatal myocardial infarction/heart failure/non‐fatal stroke | High risk |
Quote from publication: "Safety analysis set is all randomised subjects who were exposed to at least one dose of study product." Comment: > 99% of the randomised participants were included in the analyses. There was a high dropout rate and it was not balanced (25%‐57% of randomised participants completed the study). The reasons for dropouts were not balanced among the intervention groups (a difference of > 10% in dropouts due to adverse events between the lira 1.8‐group and metformin + placebo group and a difference of > 10% in dropouts due to lack of efficacy between the metformin + placebo group compared to all other groups and between the glimepiride group and the lira 1.2 mg group). No information on imputation method. The proportion of missing outcomes compared with observed event risk was enough to induce clinically relevant bias in intervention effect estimate |
| Incomplete outcome data (attrition bias) non‐serious adverse events | High risk |
Quote from publication: "Safety analysis set is all randomised subjects who were exposed to at least one dose of study product." Comment: > 99% of the randomised participants were included in the analyses. There was a high dropout rate and it was not balanced (25%‐57% of randomised participants completed the study). The reasons for dropouts were not balanced among the intervention groups (a difference of > 10% in dropouts due to adverse events between the liraglutide 1.8 mg group and metformin + placebo group and a difference of > 10% in dropouts due to lack of efficacy between the metformin + placebo group compared to all other groups and between the glimepiride group and the liraglutide 1.2 mg group). No information on imputation method. The proportion of missing outcomes compared with observed event risk was enough to induce clinically relevant bias in intervention effect estimate |
| Incomplete outcome data (attrition bias) serious adverse events | High risk |
Quote from publication: "Safety analysis set is all randomised subjects who were exposed to at least one dose of study product." Comment: > 99% of the randomised participants were included in the analyses. There was a high dropout rate and it was not balanced (25%‐57% of randomised participants completed the study). The reasons for dropouts were not balanced among the intervention groups (a difference of > 10% in dropouts due to adverse events between the liraglutide 1.8 mg group and metformin + placebo group and a difference of > 10% in dropouts due to lack of efficacy between the metformin + placebo group compared to all other groups and between the glimepiride group and the liraglutide 1.2 mg group). No information on imputation method. The proportion of missing outcomes compared with observed event risk was enough to induce clinically relevant bias in intervention effect estimate |
| Incomplete outcome data (attrition bias) weight (kg) | High risk |
Quote from publication: "Unless specified, efficacy endpoints were analysed using the intent‐to‐treat (ITT) population (all randomized patients exposed to drug). Missing data were imputed using last observation carried forward (LOCF)" Comment: > 97% of the randomised participants were included in the analyses. There was a high dropout rate and it was not balanced (25%‐57% of randomised participants completed the study). The reasons for dropouts were not balanced among the intervention groups (a difference of > 10% in dropouts due to adverse events between the liraglutide 1.8 mg group and metformin + placebo group and a difference of > 10% in dropouts due to lack of efficacy between the metformin + placebo group compared to all other groups and between the glimepiride group and the liraglutide 1.2 mg group). Inapropriate method to impute missing data (LOCF). Plausible effect size among missing outcomes enough to induce clinically relevant bias in observed effect size |
| Incomplete outcome data (attrition bias) HbA1c | High risk |
Quote from publication: "Unless specified, efficacy endpoints were analysed using the intent‐to‐treat (ITT) population (all randomized patients exposed to drug). Missing data were imputed using last observation carried forward (LOCF)" Comment: > 95% of the randomised participants were included in the analyses. There was a high dropout rate and it was not balanced (25%‐57% of randomised participants completed the study). The reasons for dropouts were not balanced among the intervention groups (a difference of > 10% in dropouts due to adverse events between the liraglutide 1.8 mg group and metformin + placebo group and a difference of > 10% in dropouts due to lack of efficacy between the metformin + placebo group compared to all other groups and between the glimepiride group and the liraglutide 1.2 mg group). Inapropriate method to impute missing data (LOCF). Plausible effect size among missing outcomes enough to induce clinically relevant bias in observed effect size |
| Selective reporting (reporting bias) | Low risk | Comment: all of the trial's primary and secondary outcomes as specified in the protocol have been reported |
| Other bias | Unclear risk | Comment: the trial received funding from a pharmaceutical company |
NCT00367055.
| Methods |
Study design: open, national, randomised, multi‐centre, parallel‐group, controlled study Randomisation ratio: 1:1 to receive fixed association of rosiglitazone‐metformin or free association of gliclazide in addition to metformin |
|
| Participants |
Inclusion criteria: adults aged 40‐75 years, T2DM diagnosed at ≥ 1 year previously, treated with metformin at a minimum dose of 1.5 g/day and maximum dose of 3 g/day and at stable dose for at least 8 weeks before selection visit, HbA1c level > 6.5% and ≤ 8.5%, BMI > 25 and < 35 Exclusion criteria: T1DM, treatment with other hypoglycaemic agents than metformin in the last 3 months, FPG > 200 mg/dL at visit 2, hypersensitivity to the studied treatments (rosiglitazone, metformin chlor hydrate, gliclazide), congestive heart failure, unstable or severe angina, recent MI, respiratory insufficiency, use of insulin for glycaemic control in the past 6 months prior to visit 1 (except during pregnancy or acute episodes such as hospitalisation, trauma or infection), history of metabolic acidosis including diabetic ketoacidosis, anaemia defined by haemoglobin concentration < 11.0 g/dL for men and <10.0 g/dL for women, renal disease or renal dysfunction, e.g. as suggested by serum creatinine levels ≥ 135.0 µmol/L in men and ≥ 110.0 µmol/L in women and/or creatinine clearance < 40 mL/min, presence of clinically significant hepatic disease, with ALT, AST, total bilirubin, alkaline phosphatase > 2.5 x ULN, chronic diseases requiring periodic or intermittent treatment with oral or IV corticosteroids, participants receiving danazol, miconazole or phenylbutazone, active alcohol, drug or medication abuse within the last 6 months or any condition that would indicate the likelihood of poor participant compliance, women who were lactating, pregnant or planning to become pregnant, any clinically significant abnormality identified at screening which, in the investigator's judgement, makes the patient unsuitable for inclusion in the study, use of any other investigational agent within 30 days or 5 half‐lives (whichever is longer) prior to visit 1, received or anticipate receiving radiocontrast dye during the study Diagnostic criteria: WHO criteria |
|
| Interventions |
Number of study centres: 94 Run‐in period: no Extension period: no |
|
| Outcomes | Composite outcome measures reported: no | |
| Study details |
Trial terminated early: no Trial ID:NCT00367055 |
|
| Publication details |
Language of publication: English Funding: commercial funding by GlaxoSmithKline Publication status: other; Scientific result summary and clinicaltrials.gov |
|
| Stated aim for study | Quote from publication: "The objective of the study was to demonstrate that rosiglitazone offers better protection of b‐cell function than gliclazide when these substances are given in association with metformin in type 2 diabetic patients not controlled by metformin alone" | |
| Notes | ‐ | |
| Risk of bias | ||
| Bias | Authors' judgement | Support for judgement |
| Random sequence generation (selection bias) | Unclear risk |
Quote from publication: "... randomised..." Comment: insufficient information about the sequence generation process to permit judgement of 'low risk or 'high risk' |
| Allocation concealment (selection bias) | Unclear risk |
Quote from publication: "... randomised..." Comment: insufficient information about the allocation concealment to permit judgement of 'low risk' or 'high risk' |
| Blinding of participants and personnel (performance bias) all‐cause/cardiovascular mortality | Low risk |
Quote from publication: "Open..." Comment: investigator‐assessed outcome measurement. Incomplete blinding of participant and investigator, but the outcome is not likely to be influenced by lack of blinding |
| Blinding of participants and personnel (performance bias) hypoglycaemia | Unclear risk |
Quote from publication: "Open..." Comment: investigator‐assessed/self‐reported outcome measurement. Incomplete blinding of participant and investigator. Not defined if outcome measurement is self‐reported or investigator‐assessed |
| Blinding of participants and personnel (performance bias) non‐serious adverse events | High risk |
Quote from publication: "Open..." Comment: self‐reported outcome measurement. Incomplete blinding, the outcome is likely to be influenced by lack of blinding |
| Blinding of participants and personnel (performance bias) serious adverse events | Low risk |
Quote from publication: "Open..." Comment: investigator‐assessed outcome measurement. Incomplete blinding of participant and investigator, but the outcome is not likely to be influenced by lack of blinding |
| Blinding of participants and personnel (performance bias) HbA1c | Low risk |
Quote from publication: "Open..." Comment: investigator‐assessed outcome measurement. Incomplete blinding of participant and investigator, but the outcome is not likely to be influenced by lack of blinding |
| Blinding of outcome assessment (detection bias) all‐cause/cardiovascular mortality | Low risk |
Quote from publication: "Open..." Comment: investigator‐assessed outcome measurement. Incomplete blinding of participant and investigator, but the outcome is not likely to be influenced by lack of blinding |
| Blinding of outcome assessment (detection bias) hypoglycaemia | Unclear risk |
Quote from publication: "Open..." Comment: investigator‐assessed/self‐reported outcome measurement. Incomplete blinding of participant and investigator. Not defined if outcome measurement is self‐reported or investigator‐assessed |
| Blinding of outcome assessment (detection bias) non‐serious adverse events | High risk |
Quote from publication: "Open..." Comment: self‐reported outcome measurement. Incomplete blinding, the outcome is likely to be influenced by lack of blinding |
| Blinding of outcome assessment (detection bias) serious adverse events | Low risk |
Quote from publication: "Open..." Comment: investigator‐assessed outcome measurement. Incomplete blinding of participant and investigator, but the outcome is not likely to be influenced by lack of blinding |
| Blinding of outcome assessment (detection bias) HbA1c | Low risk |
Quote from publication: "Open..." Comment: investigator‐assessed outcome measurement. Incomplete blinding of participant and investigator, but the outcome is not likely to be influenced by lack of blinding |
| Incomplete outcome data (attrition bias) all‐cause/cardiovascular mortality | Low risk |
Quote from publication: "Analyses for clinical safety and tolerability were conducted using the all randomized population, comprised of all subjects who received a randomization number and received at least one dose of study medication." Comment: 93%‐96% of the randomised participants were included in the analyses. There was a high dropout rate (68%‐71% of randomised participants completed the study), however, the dropout rate was balanced between groups. We assumed that trial authors searched registers for mortality status at the end of the trial |
| Incomplete outcome data (attrition bias) hypoglycaemia | High risk |
Quote from publication: "Analyses for clinical safety and tolerability were conducted using the all randomized population, comprised of all subjects who received a randomization number and received at least one dose of study medication." Comment: 93%‐96% of the randomised participants were included in the analyses. There was a high dropout rate (68%‐71% of randomised participants completed the study), however, the dropout rate was balanced between groups. The reasons for dropouts were balanced among the intervention groups. No information on imputation method. The proportion of missing outcomes compared with observed event risk was enough to induce clinically relevant bias in intervention effect estimate |
| Incomplete outcome data (attrition bias) non‐serious adverse events | Low risk |
Quote from publication: "Analyses for clinical safety and tolerability were conducted using the all randomized population, comprised of all subjects who received a randomization number and received at least one dose of study medication." Comment: 93%‐96% of the randomised participants were included in the analyses. There was a high dropout rate (68%‐71% of randomised participants completed the study), however, the dropout rate was balanced between groups. The reasons for dropouts were balanced among the intervention groups. No information on imputation method. The proportion of missing outcomes compared with observed event risk was not enough to induce clinically relevant bias in intervention effect estimate |
| Incomplete outcome data (attrition bias) serious adverse events | High risk |
Quote from publication: "Analyses for clinical safety and tolerability were conducted using the all randomized population, comprised of all subjects who received a randomization number and received at least one dose of study medication." Comment: 93%‐96% of the randomised participants were included in the analyses. There was a high dropout rate (68%‐71% of randomised participants completed the study), however, the dropout rate was balanced between groups. The reasons for dropouts were balanced among the intervention groups. No information on imputation method. The proportion of missing outcomes compared with observed event risk was enough to induce clinically relevant bias in intervention effect estimate |
| Incomplete outcome data (attrition bias) HbA1c | High risk |
Quote from publication: "All efficacy analyses were performed on the ITT population according to the randomized treatment group." Comment: 71% of the randomised participants were included in the analyses. There was a high dropout rate (68%‐71% of randomised participants completed the study), however, the dropout rate was balanced between groups. The reasons for dropouts were balanced among the intervention groups. No information on imputation method. Plausible effect size among missing outcomes is enough to induce clinically relevant bias in observed effect size |
| Selective reporting (reporting bias) | Low risk | Comment: all of the trial's prespecified primary and secondary outcomes (methods section) have been reported in the results section |
| Other bias | Unclear risk | Comment: sponsored by a pharmaceutical company |
Petrica 2009.
| Methods |
Study design: open‐label, randomised, controlled clinical trial Randomisation ratio: 1:1 to receive rosiglitazone or glimepiride in addition to metformin |
|
| Participants |
Inclusion criteria: T2DM (> 5 years), normoalbuminuria at the time of enrolment, absence of microangiopathic complications, HbA1c > 7% with previous medication (stable therapy with metformin for at least 6 months), requiring other antidiabetic agents, no chronic kidney disease of non‐diabetic origin Exclusion criteria: symptoms and/or history of cerebrovascular disease (transient ischaemic attack, stroke), micro/macroalbuminuria and thyroid dysfunction Diagnostic criteria: not reported |
|
| Interventions |
Number of study centres: not reported Run‐in period: no Extension period: no |
|
| Outcomes | Composite outcome measures reported: no | |
| Study details |
Trial terminated early: no Trial ID: ‐ |
|
| Publication details |
Language of publication: English Funding: non‐commercial funding: Victor Babes University of Medicine and Pharmacy, County Emergency Hospital Timisoara, Romania Publication status: peer‐reviewed journal |
|
| Stated aim for study | Quote from publication: "The aim of our study was to demonstrate the renal and cerebral protective effects of the thiazolidinedione rosiglitazone vs. glimepiride, a sulfonylurea compound, in normoalbuminuric type 2 DM patients with no history or symptoms of cerebrovascular disease." | |
| Notes | ‐ | |
| Risk of bias | ||
| Bias | Authors' judgement | Support for judgement |
| Random sequence generation (selection bias) | Unclear risk |
Quote from publication: "Patients were randomly assigned..." Comment: insufficient information about the sequence generation process to permit judgement of 'low risk or 'high risk' |
| Allocation concealment (selection bias) | Unclear risk |
Quote from publication: "Patients were randomly assigned..." Comment: insufficient information about the allocation concealment to permit judgement of 'low risk' or 'high risk' |
| Blinding of participants and personnel (performance bias) HbA1c | Low risk |
Quote from publication: "open label" "The laboratory staff who performed the assessments were blinded as to the treatments the patients were receiving" Comment: investigator‐assessed outcome measurement. Incomplete blinding, the outcome is unlikely to be influenced by lack of blinding |
| Blinding of outcome assessment (detection bias) HbA1c | Low risk |
Quote from publication: "open label" "The laboratory staff who performed the assessments were blinded as to the treatments the patients were receiving" Comment: investigator‐assessed outcome measurement. Incomplete blinding, the outcome is unlikely to be influenced by lack of blinding |
| Incomplete outcome data (attrition bias) HbA1c | Low risk | Comment: 77% of the randomised participants were included in the analyses. There was a high dropout rate (77% of the participants completed the study), however, the dropout rate was balanced between groups. The reasons for dropouts were not balanced (3 participants in the rosiglitazone group discontinued due to weight gain compared to 0 participants in the glimepiride group). Plausible effect size among missing outcomes was not enough to have a clinically relevant impact on observed effect size |
| Selective reporting (reporting bias) | High risk | Comment: no protocol available. All of the trial's prespecified primary and secondary outcomes (methods section) have been reported. Unclear whether common outcomes (all‐cause mortality, hypoglycaemia) were measured; not mentioned, but clinical judgement says likely to have been measured and analysed but not reported on the basis of non‐significant results. Clear that outcomes (non‐serious adverse events, serious adverse events) were measured but not necessarily analysed; judgement says likely to have been analysed but not reported because of non‐significant results |
Petrica 2011.
| Methods |
Study design: open‐label, RCT Randomisation ratio: 1:1 to receive pioglitazone or glimepiride in addition to metformin |
|
| Participants |
Inclusion criteria: T2DM (> 5 years), normoalbuminuria at the time of enrolment, absence of microangiopathic complications, no chronic kidney disease of non‐diabetic origin, HbA1c > 7% with previous medication (stable therapy with metformin for at least 6 months), a fact which required association of other antidiabetic agents Exclusion criteria: symptoms and/or history of cerebrovascular disease (transient ischaemic attack, stroke), and micro/macroalbuminuria Diagnostic criteria: not reported |
|
| Interventions |
Number of study centres: not reported Run‐in period: no Extension period: no |
|
| Outcomes | Composite outcome measures reported: no | |
| Study details |
Trial terminated early: no Trial ID: ‐ |
|
| Publication details |
Language of publication: English Funding: non‐commercial funding: Victor Babes University of Medicine and Pharmacy, County Emergency Hospital, Timisoara, Romania Publication status: peer‐reviewed journal |
|
| Stated aim for study | Quote from publication: "The aim of our work was to validate our previous observations in a longitudinal study and to demonstrate that PT dysfunction occurs before the stage of albuminuria. Moreover, we attempted to document the different patterns of endothelial behaviour in two distinct vascular segments, the kidney and the brain. In addition, we assessed the renal and cerebral protective effects of pioglitazone versus glimepiride, a sulphonylurea compound, in normoalbuminuric patients with type 2 DM." | |
| Notes | ‐ | |
| Risk of bias | ||
| Bias | Authors' judgement | Support for judgement |
| Random sequence generation (selection bias) | Unclear risk |
Quote from publication: "Patients were randomly assigned..." Comment: insufficient information about the sequence generation process to permit judgement of 'low risk or 'high risk' |
| Allocation concealment (selection bias) | Unclear risk |
Quote from publication: "Patients were randomly assigned..." Comment: insufficient information about the allocation concealment to permit judgement of 'low risk' or 'high risk' |
| Blinding of participants and personnel (performance bias) HbA1c | Low risk |
Quote from publication: "open label" "The laboratory staff who performed the assessments were blinded to the medical treatment of the patients enrolled in the study" Comment: investigator‐assessed outcome measurement. Incomplete blinding, the outcome is unlikely to be influenced by lack of blinding |
| Blinding of outcome assessment (detection bias) HbA1c | Low risk |
Quote from publication: "open label" "The laboratory staff who performed the assessments were blinded to the medical treatment of the patients enrolled in the study" Comment: investigator‐assessed outcome measurement. Incomplete blinding, the outcome is unlikely to be influenced by lack of blinding |
| Incomplete outcome data (attrition bias) HbA1c | Low risk | Comment: 87% of the randomised participants were included in the analyses. There was a low dropout rate (87% of the participants completed the study). The dropout rate and the reason for dropout were balanced between groups. Plausible effect size among missing outcomes was not enough to have a clinically relevant impact on observed effect size |
| Selective reporting (reporting bias) | High risk | Comment: no protocol available. All of the trial's prespecified primary and secondary outcomes (methods section) have been reported. Unclear whether common outcomes (all‐cause mortality, hypoglycaemia) were measured; not mentioned, but clinical judgement says likely to have been measured and analysed but not reported on the basis of non‐significant results. Clear that outcomes (non‐serious adverse events, serious adverse events) were measured but not necessarily analysed; judgement says likely to have been analysed but not reported because of non‐significant results |
Ridderstråle 2014.
| Methods |
Study design: randomised, double‐blind, double‐dummy, active‐controlled, parallel‐group study Randomisation ratio: 1:1 to receive empagliflozin or glimepiride in addition to metformin Non‐inferiority and superiority design: the non‐inferiority of empagliflozin to glimepiride for the primary endpoint of change from baseline in HbA1c concentration was tested at weeks 52 and 104. Key secondary endpoints were tested for superiority at weeks 52 and 104. At week 104, if non‐inferiority for HbA1c was established, tests for the superiority of empagliflozin versus glimepiride were to be done in a hierarchical order: first, change in bodyweight; second, occurrence of confirmed hypoglycaemic adverse events; third, superiority of empagliflozin versus glimepiride in change in HbA1c concentration; fourth, change in systolic BP; fifth, change in diastolic BP. The non‐inferiority of empagliflozin to glimepiride for the primary endpoint was based on a one‐sided significance level of 1.25% (adjusted for repeated testing at weeks 52 and 104). Superiority tests were based on a significance level of 2.5% (two‐sided) |
|
| Participants |
Inclusion criteria: age ≥ 18 years, T2DM with insufficient glycaemic control with diet, exercise and metformin immediate release (≥ 1500 mg/day or MTD, or maximum dose according to local label, with dose unchanged for 12 weeks prior to randomisation), HbA1c ≥ 7% and ≤ 10% at screening BMI ≤ 45 kg/m² at screening. Female participants: post‐menopausal, or pre‐menopausal and using appropriate contraception; not pregnant/breastfeeding Exclusion criteria: blood glucose level > 13.3 mmol/L after an overnight fast during placebo run‐in, use of any glucose‐lowering drugs other than metformin immediate release ≤ 12 weeks prior to randomisation, bariatric surgery within 2 years; treatment with anti‐obesity drugs within 3 months of screening; any treatment leading to unstable body weight, estimated GFR < 60 mL/min/1.73 m² (modified diet renal disease) during screening or placebo run‐in, indication of liver disease (ALT, AST or alkaline phosphatase > 3 x ULN) during screening or placebo run‐in, history of cancer within 5 years (except basal cell carcinoma), acute coronary syndrome, stroke or transient ischaemic attack within 3 months of informed consent, disorders causing unstable red blood cells; treatment with systemic steroids; change in dose of thyroid hormones within 6 weeks of screening; any uncontrolled endocrine condition (except T2DM), alcohol or drug abuse within 3 months of informed consent, taking an investigational drug ≤ 30 days prior to receiving study drug Diagnostic criteria: not reported |
|
| Interventions |
Number of study centres: 173 Run‐in period: yes, 2‐week open‐label placebo run‐in Extension period: yes, participants who completed the 104‐week randomised treatment were eligible to participate in the 104‐week extension, during which they would continue to receive the treatment allocated at randomisation in a double‐blind manner. However, some sites did not participate in the 2‐year extension, and so considered participants to have completed treatment after 2 years. |
|
| Outcomes | Composite outcome measures reported: yes, HbA1c < 7.0% or HbA1c reduction ≥ 1.0%, no confirmed hypoglycaemia, and weight loss > 2% after 52, 104 and 208 weeks of treatment and HbA1c < 6.5% or HbA1c reduction ≥ 1.0%, no confirmed hypoglycaemia, and weight loss > 2% after 52, 104 and 208 weeks of treatment | |
| Study details |
Trial terminated early: no Trial ID:NCT01167881 |
|
| Publication details |
Language of publication: English Funding: commercial funding by Boehringer Ingelheim and Eli Lilly Publication status: peer‐reviewed journal |
|
| Stated aim for study | Quote from publication: "The objective in this trial (EMPA‐REG H2H‐SU) was to compare the efficacy and safety of empagliflozin and the sulfonylurea glimepiride as a second‐line therapy in patients with type 2 diabetes with inadequate glycaemic control on metformin." | |
| Notes | ‐ | |
| Risk of bias | ||
| Bias | Authors' judgement | Support for judgement |
| Random sequence generation (selection bias) | Low risk |
Quote from publication: "The study sponsor did the randomisation, stratified by HbA1c concentration at screening, eGFR, and region, using an interactive response system with a computer‐generated random sequence" Comment: adequate generation of random sequence ensured |
| Allocation concealment (selection bias) | Low risk |
Quote from publication: "The study sponsor did the randomisation, stratified by HbA1c concentration at screening, eGFR, and region, using an interactive response system with a computer‐generated random sequence" Comment: adequate concealment ensured |
| Blinding of participants and personnel (performance bias) all‐cause/cardiovascular mortality | Low risk |
Quote from publication: "double‐blind, double‐dummy" "patients and investigators were masked to treatment assignment" "An independent data monitoring committee monitored safety of the patients throughout the trial." Comment: adjudicated outcome measurement. Blinding ensured |
| Blinding of participants and personnel (performance bias) hypoglycaemia | Low risk |
Quote from publication: "double‐blind, double‐dummy" "patients and investigators were masked to treatment assignment" "An independent data monitoring committee monitored safety of the patients throughout the trial." Comment: adjudicated outcome measurement. Blinding ensured |
| Blinding of participants and personnel (performance bias) non‐fatal myocardial infarction/heart failure/non‐fatal stroke | Low risk |
Quote from publication: "double‐blind, double‐dummy" "patients and investigators were masked to treatment assignment" "An independent data monitoring committee monitored safety of the patients throughout the trial." Comment: adjudicated outcome measurement. Blinding ensured |
| Blinding of participants and personnel (performance bias) non‐serious adverse events | Low risk |
Quote from publication: "double‐blind, double‐dummy" "patients and investigators were masked to treatment assignment" "An independent data monitoring committee monitored safety of the patients throughout the trial." Comment: adjudicated outcome measurement. Blinding ensured |
| Blinding of participants and personnel (performance bias) serious adverse events | Low risk |
Quote from publication: "double‐blind, double‐dummy" "patients and investigators were masked to treatment assignment" "An independent data monitoring committee monitored safety of the patients throughout the trial." Comment: adjudicated outcome measurement. Blinding ensured |
| Blinding of participants and personnel (performance bias) weight (kg) | Low risk |
Quote from publication: "double‐blind, double‐dummy" "patients and investigators were masked to treatment assignment" Comment: investigator‐assessed/self‐reported outcome measurement. Blinding ensured |
| Blinding of participants and personnel (performance bias) HbA1c | Low risk |
Quote from publication: "double‐blind, double‐dummy" "patients and investigators were masked to treatment assignment" Comment: investigator‐assessed outcome measurement. Blinding ensured |
| Blinding of outcome assessment (detection bias) all‐cause/cardiovascular mortality | Low risk |
Quote from publication: "double‐blind, double‐dummy" "patients and investigators were masked to treatment assignment" "An independent data monitoring committee monitored safety of the patients throughout the trial." Comment: adjudicated outcome measurement. Blinding ensured |
| Blinding of outcome assessment (detection bias) hypoglycaemia | Low risk |
Quote from publication: "double‐blind, double‐dummy" "patients and investigators were masked to treatment assignment" "An independent data monitoring committee monitored safety of the patients throughout the trial." Comment: adjudicated outcome measurement. Blinding ensured |
| Blinding of outcome assessment (detection bias) non‐fatal myocardial infarction/heart failure/non‐fatal stroke | Low risk |
Quote from publication: "double‐blind, double‐dummy" "patients and investigators were masked to treatment assignment" "An independent data monitoring committee monitored safety of the patients throughout the trial." Comment: adjudicated outcome measurement. Blinding ensured |
| Blinding of outcome assessment (detection bias) non‐serious adverse events | Low risk |
Quote from publication: "double‐blind, double‐dummy" "patients and investigators were masked to treatment assignment" "An independent data monitoring committee monitored safety of the patients throughout the trial." Comment: adjudicated outcome measurement. Blinding ensured. |
| Blinding of outcome assessment (detection bias) serious adverse events | Low risk |
Quote from publication: "double‐blind, double‐dummy" "patients and investigators were masked to treatment assignment" "An independent data monitoring committee monitored safety of the patients throughout the trial." Comment: adjudicated outcome measurement. Blinding ensured |
| Blinding of outcome assessment (detection bias) weight (kg) | Low risk |
Quote from publication: "double‐blind, double‐dummy" "patients and investigators were masked to treatment assignment" Comment: investigator‐assessed/self‐reported outcome measurement. Blinding ensured |
| Blinding of outcome assessment (detection bias) HbA1c | Low risk |
Quote from publication: "double‐blind, double‐dummy" "patients and investigators were masked to treatment assignment" Comment: investigator‐assessed outcome measurement. Blinding ensured |
| Incomplete outcome data (attrition bias) all‐cause/cardiovascular mortality | Low risk |
Quote from publication: "Safety was analysed in the treated set (patients given at least one dose of study drug)" Comment: > 99% of randomised participants were included in the analyses. There was a high dropout rate (83%‐85% of randomised participants completed 2 years of treatment), however, the dropout rate was balanced between groups. We assumed that trial authors searched registers for mortality status at the end of the trial |
| Incomplete outcome data (attrition bias) hypoglycaemia | Low risk |
Quote from publication: "Safety was analysed in the treated set (patients given at least one dose of study drug)" Comment: > 99% of the participants were included in the analyses. There was a high dropout rate (76%‐79% of the participants completed 4 years of treatment), however, the dropout rate was balanced between groups. We do not know how the trial authors imputed missing data from the participants not completing the study. The reasons for dropouts were balanced. The proportion of missing outcomes compared with observed event risk was not enough to induce clinically relevant bias in intervention effect estimate |
| Incomplete outcome data (attrition bias) non‐fatal myocardial infarction/heart failure/non‐fatal stroke | High risk |
Quote from publication: "Safety was analysed in the treated set (patients given at least one dose of study drug)" Comment: > 99% of the participants were included in the analyses. There was a high dropout rate (76%‐79% of the participants completed 4 years of treatment), however, the dropout rate was balanced between groups. We do not know how the trial authors imputed missing data from the participants not completing the study. The reasons for dropouts were balanced. The proportion of missing outcomes compared with observed event risk was enough to induce clinically relevant bias in intervention effect estimate |
| Incomplete outcome data (attrition bias) non‐serious adverse events | Low risk |
Quote from publication: "Safety was analysed in the treated set (patients given at least one dose of study drug)" Comment: > 99% of the participants were included in the analyses. There was a high dropout rate (76%‐79% of the participants completed 4 years of treatment), however, the dropout rate was balanced between groups. We do not know how the trial authors imputed missing data from the participants not completing the study. The reasons for dropouts were balanced. The proportion of missing outcomes compared with observed event risk was not enough to induce clinically relevant bias in intervention effect estimate |
| Incomplete outcome data (attrition bias) serious adverse events | High risk |
Quote from publication: "Safety was analysed in the treated set (patients given at least one dose of study drug)" Comment: > 99% of the participants were included in the analyses. There was a high dropout rate (76%‐79% of the participants completed 4 years of treatment), however, the dropout rate was balanced between groups. We do not know how the trial authors imputed missing data from the participants not completing the study. The reasons for dropouts were balanced. The proportion of missing outcomes compared with observed event risk was enough to induce clinically relevant bias in intervention effect estimate |
| Incomplete outcome data (attrition bias) weight (kg) | Unclear risk |
Quote from publication: "The efficacy analyses will be performed on the full analysis set (FAS), i.e. all randomized patients who received ≥1 dose of study drug and had a baseline HbA1c assessment, using the last observation carried forward (LOCF) methodology for imputation of missing data." "Secondary endpoints will be analyzed using the same model as the primary endpoint..." Comment: > 99% of the participants were included in the analyses. There was a high dropout rate (83%‐85% of the participants completed 2 years of treatment), however, the dropout rate was balanced between groups. The reasons for dropouts were balanced. Inappropriate method for imputing missing data (LOCF) |
| Incomplete outcome data (attrition bias) HbA1c | Unclear risk |
Quote from publication: "The efficacy analyses will be performed on the full analysis set (FAS), i.e. all randomized patients who received ≥ 1 dose of study drug and had a baseline HbA1c assessment, using the last observation carried forward (LOCF) methodology for imputation of missing data." Comment: > 99% of the participants were included in the analyses. There was a high dropout rate (83%‐85% of the participants completed 2 years of treatment), however, the dropout rate was balanced between groups. The reasons for dropouts were balanced. Inappropriate method for imputing missing data (LOCF) |
| Selective reporting (reporting bias) | Low risk | Comment: all of the trial's primary and secondary outcomes as specified in the protocol have been reported |
| Other bias | Unclear risk | Comment: the trial was funded by pharmaceutical companies |
Ristic 2007.
| Methods |
Study design: double‐blind, double‐dummy, parallel‐group, randomised study Randomisation ratio: 1:1 to receive nateglinide or gliclazide in addition to metformin |
|
| Participants |
Inclusion criteria: ≥ 18 years of age, T2DM for ≥ 6 months, received metformin monotherapy for ≥ 3 months on metformin dose of 1000 mg/day continuously for ≥ 2 months prior to study entry, but remain inadequately controlled by medication, diet and physical exercise, baseline HbA1c 6.8%‐9.0%, BMI between 20 and 35 kg/m² Exclusion criteria: T1DM, diabetes that is a result of pancreatic injury or secondary forms of diabetes, history of acute metabolic diabetic complications, significant diabetic complications, chronic insulin treatment, pregnant or lactating women, any oral anti‐diabetic treatment, other than metformin within 3 months prior to week 0, treatment with any drug with a known frequent toxicity to a major organ system within the past 3 months, any of the following significant medical history: MI, coronary surgery, ventricular tachycardia or ventricular fibrillation within the past 6 months. Liver disease such as cirrhosis or chronic active hepatitis or persistent ALT, AST or alkaline phosphatase increases > 3 x ULN, FPG ≥ 11.1 mmol/L, fasting triglycerides > 750 mg/dL at week ‐2, total bilirubin > 2 x ULN at week ‐2 Diagnostic criteria: not reported |
|
| Interventions |
Number of study centres: 26 Run‐in period: no Extension period: yes, 6 months double‐blind extension after 24 weeks treatment |
|
| Outcomes | Composite outcome measures reported: no | |
| Study details |
Trial terminated early: no Trial ID:CDJN608A 2308E1 |
|
| Publication details |
Language of publication: English Funding: commercial funding by Novartis Pharma Publication status: peer‐reviewed journal |
|
| Stated aim for study | Quote from publication: "... to evaluate the effect of nateglinide compared with that of gliclazide in combination with metformin on HbA1c, fasting plasma glucose (FPG), body weight and postprandial insulin and glucose, after 12 months of treatment." | |
| Notes | ‐ | |
| Risk of bias | ||
| Bias | Authors' judgement | Support for judgement |
| Random sequence generation (selection bias) | Low risk |
Quote from publication: "Randomization to treatment was by a computer‐generated schedule via an interactive voice‐responding system that assigned randomization on a study‐centre basis with a block size of 4." Comment: adequate generation of random sequence ensured |
| Allocation concealment (selection bias) | Low risk |
Quote from publication: "Randomization to treatment was by a computer‐generated schedule via an interactive voice‐responding system that assigned randomization on a study‐centre basis with a block size of 4." Comment: adequate concealment ensured |
| Blinding of participants and personnel (performance bias) all‐cause/cardiovascular mortality | Low risk |
Quote from publication: "double‐blind" "A double‐dummy technique, using identical‐looking nateglinide and placebo tablets and identical‐looking gliclazide and placebo capsules, was used to blind study medication assignment." Comment: investigator‐assessed outcome measurement. Blinding of study personnel ensured |
| Blinding of participants and personnel (performance bias) weight (kg) | Low risk |
Quote from publication: "double‐blind" "A double‐dummy technique, using identical‐looking nateglinide and placebo tablets and identical‐looking gliclazide and placebo capsules, was used to blind study medication assignment." Comment: self‐reported or investigator‐assessed outcome measurement. Blinding ensured |
| Blinding of participants and personnel (performance bias) HbA1c | Low risk |
Quote from publication: "double‐blind" "A double‐dummy technique, using identical‐looking nateglinide and placebo tablets and identical‐looking gliclazide and placebo capsules, was used to blind study medication assignment." Comment: investigator‐assessed outcome measurement. Blinding ensured |
| Blinding of outcome assessment (detection bias) all‐cause/cardiovascular mortality | Low risk |
Quote from publication: "double‐blind" "A double‐dummy technique, using identical‐looking nateglinide and placebo tablets and identical‐looking gliclazide and placebo capsules, was used to blind study medication assignment." Comment: investigator‐assessed outcome measurement. Blinding of study personnel ensured |
| Blinding of outcome assessment (detection bias) weight (kg) | Low risk |
Quote from publication: "double‐blind" "A double‐dummy technique, using identical‐looking nateglinide and placebo tablets and identical‐looking gliclazide and placebo capsules, was used to blind study medication assignment." Comment: self‐reported or investigator‐assessed outcome measurement. Blinding ensured |
| Blinding of outcome assessment (detection bias) HbA1c | Low risk |
Quote from publication: "double‐blind" "A double‐dummy technique, using identical‐looking nateglinide and placebo tablets and identical‐looking gliclazide and placebo capsules, was used to blind study medication assignment." Comment: investigator‐assessed outcome measurement. Blinding ensured |
| Incomplete outcome data (attrition bias) all‐cause/cardiovascular mortality | Low risk |
Quote from publication: "safety was assessed for all randomized patients with a post‐baseline safety assessment." Comment: 78%‐84% of randomised participants were included in the analyses. We assumed that trial authors searched registers for mortality status at the end of the trial |
| Incomplete outcome data (attrition bias) weight (kg) | Unclear risk |
Quote from publication: "Eficacy analyses used the intention‐to‐treat population which included all randomized patients with at least one post‐baseline efficacy evaluation..." Comment: 78%‐84% of randomised participants were included in the analyses. There was a high dropout rate (76%‐81% of the randomised participants completed the study), however, the dropout rate was balanced between groups. No information on imputation method |
| Incomplete outcome data (attrition bias) HbA1c | Unclear risk |
Quote from publication: "The primary efficacy evaluation was based on HbA1c changes from baseline to endpoint at week 52 or the final visit, using the last observation carried forward (LOCF) approach. Baseline was calculated as the average of the measurements obtained from the evaluations for HbA1c on weeks 2 and 0. If one of these measurements was missing, the remaining measurement was used as the baseline; if both were missing, then the patient was excluded from the analysis. The primary population in this assessment was the extension ITT population." Comment: 78%‐84% of randomised participants were included in the analyses. There was a high dropout rate (76%‐81% of the randomised participants completed the trial), however, the dropout rate was balanced between groups. The reasons for dropouts were balanced. Inappropriate method for imputing missing data (LOCF) |
| Selective reporting (reporting bias) | Low risk | Comment: all of the trial's primary and secondary outcomes as specified in the protocol have been reported |
| Other bias | Unclear risk | Comment: the study was sponsored by a pharmaceutical company |
Schernthaner 2015.
| Methods |
Study design: multinational, randomised, double‐blind, active‐controlled, parallel‐arm, phase IIIb/IV study Randomisation ratio: 1:1 to receive glimepiride or saxagliptin in addition to metformin |
|
| Participants |
Inclusion criteria: T2DM aged ≥ 65 years, who were on stable metformin monotherapy at any dose for ≥ 8 weeks before enrolment and had an HbA1c concentration of 7.0%–9.0% Exclusion criteria: T1DM; treatment with any antihyperglycaemic therapy other than metformin monotherapy < 8 weeks before enrolment; treatment with systemic glucocorticoids (except for replacement therapy) or cytochrome P450 3A4‐inducers; history of ketoacidosis or hyperosmolar non‐ketonic coma; history of haemoglobinopathies; renal impairment (creatinine clearance < 60 mL/min); cognitive function problems; alcohol or illegal drug abuse for ≤ 12 months before enrolment; and history of hypersensitivity or contraindication to the study drugs; AST levels > 3 x ULN and/or ALT levels > 3 x ULN and/or total bilirubin > 34 μmol/L; and creatine kinase > 10 x ULN. All participants abstained from donating blood, plasma or platelets during the study Diagnostic criteria: not reported |
|
| Interventions |
Number of study centres: 152 Run‐in period: yes, 2‐week single‐blind (to participants only) placebo lead‐in period Extension period: no |
|
| Outcomes | Composite outcome measures reported: no | |
| Study details |
Trial terminated early: no Trial ID:NCT01006603 |
|
| Publication details |
Language of publication: English Funding: commercial funding by AstraZeneca and Bristol‐Myers Squibb Publication status: peer‐reviewed journal |
|
| Stated aim for study | Quote from publication: "To assess the efficacy and safety of adjunctive saxagliptin vs glimepiride in elderly patients with type 2 diabetes (T2D) and inadequate glycaemic control." | |
| Notes | ‐ | |
| Risk of bias | ||
| Bias | Authors' judgement | Support for judgement |
| Random sequence generation (selection bias) | Low risk |
Quote from publication: "Randomization was carried out via an interactive web response system..." Comment: adequate generation of random sequence ensured |
| Allocation concealment (selection bias) | Low risk |
Quote from publication: "Randomization was carried out via an interactive web response system..." Comment: adequate concealment ensured |
| Blinding of participants and personnel (performance bias) all‐cause/cardiovascular mortality | Low risk |
Quote from publication: "double‐blind" Comment: investigator‐assessed outcome measurement. Blinding ensured |
| Blinding of participants and personnel (performance bias) hypoglycaemia | Low risk |
Quote from publication: "double‐blind" Comment: investigator‐assessed or self‐reported outcome measurement. Blinding ensured |
| Blinding of participants and personnel (performance bias) non‐fatal myocardial infarction/heart failure/non‐fatal stroke | Low risk |
Quote from publication: "double‐blind" Comment: investigator‐assessed outcome measurement. Blinding ensured |
| Blinding of participants and personnel (performance bias) non‐serious adverse events | Low risk |
Quote from publication: "double‐blind" Comment: self‐reported outcome measurement. Blinding ensured |
| Blinding of participants and personnel (performance bias) serious adverse events | Low risk |
Quote from publication: "double‐blind" Comment: investigator‐assessed outcome measurement. Blinding ensured |
| Blinding of participants and personnel (performance bias) weight (kg) | Low risk |
Quote from publication: "double‐blind" Comment: investigator‐assessed or self‐reported outcome measurement. Blinding ensured |
| Blinding of participants and personnel (performance bias) HbA1c | Low risk |
Quote from publication: "double‐blind" Comment: investigator‐assessed outcome measurement. Blinding ensured |
| Blinding of outcome assessment (detection bias) all‐cause/cardiovascular mortality | Low risk |
Quote from publication: "double‐blind" Comment: investigator‐assessed outcome measurement. Blinding ensured |
| Blinding of outcome assessment (detection bias) hypoglycaemia | Low risk |
Quote from publication: "double‐blind" Comment: investigator‐assessed or self‐reported outcome measurement. Blinding ensured |
| Blinding of outcome assessment (detection bias) non‐fatal myocardial infarction/heart failure/non‐fatal stroke | Low risk |
Quote from publication: "double‐blind" Comment: investigator‐assessed outcome measurement. Blinding ensured |
| Blinding of outcome assessment (detection bias) non‐serious adverse events | Low risk |
Quote from publication: "double‐blind" Comment: self‐reported outcome measurement. Blinding ensured |
| Blinding of outcome assessment (detection bias) serious adverse events | Low risk |
Quote from publication: "double‐blind" Comment: investigator‐assessed outcome measurement. Blinding ensured |
| Blinding of outcome assessment (detection bias) weight (kg) | Low risk |
Quote from publication: "double‐blind" Comment: investigator‐assessed or self‐reported outcome measurement. Blinding ensured |
| Blinding of outcome assessment (detection bias) HbA1c | Low risk |
Quote from publication: "double‐blind" Comment: investigator‐assessed outcome measurement. Blinding ensured |
| Incomplete outcome data (attrition bias) all‐cause/cardiovascular mortality | Low risk |
Quote from publication: "The safety population, which included all randomized patients who took ≥1 dose of the study medication, was used for reporting safety and tolerability results and for primary, key secondary and post hoc efficacy assessments." Comment: > 99% of randomised participants were included in the analyses. There was a high dropout rate (79%‐80% of randomised participants completed the study), however, the dropout rate was balanced between groups. We assumed that trial authors searched registers for mortality status at the end of the trial |
| Incomplete outcome data (attrition bias) hypoglycaemia | High risk |
Quote from publication: "The safety population, which included all randomized patients who took ≥1 dose of the study medication, was used for reporting safety and tolerability results and for primary, key secondary and post hoc efficacy assessments." Comment: > 99% of the participants were included in the analyses. There was a high dropout rate (79%‐80% of the randomised participants completed the study), however, the dropout rate was balanced between groups. We do not know how the trial authors imputed missing data from the participants not completing the study. The reasons for dropouts were balanced. The proportion of missing outcomes compared with observed event risk was enough to induce clinically relevant bias in intervention effect estimate |
| Incomplete outcome data (attrition bias) non‐fatal myocardial infarction/heart failure/non‐fatal stroke | High risk |
Quote from publication: "The safety population, which included all randomized patients who took ≥1 dose of the study medication, was used for reporting safety and tolerability results and for primary, key secondary and post hoc efficacy assessments." Comment: > 99% of the participants were included in the analyses. There was a high dropout rate (79%‐80% of the randomised participants completed the study), however, the dropout rate was balanced between groups. We do not know how the trial authors imputed missing data from the participants not completing the study. The reasons for dropouts were balanced. The proportion of missing outcomes compared with observed event risk was enough to induce clinically relevant bias in intervention effect estimate |
| Incomplete outcome data (attrition bias) non‐serious adverse events | Low risk |
Quote from publication: "The safety population, which included all randomized patients who took ≥1 dose of the study medication, was used for reporting safety and tolerability results and for primary, key secondary and post hoc efficacy assessments." Comment: > 99% of the participants were included in the analyses. There was a high dropout rate (79%‐80% of the randomised participants completed the study), however, the dropout rate was balanced between groups. We do not know how the trial authors imputed missing data from the participants not completing the study. The reasons for dropouts were balanced. The proportion of missing outcomes compared with observed event risk was not enough to induce clinically relevant bias in intervention effect estimate |
| Incomplete outcome data (attrition bias) serious adverse events | High risk |
Quote from publication: "The safety population, which included all randomized patients who took ≥1 dose of the study medication, was used for reporting safety and tolerability results and for primary, key secondary and post hoc efficacy assessments." Comment: > 99% of the participants were included in the analyses. There was a high dropout rate (79%‐80% of the randomised participants completed the study), however, the dropout rate was balanced between groups. We do not know how the trial authors imputed missing data from the participants not completing the study. The reasons for dropouts were balanced. The proportion of missing outcomes compared with observed event risk was enough to induce clinically relevant bias in intervention effect estimate |
| Incomplete outcome data (attrition bias) weight (kg) | Unclear risk |
Quote from publication: "Safety and tolerability assessments included adverse events (AEs) and body weight." "The safety population, which included all randomized patients who took ≥1 dose of the study medication, was used for reporting safety and tolerability results and for primary, key secondary and post hoc efficacy assessments." Comment: > 99% of the randomised participants were included in the analyses. There was a high dropout rate (79%‐80% of the randomised participants completed the study), however, the dropout rate was balanced between groups. We do not know how the trial authors imputed missing data from the participants not completing the study. The reasons for dropouts were balanced |
| Incomplete outcome data (attrition bias) HbA1c | Unclear risk |
Quote from publication: "The number of subjects with non‐missing baseline and week 52 (LOCF) values in the full analysis set (defined as the subset of patients in the randomized analysis set who took at least one randomised IP dose and have non‐missing baseline and post‐baseline efficacy data for at least one variable). " Comment: > 95% of the participants were included in the analyses. There was a high dropout rate (79%‐80% of the randomised participants completed the study), however, the dropout rate was balanced between groups. The reasons for dropouts were balanced. Inapropriate method for imputing missing data (LOCF) |
| Selective reporting (reporting bias) | Low risk | Comment: all of the trial's primary and secondary outcomes as specified in the protocol have been reported |
| Other bias | Unclear risk | Comment: the trial was funded by pharmaceutical companies |
Seck 2010.
| Methods |
Study design: multinational, randomised, parallel‐group, non‐inferiority study with an active‐controlled, double‐blind treatment period Randomisation ratio: 1:1 to receive sitagliptin or glipizide in addition to metformin monotherapy Non‐inferiority design |
|
| Participants |
Inclusion criteria: age 18–78 years, T2DM, not currently on an OHA, were taking any OHA in monotherapy or were taking metformin in combination with another OHA Exclusion criteria: history of T1DM, insulin use within 8 weeks of screening, renal function impairment inconsistent with the use of metformin or a FPG (or a fasting fingerstick glucose) at or just prior to randomisation > 15.0 mmol/L (270 mg/dL) Diagnostic criteria: not reported |
|
| Interventions |
Number of study centres: 173 Run‐in period: yes. Participants who were already on metformin ≥ 1500 mg/day and had an HbA1c ≥ 6.5% and ≤ 10% directly entered a 2‐week placebo run‐in period and were eligible to be randomised. Participants not currently on an OHA, participants on an OHA other than metformin monotherapy at a dose ≥ 1500 mg/day or participants on metformin in combination with another OHA entered a metformin monotherapy treatment titration and dose‐stable period of at least 8 weeks. Participants with an HbA1c ≥ 6.5% and ≤ 10% after the metformin dose‐stable period entered a 2‐week single‐blind placebo run‐in period Extension period: yes, the study continued as a randomised, double‐blind, active‐controlled study for an additional year |
|
| Outcomes | Composite outcome measures reported: yes, composite endpoint for HbA1c reduction, lack of hypoglycaemia and no body weight gain | |
| Study details |
Trial terminated early: no Trial ID:NCT00094770 |
|
| Publication details |
Language of publication: English Funding: commercial funding by Merck & Co, Whitehouse Station, NJ Publication status: peer‐reviewed journal |
|
| Stated aim for study | Quote from publication: "To evaluate the 2‐year safety and efficacy of adding sitagliptin or glipizide to ongoing metformin in patients with type 2 diabetes" | |
| Notes | ‐ | |
| Risk of bias | ||
| Bias | Authors' judgement | Support for judgement |
| Random sequence generation (selection bias) | Low risk |
Quote from publication: "... randomised into the study, using a computer‐generated allocation schedule" Comment: adequate generation of random sequence ensured |
| Allocation concealment (selection bias) | Low risk |
Quote from publication: "... randomised into the study, using a computer‐generated allocation schedule" Comment: adequate concealment ensured |
| Blinding of participants and personnel (performance bias) all‐cause/cardiovascular mortality | Low risk |
Quote from publication: "double‐blind" "All adverse experiences were rated by the study site investigators for intensity and relationship to study drug" Comment: investigator‐assessed outcome measurement. Blinding of study personnel ensured |
| Blinding of participants and personnel (performance bias) hypoglycaemia | Low risk |
Quote from publication: "double‐blind" "Patients experiencing symptoms of hypoglycaemia were instructed to obtain a fingerstick glucose, record the value in a log book and contact their study site" All adverse experiences were rated by the study site investigators for intensity and relationship to study drug" Comment: investigator‐assessed/self‐reported outcome measurement. Blinding of participants and study personnel ensured |
| Blinding of participants and personnel (performance bias) non‐fatal myocardial infarction/heart failure/non‐fatal stroke | Low risk |
Quote from publication: "double‐blind" "All adverse experiences were rated by the study site investigators for intensity and relationship to study drug" Comment: investigator‐assessed outcome measurement. Blinding of study personnel ensured |
| Blinding of participants and personnel (performance bias) non‐serious adverse events | Low risk |
Quote from publication: "double‐blind" "All adverse experiences were rated by the study site investigators for intensity and relationship to study drug" Comment: investigator‐assessed/self‐reported outcome measurement. Blinding of participants and study personnel ensured |
| Blinding of participants and personnel (performance bias) serious adverse events | Low risk |
Quote from publication: "double‐blind" "All adverse experiences were rated by the study site investigators for intensity and relationship to study drug" Comment: investigator‐assessed outcome measurement. Blinding of study personnel ensured |
| Blinding of participants and personnel (performance bias) weight (kg) | Low risk |
Quote from publication: "double‐blind" Comment: investigator‐assessed/self‐reported outcome measurement. Blinding of participants and study personnel ensured |
| Blinding of participants and personnel (performance bias) HbA1c | Low risk |
Quote from publication: "double‐blind" Comment: investigator‐assessed outcome measurement. Blinding of study personnel ensured |
| Blinding of outcome assessment (detection bias) all‐cause/cardiovascular mortality | Low risk |
Quote from publication: "double‐blind" "All adverse experiences were rated by the study site investigators for intensity and relationship to study drug" Comment: investigator‐assessed outcome measurement. Blinding of study personnel ensured |
| Blinding of outcome assessment (detection bias) hypoglycaemia | Low risk |
Quote from publication: "double‐blind" "Patients experiencing symptoms of hypoglycaemia were instructed to obtain a fingerstick glucose, record the value in a log book and contact their study site" All adverse experiences were rated by the study site investigators for intensity and relationship to study drug" Comment: investigator‐assessed/self‐reported outcome measurement. Blinding of participants and study personnel ensured |
| Blinding of outcome assessment (detection bias) non‐fatal myocardial infarction/heart failure/non‐fatal stroke | Low risk |
Quote from publication: "double‐blind" "All adverse experiences were rated by the study site investigators for intensity and relationship to study drug" Comment: investigator‐assessed outcome measurement. Blinding of study personnel ensured |
| Blinding of outcome assessment (detection bias) non‐serious adverse events | Low risk |
Quote from publication: "double‐blind" "All adverse experiences were rated by the study site investigators for intensity and relationship to study drug" Comment: investigator‐assessed/self‐reported outcome measurement. Blinding of participants and study personnel ensured |
| Blinding of outcome assessment (detection bias) serious adverse events | Low risk |
Quote from publication: "double‐blind" "All adverse experiences were rated by the study site investigators for intensity and relationship to study drug" Comment: investigator‐assessed outcome measurement. Blinding of study personnel ensured |
| Blinding of outcome assessment (detection bias) weight (kg) | Low risk |
Quote from publication: "double‐blind" Comment: investigator‐assessed/self‐reported outcome measurement. Blinding of participants and study personnel ensured |
| Blinding of outcome assessment (detection bias) HbA1c | Low risk |
Quote from publication: "double‐blind" Comment: investigator‐assessed outcome measurement. Blinding of study personnel ensured |
| Incomplete outcome data (attrition bias) all‐cause/cardiovascular mortality | Low risk |
Quote from publication: "Safety and tolerability were evaluated over the 2‐year treatment period by a review of safety parameters including... data from the all‐patients‐as‐treated (APaT) cohort, which was defined as all randomised patients who received at least one dose of study medication." "In the analyses of safety parameters, missing values were not imputed." Comment: 100% of randomised participants were included in the analyses. There was a high dropout rate (43%‐45% of randomised participants completed the study), however, the dropout rate was balanced between groups. We assumed that trial authors searched registers for mortality status at the end of the trial |
| Incomplete outcome data (attrition bias) hypoglycaemia | High risk |
Quote from publication: "Safety and tolerability were evaluated over the 2‐year treatment period by a review of safety parameters including... data from the all‐patients‐as‐treated (APaT) cohort, which was defined as all randomised patients who received at least one dose of study medication." "In the analyses of safety parameters, missing values were not imputed." Comment: 100% of the randomised participants were included in the analyses. There was a high dropout rate (43%‐45% of the participants completed the study), however, the dropout rate was balanced between groups. No imputation of data from the participants not completing the study. The reasons for dropouts were balanced. The proportion of missing outcomes compared with observed event risk was enough to induce clinically relevant bias in intervention effect estimate |
| Incomplete outcome data (attrition bias) non‐fatal myocardial infarction/heart failure/non‐fatal stroke | High risk |
Quote from publication: "Safety and tolerability were evaluated over the 2‐year treatment period by a review of safety parameters including... data from the all‐patients‐as‐treated (APaT) cohort, which was defined as all randomised patients who received at least one dose of study medication." "In the analyses of safety parameters, missing values were not imputed." Comment: 100% of the randomised participants were included in the analyses. There was a high dropout rate (43%‐45% of the participants completed the study), however, the dropout rate was balanced between groups. No imputation of data from the participants not completing the study. The reasons for dropouts were balanced. The proportion of missing outcomes compared with observed event risk was enough to induce clinically relevant bias in intervention effect estimate |
| Incomplete outcome data (attrition bias) non‐serious adverse events | Low risk |
Quote from publication: "Safety and tolerability were evaluated over the 2‐year treatment period by a review of safety parameters including... data from the all‐patients‐as‐treated (APaT) cohort, which was defined as all randomised patients who received at least one dose of study medication." "In the analyses of safety parameters, missing values were not imputed." Comment: 100% of the randomised participants were included in the analyses. There was a high dropout rate (43%‐45% of the participants completed the study), however, the dropout rate was balanced between groups. No imputation of data from the participants not completing the study. The reasons for dropouts were balanced. The proportion of missing outcomes compared with observed event risk was not enough to induce clinically relevant bias in intervention effect estimate |
| Incomplete outcome data (attrition bias) serious adverse events | High risk |
Quote from publication: "Safety and tolerability were evaluated over the 2‐year treatment period by a review of safety parameters including... data from the all‐patients‐as‐treated (APaT) cohort, which was defined as all randomised patients who received at least one dose of study medication." "In the analyses of safety parameters, missing values were not imputed." Comment: 100% of the randomised participants were included in the analyses. There was a high dropout rate (43%‐45% of the participants completed the study), however, the dropout rate was balanced between groups. No imputation of data from the participants not completing the study. The reasons for dropouts were balanced. The proportion of missing outcomes compared with observed event risk was enough to induce clinically relevant bias in intervention effect estimate |
| Incomplete outcome data (attrition bias) weight (kg) | High risk |
Quote from publication: "Safety and tolerability were evaluated over the 2‐year treatment period by a review of safety parameters including... data from the all‐patients‐as‐treated (APaT) cohort, which was defined as all randomised patients who received at least one dose of study medication." "In the analyses of safety parameters, missing values were not imputed." Comment: 43%‐45% of the randomised participants were included in the analyses. There was a high dropout rate (43%‐45% of the participants completed the study), however, the dropout rate was balanced between groups. No imputation used. The reasons for dropouts were balanced. Plausible effect size among missing outcomes enough to induce clinically relevant bias in observed effect size |
| Incomplete outcome data (attrition bias) HbA1c | High risk |
Quote from publication: "To support the findings in the analysis of the PP population, additional efficacy analyses were performed for key endpoints (HbA1c and FPG) on the all‐patients‐treated (APT) cohort that consisted of all randomised patients who received at least one dose of study treatment and who had both a baseline and at least one post‐baseline measurement. Missing values in the APT analysis were imputed by the last observation carried forward approach over the 2‐year study." Comment: > 95% of the randomised participants were included in the analyses. There was a high dropout rate (43%‐45% of the participants completed the study), however, the dropout rate was balanced between groups. The reasons for dropouts were balanced. Inapropiate imputation method used (LOCF) |
| Selective reporting (reporting bias) | Low risk | Comment: all of the trial's primary and secondary outcomes as specified in the protocol have been reported |
| Other bias | Unclear risk | Comment: the trial was funded by a pharmaceutical company |
Vaccaro 2017.
| Methods |
Study design: multicentre, randomised, open‐label, parallel trial Randomisation ratio: 1:1 to receive pioglitazone or a sulphonylurea in addition to metformin |
|
| Participants |
Inclusion criteria: age 50‐75 years, T2DM of at least 2 years duration, BMI 20‐45 kg/m², stable treatment for the last 2 months with metformin in monotherapy (least 2‐3 g/day), HbA1c of 7.0%‐9.0% Exclusion criteria: T1DM, previous treatment with thiazolidinediones in the last six months, contraindication/intolerance to metformin or sulphonylureas or thiazolidinediones, documented coronary or cerebrovascular events in the previous 3 months, serum creatinine > 1.5 mg/dL, history of congestive heart failure, NYHA ≥ I, chronic use of glucocorticoids, ischaemic ulcer or gangrene, liver cirrhosis or severe hepatic dysfunction (ALT increase of 2.5 x ULN), pregnancy or breast feeding, cancer, substance abuse or any health problem that may interfere with the compliance to the study protocol or limit life expectancy Diagnostic criteria: not reported |
|
| Interventions |
Number of study centres: 57 Run‐in period: no |
|
| Outcomes | Composite outcome measures reported: "The primary efficacy outcome is a composite of all‐cause mortality, nonfatal myocardial infarction (including silent myocardial infarction), nonfatal stroke, unplanned coronary revascularization. The principal secondary outcome is a composite ischemic end point of sudden death, fatal and non‐fatal myocardial infarction (including silent myocardial infarction), fatal and nonfatal stroke, major leg amputation (above the ankle), endovascular or surgical interventions on the coronary, leg or carotid arteries. Other secondary outcomes are: 1) A composite CV endpoint including the primary endpoint plus hospitalization for heart failure, endovascular or surgical intervention on the coronary, leg or carotid arteries, incident angina or intermittent claudication; 2) All cases of heart failure; 3) A microvascular composite endpoint including: incident macroalbuminuria, or doubling of baseline plasma creatinine, or a creatinine clearance reduction of 20 ml/min/1.73 m² or plasma creatinine >3.3 mg/dl, or dialysis..." | |
| Study details |
Trial terminated early: "The observed event rate during follow‐up was lower than expected, with 213 adjudicated primary endpoint events in total. Following the data and safety monitoring board’s recommendation, a futility analysis for the primary endpoint using a frequentist approach was done in March 31, 2017. The results of this analysis showed that, if the future data distribution followed the current trend (the most plausible hypothesis), the probability of observing a significant positive result (ie, an HR of 0·80, two‐sided log‐rank test) at the planned end of follow‐up would be as low as 5%. On the basis of the futility analysis, the study was discontinued on May 23, 2017." Trial ID:NCT00700856 |
|
| Publication details |
Language of publication: English Funding: non‐commercial funding (the Italian Medicines Agency, the Italian Diabetes Society, and Diabete Ricerca (a non‐profit foundation)) Publication status: peer‐reviewed journal |
|
| Stated aim for study | Quote from publication: "The aim of the study was to compare the long‐term effect of these two therapeutic options with respect to incidence of cardiovascular events, as well as their effects on glucose control and safety" | |
| Notes | ‐ | |
| Risk of bias | ||
| Bias | Authors' judgement | Support for judgement |
| Random sequence generation (selection bias) | Low risk |
Quote from publication: "Permuted blocks randomisation (block size 10) was done centrally via an interactive telephone system..." Comment: adequate generation of random sequence ensured |
| Allocation concealment (selection bias) | Low risk |
Quote from publication: "Permuted blocks randomisation (block size 10) was done centrally via an interactive telephone system..." Comment: adequate concealment ensured |
| Blinding of participants and personnel (performance bias) all‐cause/cardiovascular mortality | Low risk |
Quote from publication: "Participants and investigators were aware of treatment assignment. The components of the primary outcome and some selected adverse events of particular interest with respect to the study drugs (heart failure, pathological fractures, macular oedema, and neoplasms) were adjudicated by an independent endpoint committee unaware of treatment group assignment." Comment: adjudicated outcome measurement. Incomplete blinding, the outcome is unlikely to be influenced by lack of blinding |
| Blinding of participants and personnel (performance bias) amputation of lower extremity/blindness or severe vision loss/end‐stage renal disease | Low risk |
Quote from publication: "Participants and investigators were aware of treatment assignment. The components of the primary outcome and some selected adverse events of particular interest with respect to the study drugs (heart failure, pathological fractures, macular oedema, and neoplasms) were adjudicated by an independent endpoint committee unaware of treatment group assignment." Comment: investigator‐assessed outcome measurement. Incomplete blinding, the outcome is unlikely to be influenced by lack of blinding |
| Blinding of participants and personnel (performance bias) hypoglycaemia | High risk |
Quote from publication: "Participants and investigators were aware of treatment assignment. The components of the primary outcome and some selected adverse events of particular interest with respect to the study drugs (heart failure, pathological fractures, macular oedema, and neoplasms) were adjudicated by an independent endpoint committee unaware of treatment group assignment." Comment: investigator‐assessed/self‐reported outcome measurement. Incomplete blinding, the outcome is likely to be influenced by lack of blinding |
| Blinding of participants and personnel (performance bias) non‐fatal myocardial infarction/heart failure/non‐fatal stroke | Low risk |
Quote from publication: "Participants and investigators were aware of treatment assignment. The components of the primary outcome and some selected adverse events of particular interest with respect to the study drugs (heart failure, pathological fractures, macular oedema, and neoplasms) were adjudicated by an independent endpoint committee unaware of treatment group assignment." Comment: adjudicated outcome measurement. Incomplete blinding, the outcome is unlikely to be influenced by lack of blinding |
| Blinding of participants and personnel (performance bias) non‐serious adverse events | High risk |
Quote from publication: "Participants and investigators were aware of treatment assignment. The components of the primary outcome and some selected adverse events of particular interest with respect to the study drugs (heart failure, pathological fractures, macular oedema, and neoplasms) were adjudicated by an independent endpoint committee unaware of treatment group assignment." Comment: self‐reported outcome measurement. Incomplete blinding, the outcome is likely to be influenced by lack of blinding |
| Blinding of participants and personnel (performance bias) serious adverse events | Low risk |
Quote from publication: "Participants and investigators were aware of treatment assignment. The components of the primary outcome and some selected adverse events of particular interest with respect to the study drugs (heart failure, pathological fractures, macular oedema, and neoplasms) were adjudicated by an independent endpoint committee unaware of treatment group assignment." Comment: adjudicated/investigator‐assessed outcome measurement. Incomplete blinding, the outcome is unlikely to be influenced by lack of blinding |
| Blinding of participants and personnel (performance bias) weight (kg) | High risk |
Quote from publication: "Participants and investigators were aware of treatment assignment. The components of the primary outcome and some selected adverse events of particular interest with respect to the study drugs (heart failure, pathological fractures, macular oedema, and neoplasms) were adjudicated by an independent endpoint committee unaware of treatment group assignment." Comment: investigator‐assessed/self‐reported outcome measurement. Incomplete blinding, the outcome is likely to be influenced by lack of blinding |
| Blinding of participants and personnel (performance bias) HbA1c | Low risk |
Quote from publication: "Participants and investigators were aware of treatment assignment. The components of the primary outcome and some selected adverse events of particular interest with respect to the study drugs (heart failure, pathological fractures, macular oedema, and neoplasms) were adjudicated by an independent endpoint committee unaware of treatment group assignment." Comment: adjudicated/investigator‐assessed outcome measurement. Incomplete blinding, the outcome is unlikely to be influenced by lack of blinding |
| Blinding of outcome assessment (detection bias) all‐cause/cardiovascular mortality | Low risk |
Quote from publication: "Participants and investigators were aware of treatment assignment. The components of the primary outcome and some selected adverse events of particular interest with respect to the study drugs (heart failure, pathological fractures, macular oedema, and neoplasms) were adjudicated by an independent endpoint committee unaware of treatment group assignment." Comment: adjudicated outcome measurement. Blinding of outcome committee ensured |
| Blinding of outcome assessment (detection bias) amputation of lower extremity/blindness or severe vision loss/end‐stage renal disease | Low risk |
Quote from publication: "Participants and investigators were aware of treatment assignment. The components of the primary outcome and some selected adverse events of particular interest with respect to the study drugs (heart failure, pathological fractures, macular oedema, and neoplasms) were adjudicated by an independent endpoint committee unaware of treatment group assignment." Comment: investigator‐assessed outcome measurement. Incomplete blinding, the outcome is unlikely to be influenced by lack of blinding |
| Blinding of outcome assessment (detection bias) hypoglycaemia | High risk |
Quote from publication: "Participants and investigators were aware of treatment assignment. The components of the primary outcome and some selected adverse events of particular interest with respect to the study drugs (heart failure, pathological fractures, macular oedema, and neoplasms) were adjudicated by an independent endpoint committee unaware of treatment group assignment." Comment: investigator‐assessed/self‐reported outcome measurement. Incomplete blinding, the outcome is likely to be influenced by lack of blinding |
| Blinding of outcome assessment (detection bias) non‐fatal myocardial infarction/heart failure/non‐fatal stroke | Low risk |
Quote from publication: "Participants and investigators were aware of treatment assignment. The components of the primary outcome and some selected adverse events of particular interest with respect to the study drugs (heart failure, pathological fractures, macular oedema, and neoplasms) were adjudicated by an independent endpoint committee unaware of treatment group assignment." Comment: adjudicated outcome measurement. Blinding of outcome committee ensured |
| Blinding of outcome assessment (detection bias) non‐serious adverse events | High risk |
Quote from publication: "Participants and investigators were aware of treatment assignment. The components of the primary outcome and some selected adverse events of particular interest with respect to the study drugs (heart failure, pathological fractures, macular oedema, and neoplasms) were adjudicated by an independent endpoint committee unaware of treatment group assignment." Comment: self‐reported outcome measurement. Incomplete blinding, the outcome is likely to be influenced by lack of blinding |
| Blinding of outcome assessment (detection bias) serious adverse events | Low risk |
Quote from publication: "Participants and investigators were aware of treatment assignment. The components of the primary outcome and some selected adverse events of particular interest with respect to the study drugs (heart failure, pathological fractures, macular oedema, and neoplasms) were adjudicated by an independent endpoint committee unaware of treatment group assignment." Comment: adjudicated/investigator‐assessed outcome measurement. Incomplete blinding, the outcome is unlikely to be influenced by lack of blinding |
| Blinding of outcome assessment (detection bias) weight (kg) | High risk |
Quote from publication: "Participants and investigators were aware of treatment assignment. The components of the primary outcome and some selected adverse events of particular interest with respect to the study drugs (heart failure, pathological fractures, macular oedema, and neoplasms) were adjudicated by an independent endpoint committee unaware of treatment group assignment." Comment: investigator‐assessed/self‐reported outcome measurement. Incomplete blinding, the outcome is likely to be influenced by lack of blinding |
| Blinding of outcome assessment (detection bias) HbA1c | Low risk |
Quote from publication: "Participants and investigators were aware of treatment assignment. The components of the primary outcome and some selected adverse events of particular interest with respect to the study drugs (heart failure, pathological fractures, macular oedema, and neoplasms) were adjudicated by an independent endpoint committee unaware of treatment group assignment." Comment: adjudicated/investigator‐assessed outcome measurement. Incomplete blinding, the outcome is unlikely to be influenced by lack of blinding |
| Incomplete outcome data (attrition bias) all‐cause/cardiovascular mortality | Low risk |
Quote from publication: "The safety analysis set includes only participants exposed to the trial medications. Participants were regarded as exposed to the trial medications as long as they had taken at least one dose of pioglitazone or sulfonylurea." "Patients who prematurely discontinued the study drugs were followed up for ascertainment of cardiovascular outcomes and information on vital status was obtained from the national health registry using the patient’s fiscal code as identifier for patients lost to follow‐up." Comment: > 99% of the randomised participants were included in the analyses. There was a high dropout rate (72%‐84% of randomised participants completed the study). The dropout rate was not balanced between groups, mostly due to decision from participants to leave trial. Vital status was searched in registers. |
| Incomplete outcome data (attrition bias) amputation of lower extremity/blindness or severe vision loss/end‐stage renal disease | High risk |
Quote from publication: "The safety analysis set includes only participants exposed to the trial medications. Participants were regarded as exposed to the trial medications as long as they had taken at least one dose of pioglitazone or sulfonylurea." Comment: > 99% of the randomised participants were included in the analyses. There was a high dropout rate (72%‐84% of randomised participants completed the study). The dropout rate was not balanced between groups, mostly due to decision from participants to leave trial. No information on imputation method. The proportion of missing outcomes compared with observed event risk was enough to induce clinically relevant bias in intervention effect estimate. |
| Incomplete outcome data (attrition bias) hypoglycaemia | Low risk |
Quote from publication: "The safety analysis set includes only participants exposed to the trial medications. Participants were regarded as exposed to the trial medications as long as they had taken at least one dose of pioglitazone or sulfonylurea." Comment: > 99% of the randomised participants were included in the analyses. There was a high dropout rate (72%‐84% of randomised participants completed the study). The dropout rate was not balanced between groups, mostly due to decision from participants to leave trial. No information on imputation method. The proportion of missing outcomes compared with observed event risk was not enough to induce clinically relevant bias in intervention effect estimate. |
| Incomplete outcome data (attrition bias) non‐fatal myocardial infarction/heart failure/non‐fatal stroke | Low risk |
Quote from publication: "The safety analysis set includes only participants exposed to the trial medications. Participants were regarded as exposed to the trial medications as long as they had taken at least one dose of pioglitazone or sulfonylurea." "Patients who prematurely discontinued the study drugs were followed up for ascertainment of cardiovascular outcomes and information on vital status was obtained from the national health registry using the patient’s fiscal code as identifier for patients lost to follow‐up." Comment: > 99% of the randomised participants were included in the analyses. There was a high dropout rate (72%‐84% of randomised participants completed the study). The dropout rate was not balanced between groups, mostly due to decision from participants to leave trial. Participants who prematurely discontinued the study drugs were followed up for ascertainment of cardiovascular outcomes |
| Incomplete outcome data (attrition bias) non‐serious adverse events | Low risk |
Quote from publication: "The safety analysis set includes only participants exposed to the trial medications. Participants were regarded as exposed to the trial medications as long as they had taken at least one dose of pioglitazone or sulfonylurea." Comment: > 99% of the randomised participants were included in the analyses. There was a high dropout rate (72%‐84% of randomised participants completed the study). The dropout rate was not balanced between groups, mostly due to decision from participants to leave trial. No information on imputation method. The proportion of missing outcomes compared with observed event risk was not enough to induce clinically relevant bias in intervention effect estimate |
| Incomplete outcome data (attrition bias) serious adverse events | High risk |
Quote from publication: "The safety analysis set includes only participants exposed to the trial medications. Participants were regarded as exposed to the trial medications as long as they had taken at least one dose of pioglitazone or sulfonylurea." Comment: > 99% of the randomised participants were included in the analyses. There was a high dropout rate (72%‐84% of randomised participants completed the study). The dropout rate was not balanced between groups, mostly due to decision from participants to leave trial. No information on imputation method. The proportion of missing outcomes compared with observed event risk was enough to induce clinically relevant bias in intervention effect estimate |
| Incomplete outcome data (attrition bias) weight (kg) | Unclear risk |
Quote from publication: "The trial efficacy analysis was done in the modified intention‐to‐treat population, which included all randomly assigned participants with baseline data available and without any protocol violations in relation to inclusion or exclusion criteria. Data from the patients who completed or discontinued the trial without having an outcome were censored from the day of their last visit; events occurring after that visit were not included" Comment: > 99% of the randomised participants were included in the analyses. There was a high dropout rate (72%‐84% of randomised participants completed the study). The dropout rate was not balanced between groups, mostly due to decision from participants to leave trial. No information on imputation method |
| Incomplete outcome data (attrition bias) HbA1c | Unclear risk |
Quote from publication: "The trial efficacy analysis was done in the modified intention‐to‐treat population, which included all randomly assigned participants with baseline data available and without any protocol violations in relation to inclusion or exclusion criteria. Data from the patients who completed or discontinued the trial without having an outcome were censored from the day of their last visit; events occurring after that visit were not included" Comment: > 99% of the randomised participants were included in the analyses. There was a high dropout rate (72%‐84% of randomised participants completed the study). The dropout rate was not balanced between groups, mostly due to decision from participants to leave trial. No information on imputation method |
| Selective reporting (reporting bias) | Low risk | Comment: all of the trial's primary and secondary outcomes as specified in the protocol have been reported |
ADA: American Diabetes Association; AE: adverse event; ALT: alanine amino transferase; AST: aspartate aminotransferase; BMI: body mass index; BP: blood pressure; CDM: core diabetes model; CV: cardiovascular event; CI: confidence interval; DBP: diastolic blood pressure; DPP‐4: dipeptidyl peptidase‐4; EASD: European Association for the Study of Diabetes; eGFR: estimated glomerular filtration rate; ESC: European Society of Cardiology; FPG: fasting plasma glucose; GFR: glomerular filtration rate; GLP‐1: glucagon‐like peptide 1; HbA1c: glycosylated haemoglobin A1c; LOCF: last observation carried forward; MI: myocardial infarction; MTD: maximum tolerated dose; NYHA: New York Heart Association; OAD: oral antidiabetic drug; OHA: oral antihyperglycaemic agent; PPAR ‐γ: peroxisome proliferator‐activated receptor gamma; PT: proximal tubule; RCT: randomised controlled trial; SAE: serious adverse event; SBP: systolic blood pressure; SGLT‐2: sodium‐glucose co‐transporter 2; SU: sulphonylurea; T1DM: type 1 diabetes mellitus; T2DM: type 2 diabetes mellitus; TSH: thyroid‐stimulating hormone; TZD: thiazolidinediones; ULN: upper limit of normal; WHO: World Health Organization
Characteristics of excluded studies [ordered by study ID]
| Study | Reason for exclusion |
|---|---|
| ACCORD 2007 | Did not compare interventions of interest |
| Alsharidah 2018 | Not a randomised clinical trial |
| Araki 2015 | Did not compare interventions of interest |
| Bermudez‐Pirela 2007 | Duration of the intervention < 52 weeks |
| Berndt‐Zipfel 2013 | Duration of the intervention < 52 weeks |
| Bode 2013 | Did not compare interventions of interest |
| Bruce 2006 | Duration of the intervention < 52 weeks |
| Charbonnel 2006 | Did not compare interventions of interest. Duration of the intervention < 52 weeks |
| Cryer 2005 | The trial compared interventions of interest (metformin vs metformin plus sulphonylurea), but only reported metformin vs usual care. We contacted the trial authors to get separate data, but have not had a reply |
| CTRI/2013/02/003417 | Did not compare interventions of interest |
| Derosa 2015 | Not a randomised clinical trial |
| EUCTR2004‐002549‐11‐FI | Did not compare interventions of interest. Investigating an investigational drug (tesaglitazar) |
| EUCTR2006‐001240‐30‐BE | The trial was cancelled in 2010 |
| EUCTR2009‐014727‐23‐IT | Prematurely ended, no study results |
| EUCTR2009‐017524‐36‐HU | Did not compare interventions of interest |
| Gregorio 1989 | Did not compare interventions of interest |
| Haering 2015 | Not a randomised clinical trial |
| Hassanein 2014 | Duration of the intervention < 52 weeks |
| Heller 2018 | Did not compare interventions of interest |
| Hermann 2001 | Did not compare interventions of interest |
| Inagaki 2013 | Did not compare interventions of interest |
| Iqbal 2014 | Did not compare interventions of interest |
| ISRCTN19750520 | Did not compare interventions of interest |
| ISRCTN41840459 | Did not compare interventions of interest |
| Jackson 1987 | Did not compare interventions of interest. Duration of the intervention < 52 weeks |
| Javaid 2007 | Not a randomised clinical trial |
| Johansen 2007 | Did not compare interventions of interest |
| JPRN‐UMIN000005327 | Did not compare interventions of interest |
| Kala 2017 | Duration of the intervention < 52 weeks |
| Malha 2014 | Duration of the intervention < 52 weeks |
| Marre 2002 | Duration of the intervention < 52 weeks |
| Meneghini 2010 | Did not compare interventions of interest. Duration of the intervention < 52 weeks |
| Moon 2014 | Duration of the intervention < 52 weeks |
| Morikawa 2011 | Did not compare interventions of interest |
| Nauck 2006 | Duration of the intervention < 52 weeks |
| NCT00269061 | Did not compare interventions of interest |
| NCT00449605 | Study was cancelled |
| NCT00518882 | Did not compare interventions of interest |
| NCT00543751 | Study was cancelled |
| NCT00839527 | Did not compare interventions of interest |
| NCT00909597 | Did not compare interventions of interest |
| NCT00947557 | Duration of the intervention < 52 weeks |
| NCT01087567 | Did not compare interventions of interest |
| NCT01106625 | Did not compare interventions of interest |
| NCT01426737 | Protocol for a trial which is never completed |
| NCT01455883 | Study withdrawn |
| NCT01481116 | Did not compare interventions of interest. Comparator is an investigational drug (fasiglifam) |
| NCT01593137 | Study withdrawn |
| NCT02244164 | Not a randomised clinical trial |
| NCT02462369 | Did not compare interventions of interest |
| NCT02587741 | Did not compare interventions of interest |
| NCT02616666 | Did not compare interventions of interest |
| NCT03060980 | Study was cancelled |
| Onuchin 2010 | Duration of the intervention < 52 weeks |
| Rosenstock 2006 | Did not compare interventions of interest. Duration of the intervention < 52 weeks |
| Rosenstock 2018 | The duration of the intervention was not identical in the intervention groups |
| Rubin 2008 | Did not compare interventions of interest. Comparator was a drug no longer approved for use (muraglitazar) |
| Shankar 2017 | The duration of the intervention was not identical in the intervention groups |
| Tolman 2009 | Did not compare interventions of interest |
| UKPDS 1998 | Did not compare interventions of interest |
| Weissman 2014 | Did not compare interventions of interest |
| Yki‐Järvinen 1999 | Did not compare interventions of interest |
Characteristics of studies awaiting assessment [ordered by study ID]
Müller‐Wieland 2018.
| Methods | Randomised clinical trial |
| Participants | People with T2DM treated with metformin Estimated number of participants: 1359 |
| Interventions | Metformin + dapagliflozin, metformin + saxagliptin and dapagliflozin, metformin + glimepiride |
| Outcomes |
Primary outcome: change in HbA1c from baseline to end of treatment Relevant proposed outcome measures for 'Summary of findings' table: none |
| Study details |
Trial identifier:NCT02471404 Completion date: March 2017 |
| Publication details | Marked as 'completed' in ClinicalTrials.gov and recently published in a peer‐reviewed journal |
| Stated aim of study | "This study is being carried out to see if dapagliflozin and dapagliflozin plus saxagliptin as an addition to metformin is effective and safe in treating patients with type 2 diabetes when compared to glimepiride (sulphonylurea) as an addition to metformin treatment" |
| Notes | Classified as awaiting classification because the study was only published shortly before the publication of this review and does not report outcomes for 'Summary of findings' table |
NCT02564926.
| Methods | Randomised clinical trial |
| Participants | People with T2DM treated with metformin Estimated number of participants: 125 |
| Interventions | Metformin + dapagliflozin, metformin + glimepiride |
| Outcomes |
Primary outcome: changes in total body fat mass from baseline using DXA scan 52 weeks after the start of the treatment Secondary outcomes: including change in HbA1c levels from baseline to 52 weeks Relevant proposed outcome measures for 'Summary of findings' table: none |
| Study details |
Trial identifier:NCT02564926 Completion date: January 2018 |
| Publication details | Marked as 'completed' in ClinicalTrials.gov |
| Stated aim of study | "To evaluate the effect of dapagliflozin on body composition in Korean T2DM participants.12‐month, randomised, open‐label, parallel‐group, multi‐centre phase IV study" |
| Notes | Classified as awaiting classification because the study is marked as completed in ClinicalTrials.gov and first results were submitted in January 2019 but are not yet publicly available |
DXA: dual X‐ray absorptiometry; HbA1c: glycosylated haemoglobin A1c; T2DM: type 2 diabetes mellitus
Characteristics of ongoing studies [ordered by study ID]
EUCTR2011‐003335‐63‐IT.
| Trial name or title | Effects of liraglutide on pancreatic function in type 2 diabetic patients with secondary failure to oral hypoglycemic agents |
| Methods | Randomised clinical trial |
| Participants | People with T2DM treated with metformin and sulphonylurea Estimated number of participants: 80 |
| Interventions | Liraglutide, glimepiride, insulin, metformin |
| Outcomes | Primary endpoint: ß‐cell glucose sensitivity as derived from the OGTT Secondary objective: to compare the effects of liraglutide and sulphonylurea on glycaemic control (fasting plasma glucose, HbA1C) |
| Starting date | June 2012 |
| Contact information | stefano.delprato@med.unipi.it |
| Study identifier | EUCTR2011‐003335‐63‐IT |
| Official title and purpose of study | Effects of liraglutide on pancreatic function in type 2 diabetic patients with secondary failure to oral hypoglycemic agents "To determine to which extent liraglutide can maintain ß‐cell function in type 2 diabetic patients with secondary failure after an adequate period of good glycaemic control" |
| Relevant proposed outcome measures for 'Summary of findings' table | None |
| Notes | Study completion date: not specified (EudraCT end of trial status: ongoing) |
EUCTR2012‐000152‐34‐IT.
| Trial name or title | Evaluation of the effect of a new drug for diabetes on atherosclerosis in patients with primary failure metformin |
| Methods | Randomised clinical trial |
| Participants | People with T2DM on metformin treatment Estimated number of participants: 64 |
| Interventions | Sitagliptin, sulphonylurea |
| Outcomes | Primary endpoint: evaluation of endothelial function and oxidative stress Secondary objective: evaluation of the role of DPP‐4 inhibitors on lipid and glycaemic control |
| Starting date | February 2012 |
| Contact information | maria.delben@uniroma1.it |
| Study identifier | EUCTR2012‐000152‐34‐IT |
| Official title and purpose of study | Evaluation of the effect of a new drug for diabetes on atherosclerosis in patients with primary failure metformin "Main objective: evaluate the role of DPP4 inhibitors on endothelial function and oxidative stress" |
| Relevant proposed outcome measures for 'Summary of findings' table | None |
| Notes | Study completion date: not specified (EudraCT end of trial status: ongoing) |
JPRN‐UMIN000008815.
| Trial name or title | The effect of DPP‐4 inhibitor on pancreatic beta cell function and renal function in type 2 diabetic patients |
| Methods | Randomised clinical trial |
| Participants | People with T2DM treated with metformin Estimated number of participants: 200 |
| Interventions | Sitagliptin, glimepiride |
| Outcomes | Primary outcomes: the ratio and amount of change of proinsulin/IRI ratio in 12 months from the start of treatment; the ratio and amount of change of urinary microalbuminuria in the 3‐month average of 10, 11, 12 months after the start of treatment Secondary outcomes include change from baseline to week 52 in HbA1c |
| Starting date | April 2011 |
| Contact information | ehirata11@gmail.com |
| Study identifier | JPRN‐UMIN000008815 |
| Official title and purpose of study | The effect of DPP‐4 inhibitor on pancreatic beta cell function and renal function in type 2 diabetic patients |
| Relevant proposed outcome measures for 'Summary of findings' table | None |
| Notes | Study completion date: not specified (UMIN‐CTR last follow‐up date: June 2014) |
NCT01243424.
| Trial name or title | CAROLINA: Cardiovascular outcome study of linagliptin versus glimepiride in patients with type 2 diabetes |
| Methods | Randomised clinical trial |
| Participants | People with T2DM at high risk of cardiovascular disease receiving usual care Estimated number of participants: 6000 |
| Interventions | Linagliptin, glimepiride |
| Outcomes | Primary outcomes: cardiovascular death, non‐fatal myocardial infarction, non‐fatal stroke |
| Starting date | October 2010 |
| Contact information | Boehringer Ingelheim |
| Study identifier | NCT01243424 |
| Official title and purpose of study | A multicentre, international, randomised, parallel group, double blind study to evaluate cardiovascular safety of linagliptin versus glimepiride in participants with type 2 diabetes mellitus at high cardiovascular risk "... to investigate the long term impact on cardiovascular morbidity and mortality, relevant efficacy parameters (e.g., glycaemic parameters) and safety (e.g., weight and hypoglycaemia) of treatment with linagliptin in patients with type 2 diabetes at elevated cardiovascular risk receiving usual care, and compare outcome against glimepiride" |
| Relevant proposed outcome measures for 'Summary of findings' table | Yes: time to first occurrence of cardiovascular death (including fatal stroke and fatal MI), non‐fatal MI (excluding silent MI) or non‐fatal stroke |
| Notes | Study completion date: August 2018 |
NCT01794143.
| Trial name or title | A comparative effectiveness study of major glycemia‐lowering medications for treatment of type 2 diabetes (GRADE) |
| Methods | Randomised clinical trial |
| Participants | People with T2DM treated with metformin Estimated number of participants: 5000 |
| Interventions | Glimepiride, sitagliptin, liraglutide, insulin |
| Outcomes | Primary endpoint: time to HbA1c ≥ 7%, while receiving metformin and the randomly assigned study medication |
| Starting date | May 2013 |
| Contact information | David M Nathan, MD, Massachusetts General Hospital |
| Study identifier | NCT01794143 |
| Official title and purpose of study | Glycemia reduction approaches in diabetes: a comparative effectiveness study "The GRADE study is a pragmatic, unmasked clinical trial that will compare commonly used diabetes medications, when combined with metformin, on glycemia‐lowering effectiveness and patient‐centered outcomes" |
| Relevant proposed outcome measures for 'Summary of findings' table | None |
| Notes | Estimated study completion date: July 2021 |
NCT02142309.
| Trial name or title | Glycemic durability after metformin failure (AMAZING) |
| Methods | Randomised clinical trial |
| Participants | People with newly‐diagnosed T2DM, failing to diet Estimated number of participants: 450 |
| Interventions | Glimepiride, vildagliptin, pioglitazone, canagliflozin |
| Outcomes | Primary outcome: time to primary failure with a HbA1c value > 7% on MTDs of the assigned drug |
| Starting date | October 2005 |
| Contact information | Dario Giugliano, MD dario.giugliano@unina2.it |
| Study identifier | NCT02142309 |
| Official title and purpose of study | Effect of glimepiride, vildagliptin, pioglitazone and canagliflozin on durability of glycemic control after metformin failure in type 2 diabetes "To compare commonly used oral diabetes medications, when combined with metformin, on glycemia‐lowering effectiveness" |
| Relevant proposed outcome measures for 'Summary of findings' table | None |
| Notes | Estimated study completion date: January 2017 |
NCT02730377.
| Trial name or title | Efficacy in controlling glycaemia with Victoza (liraglutide) as add‐on to metformin vs. OADs as add‐on to metformin after up to 104 weeks of treatment in participants with type 2 diabetes (LIRA‐PRIME) |
| Methods | Randomised clinical trial |
| Participants | People with T2DM treated with metformin Estimated number of participants: 1994 |
| Interventions | Liraglutide, alpha‐glucosidase inhibitor, DPP‐4 inhibitor, meglitinide, SGLT‐2 inhibitor, sulphonylurea, thiazolidinediones |
| Outcomes | Primary outcome: time to inadequate glycaemic control defined as HbA1c > 7.0% Secondary outcomes include change in body weight |
| Starting date | March 2016 |
| Contact information | Novo Nordisk A/S |
| Study identifier | NCT02730377 |
| Official title and purpose of study | Efficacy in controlling glycaemia with Victoza (liraglutide) as add‐on to metformin vs. OADs as add‐on to metformin after up to 104 weeks of treatment in participants with type 2 diabetes inadequately controlled with metformin monotherapy and treated in a primary care setting "The aim of the trial is to investigate efficacy in controlling glycaemia with Victoza (liraglutide) as add‐on to metformin background treatment vs. OADs as add‐on to metformin background treatment for 104 weeks of treatment in subjects with type 2 diabetes" |
| Relevant proposed outcome measures for 'Summary of findings' table | None |
| Notes | Estimated study completion date: August 2019 |
NCT02769481.
| Trial name or title | Safety and efficacy of bexagliflozin compared to glimepiride as add‐on therapy to metformin in type 2 diabetes participants |
| Methods | Randomised controlled trial |
| Participants | People with T2DM currently taking metformin or taking metformin and 1 additional oral medication for diabetes Estimated number of participants: 429 |
| Interventions | Bexagliflozin, glimepiride |
| Outcomes | Primary outcome: change in HbA1c from baseline to week 60 |
| Starting date | August 2016 |
| Contact information | J. Paul Lock, MD, Theracos Sub, LLC |
| Study identifier | NCT02769481 |
| Official title and purpose of study | A phase 3, randomized, double‐blind, active‐controlled study to evaluate the effects of bexagliflozin versus glimepiride in subjects with type 2 diabetes mellitus who have inadequate glycemic control by metformin "The purpose of this study is to investigate the effect of bexagliflozin compared to glimepiride as an add‐on therapy to metformin in lowering hemoglobin A1c (HbA1c) levels in subjects with type 2 diabetes mellitus (T2DM)" |
| Relevant proposed outcome measures for 'Summary of findings' table | None |
| Notes | Estimated study completion date: December 2019 |
NCT03332771.
| Trial name or title | Efficacy and safety of sotagliflozin versus glimepiride and placebo in participants with type 2 diabetes mellitus that are taking metformin monotherapy (SOTA‐GLIM) |
| Methods | Randomised clinical trial |
| Participants | People with T2DM treated with metformin Estimated number of participants: 930 |
| Interventions | Sotagliflozin, glimepiride |
| Outcomes | Primary outcome: change from baseline to week 52 in haemoglobin A1c |
| Starting date | December 2017 |
| Contact information | Contact‐Us@sanofi.com |
| Study identifier | NCT03332771 |
| Official title and purpose of study | A 52‐week randomized, double‐blind, double‐dummy, active and placebo‐controlled, parallel‐group, multicentre study to evaluate the efficacy and safety of sotagliflozin compared to glimepiride or placebo added to metformin in patients with type 2 diabetes who have inadequate glycemic control with metformin monotherapy "To demonstrate the non‐inferiority of sotagliflozin dose 1 compared to glimepiride on HbA1c (glycosylated A1c) reduction in patients with T2D (type 2 diabetes) who have inadequate glycemic control with metformin" |
| Relevant proposed outcome measures for 'Summary of findings' table | None |
| Notes | Estimated study completion date: August 2019 |
DPP‐4: dipeptidyl pepdiase‐4; HbA1c: glycated haemoglobin A1c; IRI: immunoreactive insulin; MI: myocardial infarction; MTD: maximum tolerated dose; OAD: oral antidiabetic drug; OGTT: oral glucose tolerance test; SGLT‐2: sodium‐glucose co‐transporter‐2; SoF: summary of findings; T2DM: type 2 diabetes mellitus
Differences between protocol and review
We changed data extraction of mild, moderate and serious hypoglycaemia to extraction of mild or moderate and serious hypoglycaemia as this was the more common way of reporting hypoglycaemia in publications.
We performed subgroup analysis dividing thiazolidinediones in rosiglitazone and pioglitazone.
Contributions of authors
All review authors read and approved the final review draft.
Kasper S Madsen (KM): protocol draft, acquisition of trial reports, trial selection, data extraction, data analysis, data interpretation, writing draft, and future review updates
Pernille Kähler (PK): trial selection, data extraction, review of drafts and future review updates
Bianca Hemmingsen (BH): protocol draft, acquisition of trial reports, trial selection, data extraction, data analysis, data interpretation, review of drafts and future review updates
Sten Madsbad (SM): protocol draft, review of drafts and future review updates
Bernd Richter (BR): protocol draft, search strategy development, data analysis, data interpretation, review of drafts and future review updates
Maria‐Inti Metzendorf (MIM): protocol draft, search strategy development, review of drafts and future review updates
Lise Katrine Kähler (LK): trial selection, data extraction, review of drafts and future review updates
Filip Gnesin (FG): trial selection, data extraction, review of drafts and future review updates
Sources of support
Internal sources
No sources of support supplied
External sources
-
Michaelsen Fonden, Denmark.
Financial support: non‐pharmaceutical fund, which hands out scholarships to medical students on reaserch leave from the university
Declarations of interest
KM: had an inadvertent conflict of interest because he had owned a small number of shares with Novo Nordisk A/S before registering the title. Without prompting KM amended the situation by selling the shares, so he no longer has a direct financial benefit as first author. Cochrane Metabolic and Endocrine Disorders contacted the Cochrane Funding Arbiter for guidance, who agreed to allow the review to proceed with KM as a first author, providing that this issue was clearly explained in the declarations of interest. KM received a scholarship from Michaelsen Fonden.
PK: equities in Novo Nordisk A/S.
LK: none known.
SM: Advisory Boards: Novartis Pharma, Novo Nordisk, Merck Sharp & Dome, Sanofi‐Aventis, AstraZeneca, Johnson & Johnson, Boehringer‐Ingelheim, Eli Lilly, Intarcia Therapeutics, Bristol‐Meyer Squibb. Fee for lectures: Novo Nordisk, Merck, Sharp & Dome, Astra‐Zeneca, Sanofi‐Aventis, Novartis Pharma, Eli Lilly, Bristol‐Meyer Squibb, Boeringer‐Ingelheim. Grants for research: Novo Nordisk.
FG: none known.
MIM: none known.
BR: none known.
BH: none known.
New
References
References to studies included in this review
Ahrén 2014 {published and unpublished data}
- Ahrén B, Carr MC, Murphy K, Perkins C, Rendell M, Mallory J, et al. Albiglutide for the treatment of type 2 diabetes mellitus: an integrated safety analysis of the HARMONY phase 3 trials. Diabetes Research and Clinical Practice 2017;126:230‐9. [DOI: 10.1016/j.diabres.2017.02.017] [DOI] [PubMed] [Google Scholar]
- Ahrén B, Johnson SL, Stewart M, Cirkel DT, Yang F, Perry C, et al. HARMONY 3: 104‐week randomized, double‐blind, placebo‐ and active‐controlled trial assessing the efficacy and safety of albiglutide compared with placebo, sitagliptin, and glimepiride in patients with type 2 diabetes taking metformin. Diabetes Care 2014;37(8):2141‐8. [DOI: 10.2337/dc14-0024] [DOI] [PubMed] [Google Scholar]
- Ahrén B, Stewart M, Cirkel D, Yang F, Perry C, Johnson S. HARMONY 3: 104 week (wk) efficacy of albiglutide (albi) compared to sitagliptin (sita) and glimepiride (SU) in patients (pts) with type 2 diabetes mellitus (T2DM) on metformin (met). 73rd Scientific Sessions. American Diabetes Assosciation. 2013 June 21‐25; Chicago (IL). American Diabetes Assosciation, 2013. [52‐LB]
- Doggrell SA. Comparator clinical trials of surrogate endpoints with albiglutide are in HARMONY. Expert Review of Endocrinology and Metabolism 2015;10(3):273‐6. [DOI: 10.1586/17446651.2015.995629] [DOI] [PubMed] [Google Scholar]
- Fisher M, Petrie MC, Ambery PD, Donaldson J, Ye J, McMurray JJ. Cardiovascular safety of albiglutide in the HARMONY Programme: a meta‐analysis. Lancet Diabetes & Endocrinology 2015;3(9):697‐703. [DOI: 10.1016/S2213-8587(15)00233-8] [DOI] [PubMed] [Google Scholar]
- GSK Study ID 112753. Efficacy and safety of albiglutide in treatment of type 2 diabetes. gsk‐studyregister.com/study/3736 (accessed 16 November 2016).
- Home PD, Ahrén B, Reusch JE, Rendell M, Weissman PN, Cirkel DT, et al. Three‐year data from 5 HARMONY phase 3 clinical trials of albiglutide in type 2 diabetes mellitus: long‐term efficacy with or without rescue therapy. Diabetes Research and Clinical Practice 2017;131:49‐60. [DOI: 10.1016/j.diabres.2017.06.013] [DOI] [PubMed] [Google Scholar]
- Johnson S, Ahrén B, Stewart M, Cirkel D, Yang F, Perry C. HARMONY 3: 104 week efficacy of albiglutide compared to sitagliptin and glimepiride in patients with type 2 diabetes mellitus on metformin. Diabetologia 2013;56:S8‐9. [DOI] [PubMed] [Google Scholar]
- Leiter LA, Mallory JM, Wilson TH, Reinhardt RR. Gastrointestinal safety across the albiglutide development programme. Diabetes, Obesity & Metabolism 2016;18(9):930‐5. [DOI: 10.1111/dom.12679] [DOI] [PubMed] [Google Scholar]
- Matthews JE, Ahren B, Ye J, Carr MC, Stewart MW. HARMONY 3 year 3 results: albiglutide vs sitagliptin, glimepiride, and placebo in patients with T2DM on metformin. 50th Annual Meeting of the European Association for the Study of Diabetes. 15‐19 September 2014. [abstract no 831]
- NCT00838903. Efficacy and safety of albiglutide in treatment of type 2 diabetes. clinicaltrials.gov/ct2/show/study/NCT00838903 (accessed 16 November 2016).
Charbonnel 2005 {published data only}
- Belcher G, Schernthaner G. Changes in liver tests during 1‐year treatment of patients with type 2 diabetes with pioglitazone, metformin or gliclazide. Diabetic Medicine 2005;22(8):973‐9. [DOI: 10.1111/j.1464-5491.2005.01595.x] [DOI] [PubMed] [Google Scholar]
- Charbonnel B, Roden M, Urquhart R, Mariz S, Johns D, Mihm M, et al. Pioglitazone elicits long‐term improvements in insulin sensitivity in patients with type 2 diabetes: comparisons with gliclazide‐based regimens. Diabetologia 2005;48(3):553‐60. [DOI: 10.1007/s00125-004-1651-9] [DOI] [PubMed] [Google Scholar]
- Charbonnel B, Schernthaner G, Brunetti P, Matthews DR, Urquhart R, Tan MH, et al. Long‐term efficacy and tolerability of add‐on pioglitazone therapy to failing monotherapy compared with addition of gliclazide or metformin in patients with type 2 diabetes. Diabetologia 2005;48(6):1093‐104. [DOI: 10.1007/s00125-005-1751-1] [DOI] [PubMed] [Google Scholar]
- Matthews DR, Charbonnel BH, Hanefeld M, Brunetti P, Schernthaner G. Long‐term therapy with addition of pioglitazone to metformin compared with the addition of gliclazide to metformin in patients with type 2 diabetes: a randomized, comparative study. Diabetes/Metabolism Research and Reviews 2005;21(2):167‐74. [DOI: 10.1002/dmrr.478] [DOI] [PubMed] [Google Scholar]
- Roden M, Mariz S, Brazzale AR, Pacini G. Free fatty acid kinetics during long‐term treatment with pioglitazone added to sulfonylurea or metformin in type 2 diabetes. Journal of Internal Medicine 2009;265(4):476‐87. [DOI: 10.1111/j.1365-2796.2008.02040.x] [DOI] [PubMed] [Google Scholar]
Dei Cas 2017 {published data only}
- Dei Cas A, Spigoni V, Cito M, Aldigeri R, Ridolfi V, Marchesi E, et al. Vildagliptin, but not glibenclamide, increases circulating endothelial progenitor cell number: a 12‐month randomized controlled trial in patients with type 2 diabetes. Cardiovascular Diabetology 2017;16(1):27. [DOI: 10.1186/s12933-017-0503-0] [DOI] [PMC free article] [PubMed] [Google Scholar]
- NCT01822548. Effect of vildagliptin vs. glibenclamide on circulating endothelial progenitor cell number type 2 diabetes. clinicaltrials.gov/ct2/show/NCT01822548 (accessed 26 June 2017).
Del Prato 2014 {published data only}
- Prato S, Camisasca R, Wilson C, Fleck P. Durability of the efficacy and safety of alogliptin compared with glipizide in type 2 diabetes mellitus: a 2‐year study. Diabetes Obesity Metabolism 2014;16(12):1239‐46. [DOI: ] [DOI] [PubMed] [Google Scholar]
- Prato S, Fleck P, Wilson C, Chaudhari P. Comparison of alogliptin and glipizide for composite endpoint of glycated haemoglobin reduction, no hypoglycaemia and no weight gain in type 2 diabetes mellitus. Diabetes, Obesity & Metabolism 2016;18(6):623‐7. [DOI: ] [DOI] [PubMed] [Google Scholar]
- Gordon J, McEwan P, Hurst M, Puelles J. The cost‐effectiveness of alogliptin versus sulfonylurea as add‐on therapy to metformin in patients with uncontrolled type 2 diabetes mellitus. Diabetes Therapy 2016;7(4):825‐45. [DOI: 10.1007/s13300-016-0206-7] [DOI] [PMC free article] [PubMed] [Google Scholar]
- NCT00856284. Efficacy and safety of alogliptin plus metformin compared to glipizide plus metformin in patients with type 2 diabetes mellitus (ENDURE). clinicaltrials.gov/ct2/show/NCT00856284 (accessed 12 December 2016).
Del Prato 2015 {published data only}
- Abad Paniagua EJ, Casado Escribano P, Fernández Rodriguez JM, Morales Escobar FJ, Betegón Nicolás L, Sánchez‐Covisa J, et al. Cost‐effectiveness analysis of dapagliflozin compared to DPP4 inhibitors and other oral antidiabetic drugs in the treatment of type‐2 diabetes mellitus in Spain. Atencion Primaria 2015;47(8):505‐13. [DOI: 10.1016/j.aprim.2014.11.002] [DOI] [PMC free article] [PubMed] [Google Scholar]
- Charokopou M, McEwan P, Lister S, Callan L, Bergenheim K, Tolley K, et al. The cost‐effectiveness of dapagliflozin versus sulfonylurea as an add‐on to metformin in the treatment of Type 2 diabetes mellitus. Diabetic Medicine 2015;32(7):890‐8. [DOI: 10.1111/dme.12772] [DOI] [PubMed] [Google Scholar]
- Prato S, Nauck M, Durán‐Garcia S, Maffei L, Rohwedder K, Theuerkauf A, et al. Long‐term glycaemic response and tolerability of dapagliflozin versus a sulphonylurea as add‐on therapy to metformin in patients with type 2 diabetes: 4‐year data. Diabetes Obesity Metabolism 2015;17(6):581‐90. [DOI] [PubMed] [Google Scholar]
- Fenici P, Sternhufvud C, Cain V, Mukherjee J, Rohwedder K. Dapagliflozin added to metformin is effective in achieving combined improvements in HbA1c and weight without hypoglycaemia over 4 years. Diabetologia 2015;58:S355. [Google Scholar]
- Forst T, Rohwedder K, Sugg J, Johnsson E. Dapagliflozin decreases post‐prandial glucose without an increase in C‐peptide or insulin. Diabetes 2015;64:A324. [Google Scholar]
- Katz A, Yeh H. Dapagliflozin and insulin resistance in patients with type 2 diabetes. Diabetes 2015;64:A304‐5. [Google Scholar]
- NCT00660907. Efficacy and safety of dapagliflozin in combination with metformin in type 2 diabetes patients. clinicaltrials.gov/ct2/show/NCT00660907 (accessed 3 August 2017).
- Nauck MA, Prato S, Duran‐Garcia S, Rohwedder K, Langkilde AM, Sugg J, et al. Durability of glycaemic efficacy over 2 years with dapagliflozin versus glipizide as add‐on therapies in patients whose type 2 diabetes mellitus is inadequately controlled with metformin. Diabetes, Obesity & Metabolism 2014;16(11):1111‐20. [DOI] [PubMed] [Google Scholar]
- Nauck MA, Prato S, Meier JJ, Duran‐Garcia S, Rohwedder K, Elze M, et al. Dapagliflozin versus glipizide as add‐on therapy in patients with type 2 diabetes who have inadequate glycemic control with metformin: a randomized, 52‐week, double‐blind, active‐controlled noninferiority trial. Diabetes Care 2011;34(9):2015‐22. [DOI] [PMC free article] [PubMed] [Google Scholar]
- Parikh S, Wilding J, Jabbour S, Hardy E. Dapagliflozin in type 2 diabetes: effectiveness across the spectrum of disease and over time. International Journal of Clinical Practice 2015;69(2):186‐98. [DOI] [PubMed] [Google Scholar]
- Rohwedder K, Johnsson E. Baseline fasting plasma glucose may predict response to dapagliflozin when added to metformin. Diabetologia 2015;58:S349‐50. [Google Scholar]
- Sabale U, Ekman M, Granstrom O, Bergenheim K, McEwan P. Cost‐effectiveness of dapagliflozin (Forxiga) added to metformin compared with sulfonylurea added to metformin in type 2 diabetes in the Nordic countries. Primary Care Diabetes 2015;9(1):39‐47. [DOI] [PubMed] [Google Scholar]
- Stenlöf K, Cain V, Rohwedder K, Johnsson E. Maintenance of weight loss with dapagliflozin vs. glipizide as add‐on to metformin over 4 years. Diabetes 2015;64:A27. [Google Scholar]
Derosa 2005 {published data only}
- Derosa G, Cicero AF, Gaddi AV, Ciccarelli L, Piccinni MN, Salvadeo S, et al. Long‐term effects of glimepiride or rosiglitazone in combination with metformin on blood pressure control in type 2 diabetic patients affected by the metabolic syndrome: a 12‐month, double‐blind, randomized clinical trial. Clinical Therapeutics 2005;27(9):1383‐91. [DOI] [PubMed] [Google Scholar]
- Derosa G, Gaddi A, Ciccarelli L, Fogari E, Ghelfi M, Ferrari I, et al. Long‐term effect of glimepiride and rosiglitazone on non‐conventional cardiovascular risk factors in metformin‐treated patients affected by metabolic syndrome: a randomized, double‐blind clinical trial. Journal of International Medical Research 2005;33(3):284‐94. [DOI] [PubMed] [Google Scholar]
- Derosa G, Gaddi AV, Piccinni MN, Ciccarelli L, Salvadeo S, Peros E, et al. Antithrombotic effects of rosiglitazone‐metformin versus glimepiride‐metformin combination therapy in patients with type 2 diabetes mellitus and metabolic syndrome. Pharmacotherapy 2005;25(5):637‐45. [DOI] [PubMed] [Google Scholar]
- Derosa G, Gaddi AV, Piccinni MN, Salvadeo S, Ciccarelli L, Fogari E, et al. Differential effect of glimepiride and rosiglitazone on metabolic control of type 2 diabetic patients treated with metformin: a randomized, double‐blind, clinical trial. Diabetes, Obesity & Metabolism 2006;8(2):197‐205. [DOI] [PubMed] [Google Scholar]
Derosa 2009a {published data only}
- Derosa G, Maffioli P, Salvadeo SA, Ferrari I, Gravina A, Mereu R, et al. Direct comparison among oral hypoglycemic agents and their association with insulin resistance evaluated by euglycemic hyperinsulinemic clamp: the 60's study. Metabolism 2009;58(8):1059‐66. [DOI] [PubMed] [Google Scholar]
Derosa 2009b {published data only}
- Derosa G, D'Angelo A, Fogari E, Salvadeo S, Gravina A, Ferrari I, et al. Effects of nateglinide and glibenclamide on prothrombotic factors in naive type 2 diabetic patients treated with metformin: a 1‐year, double‐blind, randomized clinical trial. Internal Medicine (Tokyo, Japan) 2007;46(22):1837‐46. [DOI] [PubMed] [Google Scholar]
- Derosa G, D'Angelo A, Fogari E, Salvadeo S, Gravina A, Ferrari I, et al. Nateglinide and glibenclamide metabolic effects in naive type 2 diabetic patients treated with metformin. Journal of Clinical Pharmacy and Therapeutics 2009;34(1):13‐23. [DOI] [PubMed] [Google Scholar]
Derosa 2010 {published data only}
- Derosa G, Maffioli P, Salvadeo SA, Ferrari I, Ragonesi PD, Querci F, et al. Exenatide versus glibenclamide in patients with diabetes. Diabetes Technology & Therapeutics 2010;12(3):233‐40. [DOI] [PubMed] [Google Scholar]
Derosa 2011a {published data only}
- Derosa G, Putignano P, Bossi AC, Bonaventura A, Querci F, Franzetti IG, et al. Exenatide or glimepiride added to metformin on metabolic control and on insulin resistance in type 2 diabetic patients. European Journal of Pharmacology 2011;666(1‐3):251‐6. [DOI] [PubMed] [Google Scholar]
Derosa 2011b {published data only}
- Derosa G, Cicero AF, Fogari E, D'Angelo A, Bianchi L, Maffioli P. Pioglitazone compared to glibenclamide on lipid profile and inflammation markers in type 2 diabetic patients during an oral fat load. Hormone and Metabolic Research 2011;43(7):505‐12. [DOI] [PubMed] [Google Scholar]
Filozof 2010 {published data only}
- Filozof C, Gautier JF. A comparison of efficacy and safety of vildagliptin and gliclazide in combination with metformin in patients with type 2 diabetes inadequately controlled with metformin alone: a 52‐week, randomized study. Diabetic Medicine 2010;27(3):318‐26. [DOI] [PubMed] [Google Scholar]
Gallwitz 2012a {published data only}
- Gallwitz B, Guzman J, Dotta F, Guerci B, Simó R, Basson BR, et al. Exenatide twice daily versus glimepiride for prevention of glycaemic deterioration in patients with type 2 diabetes with metformin failure (EUREXA): an open‐label, randomised controlled trial. Lancet 2012;379(9833):2270‐8. [DOI] [PubMed] [Google Scholar]
- Kazda C, Gallwitz B, Simó R, Guzmán JR, Kraus P, Nicolay C, et al. The European exenatide study of long‐term exenatide vs glimepiride for type 2 diabetes: rationale and patient characteristics. Diabetes, Obesity & Metabolism 2009;11(12):1131‐7. [DOI] [PubMed] [Google Scholar]
- NCT00359762. Exenatide versus glimepiride in patients with type 2 diabetes. clinicaltrials.gov/ct2/show/NCT00359762 (accessed 6 July 2017).
- Schernthaner G, Rosas‐Guzman J, Dotta F, Guerci B, Simo R, Festa A, et al. Treatment escalation options for patients with type 2 diabetes after failure of exenatide twice daily or glimepiride added to metformin: results from the prospective European Exenatide (EUREXA) study. Diabetes, Obesity & Metabolism 2015;17(7):689‐98. [DOI] [PubMed] [Google Scholar]
- Simo R, Guerci B, Schernthaner G, Gallwitz B, Rosas‐Guzman J, Dotta F, et al. Long‐term changes in cardiovascular risk markers during administration of exenatide twice daily or glimepiride: results from the European exenatide study. Cardiovascular Diabetology 2015;14(116):1‐13. [DOI] [PMC free article] [PubMed] [Google Scholar]
Gallwitz 2012b {published data only}
- Gallwitz B, Rosenstock J, Emser A, Eynatten M, Woerle HJ. Linagliptin is more effective than glimepiride at achieving a composite outcome of target HbA(1)c. International Journal of Clinical Practice 2013;67(4):317‐21. [DOI] [PubMed] [Google Scholar]
- Gallwitz B, Rosenstock J, Patel S, Eynatten M, Hehnke U, Mehlburger L, et al. Regardless of the degree of glycaemic control, linagliptin has lower hypoglycaemia risk than all doses of glimepiride, at all time points, over the course of a 2‐year trial. Diabetes, Obesity & Metabolism 2015;17(3):276‐84. [DOI] [PubMed] [Google Scholar]
- Gallwitz B, Rosenstock J, Rauch T, Bhattacharya S, Patel S, Eynatten M, et al. 2‐year efficacy and safety of linagliptin compared with glimepiride in patients with type 2 diabetes inadequately controlled on metformin: a randomised, double‐blind, non‐inferiority trial. Lancet 2012;380(9840):475‐83. [DOI] [PubMed] [Google Scholar]
- Johansen OE, Boehm BO, Grill V, Torjesen PA, Bhattacharya S, Patel S, et al. C‐peptide levels in latent autoimmune diabetes in adults treated with linagliptin versus glimepiride: exploratory results from a 2‐year double‐blind, randomized, controlled study. Diabetes Care 2014;37(1):e11‐2. [DOI] [PubMed] [Google Scholar]
- Johansen OE, Neubacher D, Eynatten M, Patel S, Woerle HJ. Cardiovascular safety with linagliptin in patients with type 2 diabetes mellitus: a pre‐specified, prospective, and adjudicated meta‐analysis of a phase 3 programme. Cardiovascular Diabetology 2012;11:3. [DOI] [PMC free article] [PubMed] [Google Scholar]
- NCT00622284. Efficacy and safety of BI 1356 in combination with metformin in patients with type 2 diabetes. clinicaltrials.gov/ct2/show/study/NCT00622284 (accessed 7 July 2017).
- Rosenstock J, Marx N, Neubacher D, Seck T, Patel S, Woerle HJ, et al. Cardiovascular safety of linagliptin in type 2 diabetes: a comprehensive patient‐level pooled analysis of prospectively adjudicated cardiovascular events. Cardiovascular Diabetology 2015;14:57. [DOI] [PMC free article] [PubMed] [Google Scholar]
Gerich 2005 {published data only}
- CDJN608A US07. Multicenter, randomized, double‐blind, active controlled trial to compare the efficacy and safety of 104 weeks of nateglinide plus metformin vs glyburide plus metformin in drug naive subjects with type 2 diabetes mellitus who have inadequate control with diet and exercise. www.novctrd.com/ctrdWebApp/clinicaltrialrepository/displayFile.do?trialResult=1497 (accessed 16 March 2017).
- Gerich J, Raskin P, Jean‐Louis L, Purkayastha D, Baron MA. PRESERVE‐beta: two‐year efficacy and safety of initial combination therapy with nateglinide or glyburide plus metformin. Diabetes Care 2005;28(9):2093‐9. [DOI] [PubMed] [Google Scholar]
- Schwarz SL, Gerich JE, Marcellari A, Jean‐Louis L, Purkayastha D, Baron MA. Nateglinide, alone or in combination with metformin, is effective and well tolerated in treatment‐naive elderly patients with type 2 diabetes. Diabetes, Obesity & Metabolism 2008;10(8):652‐60. [DOI] [PubMed] [Google Scholar]
Göke 2013 {published data only}
- Cook W, Minervini G, Bryzinski B, Hirshberg B. Saxagliptin efficacy and safety in patients with type 2 diabetes mellitus stratified by cardiovascular disease history and cardiovascular risk factors: analysis of 3 clinical trials. Postgraduate Medicine 2014;126(6):19‐32. [DOI] [PubMed] [Google Scholar]
- Goke B, Gallwitz B, Eriksson J, Hellqvist A, Gause‐Nilsson I. Saxagliptin is non‐inferior to glipizide in patients with type 2 diabetes mellitus inadequately controlled on metformin alone: a 52‐week randomised controlled trial. International Journal of Clinical Practice 2010;64(12):1619‐31. [DOI] [PubMed] [Google Scholar]
- Granstrom O, Bergenheim K, McEwan P, Sennfalt K, Henriksson M. Cost‐effectiveness of saxagliptin (Onglyza) in type 2 diabetes in Sweden. Primary Care Diabetes 2012;6(2):127‐36. [DOI] [PubMed] [Google Scholar]
- Göke B, Gallwitz B, Eriksson J G, Hellqvist Å, Gause‐Nilsson I. Saxagliptin vs glipizide as add‐on therapy in patients with type 2 diabetes mellitus inadequately controlled on metformin alone: long‐term (52‐week) extension of a 52‐week randomised controlled trial. International Journal of Clinical Practice 2013;67(4):307‐16. [DOI] [PubMed] [Google Scholar]
- Mintz ML, Minervini G. Saxagliptin versus glipizide as add‐on therapy to metformin: assessment of hypoglycemia. Current Medical Research & Opinion 2014;30(5):761‐70. [DOI] [PubMed] [Google Scholar]
- NCT00575588. 52‐week add‐on to metformin comparison of saxagliptin and sulphonylurea, with a 52‐week extension period. clinicaltrials.gov/ct2/show/NCT00575588 (accessed 10 July 2017).
Hamann 2008 {published data only}
- GSK Study ID AVM100264. AVANDAMET versus metformin and sulphonylurea in people with poorly controlled type 2 diabetes. gsk‐studyregister.com/study/7254 (accessed 12 July 2017).
- Hamann A, Garcia‐Puig J, Paul G, Donaldson J, Stewart M. Comparison of fixed‐dose rosiglitazone/metformin combination therapy with sulphonylurea plus metformin in overweight Individuals with type 2 diabetes inadequately controlled on metformin alone. Experimental and Clinical Endocrinology & Diabetes 2008;116(1):6‐13. [DOI] [PubMed] [Google Scholar]
- NCT00359112. AVANDAMET versus metformin and sulphonylurea in people with poorly controlled type 2 diabetes. clinicaltrials.gov/ct2/show/study/NCT00359112 (accessed 12 July 2017).
Handelsman 2017 {published data only}
- Handelsman Y, Lauring B, Gantz I, Iredale C, O'Neill EA, Wei Z, et al. A randomized, double‐blind, non‐inferiority trial evaluating the efficacy and safety of omarigliptin, a once‐weekly DPP‐4 inhibitor, or glimepiride in patients with type 2 diabetes inadequately controlled on metformin monotherapy. Current Medical Research and Opinion 2017;33(10):1861‐8. [DOI] [PubMed] [Google Scholar]
- MK‐3102‐016. Clinical study report P016. A study of the safety and efficacy of omarigliptin (MK‐3102) compared with glimepiride in participants with type 2 diabetes mellitus with inadequate glycemic control on metformin (MK‐3102‐016). merck.com/clinical‐trials/study.html?id=3102‐016&tab=access (accessed 6 March 2018).
- NCT01682759. A study of the safety and efficacy of omarigliptin (MK‐3102) compared with glimepiride in participants with type 2 diabetes mellitus with inadequate glycemic control on metformin (MK‐3102‐016). clinicaltrials.gov/ct2/show/study/NCT01682759 (accessed 6 March 2018).
Hollander 2017 {published data only}
- Hollander P, Liu J, Hill J, Johnson J, Jiang Z, Golm G, et al. Safety and efficacy of ertugliflozin compared to glimepiride in patients with type 2 diabetes inadequately controlled on metformin: the VERTIS SU trial. Diabetologia 2017;60:S19‐S20. [Google Scholar]
- Hollander P, Liu J, Hill J, Johnson J, Jiang ZW, Golm G, et al. Ertugliflozin compared with glimepiride in patients with type 2 diabetes mellitus inadequately controlled on metformin: The VERTIS SU randomized study. Diabetes Therapy 2018;9(1):193‐207. [DOI] [PMC free article] [PubMed] [Google Scholar]
- NCT01999218. Ertugliflozin vs. glimepiride in type 2 diabetes mellitus (T2DM) participants on metformin (MK‐8835‐002). clinicaltrials.gov/ct2/show/NCT01999218 (accessed 1 March 2018).
Home 2009 {published data only}
- GSK Study ID BRL‐049653/231. BRL‐049653/231‐RECORD: rosiglitazone evaluated for cardiac outcomes and regulation of glycaemia in diabetes. gsk‐studyregister.com/study/7631 (accessed 1 April 2017).
- Home PD, Jones NP, Pocock SJ, Beck‐Nielsen H, Gomis R, Hanefeld M, et al. Rosiglitazone RECORD study: glucose control outcomes at 18 months. Diabetic Medicine 2007;24(6):626‐34. [DOI] [PMC free article] [PubMed] [Google Scholar]
- Home PD, Kahn SE, Jones NP, Noronha D, Beck‐Nielsen H, Viberti G. Experience of malignancies with oral glucose‐lowering drugs in the randomised controlled ADOPT (A Diabetes Outcome Progression Trial) and RECORD (Rosiglitazone Evaluated for Cardiovascular Outcomes and Regulation of Glycaemia in Diabetes) clinical trials. Diabetologia 2010;53(9):1838‐45. [DOI] [PMC free article] [PubMed] [Google Scholar]
- Home PD, Pocock SJ, Beck‐Nielsen H, Curtis PS, Gomis R, Hanefeld M, et al. Rosiglitazone evaluated for cardiovascular outcomes in oral agent combination therapy for type 2 diabetes (RECORD): a multicentre, randomised, open‐label trial. Lancet 2009;373(9681):2125‐35. [DOI] [PubMed] [Google Scholar]
- Home PD, Pocock SJ, Beck‐Nielsen H, Gomis R, Hanefeld M, Dargie H, et al. Rosiglitazone evaluated for cardiac outcomes and regulation of glycaemia in diabetes (RECORD): study design and protocol. Diabetologia 2005;48(9):1726‐35. [DOI] [PubMed] [Google Scholar]
- Home PD, Pocock SJ, Beck‐Nielsen H, Gomis R, Hanefeld M, Jones NP, et al. Rosiglitazone evaluated for cardiovascular outcomes‐‐an interim analysis. New England Journal of Medicine 2007;357(1):28‐38. [DOI] [PubMed] [Google Scholar]
- Jones NP, Curtis PS, Home PD. Cancer and bone fractures in observational follow‐up of the RECORD study. Acta Diabetologica 2015;52(3):539‐46. [DOI] [PubMed] [Google Scholar]
- Komajda M, Curtis P, Hanefeld M, Beck‐Nielsen H, Pocock SJ, Zambanini A, et al. Effect of the addition of rosiglitazone to metformin or sulfonylureas versus metformin/sulfonylurea combination therapy on ambulatory blood pressure in people with type 2 diabetes: a randomized controlled trial (the RECORD study). Cardiovascular Diabetology 2008;7:10. [DOI] [PMC free article] [PubMed] [Google Scholar]
- Komajda M, McMurray JJ, Beck‐Nielsen H, Gomis R, Hanefeld M, Pocock SJ, et al. Heart failure events with rosiglitazone in type 2 diabetes: data from the RECORD clinical trial. European Heart Journal 2010;31(7):824‐31. [DOI] [PMC free article] [PubMed] [Google Scholar]
- Lopes RD, Dickerson S, Hafley G, Burns S, Tourt‐Uhlig S, White J, et al. Methodology of a reevaluation of cardiovascular outcomes in the RECORD trial: study design and conduct. American Heart Journal 2013;166(2):208‐16. [DOI] [PubMed] [Google Scholar]
- MacDonald MR, Petrie MC, Home PD, Komajda M, Jones NP, Beck‐Nielsen H, et al. Incidence and prevalence of unrecognized myocardial infarction in people with diabetes: a substudy of the Rosiglitazone Evaluated for Cardiac Outcomes and Regulation of Glycemia in Diabetes (RECORD) study. Diabetes Care 2011;34(6):1394‐6. [DOI] [PMC free article] [PubMed] [Google Scholar]
- Mahaffey KW, Hafley G, Dickerson S, Burns S, Tourt‐Uhlig S, White J, et al. Results of a reevaluation of cardiovascular outcomes in the RECORD trial. American Heart Journal 2013;166(2):240‐9. [DOI] [PubMed] [Google Scholar]
- NCT00379769. Rosiglitazone evaluated for cardiac outcomes and regulation of glycaemia in diabetes (RECORD). clinicaltrials.gov/ct2/show/NCT00379769 (accessed 1 April 2017).
Leiter 2015 {published data only}
- Blonde L, Stenlof K, Fung A, Xie J, Canovatchel W, Meininger G. Effects of canagliflozin on body weight and body composition in patients with type 2 diabetes over 104 weeks. Postgraduate Medicine 2016;128(4):371‐80. [DOI] [PubMed] [Google Scholar]
- Cefalu WT, Leiter LA, Yoon K‐H, Arias P, Niskanen L, Xie J, et al. Efficacy and safety of canagliflozin versus glimepiride in patients with type 2 diabetes inadequately controlled with metformin (CANTATA‐SU): 52 week results from a randomised, double‐blind, phase 3 non‐inferiority trial. Lancet 2013;382(9896):941‐50. [DOI] [PubMed] [Google Scholar]
- Desai M, Merton K, Davies MJ, Vijapurkar U, Balis D. Canagliflozin provides greater improvement in risk factors of metabolic syndrome (MetS) versus glimepiride in patients with type 2 diabetes and MetS on background metformin. Diabetologia 2016;59:S340‐1. [Google Scholar]
- Heerspink HJ, Desai M, Jardine M, Balis D, Meininger G, Perkovic V. Canagliflozin slows progression of renal function decline independently of glycemic effects. Journal of the American Society of Nephrology : JASN 2017;28(1):368‐75. [DOI] [PMC free article] [PubMed] [Google Scholar]
- John M, Cerdas S, Violante R, Deerochanawong C, Hassanein M, Slee A, et al. Efficacy and safety of canagliflozin in patients with type 2 diabetes mellitus living in hot climates. International Journal of Clinical Practice 2016;70(9):775‐85. [DOI] [PMC free article] [PubMed] [Google Scholar]
- Lavalle‐Gonzalez FJ, Eliaschewitz FG, Cerdas S, Chacon Mdel P, Tong C, Alba M. Efficacy and safety of canagliflozin in patients with type 2 diabetes mellitus from Latin America. Current Medical Research & Opinion 2016;32(3):427‐39. [DOI] [PubMed] [Google Scholar]
- Leiter LA, Langslet G, Vijapurkar U, Davies MJ, Canovatchel W. Simultaneous reduction in both HbA1c and body weight with canagliflozin versus glimepiride in patients with type 2 diabetes on metformin. Diabetes Therapy 2016;7(2):269‐78. [DOI] [PMC free article] [PubMed] [Google Scholar]
- Leiter LA, Yoon KH, Arias P, Langslet G, Xie J, Balis DA, et al. Canagliflozin provides durable glycemic improvements and body weight reduction over 104 weeks versus glimepiride in patients with type 2 diabetes on metformin: a randomized, double‐blind, phase 3 study. Diabetes Care 2015;38(3):355‐64. [DOI] [PubMed] [Google Scholar]
- NCT00968812. Canagliflozin treatment and trial analysis‐sulfonylurea (CANTATA‐SU) SGLT2 add‐on to metformin versus glimepiride. clinicaltrials.gov/ct2/show/NCT00968812 (accessed 2 February 2017).
- Nyirjesy P, Sobel JD, Fung A, Mayer C, Capuano G, Ways K, et al. Genital mycotic infections with canagliflozin, a sodium glucose co‐transporter 2 inhibitor, in patients with type 2 diabetes mellitus: a pooled analysis of clinical studies. Current Medical Research and Opinion 2014;30(6):1109‐19. [DOI] [PubMed] [Google Scholar]
- Patel CA, Bailey RA, Vijapurkar U, Meininger G, Blonde L. A post‐hoc analysis of the comparative efficacy of canagliflozin and glimepiride in the attainment of type 2 diabetes‐related quality measures. BMC Health Services Research 2016;16(1):356. [DOI] [PMC free article] [PubMed] [Google Scholar]
- Stenlof K, Blonde L, Fung A, Xie J, Canovatchel W, Meininger G. Distribution of weight loss with canagliflozin in patients with type 2 diabetes mellitus over 104 weeks. Diabetologia 2015;58:S354‐5. [Google Scholar]
- Gaal L, Garvey WT, Leiter LA, Vijapurkar U, List J, Cuddihy R, et al. Effects of canagliflozin versus glimepiride on adipokines, inflammatory biomarkers, and chemokines in patients with type 2 diabetes. Diabetologia 2017;60(Suppl. 1):S413‐414. [Google Scholar]
- Vercruysse F, Davies MJ, Merton K, Vijapurkar U, Simples J, Carroll A, et al. Achievement of glycaemic goals without hypoglycaemia with canagliflozin versus glimepiride in patients with type 2 diabetes. Diabetologia 2016;59:S339. [Google Scholar]
- Watts NB, Bilezikian JP, Usiskin K, Edwards R, Desai M, Law G, et al. Effects of canagliflozin on fracture risk in patients with type 2 diabetes mellitus. Journal of Clinical Endocrinology and Metabolism 2016;101(1):157‐66. [DOI] [PMC free article] [PubMed] [Google Scholar]
Maffioli 2013 {published data only}
- Maffioli P, Fogari E, D’Angelo A, Perrone T, Derosa G. Ultrasonography modifications of visceral and subcutaneous adipose tissue after pioglitazone or glibenclamide therapy combined with rosuvastatin in type 2 diabetic patients not well controlled by metformin. European Journal of Gastroenterology & Hepatology 2013;25(9):1113‐22. [DOI] [PubMed] [Google Scholar]
Matthews 2010 {published data only}
- Ahren B, Foley JE, Dejager S, Akacha M, Shao Q, Heimann G, et al. Higher risk of hypoglycemia with glimepiride versus vildagliptin in patients with type 2 diabetes is not driven by high doses of glimepiride: divergent patient susceptibilities?. Diabetes Therapy 2014;5(2):459‐69. [DOI] [PMC free article] [PubMed] [Google Scholar]
- Ahren B, Foley JE, Ferrannini E, Matthews DR, Zinman B, Dejager S, et al. Changes in prandial glucagon levels after a 2‐year treatment with vildagliptin or glimepiride in patients with type 2 diabetes inadequately controlled with metformin monotherapy. Diabetes Care 2010;33(4):730‐2. [DOI] [PMC free article] [PubMed] [Google Scholar]
- Ahren B, Mathieu C, Bader G, Schweizer A, Foley JE. Efficacy of vildagliptin versus sulfonylureas as add‐on therapy to metformin: comparison of results from randomised controlled and observational studies. Diabetologia 2014;57(7):1304‐7. [DOI] [PubMed] [Google Scholar]
- Bader G, Geransar P, Schweizer A. Vildagliptin more effectively achieves a composite endpoint of HbA1c < 7 % without hypoglycaemia and weight gain compared with glimepiride after 2 years of treatment. Diabetes Research and Clinical Practice 2013;100(3):e78‐81. [DOI] [PubMed] [Google Scholar]
- EudraCT 2004‐004559‐21. A multicenter, randomized, double‐blind, active controlled study to compare the long‐term effect (up to 5 years) of treatment with LAF237 50 mg bid to glimepiride up to 6 mg daily as add‐on therapy in patients with type 2 diabetes inadequately controlled with metformin monotherapy. www.clinicaltrialsregister.eu/ctr‐search/trial/2004‐004559‐21/IT (accessed 11 March 2017).
- Ferrannini E, Fonseca V, Zinman B, Matthews D, Ahrén B, Byiers S, et al. Fifty‐two‐week efficacy and safety of vildagliptin vs glimepiride in patients with type 2 diabetes mellitus inadequately controlled on metformin monotherapy. Diabetes, Obesity & Metabolism 2009;11(2):157‐66. [DOI] [PubMed] [Google Scholar]
- Matthews DR, Dejager S, Ahren B, Fonseca V, Ferrannini E, Couturier A, et al. Vildagliptin add‐on to metformin produces similar efficacy and reduced hypoglycaemic risk compared with glimepiride, with no weight gain: results from a 2‐year study. Diabetes Obesesity & Metabolism 2010;12(9):780‐9. [DOI] [PubMed] [Google Scholar]
- NCT00106340. Vildagliptin compared to glimepiride in combination with metformin in patients with type 2 diabetes. clinicaltrials.gov/ct2/show/NCT00106340 (accessed 11 March 2017).
Nauck 2013 {published data only}
- Blonde L, Russell‐Jones D. The safety and efficacy of liraglutide with or without oral antidiabetic drug therapy in type 2 diabetes: an overview of the LEAD 1‐5 studies. Diabetes, Obesity & Metabolism 2009;11 Suppl 3:26‐34. [DOI] [PubMed] [Google Scholar]
- Bode BW, Brett J, Falahati A, Pratley RE. Comparison of the efficacy and tolerability profile of liraglutide, a once‐daily human GLP‐1 analog, in patients with type 2 diabetes ≥65 and <65 years of age: a pooled analysis from phase III studies. American Journal of Geriatric Pharmacotherapy 2011;9(6):423‐33. [DOI] [PubMed] [Google Scholar]
- Buse JB, Garber A, Rosenstock J, Schmidt WE, Brett JH, Videbaek N, et al. Liraglutide treatment is associated with a low frequency and magnitude of antibody formation with no apparent impact on glycemic response or increased frequency of adverse events: results from the Liraglutide Effect and Action in Diabetes (LEAD) trials. Journal of Clinical Endocrinology and Metabolism 2011;96(6):1695‐702. [DOI] [PubMed] [Google Scholar]
- Davies MJ, Chubb BD, Smith IC, Valentine WJ. Cost‐utility analysis of liraglutide compared with sulphonylurea or sitagliptin, all as add‐on to metformin monotherapy in type 2 diabetes mellitus. Diabetic Medicine 2012;29(3):313‐20. [DOI] [PMC free article] [PubMed] [Google Scholar]
- Fonseca VA, Devries JH, Henry RR, Donsmark M, Thomsen HF, Plutzky J. Reductions in systolic blood pressure with liraglutide in patients with type 2 diabetes: insights from a patient‐level pooled analysis of six randomized clinical trials. Journal of Diabetes and its Complications 2014;28(3):399‐405. [DOI] [PMC free article] [PubMed] [Google Scholar]
- Hegedus L, Moses AC, Zdravkovic M, Thi T, Daniels GH. GLP‐1 and calcitonin concentration in humans: lack of evidence of calcitonin release from sequential screening in over 5000 subjects with type 2 diabetes or nondiabetic obese subjects treated with the human GLP‐1 analog, liraglutide. Journal of Clinical Endocrinology and Metabolism 2011;96(3):853‐60. [DOI] [PubMed] [Google Scholar]
- Henry RR, Buse JB, Sesti G, Davies MJ, Jensen KH, Brett J, et al. Efficacy of antihyperglycemic therapies and the influence of baseline hemoglobin A(1C): a meta‐analysis of the liraglutide development program. Endocrine Practice 2011;17(6):906‐13. [DOI] [PubMed] [Google Scholar]
- Hermansen K, Kolotkin RL, Hammer M, Zdravkovic M, Matthews D. Patient‐reported outcomes in patients with type 2 diabetes treated with liraglutide or glimepiride, both as add‐on to metformin. Primary Care Diabetes 2010;4(2):113‐7. [DOI] [PubMed] [Google Scholar]
- Jendle J, Nauck MA, Matthews DR, Frid A, Hermansen K, During M, et al. Weight loss with liraglutide, a once‐daily human glucagon‐like peptide‐1 analogue for type 2 diabetes treatment as monotherapy or added to metformin, is primarily as a result of a reduction in fat tissue. Diabetes, Obesity & Metabolism 2009;11(12):1163‐72. [DOI] [PubMed] [Google Scholar]
- McGill JB. Insights from the Liraglutide Clinical Development Program‐‐the liraglutide effect and action in diabetes (LEAD) studies. Postgraduate Medicine 2009;121(3):16‐25. [DOI] [PubMed] [Google Scholar]
- NCT00318461. To compare the effect of liraglutide when given together with metformin with the effect of metformin given alone and with the effect of glimepiride and metformin given together (LEAD‐2). clinicaltrials.gov/ct2/show/NCT00318461 (accessed 28 March 2017).
- Nauck M, Frid A, Hermansen K, Shah NS, Tankova T, Mitha IH, et al. Efficacy and safety comparison of liraglutide, glimepiride, and placebo, all in combination with metformin, in type 2 diabetes: the LEAD (liraglutide effect and action in diabetes)‐2 study. Diabetes Care 2009;32(1):84‐90. [DOI] [PMC free article] [PubMed] [Google Scholar]
- Nauck M, Frid A, Hermansen K, Thomsen AB, During M, Shah N, et al. Long‐term efficacy and safety comparison of liraglutide, glimepiride and placebo, all in combination with metformin in type 2 diabetes: 2‐year results from the LEAD‐2 study. Diabetes, Obesity & Metabolism 2013;15(3):204‐12. [DOI] [PubMed] [Google Scholar]
- Nauck M, Marre M. Adding liraglutide to oral antidiabetic drug monotherapy: efficacy and weight benefits. Postgraduate Medicine 2009;121(3):5‐15. [DOI] [PubMed] [Google Scholar]
- Niswender K, Pi‐Sunyer X, Buse J, Jensen KH, Toft AD, Russell‐Jones D, et al. Weight change with liraglutide and comparator therapies: an analysis of seven phase 3 trials from the liraglutide diabetes development programme. Diabetes, Obesity & Metabolism 2013;15(1):42‐54. [DOI] [PubMed] [Google Scholar]
- Roussel R, Martinez L, Vandebrouck T, Douik H, Emiel P, Guery M, et al. Evaluation of the long‐term cost‐effectiveness of liraglutide therapy for patients with type 2 diabetes in France. Journal of Medical Economics 2016;19(2):121‐34. [DOI] [PubMed] [Google Scholar]
- Troels J, Kishore S, Steinberg W. Is there a link between liraglutide and pancreatitis? A post hoc review of pooled and patient‐level data from completed liraglutide type 2 diabetes clinical trials. Diabetes Care 2015;38(6):1058‐66. [DOI] [PubMed] [Google Scholar]
- Zinman B, Schmidt WE, Moses A, Lund N, Gough S. Achieving a clinically relevant composite outcome of an HbA1c of. Diabetes, Obesity & Metabolism 2012;14(1):77‐82. [DOI] [PubMed] [Google Scholar]
NCT00367055 {published data only}
- GSK Study ID 101765. Rosiglitazone‐metformin combination versus metformin‐sulfonylurea combination on beta‐cell function in type 2 diabetes. gsk‐studyregister.com/study/2645 (accessed 28 June 2017).
- NCT00367055. Rosiglitazone‐metformin combination versus metformin‐sulfonylurea combination on beta‐cell function in type 2 diabetes. clinicaltrials.gov/ct2/show/study/NCT00367055 (accessed 28 June 2017).
Petrica 2009 {published data only}
- Petrica L, Petrica M, Vlad A, Jianu CD, Gluhovschi G, Ianculescu C, et al. Nephro‐ and neuroprotective effects of rosiglitazone versus glimepiride in normoalbuminuric patients with type 2 diabetes mellitus: a randomized controlled trial. Wiener Klinische Wochenschrift 2009;121(23‐24):765‐75. [DOI] [PubMed] [Google Scholar]
Petrica 2011 {published data only}
- Petrica L, Vlad A, Petrica M, Jianu CD, Gluhovschi G, Gadalean F, et al. Pioglitazone delays proximal tubule dysfunction and improves cerebral vessel endothelial dysfunction in normoalbuminuric people with type 2 diabetes mellitus. Diabetes Research and Clinical Practice 2011;94(1):22‐32. [DOI] [PubMed] [Google Scholar]
Ridderstråle 2014 {published data only}
- Brice R, Spencer W, Asaro‐Harris A, Zeller C, Hach T, Salsali A, et al. Analysis of empagliflozin vs glimepiride by Quality and Outcomes Framework targets: post hoc analysis of a head‐to‐head study. Diabetic Medicine 2015;32:95‐6. [Google Scholar]
- Chirila C, Zheng Q, Davenport E, Kaschinski D, Pfarr E, Hach T, et al. Treatment satisfaction in type 2 diabetes patients taking empagliflozin compared with patients taking glimepiride. Quality of Life Research 2016;25(5):1199‐207. [DOI] [PMC free article] [PubMed] [Google Scholar]
- Khunti K, Bingham‐Gardiner P, Hassan SW, Zeller C, Naderali E, Salsali A, et al. Efficacy and safety of empagliflozin compared with glimepiride in South Asian patients with type 2 diabetes in a head‐to‐head study. Diabetic Medicine 2015;32:96. [Google Scholar]
- Kohler S, Kaspers S, Salsali A, Zeller C, Woerle HJ. Effect of empagliflozin (EMPA) on bone fractures in patients with type 2 diabetes (T2DM). Diabetologia 2016;59:S26. [Google Scholar]
- NCT01167881. Efficacy and safety of empagliflozin (BI 10773) with metformin in patients with type 2 diabetes. clinicaltrials.gov/ct2/show/NCT01167881 (accessed 18 July 2017).
- Neeland IJ, McGuire DK, Eliasson B, Ridderstrale M, Zeller C, Woerle HJ, et al. Comparison of adipose distribution indices with gold standard body composition assessments in the EMPA‐REG H2H SU Trial: a body composition sub‐study. Diabetes Therapy 2015;6(4):635‐42. [DOI] [PMC free article] [PubMed] [Google Scholar]
- Ridderstrale M, Svaerd R, Zeller C, Kim G, Woerle HJ, Broedl UC. Rationale, design and baseline characteristics of a 4‐year (208‐week) phase III trial of empagliflozin, an SGLT2 inhibitor, versus glimepiride as add‐on to metformin in patients with type 2 diabetes mellitus with insufficient glycemic control. Cardiovascular Diabetology 2013;12:129. [DOI] [PMC free article] [PubMed] [Google Scholar]
- Ridderstråle M, Andersen KR, Zeller C, Kim G, Woerle HJ, Broedl UC. Comparison of empagliflozin and glimepiride as add‐on to metformin in patients with type 2 diabetes: a 104‐week randomised, active‐controlled, double‐blind, phase 3 trial. Lancet Diabetes & Endocrinology 2014;2(9):691‐700. [DOI] [PubMed] [Google Scholar]
Ristic 2007 {published data only}
- CDJN608A2308. A multicenter, double‐blind, randomized, parallel‐group study to evaluate the efficacy and safety of nateglinide and gliclazide in combination with metformin, in type 2 diabetes patients inadequately controlled on maximally tolerated doses of metformin alone. www.novctrd.com/CtrdWeb/displaypdf.nov?trialresultid=1852 (accessed 17 July 2017).
- CDJN608A2308. Six month extension to a multicenter, double‐blind, randomized, parallel‐group study to evaluate the efficacy and safety of nateglinide and gliclazide in combination with metformin, in type 2 diabetes patients inadequately controlled on maximally tolerated doses of metformin alone. www.novctrd.com/CtrdWeb/displaypdf.nov?trialresultid=1850 (accessed 17 July 2017).
- Ristic S, Collober‐Maugeais C, Cressier F, Tang P, Pecher E. Nateglinide or gliclazide in combination with metformin for treatment of patients with type 2 diabetes mellitus inadequately controlled on maximum doses of metformin alone: 1‐year trial results. Diabetes, Obesity & Metabolism 2007;9(4):506‐11. [DOI] [PubMed] [Google Scholar]
- Ristic S, Collober‐Maugeais C, Pecher E, Cressier F. Comparison of nateglinide and gliclazide in combination with metformin, for treatment of patients with type 2 diabetes mellitus inadequately controlled on maximum doses of metformin alone. Diabetic Medicine 2006;23(7):757‐62. [DOI] [PMC free article] [PubMed] [Google Scholar]
Schernthaner 2015 {published data only}
- NCT01006603. Saxagliptin compared to glimepiride in elderly type 2 diabetes patients, with inadequate glycemic control on metformin (GENERATION). clinicaltrials.gov/ct2/show/NCT01006603 (accessed 2 August 2017).
- Perl S, Cook W, Wei C, Ohman P, Hirshberg B. Effects of glimepiride versus saxagliptin on beta‐cell function and hypoglycemia: a post hoc analysis in older patients with type 2 diabetes inadequately controlled with metformin. Clinical Therapeutics 2016;38(12):2578‐88. [DOI] [PubMed] [Google Scholar]
- Perl S, Cook W, Wei C, Ohman P, Hirshberg B. Low beta‐cell function at baseline is associated with higher rates of hypoglycemia in response to treatment with glimepiride in elderly patients with type 2 diabetes inadequately controlled with metformin. Diabetes 2015;64:A319. [Google Scholar]
- Schernthaner G, Durán‐Garcia S, Hanefeld M, Langslet G, Niskanen L, Östgren CJ, et al. Efficacy and tolerability of saxagliptin compared with glimepiride in elderly patients with type 2 diabetes: a randomized, controlled study (GENERATION). Diabetes, Obesity & Metabolism 2015;17(7):630‐8. [DOI] [PubMed] [Google Scholar]
Seck 2010 {published data only}
- Krobot KJ, Ferrante SA, Davies MJ, Seck T, Meininger GE, Williams‐Herman D, et al. Lower risk of hypoglycemia with sitagliptin compared to glipizide when either is added to metformin therapy: a pre‐specified analysis adjusting for the most recently measured HbA(1c) value. Current Medical Research and Opinion 2012;28(8):1281‐7. [DOI] [PubMed] [Google Scholar]
- NCT00094770. An investigational drug study in patients with type 2 diabetes mellitus (0431‐024). clinicaltrials.gov/ct2/show/study/NCT00094770 (accessed 14 July 2017).
- Nauck MA, Meininger G, Sheng D, Terranella L, Stein PP. Efficacy and safety of the dipeptidyl peptidase‐4 inhibitor, sitagliptin, compared with the sulfonylurea, glipizide, in patients with type 2 diabetes inadequately controlled on metformin alone: a randomized, double‐blind, non‐inferiority trial. Diabetes, Obesity & Metabolism 2007;9(2):194‐205. [DOI] [PubMed] [Google Scholar]
- Ommen ES, Xu L, O'Neill EA, Goldstein BJ, Kaufman KD, Engel SS. Comparison of treatment with sitagliptin or sulfonylurea in patients with type 2 diabetes mellitus and mild renal impairment: a post hoc analysis of clinical trials. Diabetes Therapy 2015;6(1):29‐40. [DOI] [PMC free article] [PubMed] [Google Scholar]
- Seck T, Nauck M, Sheng D, Sunga S, Davies MJ, Stein PP, et al. Safety and efficacy of treatment with sitagliptin or glipizide in patients with type 2 diabetes inadequately controlled on metformin: a 2‐year study. International Journal of Clinical Practice 2010;64(5):562‐76. [DOI] [PubMed] [Google Scholar]
- Seck TL, Engel SS, Williams‐Herman DE, Sisk CM, Golm GT, Wang H, et al. Sitagliptin more effectively achieves a composite endpoint for A1C reduction, lack of hypoglycemia and no body weight gain compared with glipizide. Diabetes Research and Clinical Practice 2011;93(1):e15‐7. [DOI] [PubMed] [Google Scholar]
- Shankar RR, Xu L, Golm GT, O'Neill EA, Goldstein BJ, Kaufman KD, et al. A comparison of glycaemic effects of sitagliptin and sulfonylureas in elderly patients with type 2 diabetes mellitus. International Journal of Clinical Practice 2015;69(6):626‐31. [DOI] [PubMed] [Google Scholar]
- Williams‐Herman D, Round E, Swern AS, Musser B, Davies MJ, Stein PP, et al. Safety and tolerability of sitagliptin in patients with type 2 diabetes: a pooled analysis. BMC Endocrine Disorders 2008;8:14. [DOI] [PMC free article] [PubMed] [Google Scholar]
Vaccaro 2017 {published data only}
- Chilelli. Long‐term effect of pioglitazone vs glimepiride on lipoprotein oxidation in patients with type 2 diabetes: a prospective randomized study. Manuscript draft (accessed 19 March 2018). [DOI] [PubMed]
- NCT00700856. Thiazolidinediones or sulphonylureas and cardiovascular accidents intervention trial (TOSCA IT). clinicaltrials.gov/ct2/show/NCT00700856 (accessed 9 October 2017).
- Vaccaro O, Masulli M, Bonora E, Prato S, Giorda CB, Maggioni AP, et al. Addition of either pioglitazone or a sulfonylurea in type 2 diabetic patients inadequately controlled with metformin alone: impact on cardiovascular events. A randomized controlled trial. Nutrition, Metabolism, and Cardiovascular Diseases 2012;22(11):997‐1006. [DOI] [PubMed] [Google Scholar]
- Vaccaro O, Masulli M, Bonora E, Prato S, Nicolucci A, Rivellese AA, et al. The TOSCA.IT trial: a study designed to evaluate the effect of pioglitazone versus sulfonylureas on cardiovascular disease in type 2 diabetes. Diabetes Care 2012; Vol. 35, issue 12:e82. [PUBMED: 23173143] [DOI] [PMC free article] [PubMed]
- Vaccaro O, Masulli M, Nicolucci A, Bonora E, Prato S, Maggioni AP, et al. Effects on the incidence of cardiovascular events of the addition of pioglitazone versus sulfonylureas in patients with type 2 diabetes inadequately controlled with metformin (TOSCA.IT): a randomised, multicentre trial. Lancet Diabetes Endocrinology 2017;5(11):887‐97. [DOI] [PubMed] [Google Scholar]
References to studies excluded from this review
ACCORD 2007 {published data only}
- Buse JB, Bigger JT, Byington RP, Cooper LS, Cushman WC, Friedewald WT, et al. Action to Control Cardiovascular Risk in Diabetes (ACCORD) trial: design and methods. American Journal of Cardiology 2007;99(12a):21i‐33i. [DOI] [PubMed] [Google Scholar]
- NCT00000620. Action to control cardiovascular risk in diabetes (ACCORD). clinicaltrials.gov/ct2/show/NCT00000620 (accessed 3 March 2018).
Alsharidah 2018 {published data only}
- Alsharidah M, Algeffari M, Abdel‐Moneim AH, Lutfi MF, Alshelowi H. Effect of combined gliclazide/metformin treatment on oxidative stress, lipid profile, and hepatorenal functions in type 2 diabetic patients. Saudi Pharmaceutical Journal 2018;26(1):1‐6. [DOI] [PMC free article] [PubMed] [Google Scholar]
Araki 2015 {published data only}
- Araki E, Tanizawa Y, Tanaka Y, Taniguchi A, Koiwai K, Kim G, et al. Long‐term treatment with empagliflozin as add‐on to oral antidiabetes therapy in Japanese patients with type 2 diabetes mellitus. Diabetes, Obesity & Metabolism 2015;17(7):665‐74. [DOI] [PubMed] [Google Scholar]
- NCT01368081. Empagliflozin (BI 10773) comprehensive add‐on study in Japanese subjects with type 2 diabetes mellitus. clinicaltrials.gov/ct2/show/NCT01368081 (accessed 3 March 2018).
Bermudez‐Pirela 2007 {published data only}
- Bermudez‐Pirela VJ, Cano C, Medina MT, Souki A, Lemus MA, Leal EM, et al. Metformin plus low‐dose glimeperide significantly improves Homeostasis Model Assessment for insulin resistance (HOMA(IR)) and beta‐cell function (HOMA(beta‐cell)) without hyperinsulinemia in patients with type 2 diabetes mellitus. American Journal of Therapeutics 2007;14(2):194‐202. [DOI] [PubMed] [Google Scholar]
Berndt‐Zipfel 2013 {published data only}
- Berndt‐Zipfel C, Michelson G, Dworak M, Mitry M, Loffler A, Pfutzner A, et al. Vildagliptin in addition to metformin improves retinal blood flow and erythrocyte deformability in patients with type 2 diabetes mellitus ‐ results from an exploratory study. Cardiovascular Diabetology 2013;12:59. [DOI] [PMC free article] [PubMed] [Google Scholar]
- NCT01565096. Effect of adding vildagliptin on beta cell function and cardiovascular risk markers in patients with moderate metabolic control during metformin monotherapy. clinicaltrials.gov/ct2/show/NCT01565096 (accessed 3 March 2018).
Bode 2013 {published data only}
- Bode B, Stenlof K, Sullivan D, Fung A, Usiskin K. Efficacy and safety of canagliflozin treatment in older subjects with type 2 diabetes mellitus: a randomized trial. Hospital Practice (1995) 2013;41(2):72‐84. [DOI] [PubMed] [Google Scholar]
- NCT01106651. A safety and efficacy study of canagliflozin in older patients (55 to 80 years of age) with type 2 diabetes mellitus. clinicaltrials.gov/ct2/show/NCT01106651 (accessed 3 March 2018).
Bruce 2006 {published data only}
- Bruce S, Park JS, Fiedorek FT, Howlett HC. Beta‐cell response to metformin‐glibenclamide combination tablets (Glucovance) in patients with type 2 diabetes. International Journal of Clinical Practice 2006;60(7):783‐90. [DOI] [PubMed] [Google Scholar]
- NCT00035568. A research study to assess the mechanism by which glucovance, metformin, and glyburide work to control glucose levels In patients with type 2 diabetes. clinicaltrials.gov/ct2/show/NCT00035568 (accessed 3 March 2018).
Charbonnel 2006 {published data only}
- Charbonnel B, Karasik A, Liu J, Wu M, Meininger G. Efficacy and safety of the dipeptidyl peptidase‐4 inhibitor sitagliptin added to ongoing metformin therapy in patients with type 2 diabetes inadequately controlled with metformin alone. Diabetes Care 2006;29(12):2638‐43. [DOI] [PubMed] [Google Scholar]
- NCT00086515. Metformin add‐on study in patients with type 2 diabetes mellitus (0431‐020)(COMPLETED). clinicaltrials.gov/ct2/show/NCT00086515 (accessed 3 March 2018).
Cryer 2005 {published data only}
- Cryer DR, Nicholas SP, Henry DH, Mills DJ, Stadel BV. Comparative outcomes study of metformin intervention versus conventional approach the COSMIC Approach Study. Diabetes Care 2005;28(3):539‐43. [DOI] [PubMed] [Google Scholar]
CTRI/2013/02/003417 {published data only}
- CTRI/2013/02/003417. Restudy of the PURSE HIS Population for the prevalence of risk factors causing blood vessel damage to heart muscle, brain tissue or peripheral tissue and to give advice on diet, exercise and if necessary small dose of drug to prevent conversion of pre‐diabetes to diabetes. www.ctri.nic.in/Clinicaltrials/pdf_generate.php?trialid=6005&EncHid=&modid=&compid=%27,%276005det%27 (accessed 9 March 2018).
Derosa 2015 {published data only}
- Derosa G, D'Angelo A, Maffioli P. Sitagliptin in type 2 diabetes mellitus: efficacy after five years of therapy. Pharmacological Research 2015;100:127‐34. [DOI] [PubMed] [Google Scholar]
EUCTR2004‐002549‐11‐FI {published data only}
- Eudract: 2004‐002549‐11. An open, multi‐centre and long‐term extension study to evaluate the safety and tolerability of oral tesaglitazar therapy in patients with type 2 diabetes ‐ GALLEX 1. www.clinicaltrialsregister.eu/ctr‐search/search?query=eudract_number:2004‐002549‐11 (accessed 3 March 2018).
EUCTR2006‐001240‐30‐BE {published data only}
- Eudract: 2006‐001240‐30. Long term double blind comparison of gliclazide MR (30 to 120 mg daily per os) and rosiglitazone (4 to 8 mg daily per os) given in combination with metformin in type 2 diabetic patients. A 2‐year international, multicentre, randomised, double‐blind, parallel‐group study followed by a 2‐year double blind extension ‐ ENDORSE. www.clinicaltrialsregister.eu/ctr‐search/search?query=eudract_number:2006‐001240‐30 (accessed 3 March 2018).
EUCTR2009‐014727‐23‐IT {published data only}
- Eudract: 2009‐014727‐23. Multi‐center, randomized, open‐label, two‐parallel arm, intervention trial comparing DPP‐IV inhibitor vildagliptin with glibenclamide (glyburide) in achieving and maintaining good blood glucose control in type 2 diabetic patients in treatment failure with metformin alone ‐ Long‐term clinical effectiveness of DPP‐IV inhibitors. www.clinicaltrialsregister.eu/ctr‐search/search?query=eudract_number:2009‐014727‐23 (accessed 3 March 2018).
EUCTR2009‐017524‐36‐HU {published data only}
- Eudract: 2009‐017524‐36. A phase III, multicenter, double‐blind, active‐controlled, 52‐week extension study to evaluate the safety and efficacy of dutogliptin in patients with type 2 diabetes mellitus receiving background treatment with glimepiride alone or in combination with metformin or with pioglitazone alone. www.clinicaltrialsregister.eu/ctr‐search/search?query=eudract_number:2009‐017524‐36 (accessed 3 March 2018).
Gregorio 1989 {published data only}
- Gregorio F, Ambrosi F, Angelici F, Cristallini S, Dini FL, Vespasiani G, et al. Body mass index, blood lactate and therapeutic effectiveness of metformin in type II diabetes mellitus. Medicina (Florence, Italy) 1989;9(2):200‐4. [PubMed] [Google Scholar]
Haering 2015 {published data only}
- Haering HU, Merker L, Christiansen AV, Roux F, Salsali A, Kim G, et al. Empagliflozin as add‐on to metformin plus sulphonylurea in patients with type 2 diabetes. Diabetes Research and Clinical Practice 2015;110(1):82‐90. [DOI] [PubMed] [Google Scholar]
- NCT01289990. Safety and efficacy of empagliflozin (BI 10773) and sitagliptin versus placebo over 76 weeks in patients with type 2 diabetes. clinicaltrials.gov/ct2/show/NCT01289990 (accessed 3 March 2018).
- Roden M, Merker L, Christiansen AV, Roux F, Salsali A, Kim G, et al. Safety, tolerability and effects on cardiometabolic risk factors of empagliflozin monotherapy in drug‐naive patients with type 2 diabetes: a double‐blind extension of a phase III randomized controlled trial. Cardiovascular Diabetology 2015;14:154. [DOI] [PMC free article] [PubMed] [Google Scholar]
Hassanein 2014 {published data only}
- Hassanein M, Abdallah K, Schweizer A. A double‐blind, randomized trial, including frequent patient‐physician contacts and Ramadan‐focused advice, assessing vildagliptin and gliclazide in patients with type 2 diabetes fasting during Ramadan: the STEADFAST study. Vascular Health and Risk Management 2014;10:319‐26. [DOI] [PMC free article] [PubMed] [Google Scholar]
Heller 2018 {published data only}
- Heller SR, Pratley RE, Sinclair A, Festa A, Kiljanski J, Brusko CS, et al. Glycaemic outcomes of an individualized treatment approach for older vulnerable patients: a randomized, controlled study in type 2 diabetes mellitus (IMPERIUM). Diabetes, Obesity & Metabolism 2018;20(1):148‐56. [DOI] [PMC free article] [PubMed] [Google Scholar]
- NCT02072096. A comparison of two treatment strategies in older participants with type 2 diabetes mellitus (T2DM) (IMPERIUM). clinicaltrials.gov/ct2/show/NCT02072096 (accessed 3 March 2018).
Hermann 2001 {published data only}
- Hermann LS, Kalen J, Katzman P, Lager I, Nilsson A, Norrhamn O, et al. Long‐term glycaemic improvement after addition of metformin to insulin in insulin‐treated obese type 2 diabetes patients. Diabetes, Obesity & Metabolism 2001;3(6):428‐34. [DOI] [PubMed] [Google Scholar]
Inagaki 2013 {published data only}
- Inagaki N, Watada H, Murai M, Kagimura T, Gong Y, Patel S, et al. Linagliptin provides effective, well‐tolerated add‐on therapy to pre‐existing oral antidiabetic therapy over 1 year in Japanese patients with type 2 diabetes. Diabetes, Obesity & Metabolism 2013;15(9):833‐43. [DOI] [PubMed] [Google Scholar]
- NCT01204294. Comprehensive add on study in Japan. clinicaltrials.gov/ct2/show/NCT01204294 (accessed 3 March 2018).
Iqbal 2014 {published data only}
- Iqbal N, Allen E, Ohman P. Long‐term safety and tolerability of saxagliptin add‐on therapy in older patients (aged >/= 65 years) with type 2 diabetes. Clinical Interventions in Aging 2014;9:1479‐87. [DOI] [PMC free article] [PubMed] [Google Scholar]
ISRCTN19750520 {published data only}
- ISRCTN19750520. Reduced urine albumin excretion in community based collaborative care in elderly Chinese with type 2 diabetes. www.isrctn.com/ISRCTN19750520 (accessed 9 March 2018).
ISRCTN41840459 {published data only}
- ISRCTN41840459. A study to assess the release profiles from fixed combination tablets (gliclazide MR/metformin). www.isrctn.com/ISRCTN41840459 (accessed 3 March 2018).
Jackson 1987 {published data only}
- Jackson RA, Hawa MI, Jaspan JB, Sim BM, Disilvio L, Featherbe D, et al. Mechanism of metformin action in non‐insulin‐dependent diabetes. Diabetes 1987;36(5):632‐40. [DOI] [PubMed] [Google Scholar]
Javaid 2007 {published data only}
- Javaid A, Hasan R, Zaib A, Mansoor S. A comparative study of the effects of hypoglycemic agents on serum electrolytes in the diabetic patients. Pakistan Journal of Pharmaceutical Sciences 2007;20(1):67‐71. [PubMed] [Google Scholar]
Johansen 2007 {published data only}
- Johansen OE, Gullestad L, Blaasaas KG, Orvik E, Birkeland KI. Effects of structured hospital‐based care compared with standard care for type 2 diabetes‐The Asker and Baerum Cardiovascular Diabetes Study, a randomized trial. Diabetic Medicine 2007;24(9):1019‐27. [DOI] [PubMed] [Google Scholar]
- NCT00133718. A 2 year trial of patients with type 2 diabetes focusing on cardiovascular diagnostics and metabolic control. clinicaltrials.gov/ct2/show/NCT00133718?term=NCT00133718&rank=1 (accessed 3 March 2018).
JPRN‐UMIN000005327 {published data only}
- JPRN‐UMIN000005327. Comparisons of oral agents to standardize treatment for diabetes in Japan. upload.umin.ac.jp/cgi‐open‐bin/ctr_e/ctr_view.cgi?recptno=R000006064 (accessed 3 March 2018).
Kala 2017 {published data only}
- Kala 2017. A comparative study of efficacy and safety among metformin with sitagliptin, metformin with voglibose, and metformin with glimepiride in patients with type 2 diabetes mellitus. Asian Journal of Pharmaceutical and Clinical Research 2017;Vol 10(Issue 12):313‐16. [Google Scholar]
Malha 2014 {published data only}
- Malha LP, Taan G, Zantout MS, Azar ST. Glycemic effects of vildagliptin in patients with type 2 diabetes before, during and after the period of fasting in Ramadan. Therapeutic Advances in Endocrinology and Metabolism 2014;5(1):3‐9. [DOI] [PMC free article] [PubMed] [Google Scholar]
Marre 2002 {published data only}
- Marre M, Howlett H, Lehert P, Allavoine T. Improved glycaemic control with metformin‐glibenclamide combined tablet therapy (Glucovance) in type 2 diabetic patients inadequately controlled on metformin. Diabetic Medicine 2002;19(8):673‐80. [DOI] [PubMed] [Google Scholar]
Meneghini 2010 {published data only}
- Meneghini LF, Traylor L, Schwartz SL. Improved glycemic control with insulin glargine versus pioglitazone as add‐on therapy to sulfonylurea or metformin in patients with uncontrolled type 2 diabetes mellitus. Endocrine Practice 2010;16(4):588‐99. [DOI] [PubMed] [Google Scholar]
Moon 2014 {published data only}
- Moon JS, Ha KS, Yoon JS, Lee HW, Lee HC, Won KC. The effect of glargine versus glimepiride on pancreatic beta‐cell function in patients with type 2 diabetes uncontrolled on metformin monotherapy: open‐label, randomized, controlled study. Acta Diabetologica 2014;51(2):277‐85. [DOI] [PubMed] [Google Scholar]
- NCT00562172. Insulin glargine (lantus) vs sulfonylurea (SU) for BETA cell function (BETA study). clinicaltrials.gov/ct2/show/NCT00562172 (accessed 3 March 2018).
Morikawa 2011 {published data only}
- Morikawa A, Ishizeki K, Iwashima Y, Yokoyama H, Muto E, Oshima E, et al. Pioglitazone reduces urinary albumin excretion in renin‐angiotensin system inhibitor‐treated type 2 diabetic patients with hypertension and microalbuminuria: the APRIME study. Clinical and Experimental Nephrology 2011;15(6):848‐53. [DOI] [PubMed] [Google Scholar]
Nauck 2006 {published data only}
- NCT01511172. Effect of liraglutide as add‐on to metformin compared to either liraglutide or metformin alone, or to a combination of metformin and a SU (sulphonylurea) agent in subjects with type 2 diabetes. clinicaltrials.gov/ct2/show/NCT01511172 (accessed 3 March 2018).
- Nauck MA, Hompesch M, Filipczak R, Le TD, Zdravkovic M, Gumprecht J. Five weeks of treatment with the GLP‐1 analogue liraglutide improves glycaemic control and lowers body weight in subjects with type 2 diabetes. Experimental and Clinical Endocrinology & Diabetes 2006;114(8):417‐23. [DOI] [PubMed] [Google Scholar]
NCT00269061 {published data only}
- NCT00269061. An exploratory MRI study in type 2 diabetic subjects: a randomized, double‐blinded, placebo‐controlled trial to evaluate the measurement of fluid volumes by MRI in the lower extremities of subjects receiving pioglitazone. clinicaltrials.gov/ct2/show/NCT00269061 (accessed 3 March 2018).
NCT00449605 {published data only}
- NCT00449605. A glycemic control evaluation of glimepiride versus rimonabant on top of metformin in type 2 diabetes (ALLEGRO). clinicaltrials.gov/ct2/show/NCT00449605?term=NCT00449605&rank=1 (accessed 3 March 2018).
NCT00518882 {published data only}
- NCT00518882. Effect of liraglutide or exenatide added to an ongoing treatment on blood glucose control in subjects with type 2 diabetes (LEAD‐6). clinicaltrials.gov/ct2/show/NCT00518882 (accessed 9 March 2018).
NCT00543751 {published data only}
- NCT00543751. Placebo controlled metformin and sulfonylurea combination study in patients with type 2 diabetes (0767‐025). clinicaltrials.gov/ct2/show/NCT00543751 (accessed 9 March 2018).
NCT00839527 {published data only}
- NCT00839527. A randomized, double‐blind, placebo and active‐controlled, parallel‐group, multicenter study to determine the efficacy and safety of albiglutide administered in combination with metformin and glimepiride compared with metformin plus glimepiride and placebo and with metformin plus glimepiride and pioglitazone in subjects with type 2 diabetes mellitus. clinicaltrials.gov/ct2/show/NCT00839527 (accessed 3 March 2018).
NCT00909597 {published data only}
- NCT00909597. A study of taspoglutide versus pioglitazone in patients with type 2 diabetes. clinicaltrials.gov/ct2/show/NCT00909597 (accessed 3 March 2018).
NCT00947557 {published data only}
- NCT00947557. A phase III, randomized, double‐blind, placebo‐controlled, multicenter study to evaluate the safety and efficacy of dutogliptin in patients with type 2 diabetes mellitus on background treatment with glimepiride with or without metformin. clinicaltrials.gov/ct2/show/NCT00947557 (accessed 9 March 2018).
NCT01087567 {published data only}
- NCT01087567. INSPIRE diabetes study: basal bolus insulin as primary treatment of type 2 diabetes. clinicaltrials.gov/ct2/show/NCT01087567 (accessed 9 March 2018).
NCT01106625 {published data only}
- NCT01106625. The CANTATA‐MSU Trial (canagliflozin treatment and trial analysis ‐ metformin and sulphonylurea). clinicaltrials.gov/ct2/show/NCT01106625 (accessed 3 March 2018).
NCT01426737 {published data only}
- NCT01426737. The Swiss glucose variability study. clinicaltrials.gov/ct2/show/NCT01426737 (accessed 26 June 2017).
NCT01455883 {published data only}
- NCT01455883. A study to evaluate ITCA 650 compared to glimepiride for the treatment of type 2 diabetes. clinicaltrials.gov/ct2/show/NCT01455883 (accessed 3 March 2018).
NCT01481116 {published data only}
- NCT01481116. Efficacy and safety of TAK‐875 compared to glimepiride when used with metformin in participants with type 2 diabetes. clinicaltrials.gov/ct2/show/results/NCT01481116 (accessed 26 June 2017).
NCT01593137 {published data only}
- NCT01593137. A long‐term, randomized, open‐labeled, parallel‐group trial to compare the effects of liraglutide and sulphonylurea (glimepiride) both in combination with metformin on clinical, endothelial and image markers of cardiovascular risk in patients with type 2 diabetes. clinicaltrials.gov/ct2/show/NCT01593137 (accessed 3 March 2018).
NCT02244164 {published data only}
- NCT02244164. Pathophysiological study of the increase in pancreatic volume in type 2 diabetes treatments. clinicaltrials.gov/ct2/show/NCT02244164 (accessed 3 March 2018).
NCT02462369 {published data only}
- NCT02462369. Saxagliptin's effects on microalbuminuria improvement in type 2 diabetic patients. clinicaltrials.gov/ct2/show/NCT02462369 (accessed 28 February 2018).
NCT02587741 {published data only}
- NCT02587741. Comparison of diabetes retinopathy among type 2 diabetic patients treated with different regimens (CORRECT). clinicaltrials.gov/ct2/show/NCT02587741 (accessed 3 March 2018).
NCT02616666 {published data only}
- NCT02616666. A pragmatic trial to evaluate the comparative effectiveness between dapagliflozin and standard of care in type 2 diabetes patients (DECIDE Study). clinicaltrials.gov/ct2/show/NCT02616666 (accessed 9 March 2018).
NCT03060980 {published data only}
- NCT03060980. Comparison of efficacy, safety, and tolerability of ITCA 650 to empagliflozin and glimepiride as add‐on metformin. clinicaltrials.gov/ct2/show/NCT03060980 (accessed 9 March 2018).
Onuchin 2010 {published data only}
- Onuchin SG, Elsukova OS, Solov'ev OV, Onuchina EL. Capabilities of hypoglycemic therapy in women with decompensated type 2 diabetes mellitus. Terapevticheskii Arkhiv 2010;82(8):34‐41. [PubMed] [Google Scholar]
Rosenstock 2006 {published data only}
- Rosenstock J, Sugimoto D, Strange P, Stewart JA, Soltes‐Rak E, Dailey G. Triple therapy in type 2 diabetes: insulin glargine or rosiglitazone added to combination therapy of sulfonylurea plus metformin in insulin‐naive patients. Diabetes Care 2006;29(3):554‐9. [DOI] [PubMed] [Google Scholar]
Rosenstock 2018 {published data only}
- NCT02033889. A study to evaluate the efficacy and safety of ertugliflozin in participants with type 2 diabetes mellitus and inadequate glycemic control on metformin monotherapy (MK‐8835‐007). clinicaltrials.gov/ct2/show/NCT02033889 (accessed 28 February 2018).
- Rosenstock J, Frias J, Pall D, Charbonnel B, Pascu R, Saur D, et al. Effect of ertugliflozin on glucose control, body weight, blood pressure and bone density in type 2 diabetes mellitus inadequately controlled on metformin monotherapy (VERTIS MET). Diabetes, Obesity & Metabolism 2018;20(3):520‐9. [DOI] [PubMed] [Google Scholar]
Rubin 2008 {published data only}
- NCT00095030. Study comparing muraglitazar with glimepiride in type 2 diabetics who are not controlled with metformin alone. clinicaltrials.gov/ct2/show/NCT00095030 (accessed 26 June 2017).
- Rubin CJ, Ledeine JM, Fiedorek FT. Improvement of glycaemic and lipid profiles with muraglitazar plus metformin in patients with type 2 diabetes: an active‐control trial with glimepiride. Diabetes & Vascular Disease Research 2008;5(3):168‐76. [DOI] [PubMed] [Google Scholar]
Shankar 2017 {published data only}
- NCT01755156. A study to evaluate the safety, tolerability, and efficacy of the addition of omarigliptin (MK‐3102) to participants with type 2 diabetes mellitus who have inadequate glycemic control on metformin therapy (MK‐3102‐024). clinicaltrials.gov/ct2/show/NCT01755156 (accessed 28 February 2018).
- Shankar RR, Inzucchi SE, Scarabello V, Gantz I, Kaufman KD, Lai E, et al. A randomized clinical trial evaluating the efficacy and safety of the once‐weekly dipeptidyl peptidase‐4 inhibitor omarigliptin in patients with type 2 diabetes inadequately controlled on metformin monotherapy. Current Medical Research and Opinion 2017;33(10):1853‐60. [DOI] [PubMed] [Google Scholar]
Tolman 2009 {published data only}
- NCT00494312. Safety study of pioglitazone compared to glyburide on liver function. clinicaltrials.gov/ct2/show/NCT00494312?term=NCT00494312&rank=1 (accessed 3 March 2018).
- Tolman KG, Freston JW, Kupfer S, Perez A. Liver safety in patients with type 2 diabetes treated with pioglitazone: results from a 3‐year, randomized, comparator‐controlled study in the US. Drug Safety 2009;32(9):787‐800. [DOI] [PubMed] [Google Scholar]
UKPDS 1998 {published data only}
- ISRCTN75451837. UK prospective diabetes study ‐ post study monitoring (PSM) and cohort follow‐up (CFU). www.isrctn.com/ISRCTN75451837 (accessed 9 March 2018).
- UK Prospective Diabetes Study (UKPDS) Group. Intensive blood‐glucose control with sulphonylureas or insulin compared with conventional treatment and risk of complications in patients with type 2 diabetes (UKPDS 33). Lancet 1998;352(9131):837‐53. [PubMed] [Google Scholar]
Weissman 2014 {published data only}
- Weissman PN, Carr MC, Ye J, Cirkel DT, Stewart M, Perry C, et al. HARMONY 4: randomised clinical trial comparing once‐weekly albiglutide and insulin glargine in patients with type 2 diabetes inadequately controlled with metformin with or without sulfonylurea. Diabetologia 2014;57(12):2475‐84. [DOI] [PubMed] [Google Scholar]
Yki‐Järvinen 1999 {published data only}
- Yki‐Järvinen H, Ryysy L, Nikkilä K, Tulokas T, Vanamo R, Heikkilä M. Comparison of bedtime insulin regimens in patients with type 2 diabetes mellitus. A randomized, controlled trial. Annals of Internal Medicine 1999;130(5):389‐96. [DOI] [PubMed] [Google Scholar]
References to studies awaiting assessment
Müller‐Wieland 2018 {published data only}
- Müller‐Wieland D, Kellerer M, Cypryk K, Skripova D, Rohwedder K, Johnsson E, et al. Efficacy and safety of dapagliflozin or dapagliflozin plus saxagliptin versus glimepiride as add‐on to metformin in patients with type 2 diabetes. Diabetes, Obesity & Metabolism 2018;20(11):2598‐607. [DOI] [PMC free article] [PubMed] [Google Scholar]
- NCT02471404. Efficacy and safety of dapagliflozin and dapagliflozin plus saxagliptin in combination with metformin in type 2 diabetes patients compared with sulphonylurea. clinicaltrials.gov/ct2/show/NCT02471404 (accessed 28 February 2018).
NCT02564926 {published data only}
- NCT02564926. Foxiga Korea local phase 4 study (BEYOND). clinicaltrials.gov/ct2/show/NCT02564926 (accessed 28 February 2018).
References to ongoing studies
EUCTR2011‐003335‐63‐IT {published data only}
- EUCTR2011‐003335‐63‐IT. Effects of liraglutide on ß‐cell function in type 2 diabetic patients with secondary failure to oral hypoglycemic agents. A randomized, controlled, parallel groups, open‐label, phase II study. apps.who.int/trialsearch/Trial2.aspx?TrialID=EUCTR2011‐003335‐63‐IT (accessed 28 February 2018).
EUCTR2012‐000152‐34‐IT {published data only}
- EUCTR2012‐000152‐34‐IT. Evaluation of the effect of treatment with DPP‐4 inhibitor on endothelial function versus sulphonylurea on markers of oxidative stress and inflammation and platelet function in patients with diabetes mellitus type 2 in primary failure with metformin and with HbA1c values below 8, 5%. apps.who.int/trialsearch/Trial2.aspx?TrialID=EUCTR2012‐000152‐34‐IT (accessed 28 February 2018).
JPRN‐UMIN000008815 {published data only}
- JPRN‐UMIN000008815. The effect of DPP‐4 inhibitor on pancreatic beta cell function and renal function in type 2 diabetic patients. upload.umin.ac.jp/cgi‐open‐bin/ctr_e/ctr_view.cgi?recptno=R000010271 (accessed 28 February 2018).
NCT01243424 {published data only}
- Marx N, Rosenstock J, Kahn SE, Zinman B, Kastelein JJ, Lachin JM, et al. Design and baseline characteristics of the cardiovascular outcome trial of linagliptin versus glimepiride in type 2 diabetes (CAROLINA(R)). Diabetes & Vascular Disease Research 2015;12(3):164‐74. [DOI] [PMC free article] [PubMed] [Google Scholar]
- NCT01243424. CAROLINA: Cardiovascular outcome study of linagliptin versus glimepiride in patients with type 2 diabetes. clinicaltrials.gov/ct2/show/NCT01243424 (accessed 28 February 2018).
NCT01794143 {published data only}
- NCT01794143. A comparative effectiveness study of major glycemia‐lowering medications for treatment of type 2 diabetes (GRADE). clinicaltrials.gov/ct2/show/NCT01794143 (accessed 28 February 2018).
- Nathan DM, Buse JB, Kahn SE, Krause‐Steinrauf H, Larkin ME, Staten M, et al. Rationale and design of the glycemia reduction approaches in diabetes: a comparative effectiveness study (GRADE). Diabetes Care 2013;36(8):2254‐61. [DOI] [PMC free article] [PubMed] [Google Scholar]
NCT02142309 {published data only}
- NCT02142309. Glycemic durability after metformin failure (AMAZING). clinicaltrials.gov/ct2/show/NCT02142309 (accessed 28 February 2018).
NCT02730377 {published data only}
- NCT02730377. Efficacy in controlling glycaemia with Victoza® (liraglutide) as add‐on to metformin vs. OAD's as add‐on to metformin after up to 104 weeks of treatment in subjects with type 2 diabetes (LIRA‐PRIME). clinicaltrials.gov/ct2/show/NCT02730377 (accessed 28 February 2018).
NCT02769481 {published data only}
- NCT02769481. Safety and efficacy of bexagliflozin compared to glimepiride as add‐on therapy to metformin in type 2 diabetes subjects. clinicaltrials.gov/ct2/show/NCT02769481 (accessed 28 February 2018).
NCT03332771 {published data only}
- NCT03332771. Efficacy and safety of sotagliflozin versus glimepiride and placebo in subjects with type 2 diabetes mellitus that are taking metformin monotherapy (SOTA‐GLIM). clinicaltrials.gov/ct2/show/NCT03332771 (accessed 9 March 2018).
Additional references
ADA 2003
- Expert Committee on the Diagnosis and Classification of Diabetes Mellitus. Report of the expert committee on the diagnosis and classification of diabetes mellitus. Diabetes Care 2003;26(Suppl 1):S5‐20. [DOI] [PubMed] [Google Scholar]
ADA 2008
- American Diabetes Association. Standards of medical care in diabetes ‐ 2008. Diabetes Care 2008;31(Suppl 1):S12‐54. [PUBMED: 18165335] [DOI] [PubMed] [Google Scholar]
ADA 2016
- American Diabetes Association. 7. Approaches to glycemic treatment. Diabetes Care 2016;39(Suppl 1):S52‐9. [PUBMED: 26696682] [DOI] [PubMed] [Google Scholar]
ADA 2019
- American Diabetes Association. Standards of medical care in diabetes ‐ 2019. care.diabetesjournals.org/content/diacare/suppl/2018/12/17/42.Supplement_1.DC1/DC_42_S1_Combined_FINAL.pdf (accessed 16 February 2019).
ADOPT 2006
- Kahn SE, Haffner SM, Heise MA, Herman WH, Holman RR, Jones NP, et al. Glycemic durability of rosiglitazone, metformin, or glyburide monotherapy. New England Journal of Medicine 2006;355(23):2427‐43. [PUBMED: 17145742] [DOI] [PubMed] [Google Scholar]
Albarran 2013
- Albarran OG, Ampudia‐Blasco FJ. Dapagliflozin, the first SGLT‐2 inhibitor in the treatment of type 2 diabetes. Medicina Clinica 2013;141 Suppl 2:36‐43. [DOI] [PubMed] [Google Scholar]
Almdal 2004
- Almdal T, Scharling H, Jensen JS, Vestergaard H. The independent effect of type 2 diabetes mellitus on ischemic heart disease, stroke, and death: a population‐based study of 13,000 men and women with 20 years of follow‐up. Archives of Internal Medicine 2004;164(13):1422‐6. [PUBMED: 15249351] [DOI] [PubMed] [Google Scholar]
Altman 2003
- Altman DG, Bland JM. Interaction revisited: the difference between two estimates. BMJ 2003;326(7382):219. [PUBMED: 12543843] [DOI] [PMC free article] [PubMed] [Google Scholar]
Alvares 2015
- Alvares J, Araujo VE, Izidoro JB, Diniz LM, Nascimento RC, Silva MR, et al. Efficacy and safety of antidiabetic drugs available on Brazilian public health system (Sus) ‐ regular insulin, NPH insulin, metformin, glibenclamide and gliclazide ‐ In treatment of type 2 diabetes (T2DM) ‐ systematic review and meta‐analysis. Value in Health 2015;18(7):A862. [Google Scholar]
Amate 2015
- Amate JM, Lopez‐Cuadrado T, Almendro N, Bouza C, Saz‐Parkinson Z, Rivas‐Ruiz R, et al. Effectiveness and safety of glimepiride and iDPP4, associated with metformin in second line pharmacotherapy of type 2 diabetes mellitus: systematic review and meta‐analysis. International Journal of Clinical Practice 2015;69(3):292‐304. [DOI] [PMC free article] [PubMed] [Google Scholar]
Andersen 2016
- Andersen SE, Christensen M. Hypoglycaemia when adding sulphonylurea to metformin: a systematic review and network meta‐analysis. British Journal of Clinical Pharmacology 2016;82(5):1291‐302. [DOI] [PMC free article] [PubMed] [Google Scholar]
Aylsworth 2014
- Aylsworth A, Dean Z, VanNorman C, Nkemdirim Okere A. Dapagliflozin for the treatment of type 2 diabetes mellitus. Annals of Pharmacotherapy 2014;48(9):1202‐8. [DOI] [PubMed] [Google Scholar]
Bailey 1996
- Bailey CJ, Turner RC. Metformin. New England Journal of Medicine 1996;334(9):574‐9. [PUBMED: 8569826] [DOI] [PubMed] [Google Scholar]
Bell 2013
- Bell ML, McKenzie JE. Designing psycho‐oncology randomised trials and cluster randomised trials: variance components and intra‐cluster correlation of commonly used psychosocial measures. Psycho‐oncology 2013;22:1738‐47. [DOI] [PubMed] [Google Scholar]
Bellary 2011
- Bellary S. For type 2 diabetes poorly controlled by metformin monotherapy, the addition of any non‐insulin antidiabetic drug reduces HbA1c to a similar extent, but with differing effects on weight and hypoglycaemic risk. Evidence‐based Medicine 2011;16(2):39‐40. [DOI] [PubMed] [Google Scholar]
Belsey 2008
- Belsey J, Krishnarajah G. Glycaemic control and adverse events in patients with type 2 diabetes treated with metformin + sulphonylurea: a meta‐analysis. Diabetes, Obesity & Metabolism 2008;10 Suppl 1:1‐7. [DOI] [PubMed] [Google Scholar]
Boutron 2014
- Boutron I, Altman DG, Hopewell S, Vera‐Badillo F, Tannock I, Ravaud P. Impact of spin in the abstracts of articles reporting results of randomized controlled trials in the field of cancer: the SPIIN randomized controlled trial. Journal of Clinical Oncology 2014;32:4120‐6. [DOI] [PubMed] [Google Scholar]
Buch 2011
- Buch MH, Aletaha D, Emery P, Smolen JS. Reporting of long‐term extension studies: lack of consistency calls for consensus. Annals of the Rheumatic Diseases 2011;70(6):886‐90. [DOI] [PubMed] [Google Scholar]
Chan 2015
- Chan SP, Colagiuri S. Systematic review and meta‐analysis of the efficacy and hypoglycemic safety of gliclazide versus other insulinotropic agents. Diabetes Research and Clinical Practice 2015;110(1):75‐81. [DOI] [PubMed] [Google Scholar]
CONSORT
- The CONSORT statement. www.consort‐statement.org (accessed 19 may 2016).
Corbett 2014
- Corbett MS, Higgins JP, Woolacott NF. Assessing baseline imbalance in randomised trials: implications for the Cochrane risk of bias tool. Research Synthesis Methods 2014;5:79‐85. [DOI] [PubMed] [Google Scholar]
Dai 2014
- Dai X, Wang H, Jing Z, Fu P. The effect of a dual combination of noninsulin antidiabetic drugs on lipids: a systematic review and network meta‐analysis. Current Medical Research and Opinion 2014;30(9):1777‐86. [DOI] [PubMed] [Google Scholar]
Deacon 2015
- Deacon CF, Lebovitz HE. A comparative review of DPP‐4 inhibitors and sulphonylureas. Diabetes, Obesity & Metabolism 2015;18(4):333‐47. [PUBMED: 26597596] [DOI] [PubMed] [Google Scholar]
Deeks 2003
- Deeks JJ, Dinnes J, D'Amico R, Sowden AJ, Sakarovitch C, Song F, et al. Evaluating non‐randomised intervention studies. Health Technology Assessment (Winchester, England) 2003;7(27):iii‐x, 1‐173. [PUBMED: 14499048] [DOI] [PubMed] [Google Scholar]
Deeks 2017
- Deeks JJ, Higgins JP, Altman DG (editors): on behalf of the Cochrane Statistical Methods Group. Chapter 9: Analysing data and undertaking meta‐analyses. In: Higgins JPT, Churchill R, Chandler J, Cumpston MS (editors). Cochrane Handbook for Systematic Reviews of Interventions version 5.2.0 (updated June 2017), Cochrane, 2017. Available from www.training.cochrane.org/handbook.
DeFronzo 1999
- DeFronzo RA. Pharmacologic therapy for type 2 diabetes mellitus. Annals of Internal Medicine 1999;131(4):281‐303. [PUBMED: 10454950] [DOI] [PubMed] [Google Scholar]
Evans 2006
- Evans JM, Ogston SA, Emslie‐Smith A, Morris AD. Risk of mortality and adverse cardiovascular outcomes in type 2 diabetes: a comparison of patients treated with sulfonylureas and metformin. Diabetologia 2006;49(5):930‐6. [PUBMED: 16525843] [DOI] [PubMed] [Google Scholar]
Fleming 2015
- Fleming JW, Fleming LW, Davis CS. Fixed‐dose combinations in type 2 diabetes ‐ role of the canagliflozin metformin combination. Diabetes, Metabolic Syndrome and Obesity 2015;8:287‐94. [DOI] [PMC free article] [PubMed] [Google Scholar]
Foroutan 2016
- Foroutan N, Muratov S, Levine M. Safety and efficacy of dipeptidyl peptidase‐4 inhibitors vs sulfonylurea in metformin‐based combination therapy for type 2 diabetes mellitus: systematic review and meta‐analysis. Clinical and Investigative Medicine, Medecine Clinique et Experimentale 2016;39(2):E48‐62. [DOI] [PubMed] [Google Scholar]
Geng 2015
- Geng J, Yu H, Mao Y, Zhang P, Chen Y. Cost effectiveness of dipeptidyl peptidase‐4 inhibitors for type 2 diabetes. Pharmaco Economics 2015;33(6):581‐97. [DOI] [PubMed] [Google Scholar]
Goring 2014
- Goring S, Hawkins N, Wygant G, Roudaut M, Townsend R, Wood I, et al. Dapagliflozin compared with other oral anti‐diabetes treatments when added to metformin monotherapy: a systematic review and network meta‐analysis. Diabetes, Obesity & Metabolism 2014;16(5):433‐42. [DOI] [PubMed] [Google Scholar]
GRADEproGDT 2015 [Computer program]
- McMaster University (developed by Evidence Prime). GRADEproGDT. Hamilton (ON): McMaster University (developed by Evidence Prime), 2015 (accessed 28 February 2018).
Gu 2015
- Gu S, Deng J, Shi L, Mu Y, Dong H. Cost‐effectiveness of saxagliptin vs glimepiride as a second‐line therapy added to metformin in type 2 diabetes in China. Journal of Medical Economics 2015;18(10):808‐20. [DOI] [PubMed] [Google Scholar]
Gulliford 2004
- Gulliford M, Latinovic R. Mortality in type 2 diabetic subjects prescribed metformin and sulphonylurea drugs in combination: cohort study. Diabetes/metabolism Research and Reviews 2004;20(3):239‐45. [PUBMED: 15133756] [DOI] [PubMed] [Google Scholar]
Guthrie 2015
- Guthrie RM. Clinical use of dipeptidyl peptidase‐4 and sodium‐glucose cotransporter 2 inhibitors in combination therapy for type 2 diabetes mellitus. Postgraduate Medicine 2015;127(5):463‐79. [DOI] [PubMed] [Google Scholar]
Harrower 2000
- Harrower AD. Comparative tolerability of sulphonylureas in diabetes mellitus. Drug Safety 2000;22(4):313‐20. [PUBMED: 10789825] [DOI] [PubMed] [Google Scholar]
Harrower 2000a
- Harrower A. Gliclazide modified release: from once‐daily administration to 24‐hour blood glucose control. Metabolism: Clinical and Experimental 2000;49(10 Suppl 2):7‐11. [PUBMED: 11078469] [DOI] [PubMed] [Google Scholar]
Hart 2012
- Hart B, Lundh A, Bero L. Effect of reporting bias on meta‐analyses of drug trials: reanalysis of meta‐analyses. BMJ 2012;344:d7202. [DOI: 10.1136/bmj.d7202] [DOI] [PubMed] [Google Scholar]
Hemmingsen 2011
- Hemmingsen B, Lund SS, Gluud C, Vaag A, Almdal T, Hemmingsen C, et al. Intensive glycaemic control for patients with type 2 diabetes: systematic review with meta‐analysis and trial sequential analysis of randomised clinical trials. BMJ (Clinical Research Ed.) 2011;343:d6898. [PUBMED: 22115901] [DOI] [PMC free article] [PubMed] [Google Scholar]
Hershon 2016
- Hershon KS. Options for empagliflozin in combination therapy in type 2 diabetes mellitus. International Journal of General Medicine 2016;9:155‐72. [DOI] [PMC free article] [PubMed] [Google Scholar]
Higgins 2002
- Higgins JP, Thompson SG. Quantifying heterogeneity in a meta‐analysis. Statistics in Medicine 2002;21:1539‐58. [DOI] [PubMed] [Google Scholar]
Higgins 2003
- Higgins JP, Thompson SG, Deeks JJ, Altman DG. Measuring inconsistency in meta‐analysis. BMJ 2003;327(7414):557‐60. [DOI] [PMC free article] [PubMed] [Google Scholar]
Higgins 2009
- Higgins JP, Thompson SG, Spiegelhalter DJ. A re‐evaluation of random‐effects meta‐analysis. Journal of the Royal Statistical Society: Series A (Statistics in Society) 2009;172(1):137‐59. [DOI] [PMC free article] [PubMed] [Google Scholar]
Higgins 2011
- Higgins JP, Whitehead A, Simmonds M. Sequential methods for random‐effects meta‐analysis. Statistics in Medicine 2011;30(9):903‐21. [PUBMED: 21472757] [DOI] [PMC free article] [PubMed] [Google Scholar]
Higgins 2011a
- Higgins JP, Altman DG, Gøtzsche PC, Jüni P, Moher D, Oxman AD, et al. The Cochrane Collaboration's tool for assessing risk of bias in randomised trials. BMJ 2011;343:d5928. [DOI] [PMC free article] [PubMed] [Google Scholar]
Higgins 2011b
- Higgins JP, Deeks JJ, Altman DG (editors). Chapter 16: Special topics in statistics. In: Higgins JPT, Green S (editors). Cochrane Handbook for Systematic Reviews of Interventions. Version 5.1.0 (updated March 2011). The Cochrane Collaboration, 2011. Available from www.cochrane‐handbook.cochrane.org.
Higgins 2017
- Higgins JP, Altman DG, Sterne JA (editors). Chapter 8: Assessing risk of bias in included studies. In: Higgins JPT, Churchill R, Chandler J, Cumpston MS (editors), Cochrane Handbook for Systematic Reviews of Interventions Version 5.2.0 (updated June 2017), Cochrane, 2017. Available from www.training.cochrane.org/handbook.
Hou 2015
- Hou L, Zhao T, Liu Y, Zhang Y. Efficacy and safety of sitagliptin compared with sulfonylurea therapy in patients with type 2 diabetes showing inadequately controlled glycosylated hemoglobin with metformin monotherapy: a meta‐analysis. Experimental and Therapeutic Medicine 2015;9(4):1528‐36. [DOI] [PMC free article] [PubMed] [Google Scholar]
Hozo 2005
- Hozo SP, Djulbegovic B, Hozo I. Estimating the mean and variance from the median, range, and the size of a sample. BMC Medical Research Methodology 2005;5:13. [DOI: 10.1186/1471-2288-5-13] [DOI] [PMC free article] [PubMed] [Google Scholar]
Hróbjartsson 2013
- Hróbjartsson A, Thomsen AS, Emanuelsson F, Tendal B, Hilden J, Boutron I, et al. Observer bias in randomized clinical trials with measurement scale outcomes: a systematic review of trials with both blinded and nonblinded assessors. Canadian Medical Association Journal 2013;185(4):E201‐11. [DOI] [PMC free article] [PubMed] [Google Scholar]
ICH 1997
- International Conference on Harmonisation Expert Working Group. International conference on harmonisation of technical requirements for registration of pharmaceuticals for human use. ICH harmonised tripartite guideline. Guideline for good clinical practice //1997 CFR & ICH Guidelines. PA 19063‐2043. USA: Barnett International/PAREXEL, 1997.
Inzucchi 2012
- Inzucchi SE, Bergenstal RM, Buse JB, Diamant M, Ferrannini E, Nauck M, et al. Management of hyperglycemia in type 2 diabetes: a patient‐centered approach: position statement of the American Diabetes Association (ADA) and the European Association for the Study of Diabetes (EASD). Diabetes Care 2012;35(6):1364‐79. [PUBMED: 22517736] [DOI] [PMC free article] [PubMed] [Google Scholar]
Johnson 2002
- Johnson JA, Majumdar SR, Simpson SH, Toth EL. Decreased mortality associated with the use of metformin compared with sulfonylurea monotherapy in type 2 diabetes. Diabetes Care 2002;25(12):2244‐8. [PUBMED: 12453968] [DOI] [PubMed] [Google Scholar]
Jones 2015
- Jones CW, Keil LG, Holland WC, Caughey MC, Platts‐Mills TF. Comparison of registered and published outcomes in randomized controlled trials: a systematic review. BMC Medicine 2015;13:282. [DOI: 10.1186/s12916-015-0520-3] [DOI] [PMC free article] [PubMed] [Google Scholar]
Kahler 2007
- Kahler KH, Rajan M, Rhoads GG, Safford MM, Demissie K, Lu SE, et al. Impact of oral antihyperglycemic therapy on all‐cause mortality among patients with diabetes in the Veterans Health Administration. Diabetes Care 2007;30(7):1689‐93. [PUBMED: 17440170] [DOI] [PubMed] [Google Scholar]
Kannan 2015
- Kannan S, Mahadevan S, Ramakrishnan A. Fixed dose combinations for type 2 diabetes. Lancet Diabetes & Endocrinology 2015;3(6):408. [DOI] [PubMed] [Google Scholar]
Kirkham 2010
- Kirkham JJ, Dwan KM, Altman DG, Gamble C, Dodd S, Smyth R, et al. The impact of outcome reporting bias in randomised controlled trials on a cohort of systematic reviews. BMJ 2010;340:c365. [DOI: 10.1136/bmj.c365] [DOI] [PubMed] [Google Scholar]
Krentz 2005
- Krentz AJ, Bailey CJ. Oral antidiabetic agents: current role in type 2 diabetes mellitus. Drugs 2005;65(3):385‐411. [PUBMED: 15669880] [DOI] [PubMed] [Google Scholar]
Kuecker 2016
- Kuecker CM, Vivian EM. Patient considerations in type 2 diabetes ‐ role of combination dapagliflozin‐metformin XR. Diabetes, Metabolic Syndrome and Obesity: targets and therapy 2016;9:25‐35. [DOI] [PMC free article] [PubMed] [Google Scholar]
Lan 1983
- Lan KK, DeMets DL. Discrete sequential boundaries for clinical trials. Biometrika 1983;70:659‐63. [Google Scholar]
Langtry 1998
- Langtry HD, Balfour JA. Glimepiride. A review of its use in the management of type 2 diabetes mellitus. Drugs 1998;55(4):563‐84. [PUBMED: 9561345] [DOI] [PubMed] [Google Scholar]
LeRoith 2002
- LeRoith D. Beta‐cell dysfunction and insulin resistance in type 2 diabetes: role of metabolic and genetic abnormalities. American Journal of Medicine 2002;113 Suppl 6A:3S‐11S. [PUBMED: 12431757] [DOI] [PubMed] [Google Scholar]
Liberati 2009
- Liberati A, Altman DG, Tetzlaff J, Mulrow C, Gøtzsche PC, Ioannidis JPA, et al. The PRISMA statement for reporting systematic and meta‐analyses of studies that evaluate interventions: explanation and elaboration. PLoS Medicine 2009;6(7):1‐28. [DOI: 10.1371/journal.pmed.1000100] [DOI] [PMC free article] [PubMed] [Google Scholar]
Lim 2015
- Lim 2015. What's next after metformin? Focus on sulphonylurea: add‐on or combination therapy. Pharmacy Practice 2015;13(3):606. [DOI] [PMC free article] [PubMed] [Google Scholar]
Liu 2014
- Liu X, Xiao Q, Zhang L, Yang Q, Liu X, Xu L, et al. The long‐term efficacy and safety of DPP‐IV inhibitors monotherapy and in combination with metformin in 18,980 patients with type‐2 diabetes mellitus‐‐a meta‐analysis. Pharmacoepidemiology and Drug Safety 2014;23(7):687‐98. [DOI] [PubMed] [Google Scholar]
Lundh 2017
- Lundh A, Lexchin J, Mintzes B, Schroll JB, Bero L. Industry sponsorship and research outcome. Cochrane Database of Systematic Reviews 2017, Issue 2. [DOI: 10.1002/14651858.MR000033.pub3] [DOI] [PMC free article] [PubMed] [Google Scholar]
Maruthur 2016
- Maruthur NM, Tseng E, Hutfless S, Wilson LM, Suarez‐Cuervo C, Berger Z, et al. Diabetes medications as monotherapy or metformin‐based combination therapy for type 2 diabetes: a systematic review and meta‐analysis. Annals of Internal Medicine 2016;164(11):740‐51. [DOI: 10.7326/M15-2650] [DOI] [PubMed] [Google Scholar]
Mathieu 2009
- Mathieu S, Boutron I, Moher D, Altman DG, Ravaud P. Comparison of registered and published primary outcomes in randomized controlled trials. JAMA 2009;302:977‐84. [DOI] [PubMed] [Google Scholar]
McCall 2001
- McCall AL. Clinical review of glimepiride. Expert Opinion on Pharmacotherapy 2001;2(4):699‐713. [PUBMED: 11336617] [DOI] [PubMed] [Google Scholar]
Meader 2014
- Meader N, King K, Llewellyn A, Norman G, Brown J, Rodgers M, et al. A checklist designed to aid consistency and reproducibility of GRADE assessments: development and pilot validation. Systematic Reviews 2014;3:82. [DOI] [PMC free article] [PubMed] [Google Scholar]
Mearns 2015
- Mearns ES, Sobieraj DM, White CM, Saulsberry WJ, Kohn CG, Doleh Y, et al. Comparative efficacy and safety of antidiabetic drug regimens added to metformin monotherapy in patients with type 2 diabetes: a network meta‐analysis. PloS one 2015;10(4):e0125879. [DOI] [PMC free article] [PubMed] [Google Scholar]
Megan 2012
- Megan B, Pickering RM, Weatherall M. Design, objectives, execution and reporting of published open‐label extension studies. Journal of Evaluation in Clinical Practice 2012;18(2):209‐15. [DOI] [PubMed] [Google Scholar]
Mishriky 2015
- Mishriky BM, Cummings DM, Tanenberg RJ. The efficacy and safety of DPP4 inhibitors compared to sulfonylureas as add‐on therapy to metformin in patients with type 2 diabetes: a systematic review and meta‐analysis. Diabetes Research and Clinical Practice 2015;109(2):378‐88. [DOI] [PubMed] [Google Scholar]
Monami 2008
- Monami M, Lamanna C, Marchionni N, Mannucci E. Comparison of different drugs as add‐on treatments to metformin in type 2 diabetes: a meta‐analysis. Diabetes Research and Clinical Practice 2008;79(2):196‐203. [DOI] [PubMed] [Google Scholar]
Morgan 2014
- Morgan CL, Mukherjee J, Jenkins‐Jones S, Holden SE, Currie CJ. Association between first‐line monotherapy with sulphonylurea versus metformin and risk of all‐cause mortality and cardiovascular events: a retrospective, observational study. Diabetes, Obesity & Metabolism 2014;16(10):957‐62. [PUBMED: 24720708] [DOI] [PubMed] [Google Scholar]
Nathan 2009
- Nathan DM, Buse JB, Davidson MB, Ferrannini E, Holman RR, Sherwin R, et al. Medical management of hyperglycaemia in type 2 diabetes mellitus: a consensus algorithm for the initiation and adjustment of therapy: a consensus statement from the American Diabetes Association and the European Association for the Study of Diabetes. Diabetologia 2009;52(1):17‐30. [PUBMED: 18941734] [DOI] [PubMed] [Google Scholar]
Nishio 2015
- Nishio S, Abe M, Ito H. Anagliptin in the treatment of type 2 diabetes: safety, efficacy, and patient acceptability. Diabetes, Metabolic Syndrome and Obesity: targets and therapy 2015;8:163‐71. [DOI] [PMC free article] [PubMed] [Google Scholar]
Odawara 2015
- Odawara M, Sagara R. Effects of vildagliptin as add‐on treatment in patients with type 2 diabetes mellitus: insights from long‐term clinical studies in Japan. Journal of Diabetes and Metabolic Disorders 2015;15:21. [DOI] [PMC free article] [PubMed] [Google Scholar]
Pantalone 2012
- Pantalone KM, Kattan MW, Yu C, Wells BJ, Arrigain S, Jain A, et al. Increase in overall mortality risk in patients with type 2 diabetes receiving glipizide, glyburide or glimepiride monotherapy versus metformin: a retrospective analysis. Diabetes, Obesity & Metabolism 2012;14(9):803‐9. [PUBMED: 22486923] [DOI] [PubMed] [Google Scholar]
Phung 2010
- Phung OJ, Scholle JM, Talwar M, Coleman CI. Effect of noninsulin antidiabetic drugs added to metformin therapy on glycemic control, weight gain, and hypoglycemia in type 2 diabetes. JAMA 2010;303(14):1410‐8. [DOI] [PubMed] [Google Scholar]
Phung 2014
- Phung OJ, Sobieraj DM, Engel SS, Rajpathak SN. Early combination therapy for the treatment of type 2 diabetes mellitus: systematic review and meta‐analysis. Diabetes, Obesity & Metabolism 2014;16(5):410‐7. [DOI] [PubMed] [Google Scholar]
Pogue 1997
- Pogue JM, Yusuf S. Cumulating evidence from randomized trials: utilizing sequential monitoring boundaries for cumulative meta‐analysis. Controlled Clinical Trials 1997;18(6):580‐93; discussion 661‐6. [PUBMED: 9408720] [DOI] [PubMed] [Google Scholar]
Reid 2016
- Reid 2016. How much is too much? Outcomes in patients using high‐dose insulin glargine. International Journal of Clinical Practice 2016;70(1):56‐65. [DOI] [PMC free article] [PubMed] [Google Scholar]
Review Manager 2014 [Computer program]
- Nordic Cochrane Centre, The Cochrane Collaboration. Review Manager 5 (RevMan 5). Version 5.3. Copenhagen: Nordic Cochrane Centre, The Cochrane Collaboration, 2014.
Riley 2011
- Riley RD, Higgins JP, Deeks JJ. Interpretation of random effects meta‐analyses. BMJ 2011;342:d549. [DOI] [PubMed] [Google Scholar]
Rosenstock 2013
- Rosenstock J, Marx N, Kahn SE, Zinman B, Kastelein JJ, Lachin JM, et al. Cardiovascular outcome trials in type 2 diabetes and the sulphonylurea controversy: rationale for the active‐comparator CAROLINA trial. Diabetes & Vascular Disease Research 2013;10(4):289‐301. [DOI] [PubMed] [Google Scholar]
Rosenstock 2015
- Rosenstock J, Marx N, Neubacher D, Seck T, Patel S, Woerle HJ, et al. Cardiovascular safety of linagliptin in type 2 diabetes: a comprehensive patient‐level pooled analysis of prospectively adjudicated cardiovascular events. Cardiovascular Diabetology 2015;14:57. [DOI] [PMC free article] [PubMed] [Google Scholar]
Roumie 2012
- Roumie CL, Hung AM, Greevy RA, Grijalva CG, Liu X, Murff HJ, et al. Comparative effectiveness of sulfonylurea and metformin monotherapy on cardiovascular events in type 2 diabetes mellitus: a cohort study. Annals of Internal Medicine 2012;157(9):601‐10. [PUBMED: 23128859] [DOI] [PMC free article] [PubMed] [Google Scholar]
Salpeter 2010
- Salpeter SR, Greyber E, Pasternak GA, Salpeter EE. Risk of fatal and nonfatal lactic acidosis with metformin use in type 2 diabetes mellitus. Cochrane Database of Systematic Reviews 2010, Issue 4. [DOI: 10.1002/14651858.CD002967.pub4] [DOI] [PMC free article] [PubMed] [Google Scholar]
Scheen 2016
- Scheen AJ. Dulaglutide (Trulicity(R)), a new once‐weekly agonist of glucagon‐like peptide‐1 receptors for type 2 diabetes. Revue Medicale de Liege 2016;71(3):154‐60. [PubMed] [Google Scholar]
Scherer 2007
- Scherer RW, Langenberg P, Elm E. Full publication of results initially presented in abstracts. Cochrane Database of Systematic Reviews 2007, Issue 2. [DOI: 10.1002/14651858.MR000005.pub3] [DOI] [PubMed] [Google Scholar]
Schramm 2011
- Schramm TK, Gislason GH, Vaag A, Rasmussen JN, Folke F, Hansen ML, et al. Mortality and cardiovascular risk associated with different insulin secretagogues compared with metformin in type 2 diabetes, with or without a previous myocardial infarction: a nationwide study. European Heart Journal 2011;32(15):1900‐8. [PUBMED: 21471135] [DOI] [PubMed] [Google Scholar]
Schroll 2015
- Schroll JB, Bero L. Regulatory agencies hold the key to improving Cochrane Reviews of drugs [editorial]. Cochrane Database of Systematic Reviews 2015; Vol. 4:10.1002/14651858.ED000098. [DOI] [PMC free article] [PubMed]
Schünemann 2017
- Schünemann HJ, Oxman AD, Higgins JP, Vist GE, Glasziou P, Akl E, et al. on behalf of the Cochrane GRADEing Methods Group and the Cochrane Statistical Methods Group. Chapter 11: Completing ‘Summary of findings’ tables and grading the confidence in or quality of the evidence. In: Higgins JPT, Churchill R, Chandler J, Cumpston MS (editors), Cochrane Handbook for Systematic Reviews of Interventions version 5.2.0 (updated June 2017). Cochrane, 2017. Available from www.training.cochrane.org/handbook.
Scott 2012
- Scott LJ. Repaglinide: a review of its use in type 2 diabetes mellitus. Drugs 2012;72(2):249‐72. [PUBMED: 22268393] [DOI] [PubMed] [Google Scholar]
Seufert 2014
- Seufert J. Oral add‐on therapy to metformin in type 2 diabetes mellitus: a direct comparison between canagliflozin and glimepiride. Deutsche Medizinische Wochenschrift (1946) 2014;139 Suppl 2:S65‐9. [DOI] [PubMed] [Google Scholar]
Sharma 2017
- Sharma M, Beckley N, Nazareth I, Petersen I. Effectiveness of sitagliptin compared to sulfonylureas for type 2 diabetes mellitus inadequately controlled on metformin: a systematic review and meta‐analysis. BMJ Open 2017;7(10):e017260. [DOI] [PMC free article] [PubMed] [Google Scholar]
Sterne 2011
- Sterne JA, Sutton AJ, Ioannidis JP, Terrin N, Jones DR, Lau J, et al. Recommendations for examining and interpreting funnel plot asymmetry in meta‐analyses of randomised controlled trials. BMJ 2011;343:d4002. [DOI] [PubMed] [Google Scholar]
Sterne 2017
- Sterne JA, Egger M, Moher D, Boutron I (editors). Chapter 10: Addressing reporting biases. In: Higgins JPT, Churchill R, Chandler J, Cumpston MS (editors), Cochrane Handbook for Systematic Reviews of Interventions version 5.2.0 (updated June 2017), Cochrane, 2017. Available from www.training.cochrane.org/handbook.
UGDP 1976
- University Group Diabetes Program. A study of the effects of hypoglycemia agents on vascular complications in patients with adult‐onset diabetes. VI. Supplementary report on nonfatal events in patients treated with tolbutamide. Diabetes 1976;25(12):1129‐53. [PUBMED: 992232] [DOI] [PubMed] [Google Scholar]
UKPDS‐33 1998
- UK Prospective Diabetes Study (UKPDS) Group. Intensive blood‐glucose control with sulphonylureas or insulin compared with conventional treatment and risk of complications in patients with type 2 diabetes (UKPDS 33). Lancet 1998;352(9131):837‐53. [PUBMED: 9742976] [PubMed] [Google Scholar]
UKPDS‐34 1998
- UK Prospective Diabetes Study (UKPDS) Group. Effect of intensive blood‐glucose control with metformin on complications in overweight patients with type 2 diabetes (UKPDS 34). Lancet 1998;352(9131):854‐65. [PUBMED: 9742977] [PubMed] [Google Scholar]
Varvaki 2016
- Varvaki Rados D, Catani Pinto L, Reck Remonti L, Bauermann Leitao C, Gross JL. The association between sulfonylurea use and all‐cause and cardiovascular mortality: a meta‐analysis with trial sequential analysis of randomized clinical trials. PLoS Medicine 2016;13(4):e1001992. [DOI] [PMC free article] [PubMed] [Google Scholar]
Vist 2008
- Vist GE, Bryant D, Somerville L, Birminghem T, Oxman AD. Outcomes of patients who participate in randomized controlled trials compared to similar patients receiving similar interventions who do not participate. Cochrane Database of Systematic Reviews 2008, Issue 2. [DOI: 10.1002/14651858.MR000009.pub4] [DOI] [PMC free article] [PubMed] [Google Scholar]
Wang 2017
- Wang F, He Y, Zhang R, Zeng Q, Zhao X. Combination therapy of metformin plus dipeptidyl peptidase‐4 inhibitor versus metformin plus sulfonylurea and their association with a decreased risk of cardiovascular disease in type 2 diabetes mellitus patients. Medicine (Baltimore) 2017;96(36):e7638. [DOI] [PMC free article] [PubMed] [Google Scholar]
Wetterslev 2008
- Wetterslev J, Thorlund K, Brok J, Gluud C. Trial sequential analysis may establish when firm evidence is reached in cumulative meta‐analysis. Journal of Clinical Epidemiology 2008;61(1):64‐75. [PUBMED: 18083463] [DOI] [PubMed] [Google Scholar]
Whalen 2015
- Whalen K, Miller S, Onge ES. The role of sodium‐glucose co‐transporter 2 inhibitors in the treatment of type 2 diabetes. Clinical Therapeutics 2015;37(6):1150‐66. [DOI] [PubMed] [Google Scholar]
WHO 1998
- Alberti KM, Zimmet PZ. Definition, diagnosis and classification of diabetes mellitus and its complications. Part I: diagnosis and classification of diabetes mellitus. Provisional report of a WHO consultation. Diabetic Medicine 1998;15(7):539‐53. [DOI] [PubMed] [Google Scholar]
WHO 2015
- World Health Organization. Diabetes. www.who.int/mediacentre/factsheets/fs312/en/ (accessed 29 February 2016).
Wild 2004
- Wild S, Roglic G, Green A, Sicree R, King H. Global prevalence of diabetes: estimates for the year 2000 and projections for 2030. Diabetes Care 2004;27(5):1047‐53. [PUBMED: 15111519] [DOI] [PubMed] [Google Scholar]
Wong 2006a
- Wong SS, Wilczynski NL, Haynes RB. Comparison of top‐performing search strategies for detecting clinically sound treatment studies and systematic reviews in MEDLINE and Embase. Journal of the Medical Library Association 2006;94(4):451‐5. [PMC free article] [PubMed] [Google Scholar]
Wong 2006b
- Wong SSL, Wilczynski NL, Haynes RB. Developing optimal search strategies for detecting clinically sound treatment studies in Embase. Journal of the Medical Library Association 2006;94(1):41‐7. [PMC free article] [PubMed] [Google Scholar]
Wood 2008
- Wood L, Egger M, Gluud LL, Schulz KF, Jüni P, Altman DG, et al. Empirical evidence of bias in treatment effect estimates in controlled trials with different interventions and outcomes: meta‐epidemiological study. BMJ 2008;336(7644):601‐5. [DOI] [PMC free article] [PubMed] [Google Scholar]
Zhou 2015
- Zhou 2015. The benefits and risks of DPP4‐inhibitors vs sulfonylureas for patients with type 2 diabetes: accumulated evidence from randomised controlled trial. International Journal of Clinical Practice 2016;70(2):132‐41. [DOI] [PubMed] [Google Scholar]
Zintzaras 2014
- Zintzaras E, Miligkos M, Ziakas P, Balk EM, Mademtzoglou D, Doxani C, et al. Assessment of the relative effectiveness and tolerability of treatments of type 2 diabetes mellitus: a network meta‐analysis. Clinical Therapeutics 2014;36(10):1443‐53. [DOI] [PubMed] [Google Scholar]
References to other published versions of this review
Madsen 2016
- Madsen KS, Kähler P, Kähler LK, Madsbad S, Metzendorf M‐I, Richter B, et al. Metformin and sulphonylurea (second‐ or third‐generation) combination therapy for adults with type 2 diabetes mellitus. Cochrane Database of Systematic Reviews 2016, Issue 9. [DOI: 10.1002/14651858.CD012368] [DOI] [PMC free article] [PubMed] [Google Scholar]