

Abstract
Background
Intensive Case Management (ICM) is a community‐based package of care aiming to provide long‐term care for severely mentally ill people who do not require immediate admission. Intensive Case Management evolved from two original community models of care, Assertive Community Treatment (ACT) and Case Management (CM), where ICM emphasises the importance of small caseload (fewer than 20) and high‐intensity input.
Objectives
To assess the effects of ICM as a means of caring for severely mentally ill people in the community in comparison with non‐ICM (caseload greater than 20) and with standard community care. We did not distinguish between models of ICM. In addition, to assess whether the effect of ICM on hospitalisation (mean number of days per month in hospital) is influenced by the intervention's fidelity to the ACT model and by the rate of hospital use in the setting where the trial was conducted (baseline level of hospital use).
Search methods
We searched the Cochrane Schizophrenia Group's Trials Register (last update search 10 April 2015).
Selection criteria
All relevant randomised clinical trials focusing on people with severe mental illness, aged 18 to 65 years and treated in the community care setting, where ICM is compared to non‐ICM or standard care.
Data collection and analysis
At least two review authors independently selected trials, assessed quality, and extracted data. For binary outcomes, we calculated risk ratio (RR) and its 95% confidence interval (CI), on an intention‐to‐treat basis. For continuous data, we estimated mean difference (MD) between groups and its 95% CI. We employed a random‐effects model for analyses.
We performed a random‐effects meta‐regression analysis to examine the association of the intervention's fidelity to the ACT model and the rate of hospital use in the setting where the trial was conducted with the treatment effect. We assessed overall quality for clinically important outcomes using the GRADE approach and investigated possible risk of bias within included trials.
Main results
The 2016 update included two more studies (n = 196) and more publications with additional data for four already included studies. The updated review therefore includes 7524 participants from 40 randomised controlled trials (RCTs). We found data relevant to two comparisons: ICM versus standard care, and ICM versus non‐ICM. The majority of studies had a high risk of selective reporting. No studies provided data for relapse or important improvement in mental state.
1. ICM versus standard care
When ICM was compared with standard care for the outcome service use, ICM slightly reduced the number of days in hospital per month (n = 3595, 24 RCTs, MD ‐0.86, 95% CI ‐1.37 to ‐0.34,low‐quality evidence). Similarly, for the outcome global state, ICM reduced the number of people leaving the trial early (n = 1798, 13 RCTs, RR 0.68, 95% CI 0.58 to 0.79, low‐quality evidence). For the outcome adverse events, the evidence showed that ICM may make little or no difference in reducing death by suicide (n = 1456, 9 RCTs, RR 0.68, 95% CI 0.31 to 1.51, low‐quality evidence). In addition, for the outcome social functioning, there was uncertainty about the effect of ICM on unemployment due to very low‐quality evidence (n = 1129, 4 RCTs, RR 0.70, 95% CI 0.49 to 1.0, very low‐quality evidence).
2. ICM versus non‐ICM
When ICM was compared with non‐ICM for the outcome service use, there was moderate‐quality evidence that ICM probably makes little or no difference in the average number of days in hospital per month (n = 2220, 21 RCTs, MD ‐0.08, 95% CI ‐0.37 to 0.21, moderate‐quality evidence) or in the average number of admissions (n = 678, 1 RCT, MD ‐0.18, 95% CI ‐0.41 to 0.05, moderate‐quality evidence) compared to non‐ICM. Similarly, the results showed that ICM may reduce the number of participants leaving the intervention early (n = 1970, 7 RCTs, RR 0.70, 95% CI 0.52 to 0.95,low‐quality evidence) and that ICM may make little or no difference in reducing death by suicide (n = 1152, 3 RCTs, RR 0.88, 95% CI 0.27 to 2.84, low‐quality evidence). Finally, for the outcome social functioning, there was uncertainty about the effect of ICM on unemployment as compared to non‐ICM (n = 73, 1 RCT, RR 1.46, 95% CI 0.45 to 4.74, very low‐quality evidence).
3. Fidelity to ACT
Within the meta‐regression we found that i.) the more ICM is adherent to the ACT model, the better it is at decreasing time in hospital ('organisation fidelity' variable coefficient ‐0.36, 95% CI ‐0.66 to ‐0.07); and ii.) the higher the baseline hospital use in the population, the better ICM is at decreasing time in hospital ('baseline hospital use' variable coefficient ‐0.20, 95% CI ‐0.32 to ‐0.10). Combining both these variables within the model, 'organisation fidelity' is no longer significant, but the 'baseline hospital use' result still significantly influences time in hospital (regression coefficient ‐0.18, 95% CI ‐0.29 to ‐0.07, P = 0.0027).
Authors' conclusions
Based on very low‐ to moderate‐quality evidence, ICM is effective in ameliorating many outcomes relevant to people with severe mental illness. Compared to standard care, ICM may reduce hospitalisation and increase retention in care. It also globally improved social functioning, although ICM's effect on mental state and quality of life remains unclear. Intensive Case Management is at least valuable to people with severe mental illnesses in the subgroup of those with a high level of hospitalisation (about four days per month in past two years). Intensive Case Management models with high fidelity to the original team organisation of ACT model were more effective at reducing time in hospital.
However, it is unclear what overall gain ICM provides on top of a less formal non‐ICM approach.
We do not think that more trials comparing current ICM with standard care or non‐ICM are justified, however we currently know of no review comparing non‐ICM with standard care, and this should be undertaken.
Keywords: Humans; Case Management; Community Mental Health Services; Community Mental Health Services/methods; Employment; Employment/statistics & numerical data; Hospitalization; Hospitalization/statistics & numerical data; Mental Disorders; Mental Disorders/therapy; Outcome and Process Assessment, Health Care; Outcome and Process Assessment, Health Care/methods; Randomized Controlled Trials as Topic; Regression Analysis; Suicide; Suicide/statistics & numerical data
Plain language summary
Intensive case management for people with severe mental illness
Background
Severe mental illnesses are defined by diagnosis, degree of disability and the presence of some abnormal behaviour. Including schizophrenia and psychosis, severe mood problems, and personality disorder, severe mental illness can cause considerable distress over a long period of time to both the person affected and his or her family and friends.
Until the 1970s, it was common for those suffering from these disorders to remain in an institution for most of their lives, but in most of the countries of the world, they are now managed in the community with one of several different types of intervention. Intensive Case Management (ICM) is one such intervention. It consists of management of the mental health problem and the rehabilitation and social support needs of the person concerned, over an indefinite period of time, by a team of people who have a fairly small group of clients (fewer than 20). Twenty‐four‐hour help is offered and clients are seen in a non‐clinical setting. Aims of the review
To find and present good‐quality evidence concerning the effectiveness of ICM compared with non‐ICM (where people receive the same package of care, but the professionals have caseloads of more than 20 people) and standard care (where people are seen as outpatients, but their support needs are less clearly defined) for people with severe mental illness.
Searching for evidence
We carried out electronic searches for randomised controlled trials comparing ICM with non‐ICM or standard care in 2009, 2012, and 2015.
Results
We included 40 trials involving 7524 people. The trials took place in Australia, Canada, China, Europe, and the USA. When ICM was compared to standard care, those in the ICM group were more likely to stay with the service, have improved general functioning, get a job, not be homeless, and have shorter stays in hospital (especially when they had had very long stays in hospital previously). When ICM was compared to non‐ICM, the only clear difference was that those in the ICM group were more likely to be kept in care.
Conclusions
None of the evidence for the main outcomes of interest was high quality; at best the evidence was of moderate quality. In addition, the healthcare and social support systems of the countries where the studies took place were quite different, so it was difficult to make valid overall conclusions. Furthermore, we were unable to use much of the data on quality of life and patient and carer satisfaction because the trials used many different scales to measure these outcomes, some of which were not validated. The development of an overall scale and its validation would be very beneficial in producing services that people favour.
(Plain language summary initially prepared for this review by Janey Antoniou of RETHINK, UK (rethink.org))
Summary of findings
Summary of findings for the main comparison. Intensive Case Management versus standard care for severe mental illness.
| Intensive Case Management versus standard care for severe mental illness | ||||||
| Patient or population: people with severe mental illness Settings: community Intervention: Intensive Case Management versus standard care | ||||||
| Outcomes | Illustrative comparative risks* (95% CI) | Relative effect (95% CI) | No of Participants (studies) | Quality of the evidence (GRADE) | Comments | |
| Assumed risk | Corresponding risk | |||||
| Control | Intensive Case Managementversus standard care | |||||
| Service use: 1. Average number of days in hospital per month ‐ by about 24 months | ‐ | The mean service use: 1. average number of days in hospital per month ‐ by about 24 months in the intervention groups was 0.86 lower (1.37 lower to 0.34 lower) | ‐ | 3595 (24 studies) | ⊕⊕⊝⊝ low1,2 | |
| Adverse event: 1b. Death ‐ suicide ‐ by long term | 20 per 1000 | 13 per 1000 (6 to 30) | RR 0.68 (0.31 to 1.51) | 1456 (9 studies) | ⊕⊕⊝⊝ low1,4 | |
| Global state: 1. Relapse ‐ by long term | ‐ | ‐ | ‐ | ‐ | ‐ | No data available |
| Global state: 1. Leaving the study early ‐ by long term | 331 per 1000 | 225 per 1000 (192 to 262) | RR 0.68 (0.58 to 0.79) | 1798 (13 studies) | ⊕⊕⊝⊝ low1,3 | |
| Social functioning: 2. Employment status (various measurements) ‐ by long term ‐ not employed at the end of the trial | 766 per 1000 | 536 per 1000 (375 to 766) | RR 0.7 (0.49 to 1) | 1129 (4 studies) | ⊕⊝⊝⊝ very low1,5 | |
| Mental state: not improved to an important extent ‐ by long term | ‐ | ‐ | ‐ | ‐ | ‐ | No data available |
| *The basis for the assumed risk (e.g. the median control group risk across studies) is provided in footnotes. The corresponding risk (and its 95% confidence interval) is based on the assumed risk in the comparison group and the relative effect of the intervention (and its 95% CI). CI: confidence interval; RR: risk ratio | ||||||
| GRADE Working Group grades of evidence High quality: Further research is very unlikely to change our confidence in the estimate of effect. Moderate quality: Further research is likely to have an important impact on our confidence in the estimate of effect and may change the estimate. Low quality: Further research is very likely to have an important impact on our confidence in the estimate of effect and is likely to change the estimate. Very low quality: We are very uncertain about the estimate. | ||||||
1Downgraded one step for risk of bias: randomisation not well described; problematic to blind. 2Downgraded one step for inconsistency: substantial heterogeneity (I2 = 74%). 3Downgraded one step for selective reporting bias: only 13 studies reported fully on the flow of participants through the study. 4Downgraded one step for imprecision: the 95% CI includes both appreciable benefit and appreciable harm. 5Downgraded two steps for inconsistency: considerable heterogeneity (I2 = 94%).
Summary of findings 2. Intensive Case Management versus non‐Intensive Case Management for severe mental illness.
| Intensive Case Management versus non‐Intensive Case Management for severe mental illness | ||||||
| Patient or population: people with severe mental illness Settings: community Intervention: Intensive Case Management versus non‐Intensive Case Management | ||||||
| Outcomes | Illustrative comparative risks* (95% CI) | Relative effect (95% CI) | No of Participants (studies) | Quality of the evidence (GRADE) | Comments | |
| Assumed risk | Corresponding risk | |||||
| Control | Intensive Case Management versus non‐Intensive Case Management | |||||
| Service use: 1. Average number of days in hospital per month ‐ by about 24 months | ‐ | The mean service use: 1. average number of days in hospital per month ‐ by about 24 months in the intervention groups was 0.08 lower (0.37 lower to 0.21 higher) | ‐ | 2220 (21 studies) | ⊕⊕⊕⊝ moderate1 | |
| Service use: 3b. Average number of admissions (skewed data ‐ sample size ≧ 200) ‐ by long term | ‐ | The mean service use: 3b. average number of admissions (skewed data ‐ sample size ≧ 200) ‐ by long term in the intervention groups was 0.18 lower (0.41 lower to 0.05 higher) | ‐ | 678 (1 studies) | ⊕⊕⊕⊝ moderate1 | |
| Adverse event: 1b. Death ‐ suicide ‐ by long term | 12 per 1000 | 11 per 1000 (3 to 35) | RR 0.88 (0.27 to 2.84) | 1152 (3 studies) | ⊕⊕⊝⊝ low1,3 | |
| Global state: 1. Relapse ‐ by long term | ‐ | ‐ | ‐ | ‐ | ‐ | No data available |
| Global state: 1. Leaving the study early ‐ by long term | 159 per 1000 | 111 per 1000 (83 to 151) | RR 0.7 (0.52 to 0.95) | 1970 (7 studies) | ⊕⊕⊝⊝ low1,2 | |
| Social functioning 2. Employment status ‐ by medium term ‐ spent > 1 day employed | 111 per 1000 | 162 per 1000 (50 to 527) | RR 1.46 (0.45 to 4.74) | 73 (1 study) | ⊕⊝⊝⊝ very low1,4 | |
| Mental state: not improved to an important extent ‐ by long term | ‐ | ‐ | ‐ | ‐ | ‐ | No data available |
| *The basis for the assumed risk (e.g. the median control group risk across studies) is provided in footnotes. The corresponding risk (and its 95% confidence interval) is based on the assumed risk in the comparison group and the relative effect of the intervention (and its 95% CI). CI: confidence interval; RR: risk ratio | ||||||
| GRADE Working Group grades of evidence High quality: Further research is very unlikely to change our confidence in the estimate of effect. Moderate quality: Further research is likely to have an important impact on our confidence in the estimate of effect and may change the estimate. Low quality: Further research is very likely to have an important impact on our confidence in the estimate of effect and is likely to change the estimate. Very low quality: We are very uncertain about the estimate. | ||||||
1Downgraded one step for risk of bias: randomisation not well described; problematic to blind. 2Downgraded one step for selective reporting bias: only 7 studies reported fully on the flow of participants through the study. 3Downgraded one step for imprecision: the 95% CI includes both appreciable benefit and appreciable harm. 4Downgraded two steps for imprecision: the 95% CI includes both appreciable benefit and appreciable harm, and only 73 participants were included.
Background
Description of the condition
Worldwide, more than 25% of people develop one or more mental or behavioural disorders during their lifetime (WHO 2001). Schizophrenia is one illness that heavily contributes to the numbers of people considered severely mentally ill. The lifetime prevalence of schizophrenia is 0.58% in the adult population (Warner 1995). It is currently 26th on the list of diseases ranked according to contribution to overall burden in term of disability‐adjusted life years (DALYs). Its ranking is projected to rise to 20th by the year 2020, with more than 17 million DALYs lost (accounting for 1.25% of overall burden) (Murray 1996). However, other psychiatric/psychological conditions can also profoundly affect a person's functioning. Many people with other types of non‐organic psychotic illness, or even non‐psychotic disorders such as personality disorder, can be considered to be severely mentally ill.
There has been lack of consensus over the definition of 'severe mental illness', but the most common dimensions used to identify this group are i.) diagnosis, ii.) disability, iii.) duration, and iv.) abnormal behaviour. However, there is little consistency between dimensions and thresholds used in different settings (Slade 1997). The definition of severe mental illness with the widest consensus is that of the National Institute of Mental Health (NIMH) (Schinnar 1990). Their definition is based on three criteria: i.) diagnosis of non‐organic psychosis or personality disorder; ii.) duration characterised as involving 'prolonged illness' and 'long term treatment' and operationalised as a two‐year or longer history of mental illness or treatment; and iii.) disability, which includes dangerous or disturbing social behaviour, moderate impairment in work and non‐work activities, and mild impairment in basic needs (National Institute of Mental Health 1987).
A survey conducted in Europe to calculate prevalence rates of severe mental illness according to the NIMH definition put the total population‐based annual prevalence at approximately 2 per 1000 (Ruggeri 2000).
Description of the intervention
Since the 1960s, there has been an almost worldwide trend towards the closure of institutions for the mentally ill. Coupled with these closures, many government policies have focused on reducing the number of hospital beds for people with severe mental illness in favour of providing care in a variety of non‐hospital settings ‐ outpatient clinics, day centres, or community mental health centres. These changes were consistent with the increasing shift from hospital‐based care in favour of a more community‐focused approach (Malone 2007).
Assertive Community Treatment and Case Management (Table 3) are community‐based packages of care developed in the early 1970s. They were initially conceived to co‐ordinate the care of severely mentally ill people discharged from closing mental hospitals. However, they were soon more widely applied as a means of caring for severely mentally ill people who did not require immediate admission (Thompson 1990).
1. Case Management and Assertive Community Treatment.
|
1. Case Management (CM) The key principle of case management is that a single person ‐ the 'case manager' ‐ takes primary responsibility for a defined group of patients in the community. The case manager is responsible for (Holloway 1991):
Initially, in its simplest form (referred to as 'brokerage'), case managers were not mental health professionals, did not provide any direct care, and worked independently. 2. Assertive Community Treatment (ACT) Assertive Community Treatment should be practiced according to a defined and validated model (Stein 1980), based on the consensus of an international panel of ACT experts (McGrew 1994; McGrew 1995). A key aspect of ACT is that it is a team‐based approach, characteristically a multidisciplinary team including social workers, nurses, and psychiatrists, caring exclusively for a defined group of patients (McGrew 1995; Olfson 1990). Team members share responsibility for their clients, so it is common for several team members to work together in treating the same patient. Other characteristics of ACT are (Stein 1980):
|
Core features of Assertive Community Treatment (ACT) were clearly stated since the first paradigm‐shifting study of Stein and Test (Stein 1980), and successively critical ingredients of ACT have operationally defined by developing fidelity scale (McGrew 1994; McGrew 1995).
Case Management was not likewise defined; brokerage case management was rapidly abandoned in favour of Clinical Case Management (Holloway 1995), and more sophisticated, but poorly defined models were developed. In these models case managers have clinical training, provide at least some clinical services, and operate with low caseloads (Rubin 1992; Solomon 1992).
Assertive Community Treatment and Case Management do share common goals such as maintaining contact, reducing hospitalisation (and hence cost), and improving outcome. However, there are, at least in theory and with respect to the original models, important structural distinctions between them. Nonetheless, across time through clinical practice the two interventions have evolved and tended to converge into a package of care known as Intensive Case Management, which contains elements from the two original models (Burns 2008; Scott 1995). In both clinical trials and clinical practice, what is currently called 'Case Management' is thus likely to contain some elements of ACT practice. These models can be called 'Clinical Case Management', 'Intensive Case Management', and 'Strengths Case Management' (Solomon 1992). However, 'Intensive Case Management' is a broader term often used interchangeably with Assertive Community Treatment but distinguished from it on the grounds that it often lacks one or more ACT programme elements (Burns 2001). Intensive Case Management (ICM) emphasises the importance of small caseload (usually considerably fewer than 20) and high‐intensity input. Intensive case managers are usually clinicians who act as therapist in addition to their case management duties (Marshall 2008).
Until a few years ago, the approaches to care within community mental health teams differed. These approaches (evolved over the last 30 years) fell into two main categories: i.) services with well‐delimited aims, such as crisis resolution and home treatments teams, vocational rehabilitation, and early intervention service; and ii.) services aimed at meeting a wide range of patient needs, such as ACT and Case Management (CM) (merging in the Intensive Case Management model) (Ruggeri 2008).
In the last decade such a distinction has no longer been so relevant. Intensive Case Management partly lost its purity and closeness to the original models (ACT and CM), where many services are offering a less intensive but more flexible and responsive form of assertive outreach (Drukker 2008), investing on the 'critical ingredients' of ICM research helped to identify (Burns 2007) (Killaspy 2012). Many emerging practices are developed within ICM framework, where their aim is to address specific target populations and outcome domains (Bond 2015). Specifically, many specialised models of intervention within community mental health teams are based on adaptation of key principles of ICM, where they are addressing specific population subgroups (difficult to engage in traditional settings, high‐risk and revolving door, with comorbidity) (Brewer 2015). Among these, there are packages of care for homeless populations with severe mental illness (Coldwell 2007); populations with severe mental illness and substance abuse (Pettersen 2014), substance abuse, Kirk 2013 or alcohol dependence only (Gilburt 2012), and early intervention in first‐episode psychosis (Brewer 2015). The recent proliferation of models inspired by ICM that focus on a special issue was permitted by the structure and flexibility of the original ACT model, but exploring this emerging area goes beyond the objectives of this review.
How the intervention might work
The theory behind care in the community is that it enables people to live as independently as possible within their own homes or 'homely settings' out of hospital, because unnecessary hospital care is wasteful, untherapeutic, and stigmatising. It was hoped that living in the community would increase opportunities for people with severe mental illness to achieve their full potential as autonomous members of society (Department of Health 1990). Community care policies are also aimed at promoting choice and independence for people experiencing mental health difficulties.
Intensive Case Management is an intervention at the level of local service organisation. It is a way of organising teams, rather than a specific treatment model (Johnson 2008). Intensive Case Management should provide a mental health service that is a reliable, systematic, flexible, and co‐ordinated care method, addressed to answer the unique combination of health and social care needs of people with severe mental illness. It represents a long‐term intensive approach to the patient in the community (Killaspy 2008), providing a comprehensive range of treatment, rehabilitation, and support services (Scott 1995); in the last decade ICM has absorbed the recovery principle of promoting emancipation, through policies encouraging graduation (Finnerty 2015). Intensive Case Management aims to help people with severe mental illness acquire material resources (such as food, shelter, clothing, and medical care) and to improve their psychosocial functioning; to provide sufficient support to keep the patient involved in community life and to encourage growth towards greater autonomy; to develop coping skills to meet the demands of community life; and to ensure continuity of care among treatment agencies (Stein 1980). Key purposes of ICM are to improve outcome, reduce hospitalisation, and prevent loss of contact with services.
A cornerstone in the research field was a study by Burns and colleagues exploring the mechanism for ICM to be effective (Burns 2007). It suggested that the success of ICM depends on its fidelity to the ACT model (i.e. if a team approach is properly implemented) and on the setting (i.e. it would work better where there is a high baseline level of bed use).
Why it is important to do this review
With the evolution of the original intervention models, there was a need to update and merge two previous relevant Cochrane reviews (Marshall 2000a; Marshall 2000b), and to take into account the findings of work by the same authoring team (Burns 2007). During the last 15 years, not only have intervention models been modified, merged, and become more difficult to distinguish in practice, but also research has been more widespread, with new studies evaluating these approaches outside of the USA.
Since early 2000, ICM has been a very implemented and widespread intervention in the community care setting, with many nations in Europe, North America, and Australia, investing great efforts and resources in its promotion and dissemination (in England Care Programme Approach promoting ACT team (Department of Health 1999)).
Since then, research providing long‐term follow‐up outcomes and data on the impact of ACT teams on inpatient service use in specific national settings has been published with emerging data casting doubt on the opportunity of such an initial enthusiastic approach, especially in England, one of the nations where there had been stronger investments in it (Glover 2006). This topic is therefore still under an international debate (Burns 2009; Burns 2010; Burns 2012; Killaspy 2012; Rosen 2013). Almost in the same years (since the mid‐2000s), ICM landed in Asia, where the idea of comprehensive community programmes is gradually catching on, and wide implementation of both programs has inspired programmes highly faithful to ICM (Low 2013; Nishio 2014).
The effects of the currently implemented packages of care in different settings should be fully understood across a range of outcomes.
Objectives
To assess the effects of ICM as a means of caring for severely mentally ill people in the community in comparison with non‐ICM (caseload greater than 20) and with standard community care. We did not distinguish between models of ICM. In addition, to assess whether the effect of ICM on hospitalisation (mean number of days per month in hospital) is influenced by the intervention's fidelity to the ACT model and by the rate of hospital use in the setting where the trial was conducted (baseline level of hospital use).
Methods
Criteria for considering studies for this review
Types of studies
We considered all relevant randomised controlled trials, and economic evaluations conducted alongside included randomised controlled trials. We excluded quasi‐randomised studies, such as those allocating by alternate days of the week. Where trials were described in some way as to suggest or imply that the study was randomised and where the demographic details of each group's participants were similar, we included these trials and undertook a Sensitivity analysis.
Types of participants
We required the majority of participants to be:
within the age range of 18 to 65 years;
suffering from severe mental illness, preferably as defined by National Institute of Mental Health 1987, or in the absence of this, from illness such as schizophrenia, schizophrenia‐like disorders, bipolar disorder, depression with psychotic features or/and personality disorder; and
not acutely ill.
We did not consider substance abuse to be a severe mental disorder in its own right, however studies were eligible if they dealt with people with both diagnoses, that is those with severe mental illness plus substance abuse. Dementia and mental retardation are not considered to be severe mental disorders, hence we excluded studies focusing on these populations. We considered only participants treated in the community care setting.
Types of interventions
We considered only interventions and management packages not focused primarily on alternatives to acute hospital admission.
1. Intensive Case Management
We defined Intensive Case Management as where the majority of people received:
a. a package of care shaped on the:
Assertive Community Treatment model, being based on the Treatment in Community Living, Assertive Community Treatment (Stein 1980);
Assertive Outreach model (Witheridge 1982; Witheridge 1991) (i.e. multidisciplinary team‐based approach, practising 'assertive outreach', offering 24‐hour emergency cover, providing care themselves) (McGrew 1995); or
Case Management model (Intagliata 1982), however described as such in the trial report.
b. with a caseload up to and including 20 people.
2. Non‐Intensive Case Management
We defined non‐Intensive Case Management as where the majority of people received:
a. a package of care shaped on the:
Assertive Community Treatment model, being based on the Treatment in Community Living, Assertive Community Treatment (Stein 1980);
Assertive Outreach model (Witheridge 1982; Witheridge 1991) (i.e. multidisciplinary team‐based approach, practising 'assertive outreach', offering 24‐hour emergency cover, providing care themselves) (McGrew 1995); or
Case Management model (Intagliata 1982), however described as such in the trial report.
b. with a caseload over 20 people.
3. Standard care
We defined standard care as where the majority of people received a community or outpatient model of care not specifically shaped on either the model of Assertive Community Treatment and Case Management, and not working within a designated named package or approach to care. If data were available on the standard care caseload, we undertook a final sensitivity analysis testing how prone the primary outcomes were to change when trials comparing Intensive Case Management with standard community care only (caseload greater than 20) were included.
Types of outcome measures
We grouped outcomes by time into short term (up to and including 6 months), medium term (7 months to up to and including 12 months), and long term (over 12 months). Where available, 24 months was the preferred follow‐up point for calculating mean days per months in hospital. If more than one follow‐up point within the same period was available, we reported the latest one. During this period, participants remained allocated in their trial arm.
We grouped outcomes assessed after active intervention was stopped or after participants could choose to which arm they were transferred, by time into short‐term follow‐up (up to and including one year), medium‐term follow‐up (from one to five years), and long‐term follow‐up (over five years). We calculated follow‐up length as time since intervention stopped.
To simplify distinguishing between outcomes assessed during and after the active intervention, we entered ones explicitly reporting follow‐up (FUP) length.
Primary outcomes
1. Service use
1.1 Hospitalisation: mean number of days per month in hospital 1.2 Not remaining in contact with psychiatric services
Secondary outcomes
1. Service use
1.1 Admitted to hospital 1.2 Hospital admission rate 1.3 Use of services outside of mental health provision (i.e. emergency services)
2. Adverse effects
2.1 Death ‐ all causes and suicide
3. Global state
3.1 Leaving the study early (lost to follow‐up) 3.2 Relapse (as defined in trial) 3.3 Not improved to a clinically meaningful extent (as defined in trial) 3.4 Not improved 3.5 Average endpoint score 3.6 Average change score 3.7 Compliance with medication 3.8 Average endpoint score 3.9 Average change score
4. Social functioning
4.1 Contact with legal system (i.e. police contacts, arrests, imprisonments) 4.2 Employment status (number unemployed at end of study) 4.3 Accommodation status (number homeless or not living independently during or at the end of the study, mean days homeless and mean days in stable accommodation per month in study) 4.4 Alcohol use 4.5 Illicit drug use 4.6 Average endpoint score 4.7 Average change score
5. Mental state
5.1 General symptoms 5.1.1 Not improved to a clinically meaningful extent (as defined in trial) 5.1.2 Not improved 5.1.3 Average endpoint score 5.1.4 Average change score
5.2 Specific symptoms 5.2.1 Positive symptoms (delusions, hallucinations, disordered thinking) 5.2.1.1 Not improved to a clinically meaningful extent (as defined in trial) 5.2.1.2 Not improved 5.2.1.3 Average endpoint score 5.2.1.4 Average change score
5.2.2 Negative symptoms (poor volition, poor self care, blunted affect) 5.2.2.1 Not improved to a clinically meaningful extent (as defined in trial) 5.2.2.2 Not improved 5.2.2.3 Average endpoint score 5.2.2.4 Average change score
5.2.3 Mood depression 5.2.3.1 Not improved to a clinically meaningful extent (as defined in trial) 5.2.3.2 Not improved 5.2.3.3 Average endpoint score 5.2.3.4 Average change score
6. Behaviour
6.1 General behaviour 6.2 Not improved to a clinically meaningful extent (as defined in trial) 6.3 Not improved 6.4 Average endpoint score 6.5 Average change score 6.6 Specific behaviours (i.e. self harm; injury to others or property)
7. Quality of life
7.1 Not improved to a clinically meaningful extent (as defined in trial) 7.2 Not improved 7.3 Average endpoint score 7.4 Average change score
8. Satisfaction
8.1 Participant satisfaction 8.1.1 Not improved to a clinically meaningful extent (as defined in trial) 8.1.2 Not improved 8.1.3 Average endpoint score 8.1.4 Average change score
8.2 Carer satisfaction 8.2.1 Not improved to a clinically meaningful extent (as defined in trial) 8.2.2 Not improved 8.2.3 Average endpoint score 8.2.4 Average change score
9. Costs
9.1 Direct costs of psychiatric hospital care 9.2 Direct healthcare costs (including all medical and psychiatric care and the costs of case management, but excluding accommodation other than hospital care) 9.3 Direct costs of all care (including costs of accommodation and subtracting benefits, such as earnings, where these are known)
Summary of findings
We used the GRADE approach to interpret findings, Schünemann 2008, and GRADEpro, GRADEpro, to import data from Review Manager 5, Review Manager, to create 'Summary of findings' tables. These tables provide outcome‐specific information concerning the overall quality of evidence from each included study in the comparison, the magnitude of effect of the interventions examined, and the sum of available data on all outcomes we rated as important to patient care and decision making. We selected the following main outcomes for inclusion in the 'Summary of findings' table.
Service use: average number of days in hospital per month by about 24 months
Service use: average number of admissions (skewed data ‐ sample size ≥ 200) by long term (> 12 months)
Adverse event: death ‐ suicide by long term (> 12 months)
Global state: relapse
Global state: leaving the study early by long term (> 12 months)
Social functioning: employment status – spent less than 1 day employed ‐ by medium term (6 to 12 months)
Mental state: not improved to an important extent
Search methods for identification of studies
Electronic searches
1. Cochrane Schizophrenia Group’s Trials Register
On 10 April 2015, the Information Specialist searched the Register using the following search strategy:
(*ca?e manag* OR *cpa* OR *community treat* OR *community team* OR *community cent* OR *community care* OR *madison model* OR *outreach* OR *hostel* OR *aftercare* OR *residential* OR *housing* OR *transitional* OR *post?hospital* OR *partial hospitali?ation* OR *foster* OR *guardianship* OR *daily living program* OR *crisis interven* OR *early interven* OR *ambulatory* OR *community liv* OR *social support* OR *patient care team* OR *community mental health* OR *patient participation* OR *drop?in* OR *day hospital* OR *day care* OR *day treat* OR *day cent* OR *day unit* OR *intensive care* OR *intensive interven* OR *intensive treat* OR *intensive therap* OR *intensive manag* OR *intensive model* OR *intensive program* OR *intensive team* OR *intensive service* OR *mobile care* OR *mobile interven* OR *mobile treat* OR *mobile therap* OR *mobile manag* OR *mobile model* OR *mobile program* OR *mobile team* OR *mobile service* OR *community interven* OR *community therap* OR *community manag* OR *community model* OR *community program* OR *community service* OR *community base* OR *home care* OR *home interven* OR *home treat* OR *home therap* OR *home manag* OR *home model* OR *home program* OR *home team* OR *home service* OR *home base* OR *broker* OR *care program*) in Title, Abstract, and Index Terms of REFERENCE OR (*ca?e manag* OR *community* OR *outreach* OR *hostel* OR *aftercare* OR *residential* OR *hous* OR *transitional* OR *foster* OR *crisis interven* OR *early interven* OR *ambul* OR *social support* OR *drop‐in* OR *day * OR *(intensive)* OR *(home)* OR *care program*) in Intervention of STUDY
The Cochrane Schizophrenia Group’s Register of Trials is compiled by systematic searches of major resources (including MEDLINE, Embase, AMED, BIOSIS, CINAHL, PsycINFO, PubMed, and registries of clinical trials) and their monthly updates, handsearches, grey literature, and conference proceedings (see Group Module). There is no language, date, document type, or publication status limitations for inclusion of records into the register.
For search methods of previous versions of this review, please see Appendix 1.
Searching other resources
References
Should an included or excluded study suggest that another study was relevant, we identified the reference and acquired the full text.
Personal contact
We contacted authors of trials for additional data where required. We did not systematically contact all authors for additional papers.
Data collection and analysis
Methods used for this version are presented below; previous methods are presented in Appendix 2.
Selection of studies
Two review authors (HB, MK) inspected results of the update search and identified potentially relevant reports. Disagreements were resolved by discussion, or where there was still doubt, we aquired the full article for further inspection. We obtained the full articles of relevant reports for reassessment and inspected them carefully to decide on inclusion or exclusion (see Criteria for considering studies for this review). Review authors were not blinded to the names of the authors, institutions, or journal of publication. Where difficulties or disputes arose, we discussed; if we were unable decide, we added these studies to those awaiting assessment and contacted the authors of the papers for clarification.
Data extraction and management
1. Extraction
1.1 Data extraction for criteria and outcomes
Three review authors (MD, HB, MK) independently extracted data from the included studies and compared results of the data extraction. We would have discussed any disagreements, documented our decisions, and contacted the authors of studies for clarification where necessary. Whenever possible, we would have extracted data presented only in graphs and figures and included the data if two review authors independently reached the same result. In order to obtain any missing information or for clarification, we attempted to contact authors through an open‐ended request. Where possible, we would have extracted data relevant to each component centre of multicentre studies separately.
1.2 Additional data extraction
1.2.1 Fidelity
We rated fidelity of the ICM intervention to ACT on the 'team membership' and 'team structure and organisation' subscales of the Index of Fidelity to Assertive Community Treatment (IFACT) (McGrew 1994). This index was derived from a survey of 20 clinical experts in ACT and validated in a survey of 18 programmes.
a. The 'team membership' subscale comprises four items:
ratio of patients to staff;
total size of team;
extent of psychiatric input;
extent of nursing input to the team.
b. The 'structure and organisation' subscale comprises seven items, whether the team is:
the primary source of care for its patients;
situated away from the hospital;
meets daily;
shares responsibility for caseloads;
is available 24 hours a day;
has a team leader who is also a case manager;
offers unlimited time for its services.
We chose IFACT because the subscales are brief and can be completed from published or unpublished text. For each item on the index, a score of 1 indicates high fidelity to the model. Score ranges from 0 to 11, where the maximum score available on the 'team membership' subscale is 4 and on the 'structure and organisation' subscale is 7, with higher scores indicating higher fidelity to the model.
We obtained fidelity data from published and unpublished trial reports, direct contact with trialists, and data previously obtained directly from trialists reported by previous reviews (Burns 2001; Burns 2007; Catty 2002). Two raters (MD and CBI) independently combined these data into a single fidelity score. Multicentre trials of ICM often struggle to implement a uniform approach, with centres operating at differing degrees of fidelity. Where possible, we rated each component centre separately.
1.2.2 Baseline hospital use
We extracted data relating to the average number of days per month in hospital for all participants in the two years before the study began. We obtained this data from published and unpublished trial reports and from direct contact with trialists.
1.2.3 Service use: hospitalisation
We obtained the primary outcome mean number of days per month in hospital for the included studies from published and unpublished trial reports, direct contact with trialists, and data previously obtained directly from trialists reported by a previous review (Burns 2007).
2. Management
2.1 Forms
Two review authors (HB, MK) extracted data onto simple, standard forms.
2.2 Data from multicentre trials
For the original version, where possible review authors MD and CBI verified independently calculated centre data against original trial reports.
2.3 Scale‐derived data
We included continuous data from rating scales only if: a. the psychometric properties of the measuring instrument had been described in a peer‐reviewed journal (Marshall 2000); b. the measuring instrument was not written or modified by one of the trialists for that particular trial; and c. the measuring instrument was either i.) a self report or ii.) completed by an independent rater or relative.
2.3 Endpoint versus change data
Both endpoint and change data have advantages. Change data can remove a component of between‐person variability from the analysis. On the other hand, calculation of change needs two assessments (baseline and endpoint), which can be difficult in unstable and difficult‐to‐measure conditions such as schizophrenia. We decided to primarily use endpoint data, and only use change data if the former were not available. When relevant, we combined endpoint and change data in the analysis, as we aimed to use mean differences rather than standardised mean differences throughout (Higgins 2011).
2.4 Skewed data
Continuous data on clinical and social outcomes are often not normally distributed. To avoid the pitfall of applying parametric tests to non‐parametric data, we applied the following standards to relevant continuous data before inclusion.
We entered all relevant data from studies of more than 200 participants in the analysis irrespective of the following rules, because skewed data pose less of a problem in large studies. We also entered all relevant change data, as when continuous data are presented on a scale that includes a possibility of negative values (such as change data), it is difficult to tell whether data are skewed or not.
For endpoint data from studies of fewer than 200 participants, we used the following methods.
a. If a scale started from the finite number zero, we subtracted the lowest possible value from the mean, and divided this by the standard deviation (SD). If this value is lower than 1, it strongly suggests a skew, and we excluded these data. If this ratio is higher than 1 but below 2, there is suggestion of skew. We entered these data to test whether their inclusion or exclusion changed the results substantially. Finally, if the ratio was larger than 2, we included these data, because skew is less likely (Altman 1996; Higgins 2011).
b. If a scale starts from a positive value (such as the Positive and Negative Syndrome Scale (PANSS), which can have values from 30 to 210) (Kay 1986), we modified the calculation described above to take the scale starting point into account. In these cases skew is present if 2 SD > (S ‐ S min), where S is the mean score and 'S min' is the minimum score.
Exception to above rules ‐ mean number of days in hospital
We implemented one exception to the above rules in order to present more data, recognising that this is a post hoc decision, but also that the rules with regards to management of skewed data and how robust skewed data are within meta‐analysis are unclear (Higgins 2011). Where mean number of days in hospital data were skewed, and they were provided by studies of fewer than 200 participants, we entered those data into a subgroup of the overall analysis. We also presented the overall effect from all data pooled.
2.5 Common measure
To facilitate comparison between trials, we converted variables that can be reported in different metrics, such as days in hospital (mean days per year, per week, or per month) to a common metric (e.g. mean days per month).
2.6. Conversion of continuous to binary
Where possible, we attempted to convert outcome measures to dichotomous data. This can be done by identifying cutoff points on rating scales and dividing participants accordingly into 'clinically improved' or 'not clinically improved'. It was generally assumed that if there had been a 50% reduction in a scale‐derived score such as the Brief Psychiatric Rating Scale (BPRS), in Overall 1962, or the PANSS (Kay 1986), this could be considered to be a clinically significant response (Leucht 2005a; Leucht 2005b). If data based on these thresholds were not available, we used the primary cutoff presented by the original authors.
2.7. Direction of graphs
Where possible, we entered data in such a way that the area to the left of the line of no effect indicated a favourable outcome for ICM.
Assessment of risk of bias in included studies
For this version of the review, two review authors (HB, MK) assessed risk of bias of all new included studies using the tool described in the Cochrane Handbook for Systematic Reviews of Interventions (Higgins 2011).
This set of criteria is based on evidence of associations between overestimate of effect and high risk of bias of the article such as sequence generation, allocation concealment, blinding, incomplete outcome data, and selective reporting.
If the raters had disagreed, we planned to make the final rating by consensus. Where inadequate details of randomisation and other characteristics of trials were provided, we contacted the authors of the studies to obtain further information. We would have reported non‐concurrence in quality assessment, and if disputes had arisen as to which category a trial was to be allocated, again, we would have resolved this by discussion.
We noted the level of risk of bias in Risk of bias in included studies, Table 1, Table 2, and Figure 1.
1.
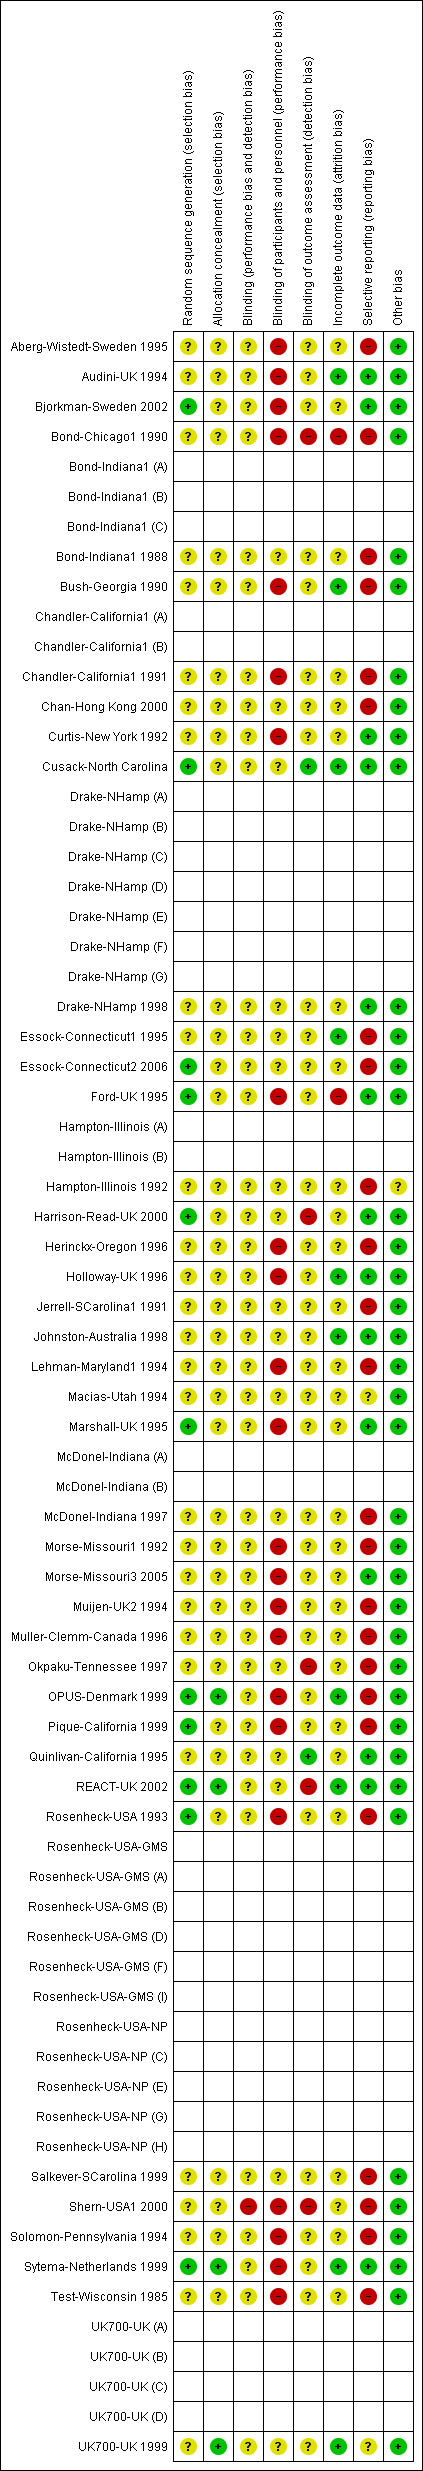
Methodological quality summary: review authors' judgements about each methodological quality item for each included study.
Measures of treatment effect
1. Binary data
For binary outcomes, we calculated a standard estimation of the random‐effects risk ratio (RR) and its 95% confidence interval. It has been shown that RR is more intuitive than odds ratios (OR), and that clinicians tend to interpret ORs as RR (Boissel 1999; Deeks 2000). Within the 'Summary of findings' table, we aimed to calculate the lowest control risk applied to all data. We assumed the same for the highest‐risk groups. We used the 'Summary of findings' table to calculate absolute risk reduction for primary outcomes.
2. Continuous data
For continuous outcomes, we estimated the mean difference between groups. We preferred not to calculate effect size measures (standardised mean difference). However, if in future versions of this review scales of very considerable similarity are used, we will presume there is a small difference in measurement and will calculate effect size and transform the effect back to the units of one or more of the specific instruments.
Unit of analysis issues
1. Cluster trials
Studies increasingly employ 'cluster randomisation' (such as randomisation by clinician or practice), but analysis and pooling of clustered data pose problems. Firstly, authors often fail to account for intraclass correlation in clustered studies, leading to a 'unit of analysis' error (Divine 1992), whereby P values are spuriously low, confidence intervals unduly narrow, and statistical significance overestimated. This causes type I errors (Bland 1997; Gulliford 1999).
Where clustering is not accounted for in primary studies, we would present data in a table, with a (*) symbol to indicate the presence of a probable unit of analysis error. If we find such studies in subsequent versions of this review, we will attempt to contact first authors of studies to obtain intraclass correlation coefficients for their clustered data and to adjust for this by using accepted methods (Gulliford 1999). Where clustering has been incorporated into the analysis of primary studies, we would present these data as if from a non‐cluster randomised study, but adjust for the clustering effect.
We have sought statistical advice and have been advised that the binary data as presented in a report should be divided by a 'design effect'. This is calculated using the mean number of participants per cluster (m) and the intraclass correlation coefficient (ICC) [Design effect = 1 + (m ‐ 1)*ICC] (Donner 2002). If the ICC is not reported, we would assume it to be 0.1 (Ukoumunne 1999).
If cluster studies have been appropriately analysed taking into account intraclass correlation coefficients, and relevant data documented in the report, synthesis with other studies would be possible using the generic inverse variance technique.
2. Cross‐over trials
A major concern of cross‐over trials is the carry‐over effect, which occurs if an effect (e.g. pharmacological, physiological, or psychological) of the treatment in the first phase is carried over to the second phase. As a consequence, on entry to the second phase the participants can differ systematically from their initial state despite a wash‐out phase. For the same reason, cross‐over trials are not appropriate if the condition of interest is unstable (Elbourne 2002). As both effects are very likely in severe mental illness, we only used data from the first phase of cross‐over studies.
3. Studies with multiple treatment groups
Where a study involved more than two treatment arms, we presented the additional treatment arms in comparisons if relevant. Where the additional treatment arms were not relevant, we did not reproduce these data.
Dealing with missing data
1. Overall loss of credibility
At some degree of loss of follow‐up data loses credibility (Xia 2009). For any particular outcome, should more than 50% of data be unaccounted for, we did not reproduce these data or use them within analyses. If, however, more than 50% of participants in one arm of a study were lost, but the total loss was less than 50%, we marked such data with (*) to indicate that such a result may well be prone to bias.
2. Binary
Where attrition for a binary outcome was between 0 and 50%, and where these data were not clearly described, we presented data on a 'once‐randomised‐always‐analyse' basis (an intention‐to‐treat analysis). We assumed all those leaving the study early to have the same rates of negative outcome as those who completed, with the exception of the outcome of death. We undertook a Sensitivity analysis testing how prone the primary outcomes were to change when we compared data from only those who completed the study with intention‐to‐treat data using the assumption outlined above.
Where number of deaths was more than 10% of the sample overall, we applied the above statement but did not impute attrition due to death.
3. Continuous
3.1 Attrition
Where attrition for a continuous outcome was between 0 and 50%, and data from only those who completed the study were reported, we reproduced these.
3.2 Standard deviations
3.2.1 General
Where there were missing measures of variance for continuous data, but exact standard errors or confidence intervals for group means, or either ‘P’ or 't' values for differences in means, we calculated standard deviation value according to the method described in Section 7.7.3 of the Cochrane Handbook for Systematic Reviews of Interventions (Higgins 2011). If standard deviations were not reported and could not be calculated from the available data, we asked authors to supply the data. In the absence of data from authors, we used the mean standard deviation from other studies.
3.2.2 Standard deviation mean number of days per month in hospital
For the primary outcome mean number of days per month in hospital, if standard deviations were not reported and could not be calculated from available data, we asked the authors for additional information. In the absence of data from authors, we imputed the missing standard deviations using a regression analysis of SD against mean from those trials that provided both. We documented in what studies we imputed SDs according to the above technique in Table 4.
2. Average number of days in hospital per month ‐ at about 24 months ‐ entering meta‐regression.
| Intensive Case Management versus standard care | ICM | ICM | ICM | SC | SC | SC | Note |
| Study ID | Mean | SD | Total | Mean | SD | Total | |
| Audini‐UK 1994 | 0.95 | 2.84* | 33 | 0.93 | 2.03* | 33 | *SD imputed |
| Bjorkman‐Sweden 2002 | 0.83 | 3.13 | 33 | 2.15 | 4.13 | 44 | |
| Bond‐Chicago1 1990 | 3.22 | 4.55 | 42 | 5.3 | 5.42 | 40 | |
| Bond‐Indiana1 (A) | 1.28 | 3.17* | 29 | 7.72 | 8.99* | 32 | *SD imputed |
| Bond‐Indiana1 (B) | 2.72 | 4.54* | 34 | 3.62 | 5.24* | 30 | *SD imputed |
| Bond‐Indiana1 (C) | 0.05 | 1.89* | 21 | 3.38 | 4.98* | 21 | *SD imputed |
| Chandler‐California1 (A) | 0.47 | 2.34* | 102 | 0.78 | 1.84* | 101 | *SD imputed |
| Chandler‐California1 (B) | 0.67 | 2.55* | 115 | 0.96 | 2.07* | 114 | *SD imputed |
| Curtis‐New York 1992 | 1.77 | 1.79 | 146 | 1.02 | 1.18 | 143 | |
| Ford‐UK 1995 | 3.07 | 6.9 | 39 | 1.76 | 3.67 | 38 | |
| Hampton‐Illinois (A) | 1.75 | 3.63* | 48 | 4.83 | 6.49* | 47 | *SD imputed |
| Hampton‐Illinois (B) | 3.25 | 5.01* | 34 | 3.42 | 5.02* | 36 | *SD imputed |
| Holloway‐UK 1996 | 2.4 | 5.1 | 34 | 1.2 | 3 | 26 | |
| Jerrell‐SCarolina1 1991 | 0.53 | 2.40* | 40 | 0.8 | 1.86* | 40 | *SD imputed |
| Lehman‐Maryland1 1994 | 3.04 | 5.15 | 77 | 5.41 | 7 | 75 | |
| Marshall‐UK 1995 | 1.04 | 2.18 | 40 | 1.56 | 4.45 | 40 | |
| Muijen‐UK2 1994 | 2.53 | 5.55 | 41 | 2.45 | 5.83 | 41 | |
| Muller‐Clemm‐Canada 1996 | 1.68 | 3.56* | 61 | 1.63 | 2.93* | 57 | *SD imputed |
| OPUS‐Denmark 1999 | 5.11 | 7.7 | 263 | 6.57 | 8.73 | 244 | |
| Quinlivan‐California 1995 | 1.09 | 2.65 | 30 | 5.53 | 8.65 | 30 | |
| Rosenheck‐USA‐GMS (A) | 3.63 | 3.89 | 44 | 3.71 | 2.76 | 35 | |
| Rosenheck‐USA‐GMS (B) | 6.99 | 4.85 | 47 | 4.23 | 5.18 | 47 | |
| Rosenheck‐USA‐NP (C) | 18.52 | 11.16 | 50 | 19.16 | 12.19 | 43 | |
| Rosenheck‐USA‐GMS (D) | 2.8 | 3.31 | 49 | 3.26 | 3.98 | 53 | |
| Rosenheck‐USA‐NP (E) | 4.13 | 5.24 | 34 | 3.05 | 4.61 | 33 | |
| Rosenheck‐USA‐GMS (F) | 2.39 | 3.16 | 43 | 2.58 | 2.45 | 35 | |
| Rosenheck‐USA‐NP (G) | 7.68 | 7.72 | 40 | 12.2 | 10.65 | 31 | |
| Rosenheck‐USA‐NP (H) | 4.63 | 8.58 | 59 | 11.21 | 13.38 | 55 | |
| Rosenheck‐USA‐GMS (I) | 5.62 | 4.67 | 44 | 7.8 | 6.63 | 44 | |
| Sytema‐Netherlands 1999 | 3.4 | 5.4 | 58 | 4.3 | 7.3 | 57 | |
| Test‐Wisconsin 1985 | 0.42 | 2.29* | 72 | 2.13 | 3.54* | 41 | *SD imputed |
| Intensive Case Management versus non‐Intensive Case Management | ICM | ICM | ICM | Non‐ICM | Non‐ICM | Non‐ICM | Note |
| Study ID | Mean | SD | Total | Mean | SD | Total | |
| Bush‐Georgia 1990 | 1.58 | 3.46* | 14 | 2.39 | 3.85* | 14 | *SD imputed |
| Drake‐NHamp (A) | 0.5 | 0.94 | 7 | 2.17 | 3.21 | 9 | |
| Drake‐NHamp (B) | 0.85 | 1.43 | 16 | 1.41 | 2.06 | 14 | |
| Drake‐NHamp (C) | 2.28 | 3.2 | 10 | 1.67 | 3.84 | 12 | |
| Drake‐NHamp (D) | 1.04 | 2.44 | 13 | 0.63 | 0.91 | 11 | |
| Drake‐NHamp (E) | 1.08 | 4.15 | 30 | 1.39 | 2.36 | 27 | |
| Drake‐NHamp (F) | 1.66 | 4.49 | 10 | 0.84 | 2.33 | 13 | |
| Drake‐NHamp 1998 G | 2.05 | 3.06 | 9 | 0.87 | 0.92 | 8 | |
| Essock‐Connecticut1 1995 | 2.87 | 7.82 | 130 | 4.3 | 9.52 | 132 | |
| Essock‐Connecticut2 2006 | 0.64 | 1.9 | 99 | 0.72 | 1.3 | 99 | |
| Harrison‐Read‐UK 2000 | 2.94 | 5.74 | 97 | 3.76 | 5.83 | 96 | |
| Johnston‐Australia 1998 | 4.0 | 5.75 | 35 | 3.08 | 4.3 | 33 | |
| McDonel‐Indiana (A) | 3.15 | 7.1 | 61 | 1.43 | 2.91 | 64 | |
| McDonel‐Indiana (B) | 1.22 | 3.66 | 14 | 0.58 | 1.29 | 17 | |
| Quinlivan‐California 1995 | 1.09 | 2.65 | 30 | 2.8 | 4.74 | 30 | |
| REACT‐UK 2002 | 9.0 | 8.9 | 124 | 8.0 | 7.8 | 119 | |
| Salkever‐SCarolina 1999 | 1.12 | 3.01* | 91 | 1.3 | 2.51* | 53 | *SD imputed |
| UK700‐UK (A) | 3.08 | 5.77 | 94 | 2.64 | 3.49 | 95 | |
| UK700‐UK (B) | 3.2 | 4.79 | 77 | 3.16 | 4.97 | 73 | |
| UK700‐UK (C) | 3.29 | 5.41 | 76 | 2.48 | 4.71 | 75 | |
| UK700‐UK (D) | 2.74 | 4.69 | 91 | 3.79 | 5.22 | 98 |
ICM: Intensive Case Management SC: standard care SD: standard deviation Study ID: Study identification name
3.3 Last observation carried forward
We anticipated that in some studies the method of last observation carried forward (LOCF) would be employed within the study report. As with all methods of imputation to deal with missing data, LOCF introduces uncertainty about the reliability of the results. Therefore, where LOCF data had been used in the trial, if less than 50% of the data had been assumed, we reproduced these data and indicated that they were the product of LOCF assumptions.
3.4 Incomplete data for meta‐regression
We anticipated that in some cases not all IFACT score variables would be available. If we could not calculate IFACT score from the available data, we imputed it by multiple imputation using the Multiple Imputation with Diagnostics (mi) library in R (R 2008). As explained above, we only made these assumptions if we were able to directly rate over 50% of the data. We documented in what studies we calculated IFACT score according to the above technique in Table 5.
3. Covariates entering meta‐regression.
| Intensive Case Management versus standard care | Baseline hospital use | Baseline hospital use | IFACT | IFACT | IFACT | Note |
| Study ID | Mean | Total | Total score | Organisation subscale score | Staff subscale score | |
| Audini‐UK 1994 | 1.08 | 66 | 6.7 | 3.5 | 3.2 | |
| Bjorkman‐Sweden 2002 | 5.63 | 77 | 7 | 4.5 | 2.5 | |
| Bond‐Chicago1 1990 | 7.83 | 88 | 6 | 4 | 2 | |
| Bond‐Indiana1 (A) | 14.17 | 61 | 9.2 | 7 | 2.2 | |
| Bond‐Indiana1 (B) | 4.95 | 64 | 2.2 | 1 | 1.2 | |
| Bond‐Indiana1 (C) | 10.86 | 42 | 7.4 | 5 | 2.4 | |
| Chandler‐California1 (A) | 0.5 | 203 | 8.5 | 5 | 3.5 | |
| Chandler‐California1 (B) | 1.14 | 229 | 6.6 | 5 | 1.6 | |
| Curtis‐New York 1992 | 0.95* | 289 | 5.8 | 3.5 | 2.3 | *Mean imputed |
| Ford‐UK 1995 | 2.61 | 77 | 4.8 | 2 | 2.8 | |
| Hampton‐Illinois (A) | 5.6 | 95 | 6 | 4 | 2 | |
| Hampton‐Illinois (B) | 5.2 | 70 | 5 | 3 | 2 | |
| Holloway‐UK 1996 | 7.37 | 70 | 9.3 | 6 | 3.3 | |
| Jerrell‐SCarolina1 1991 | 2.85 | 80 | 8.8 | 5.5 | 3.3 | |
| Lehman‐Maryland1 1994 | 4.94* | 152 | 11 | 7 | 4 | *Mean imputed |
| Marshall‐UK 1995 | 3.31* | 80 | 4.9 | 4 | 0.9 | *Mean imputed |
| Muijen‐UK2 1994 | 8.43* | 82 | 5.4 | 3 | 2.4 | *Mean imputed |
| Muller‐Clemm‐Canada 1996 | 4.07 | 123 | 6.2 | 4 | 2.2 | |
| OPUS‐Denmark 1999 | NA | 547 | 8 | 4 | 4 | *Baseline hospital use: not applicable as first episode |
| Quinlivan‐California 1995 | 4.50* | 60 | 6.4 | 4 | 2.4 | *Mean imputed |
| Rosenheck‐USA‐GMS (A) | 3.96 | 79 | 6 | 2 | 4 | |
| Rosenheck‐USA‐GMS (B) | 5.83 | 94 | 3.8 | 2 | 1.8 | |
| Rosenheck‐USA‐NP (C) | 19.8 | 93 | 7.7 | 5 | 2.7 | |
| Rosenheck‐USA‐GMS (D) | 4.19 | 102 | 7 | 3 | 4 | |
| Rosenheck‐USA‐NP (E) | 5.33 | 67 | 6.4 | 3.5 | 2.9 | |
| Rosenheck‐USA‐GMS (F) | 3.22 | 78 | 6.6 | 3 | 3.6 | |
| Rosenheck‐USA‐NP (G) | 11.42 | 71 | 8.4 | 5 | 3.4 | |
| Rosenheck‐USA‐NP (H) | 11.4 | 114 | 6.4 | 4 | 2.4 | |
| Rosenheck‐USA‐GMS (I) | 8.28 | 88 | 5.8 | 2 | 3.8 | |
| Sytema‐Netherlands 1999 | 12.17* | 118 | 7.6* | 5.1* | 2.5* | *Mean and IFACT score imputed |
| Test‐Wisconsin 1985 | 2.33 | 122 | 8.5 | 5.5 | 3 | |
| Intensive Case Management versus non‐Intensive Case Management | Baseline hospital use | Baseline hospital use | IFACT | IFACT | IFACT | Note |
| Study ID | Mean | Total | Total score | Organisation subscale score | Staff subscale score | |
| Bush‐Georgia 1990 | 3.99 | 28 | 3.1 | 2 | 1.1 | |
| Drake‐NHamp (A) | 2.88 | 19 | 8 | 5 | 3 | |
| Drake‐NHamp (B) | 1.72 | 33 | 3.8 | 3 | 0.8 | |
| Drake‐NHamp (C) | 3.02 | 25 | 8.8 | 5.5 | 3.3 | |
| Drake‐NHamp (D) | 1.78 | 26 | 7.8 | 4.5 | 3.3 | |
| Drake‐NHamp (E) | 2.76 | 66 | 8.5 | 4.5 | 4 | |
| Drake‐NHamp (F) | 2.34 | 22 | 3.5 | 3 | 0.5 | |
| Drake‐NHamp 1998 (G) | 4.1 | 19 | 5 | 2 | 3 | |
| Essock‐Connecticut1 1995 | 2.81* | 262 | 8.5 | 4.5 | 4 | *Mean imputed |
| Essock‐Connecticut2 2006 | 1.08* | 198 | 10* | 7* | 3* | *Mean and IFACT score imputed |
| Harrison‐Read‐UK 2000 | 4.11 | 193 | 7.6 | 4 | 3.6 | |
| Johnston‐Australia 1998 | 3.66 | 71 | 7.3 | 3.5 | 3.8 | |
| McDonel‐Indiana (A) | 4.2 | 152 | 4.2 | 3 | 1.2 | |
| McDonel‐Indiana (B) | 1.16 | 39 | 4.4 | 3 | 1.4 | |
| Quinlivan‐California 1995 | 2.96* | 60 | 6.4 | 4 | 2.4 | *Mean imputed |
| REACT‐UK 2002 | 7.3 | 251 | 10.3 | 6.5 | 3.8 | |
| Salkever‐SCarolina 1999 | 3.06 | 144 | 7 | 5 | 2 | |
| UK700‐UK (A) | 4.55 | 196 | 8.8 | 5 | 3.8 | |
| UK700‐UK (B) | 4.66 | 153 | 4.5 | 3 | 1.5 | |
| UK700‐UK (C) | 4.33 | 158 | 4.2 | 2 | 2.2 | |
| UK700‐UK (D) | 4.59 | 200 | 8.5 | 5 | 3.5 |
Baseline hospital use: average number of days per month in hospital for all participants in the two years before the study began IFACT: Index of Fidelity to Assertive Community Treatment NA: not applicable Study ID: Study identification name
We anticipated that in some cases not all baseline hospital use data would be available. We imputed missing data as for the IFACT scores. As explained above, we only made these assumptions if we were able to directly rate over 50% of the data. We documented for which studies we calculated baseline hospital use data according to the above technique (Table 5).
We undertook a Sensitivity analysis testing how prone the results from meta‐regression were to change when we compared data from only those who completed the studies with the imputed data using the assumption outlined above.
Assessment of heterogeneity
1. Clinical heterogeneity
We considered all included studies initially, without seeing comparison data, to judge clinical heterogeneity. We simply inspected all studies for clearly outlying situations or people that we had not predicted would arise. When such situations or participant groups arose, we discussed these fully.
In addition, we specified two potential sources of heterogeneity a priori (fidelity and baseline level of hospital use) (Data extraction and management). We extracted these data as described above.
2. Methodological heterogeneity
We considered all included studies initially, without seeing comparison data, to judge methodological heterogeneity. We simply inspected all studies for clearly outlying methods that we had not predicted would arise. If such methodological outliers arose, we discussed these fully.
3. Statistical heterogeneity
3.1 Visual inspection
We visually inspected graphs to investigate the possibility of statistical heterogeneity.
3.2 Employing the I2statistic
We investigated heterogeneity between studies by considering the I2 statistic alongside the Chi2 P value. The I2 provides an estimate of the percentage of inconsistency thought to be due to chance (Higgins 2003). The importance of the observed value of I2 depends on i.) magnitude and direction of effects, and ii.) strength of evidence for heterogeneity (e.g. P value from Chi2 test, or a confidence interval for I2). We interpreted an I2 estimate greater than or equal to 50% accompanied by a statistically significant Chi2 statistic, as evidence of substantial levels of heterogeneity (Section 9.5.2; Higgins 2011). When we found substantial levels of heterogeneity in the primary outcome, we explored reasons for the heterogeneity (Subgroup analysis and investigation of heterogeneity).
Assessment of reporting biases
Reporting biases arise when the dissemination of research findings is influenced by the nature and direction of results (Egger 1997). These are described in Chapter 10 of the Cochrane Handbook for Systematic Reviews of Interventions (Higgins 2011). We are aware that funnel plots may be useful in investigating reporting biases but are of limited power to detect small‐study effects. We did not use funnel plots for outcomes where there were 10 or fewer studies, or where all studies were of similar size. In other cases, where funnel plots were possible, we sought statistical advice in their interpretation.
Data synthesis
Where possible, we employed a random‐effects model for analyses. We understand that there is no closed argument for preference for use of fixed‐effect or random‐effects models. The random‐effects method incorporates an assumption that different studies are estimating different, yet related, intervention effects. According to our hypothesis of an existing variation across studies, to be explored further in the meta‐regression analysis, despite being cautious that random‐effects methods do put added weight onto the smaller of the studies, we favoured using random‐effects model.
Subgroup analysis and investigation of heterogeneity
1. Subgroup analyses
We anticipated conducting two subgroup analyses. For the first version of the protocol for this review, we did not anticipate any subgroup analyses. On further consideration, we now realise that analysis at separate time periods could be thought of as subgroups. The second subgroup is within the primary outcome and relates to skewed and non‐skewed data. We introduced this late into the protocol, and it could be considered post hoc. However, we are also aware that our original rule for management of these data could be considered overly cautious and result in some important data not being presented (Higgins 2011).
2. Investigation of heterogeneity
2.1 Anticipated heterogeneity ‐ outcome of mean days per month in hospital
Investigation of heterogeneity formed part of the secondary objectives of the review. We hypothesised that the effect of ICM on one of our primary outcomes (mean number of days per month in hospital) differs according to fidelity of intervention to the ACT model and the baseline level of hospital use.
We examined the association of the IFACT score and the baseline number of days in hospital with the treatment effect by performing random‐effects meta‐regression analysis in R (R 2008). The script we used to perform meta‐regression analyses is reported in Appendix 3. We also carried out meta‐regression using both variables within the same model. In addition, we examined the relationship between the treatment effect and the two variables using a thin plate spline. If possible, we aimed to enter data from multicentre studies in the meta‐regression disaggregated into the component centre with outcome and fidelity data for each.
Meta‐regression was performed only if at least 10 studies per comparison were available (Higgins 2011). rWe also tested comparison type as an additional regressor in the model.
2.2 Unanticipated heterogeneity ‐ other outcomes
2.2.1 For outcomes other than the second primary outcome (not remaining in contact with psychiatric services)
We reported if inconsistency was high and undertook no exploration.
2.2.2 For outcome 'not remaining in contact with psychiatric services'
We reported if inconsistency was high. First we investigated whether data had been entered correctly. Second, if data was correct, we visually inspected the graph and successively removed studies outside of the company of the rest to see if homogeneity was restored. Should this occur with no more than 10% of the data being excluded, we presented the data. If not, these data were not pooled.
Should unanticipated clinical or methodological heterogeneity have been obvious, we simply stated hypotheses regarding these for future reviews or versions of this review. We did not anticipate undertaking analyses relating to these.
Sensitivity analysis
1. Implication of randomisation
We aimed to include trials in a sensitivity analysis if they were described in some way as to imply randomisation. For the primary outcomes, we included these studies, and if there was no substantive difference when the implied randomised studies were added to those with a better description of randomisation, then we employed all data from these studies.
2. Standard‐care caseload
If data were available, we undertook a sensitivity analysis testing how prone the primary outcomes were to change when trials comparing ICM to standard community care caseload less than or equal to 20 were compared with trials comparing ICM to standard community care caseload greater than 20. If there was a substantial difference, we reported the results and discussed them but continued to pool the data.
3. Assumptions for lost binary data
Where we needed to make assumptions regarding participants lost to follow‐up (see Dealing with missing data), we compared the findings of the primary outcomes when we used our assumption compared with completer data only. If there was a substantial difference, we reported the results and discussed them but continued to employ our assumption.
4. Assumptions for incomplete data for meta‐regression
Where we needed to make assumptions regarding missing SDs data in studies entering meta‐regression (see Dealing with missing data), we compared the findings of the meta‐regression on our primary outcome when we used our assumption compared with data taken from only those who completed the studies. We tested how prone results from meta‐regression were to change when we compared data from those who completed with imputed data using the assumption outlined above. If there was a substantial difference, we reported results and discussed them but continued to employ our assumption.
Results
Description of studies
Results of the search
We have presented the results of the latest update search below; for previous results, please see Appendix 4.
The April 2015 update search of Cochrane Schizophrenia Group's Register of Trials yielded 299 references. We selected 87 for further inspection. One hundred and twenty‐seven references (corresponding to 96 studies with 31 companion papers) were available from the 'awaiting classification' section of the previous version of the review and were all selected for further inspection. We excluded a total of 85 studies from the review. Only two trials met the inclusion criteria and were included (Chan‐Hong Kong 2000; Cusack‐North Carolina). There were 26 new companion papers to previously included studies such as Morse‐Missouri3 2005, OPUS‐Denmark 1999, REACT‐UK 2002, and UK700‐UK 1999.
We have entered 20 trials in the 'awaiting classification' section and have sought further information. We added five new studies to the ongoing studies.
Problematic trials
There were two problematic trials worth special mention.
Jerrell‐SCarolina1 1991 was a three‐arm trial, with two of the arms qualifying as Intensive Case Management (Programme Assertive Community Treatment and Intensive Broker Case Management) and one a control (standard care). As results were reported separately for each arm, it was not possible to present continuous data from two ICM arms pooled together. One option was to treat each arm as a separate 'site', effectively treating the study as two trials, but with the same control group. A second option was to include only one of the experimental arms. Although aware of excluding potentially useful data on an arbitrary basis, we decided to include only one of the arms compared to standard care, per the second option. The main reason for this was to avoid a unit of analysis error, which would have occurred in the first option. We undertook a sensitivity analysis testing how prone results were to change when this trial was not included in meta‐analysis.
Curtis‐New York 1992 was a trial comparing ICM with standard care presenting two main difficulties. The first was regarding ICM caseload size. The study reported caseload ratio as 1:35 (above the 1:20 ratio defining an ICM intervention). As we derived estimation of caseload size by dividing the number of intervention participants by the number of whole‐time equivalent clinical staff in the team (not just those formally classified as 'case managers'), we found that the actual staff:participant ratio was about 1:17. We therefore found this trial eligible for inclusion in the review. The second issue was regarding the peculiar way this trial provided the ICM intervention. Both experimental and control interventions were community‐oriented and fit fully into the review's inclusion criteria, but the ICM team was located in hospital. While undesirable, the team office being based in hospital is not unusual. In any case, the case management was provided in the community. We therefore confirmed inclusion of the study, not wanting to penalise it because it reported details that were not available for all trials. However, we found a discrepancy in the data the study provided on service use outcomes (average number of days in hospital per month, admitted to hospital). Curtis‐New York 1992 was an outlier, being the only study clearly favouring standard care over ICM. We undertook a sensitivity analysis testing how prone results were to change when this trial was not included in the meta‐analysis. Neither results for the primary outcome 'average number of days per month in hospital' nor for the outcome 'admitted to hospital' changed significantly when this study was dropped, but it did significantly affect the level of heterogeneity. We could just advance the hypothesis that the reason for heterogeneity could be the unusual way the intervention was provided in this trial (Table 6).
4. Interventions in Curtis‐New York.
| 1. ICM: "Intensive outreach case management" from a multidisciplinary team at Harlem Hospital Center. This team implemented a discharge treatment plan and monitored clinical and social problems. The team did not "assume direct responsibility for care but [...] help[ed] the patient enrol in a day hospital programme, adult mental health clinic, rehabilitation programme, or alcohol treatment programme". Caseload: 1:17. N = 147. 2. Standard care: routine aftercare, within the discharge treatment plan prescribed for each patient from Harlem Hospital Center; "most received at least initial treatment from various divisions of the departments of psychiatry within the Health and Hospitals Corporation". N = 145. |
For a summary of the trial selection from the 2015 search, please see Figure 2.
2.
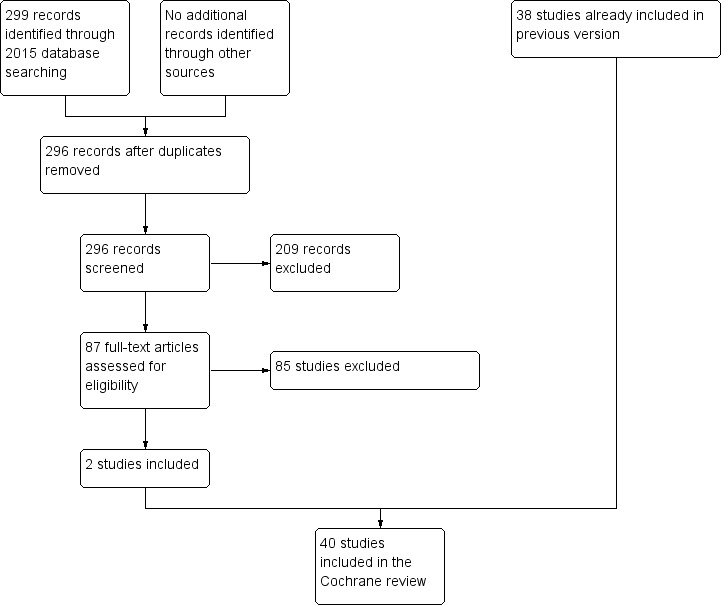
Study flow diagram 2015 update
Included studies
See: Characteristics of included studies.
The previous updates of two reviews included 176 reports describing 38 studies. This review now includes these 38 separate trials with an additional two studies including data on 196 participants (Chan‐Hong Kong 2000; Cusack‐North Carolina). These 40 trials provide data on 7524 randomised people. Twenty‐four of these studies had already been included in two original reviews (as included or awaiting assessment), with 14 more derived from the 2008 search and two more derived from the 2015 search. Twenty‐eight trials provided data for the ICM versus standard care comparison, 11 for the ICM versus non‐ICM comparison, and only one for both comparisons. Both of the two newly included studies provided data for the ICM versus standard care comparison. Please note that it was possible to report data for several separate centres of seven multicentre trials (Bond‐Indiana1 1988 (3); Chandler‐California1 1991 (2); Drake‐NHamp 1998 (7); Hampton‐Illinois 1992 (2); McDonel‐Indiana 1997 (2); Rosenheck‐USA 1993 (9); and UK700‐UK 1999 (4)). Several of these centres are reported separately in the Characteristics of included studies table.
1. Study length
Only one study fell into the short‐term category, with a maximum length of six months (Bond‐Indiana1 1988); nine studies reported medium‐term data, with only one study reporting data by seven months, Okpaku‐Tennessee 1997, and the remaining eight studies reporting data by 12 months (Bond‐Chicago1 1990; Bush‐Georgia 1990; Hampton‐Illinois 1992; Johnston‐Australia 1998; Lehman‐Maryland1 1994; Morse‐Missouri1 1992; Solomon‐Pennsylvania 1994; Sytema‐Netherlands 1999). The remaining 29 studies all fell into the long‐term category, with a maximum length of four years (Test‐Wisconsin 1985), and an average length of 23.5 months.
One study reported data only on short‐term follow‐up (five months of active intervention followed by six months' follow‐up) (Chan‐Hong Kong 2000), not reporting data assessed during the intervention. Newly retrieved companion papers provided data from medium‐ and long‐term follow‐up for two studies already included in the previous version of this review. Those two studies were OPUS‐Denmark 1999, now reporting data at three and eight years after active intervention was discontinued (i.e. 5 and 10 years after randomisation), and REACT‐UK 2002, now reporting data at 18 months and 8.5 years after participants could choose to which arm they were allocated (i.e. 3 and 10 years after randomisation). During the follow‐up period, all participants in OPUS‐Denmark 1999 received the control intervention, where participants in REACT‐UK 2002 could remain in the originally allocated intervention or be transferred to the control one.
2. Design
All included studies were randomised with a parallel longitudinal design. Twelve were multicentre trials, but only seven of these provided data for single centres (see above).
3. Participants
We included a total of 7524 participants from 40 trials. Most trials included from the previous review were conducted in Australia, Canada, and the USA. Specifically, most of the trials included from the previous two reviews were conducted in the USA (16 trials; 3474 participants), and only five were European (345 participants). In the first update of 2010, we added 1964 participants from seven trials conducted in Europe, and 1545 participants from 10 studies conducted in Australia, Canada, and the USA. In the current version of the review, we added 62 participants from one trial conducted in China (Chan‐Hong Kong 2000), and 134 participants from one trial conducted in the USA (Cusack‐North Carolina).
The review now provides data on 27 trials, including 5153 participants, conducted in Australia, Canada, and the USA; 12 trials, including 2309 participants, conducted in Europe; and one trial, including 62 participants, conducted in China.
Twenty studies included participants with severe mental illness. None of these studies provided operationalised definitions addressing dimensions of diagnosis, duration, and disability. However, 14 provided criteria for either the diagnosis, impairment, or level of service use. The remaining six studies provided no criteria for defining serious mental illness. Diagnoses of 'severe mental illness' varied across studies, from schizophrenic disorder alone to wider diagnostic groups including schizophrenic, affective, and personality disorder.
Of the remaining 20 studies, 18 involved participants with various diagnoses, but the great majority had some psychotic disorder, and most trials reported criteria for service use or impairment, or both. Two studies included participants with a high level of impairment or service use due to psychiatric illness, but provided no diagnostic criteria for inclusion (Harrison‐Read‐UK 2000; Okpaku‐Tennessee 1997).
Most trials (23) involved participants that had been diagnosed using operationalised criteria (DSM, ICD, OPCRIT, RDC, SADS, see Characteristics of included studies footnotes), whilst 17 (10 in the group including participants with serious mental illness and six in the group including participants with various diagnoses) did not report using any diagnostic tool, but only stated type of illness or level of impairment. Only OPUS‐Denmark 1999 included participants with a first episode of psychotic illness.
Four studies included a total of 742 dually diagnosed participants (Drake‐NHamp 1998; Essock‐Connecticut2 2006; Morse‐Missouri3 2005; Muller‐Clemm‐Canada 1996), and eight studies included a total of 1337 homeless participants.
Information on mean age was available from 32 trials (6473 participants). The average age was about 38 years old. Only Macias‐Utah 1994 did not report information on participant age.
4. Settings
As stated in the inclusion criteria, all of the included studies took place in a community setting, provided both by private and public mental health services. No study was carried out in a low‐income country, as the included studies were conducted in Australia, Canada, the USA, Europe, and China.
5. Interventions
Twenty‐nine trials were included in the comparison ICM versus standard care, and 12 in the ICM versus non‐ICM comparison. Quinlivan‐California 1995 was a three‐arm trial (ICM, non‐ICM, and standard care) and provided data for both comparisons. We considered REACT‐UK 2002 to be an ICM versus non‐ICM comparison due to our assumption that standard care could be considered to be Care Programme Approach, even if not clearly reported by trial authors. The Care Programme Approach was introduced in England in the mid‐1990s and become standard care thereafter; it is a combination of non‐Intensive Case Management and care from a Community Mental Health Team (Department of Health 1999), hence to be considered as non‐ICM according to the definitions in this review.
5.1 Intensive Case Management
On average, the ICM included in this review was well defined. The majority of experimental interventions were explicitly modelled on the ACT model, being based on the Treatment in Community Living model of Stein 1980. Only a few studies based ICM on the Case Management model. The experimental intervention was provided either by an already existing team or ICM services newly established for the trial. Cusack‐North Carolina was the only trial that included ICM as forensic adaptation of ACT compared with standard care.
5.2 Non‐Intensive Case Management
There were no discernable differences between the practice of non‐ICM and ICM except for the intensity of contact. The degree of training and skill of the staff was similar in the ICM and non‐ICM teams. In some studies, non‐ICM was itself an experimental intervention, but it mostly represented the average standard care, as what in this review we call 'standard care' has increasingly shifted towards non‐ICM across decades. Mental health systems increasingly included elements from ICM, melding them with community mental health service. English mental health policy is one example, where the Care Programme Approach was introduced in the UK in the mid‐1990s and become standard care thereafter. It is a combination of non‐ICM and care from a Community Mental Health Team, hence to be considered as non‐ICM, according to the definitions in this review. Therefore the REACT‐UK 2002 study was considered in the ICM versus non‐ICM comparison due to our assumption that standard care could be considered as Care Programme Approach, even if not clearly reported by trial authors.
5.3 Standard care
On average, the definition of standard care was blurred, as this intervention was modelled on a generalist model. Its core was being provided by a community mental health service, but its features were variable across trials run in different countries at different time periods. Presence of further specialised services, such as rehabilitation or psychotherapist services, were variable within standard care services. In a few studies, both ICM and standard care incorporated services for substance abuse treatment and homelessness care.
6. Outcome measures
6.1 Overall
The outcomes for which we could obtain usable data were: service use, adverse effects, global state, social functioning, mental state ‐ general and specific symptoms, behaviour, quality of life, satisfaction, and costs.
Many trials used different scales in assessing treatment effects in various outcomes (global state, social functioning, mental state ‐ general and specific symptoms, behaviour, quality of life, and satisfaction). As most of the scales were used by only one study in each comparison group, it was not possible to enter these data in a unique analysis. Even where studies used the same scale, they often applied different rating scores. Therefore, again, data could not be entered together in the analysis. Some studies failed to clearly report the rating score they used for a pre‐stated scale. We noted this in the 'Risk of bias' tables (see 'Outcomes' in Characteristics of included studies table). No studies assessed improvement by measuring it on scales. We did not calculate effect size measures (standardised mean difference, see Measures of treatment effect).
6.2 Outcome scales
Only details of the scales that provided usable data are shown below. Reasons for exclusions of data are provided under 'Outcomes' in Characteristics of included studies table.
6.2.1. Global Assessment Scale (GAS) (Endicott 1976): in Audini‐UK 1994, Muijen‐UK2 1994, Rosenheck‐USA 1993
This is an observer‐rated scale for evaluating the overall functioning of a person during a specified time period on a continuum from psychological or psychiatric sickness to health. The score ranges from 0 to 100, where a higher score indicates a better outcome. A modified version of the GAS was included in the Diagnostic and Statistical Manual of Mental Disorders (DSM‐III) as the Global Assessment of Functioning Scale (GAF) (APA 1987): in Bjorkman‐Sweden 2002. Outcomes from the two scales are reported together as GAF, as these two scales are very similar, and they report results on the same score range.
6.2.2 Health of the Nation Outcome Scale (HoNOS) (Stein 1999; Wing 1998): in Harrison‐Read‐UK 2000, REACT‐UK 2002
This scale provides a systematic summary of behaviours and functioning, measuring mental health and social/behavioural functioning. It consists of four areas (behaviour, impairment, symptoms, and social), each assessed through 12 items on a five‐point scale (0 to 4). Ratings are from 0 to 48; high score means severe dysfunction.
6.2.3 Rating of Medication Influence (ROMI) (Weiden 1994): in Harrison‐Read‐UK 2000, REACT‐UK 2002
This 20‐item scale measures the influence of factor on medication adherence. Each item is rated according to the degree of influence on medication‐taking behaviour: none (1), mild (2), and strong (3). It has two subscales: patient‐reported compliance (items 1 to 7) and patient‐reported non‐compliance (items 8 to 20). A high score on the compliance subscale indicates high compliance; a high score on the non‐compliance subscale indicates high non‐compliance. Results from the two studies are presented on a different range score (Harrison‐Read‐UK 2000 range score of 1 to 3; REACT‐UK 2002 range score not clearly reported).
6.2.4 Disability Assessment Schedule (DAS) (WHO 2001a): in Holloway‐UK 1996
The World Health Organization's Psychiatric Disability Assessment Schedule (DAS) is a measure of functioning and disability. It contains 36 items with six domains of functioning, including: understanding and communicating, getting around, self care, getting along with others, household and work activities, and participation in society. Higher scores indicate a worse outcome.
6.2.5 Interview Schedule for Social Interaction ‐ abbreviated version (ISSI) (Henderson 1980; Unden 1989): in Bjorkman‐Sweden 2002
The ISSI scale is a self report scale consisting of 30 items that measures social integration and attachment. The maximum score is 30 points; higher scores indicate better social integration and attachment.
6.2.6 Life Skills Profile (LSP) (Parker 1992; Rosen 1989): in REACT‐UK 2002
The Life Skills Profile is a clinician‐rated questionnaire developed in Australia primarily for use with people with psychotic illnesses. Thirty‐nine items and five subscales assess the general domain of disability over the last three months. The five subscales measure self care, non‐turbulence, social contact, communication, and responsibility. Each of the 39 items on the scale range from 'not at all disabled' to 'extremely disabled'.
6.2.7 REHAB Scale (REHAB) (Baker 1983): in Marshall‐UK 1995
The REHAB Scale is an observer‐rated measure of social functioning, covering social activity, self care, speech disturbance, and community skills. It rates the frequency of items of embarrassing or disruptive behaviour, such as violence, self harm, shouting and swearing, and sexual offensiveness (deviant behaviour ‐ REHAB DB); and lack of general skills (general behaviour ‐ REHAB GB). The scale ranges from 0 to 144, with higher scores indicating poorer functioning.
6.2.8 Role Functioning Scale (RFS) (Green 1987): in Jerrell‐SCarolina2 1994
This is a self report scale whereby the total of four subscales measures global role functioning. Higher scores indicate better functioning.
6.2.9 Social Adjustment Scale (SAS) (Weissman 1971; Weissman 1974): in Audini‐UK 1994, Muijen‐UK2 1994
Measures social functioning in a number of life domains (work, social, extended family, marital, parental, family unit, and economic adequacy). Score ranges from 1 to 7, with higher score indicating poorer outcome.
6.2.10 Social Adjustment Scale‐II (SAS‐II) (Schooler 1979): in Jerrell‐SCarolina1 1991
Revised version of the Social Adjustment Scale (see above), used to assess social adjustment. Self reported scale similar to SAS, but adapted for schizophrenia; it comprises 24 items covering seven areas including social, family, and work functioning. The scoring system of the two versions appears to differ, perhaps because this was an adapted version. Higher score indicates better outcome.
6.2.11 Social Functioning Questionnaire (SFQ) (Tyrer 1990; Tyrer 2005): in Harrison‐Read‐UK 2000
An eight‐item self report scale (score range is 0 to 24). It provides a quick assessment of perceived social function. Higher score indicates poorer social functioning.
6.2.12 Strauss‐Carpenter Outcome Scale (Strauss 1972; Strauss 1974): in Bjorkman‐Sweden 2002
The Strauss‐Carpenter Outcome Scale assesses a 21 items exploring frequency of social contacts, employment duration, symptomatology, and duration of rehospitalisation. The scaling of each item extends from 0 (maximal negative) to 4 (maximal positive). The scoring range of the scale extends from 0 (maximal negative) to 84 (maximal positive).
6.2.13 Alcohol Use Scale (AUS) (Drake 1996; Mueser 1995): in Drake‐NHamp 1998
A five‐point scale based on clinicians' ratings of the severity of the disorder, ranging from 1 (abstinence) to 5 (severe dependence).
6.2.14 Dartmouth Assessment of Lifestyle Interview (DALI) (Rosenberg 1998): in Sytema‐Netherlands 1999
An 18‐item, interviewer‐administered scale addressing the detection of substance use disorder in people with severe mental illness. DALI focuses on alcohol, cannabis, and cocaine use disorders. DALI‐alcohol: scores range from ‐4 to +6, higher scores indicate higher risk of alcohol abuse. DALI‐drugs: scores range from ‐4 to +4, higher scores indicate higher risk of drug abuse. As scale ranges from negative to positive value, skew is difficult to detect. We therefore entered data from this scale in Additional tables rather than into an analysis.
6.2.15 Substance Abuse Treatment Scale (SATS) (Drake 1996; McHugo 1995): in Drake‐NHamp 1998
An eight‐point scale indicating progression toward recovery, ranging from 1 (early stages of engagement) to 8 (relapse prevention). Higher scores indicate greater progression.
6.2.16 Timeline Followback (TLFB) (Sobell 1980): in Drake‐NHamp 1998
Scale administered by an interviewer to assess days of alcohol and drug use over the previous six months. Outcome reported as binary data.
6.2.17 Brief Psychiatric Rating Scale (BPRS) (Overall 1962): in Audini‐UK 1994, Drake‐NHamp 1998, Muijen‐UK2 1994, REACT‐UK 2002, Sytema‐Netherlands 1999 (BPRS 24‐item ‐ Velligan 2005); in Chan‐Hong Kong 2000, Ford‐UK 1995, Rosenheck‐USA 1993 (BPRS 18‐item)
The BPRS measures positive symptoms, general psychopathology, and affective symptoms. The original scale has 16 items, but a revised 18‐item scale is commonly used. Symptoms are reported in several ways (i.e. on a scale of 0 to 6 or 1 to 7), but it is most common for each item to be rated on a seven‐point scale (1 = not present to 7 = extremely severe). The 18‐item scale can range from 18 to 126 or from 0 to 108 (as in Ford‐UK 1995 and Rosenheck‐USA 1993).A further version is a 24‐item scale ranging from 24 to 168. For all of the scales, higher scores indicate more severe symptoms.
6.2.18 Brief Symptom Inventory (BSI) (Derogatis 1983): in Rosenheck‐USA 1993
A brief rating scale used by an independent rater to assess the severity of psychiatric symptoms. Scores range from 0 to 4, with higher scores indicating more symptoms.
6.2.19 Comprehensive Psychopathological Rating Scale (CPRS) (Asberg 1978): in Holloway‐UK 1996, UK700‐UK 1999
This is an interview rating scale covering a wide range of psychiatric symptoms; it can be used in total or as subscales. CPRS consists of 65 items that cover the range of psychopathology over the preceding week (40 symptom items are rated by the participant, and 25 observed items are rated by the rater during the interview). Each item is rated on a 0 to 3 scale ranging from 'not present' to 'extremely severe', with higher scores indicating more severe symptoms.
6.2.20 Colorado Symptom Index (CSI) (Shern 1994): in Lehman‐Maryland1 1994, Shern‐USA1 2000
A brief rating scale used by an independent rater to assess the severity of a range of psychiatric symptoms. A lower score indicates more symptoms.
6.2.21 Krawiecka Scale (KS) alias Manchester Scale (Krawiecka 1977): in Harrison‐Read‐UK 2000
This scale rates severity of psychiatric symptoms. It consists of eight categories of symptoms assessed on a five‐point scale, which are depression, anxiety, hallucinations, delusions, flattened and incongruous effect, psychomotor retardation, incoherence and irrelevance of speech, and poverty of speech. A score of 0 or 1 denotes an absence of pathology, while ratings of 2, 3, or 4 denote the presence of the target symptoms in increasing severity. Rating is from 0 to 36. Higher scores indicate a worse outcome.
6.2.22 Present State Examination (PSE) (Wing 1974): in Audini‐UK 1994, Muijen‐UK2 1994
This is a clinician‐rated scale measuring mental status. The scale rates and combines 140 symptom items to give various syndrome and subsyndrome scores. A short version covering the first 40 'neurotic' symptoms has been used in several population surveys. Score ranges from 1 to 120. Higher scores indicate greater clinical impairment.
6.2.23 Symptom Checklist‐90 (SCL‐90) (Hopkins Symptoms Checklist) (Derogatis 1974): in Bjorkman‐Sweden 2002
This is a self report clinical rating scale of psychiatric symptomatology comprised of 90 symptom‐related questions. Out of 90 items, 83 items represent nine subscales: somatisation (12 items), obsessive‐compulsive (10 items), interpersonal sensitivity (9 items), depression (3 items), anxiety (10 items), anger‐hostility (6 items), phobic anxiety (7 items), paranoid ideation (6 items), and psychoticism (10 items). Seven additional items include disturbances in appetite and sleep. The SCL‐90 also utilises three global distress indices: Global Severity Index (GSI), Positive Symptom Distress Index (PSDI), and Positive Symptom Total (PST). The participant assesses the degree of severity of each symptom. Items are rated on a five‐point Likert scale, ranging from 'not at all distressing' (0) to 'extremely distressing' (4), with higher scores indicating greater symptomatology.
6.2.24 Beck Depression Inventory (BDI) (Beck 1979): in Holloway‐UK 1996
A 21‐item self rating scale for depression. Each item comprises 4 statements (rated from 0 to 4) describing increasing severity of the abnormality concerned. The person completing the scale is required to read each group of statements and identify the one that best describes the way they have felt over the preceding week. Score ranges from 0 to 84, with higher score indicating more severe symptoms.
6.2.25 Hospital Anxiety and Depression Scale (HADS) (Zigmond 1983): Harrison‐Read‐UK 2000
This scale is a questionnaire composed of statements relevant to either generalised anxiety or depression referring to the past week. Seven items in the questionnaire reflect anxiety, and seven reflect depression. The participant answers each item on a four‐point (0 to 3) response category; the possible scores range from 0 to 21 for anxiety and 0 to 21 for depression. Higher score indicates a worse outcome.
6.2.26 Scale for the Assessment of Negative Symptoms (SANS) (Andreasen 1982; Andreasen 1989): in Holloway‐UK 1996, UK700‐UK 1999
This scale assesses five symptom complexes to obtain clinical ratings of negative symptoms in people with schizophrenia over the preceding week. They are: affective blunting, alogia (impoverished speech), avolition/apathy, anhedonia/asociality, and disturbance of attention. The final symptom complex seems to have less obvious relevance to negative symptoms than the other four complexes. Assessments are conducted on a six‐point scale (from 0 indicating 'not at all' to 5 indicating 'severe'). Higher scores indicate a worse outcome.
6.2.27 Scale for the Assessment of Positive Symptoms (SAPS) (Andreasen 1984): in OPUS‐Denmark 1999
The SAPS measures positive symptoms in schizophrenia. It is intended to serve as a complementary instrument to the Scale for the Assessment of Negative Symptoms (SANS). SAPS is split into four domains: hallucinations, delusions, bizarre behavior, and positive formal thought disorder. Within each domain, separate symptoms are rated from 0 (absent) to 5 (severe). Higher scores indicate a worse outcome.
6.2.28 Social Behaviour Schedule (SBS) (Wykes 1986): in Holloway‐UK 1996
The SBS is a 21‐item scale designed to assess a range of areas of functioning in people with long‐term mental illness. The scale covers areas such as social behaviour and communication, self care, and inappropriate behaviour. The respondent's behaviour on each item during the previous month is scored by a person familiar with him or her. Each item is rated on a five‐point Likert scale (from 0 to 4), with higher scores indicating greater deficits.
6.2.29 Lancashire Quality of Life Profile (LQoLP) (Oliver 1996; Oliver 1997): in Bjorkman‐Sweden 2002, Holloway‐UK 1996, UK700‐UK 1999
A structured self report interview with 105 items, combining objective and subjective measures in the following nine life domains (range of values 1 to 7): living situation, social relationships, work and education, legal status and safety, religion, family relations, leisure activities, finances, and health. The LQoLP also measures the following additional areas: positive and negative affect (with the Bradburn Affect‐Balance Scale), self esteem, global well‐being (Cantril's Ladder and Happiness Scale), perceived quality of life, and the quality of life of the patient independent of the patient's own opinion (with the Quality of Life Uniscale). The measures from LQoLP used in Bjorkman‐Sweden 2002 were: overall quality of life (which is the mean of subjective quality of life in nine life domains) and global well‐being. Higher score indicates better subjective quality of life/satisfaction.
6.2.30 Manchester Short Assessment of Quality of Life (MANSA) (Priebe 1999): REACT‐UK 2002, Sytema‐Netherlands 1999
A 16‐item scale composed of 4 objective and 12 subjective questions. The 12 subjective items are rated on a 7‐point scale (from 'couldn't be worse' to 'couldn't be better', scored from 1 to 7, range 12 to 84) assessing satisfaction with life 'in general', and in a range of domains such as vocational, financial, friendships, leisure, personal safety, physical health, and mental health. Four objective items, answered yes or no, assess the existence of a close friend, contacts with friends per week, accusation of a crime, and victimisation of physical violence. Higher score indicates better quality of life. In REACT‐UK 2002 and Sytema‐Netherlands 1999, score is reported as a mean ranging from 1 to 7.
6.2.31 Lehman's Quality of Life Interview (QOLI) (Lehman 1988): in Drake‐NHamp 1998, Lehman‐Maryland1 1994, Shern‐USA1 2000; (Lehman 1993) in Ford‐UK 1995; (Lehman 1983) in Marshall‐UK 1995
The QOLI contains 153 items that measure global life satisfaction as well as objective and subjective quality of life, in eight life domains (living situation, daily activities and functioning, family relations, social relations, finances, work and school, legal and safety issues, and health). The QOLI is rated on a seven‐point scale, with higher scores indicating better quality of life. Subjective assessment of general life satisfaction ranges from 1 to 7 (terrible to delighted). Ford‐UK 1995 reported objective quality of life, and Marshall‐UK 1995 reported subjective quality of life.
6.2.32 Camberwell Assessment of Need interview (CAN) (Phelan 1993): in Bjorkman‐Sweden 2002, Harrison‐Read‐UK 2000, UK700‐UK 1999
The Camberwell Assessment of Need assesses the health and social needs of people with mental health problems. It measures 22 areas to yield numbers of met and unmet needs as rated by the participant. Possible scores range from 0 to 22, with a higher score indicating poorer level of met needs.
6.2.33 Camberwell Assessment of Need Short Appraisal Schedule (CANSAS) (Phelan 1995; Slade 1999): in REACT‐UK 2002, Sytema‐Netherlands 1999
This is an abbreviated form of the above CAN.
6.2.34 Client Satisfaction Questionnaire (CSQ) (Larsen 1979): in Audini‐UK 1994, Muijen‐UK2 1994, OPUS‐Denmark 1999, Sytema‐Netherlands 1999
The CQS is a self report instrument designed to measure patient's global satisfaction with services. Items are concerned with quality of services received, how well services met the client's needs, and general satisfaction. The CSQ is substantially correlated with treatment attrition, number of therapy sessions attended, and change in client‐reported symptoms. It consists of eight items that are scored on four‐point Likert scales (1 to 4). Total score ranges from 8 to 32. Higher scores indicate greater satisfaction.
6.2.35 Client Satisfaction Questionnaire (CSQ) ‐ modified version (Gerber 1999; Larsen 1979): in REACT‐UK 2002
This survey has 35 questions covering the location of services, services clients expect, delays in obtaining services, client's input into treatment, information received about drug treatment, satisfaction with treatment, access to clinical files, satisfaction with the therapist, family involvement in treatment, the treatment process, and overall satisfaction. Possible responses to most items range from 1 (most negative) to 7 (most positive). A rating of zero on certain items enables the respondent to indicate that the question was not relevant to his or her situation. Six items within the questionnaire, also on a seven‐point scale, form a general satisfaction questionnaire. Higher score indicates greater satisfaction.
6.2.36 Patient's satisfaction with health services (Tyrer 1979): in UK700‐UK 1999
A self reporting questionnaire that rates nine components of satisfaction with services, each on a four‐point scale (1 to 4). Scores can range from 9 to 36, with higher values indicating less satisfaction.
6.2.37 Patient Satisfaction Instrument (PSI) (Risser 1975): in Chan‐Hong Kong 2000
The PSI assesses patient and client satisfaction. It is a 26‐item questionnaire designed to measure clients' satisfaction with nursing care in the community setting.
6.2.38 Specific Level of Functioning Scale (SLOF) (Schneider 1983): in Chan‐Hong Kong 2000
The SLOF assesses clients' behavioural functioning and daily skills. It is a 43‐item behavioural rating scale designed for use in clients with chronic mental illness in the community.
6.3 Missing outcomes
No trial reported or rated relapse, mental state: not improved, or carer satisfaction.
Excluded studies
See: Characteristics of excluded studies.
Eighty‐one studies were excluded from the previous versions of this review, while a total of 85 studies were excluded from this version.
The earlier update excluded four trials included in the original reviews as the trials did not match the new inclusion criteria. (De Cangas‐Canada 1994; Franklin‐Texas 1987; Lafave‐Canada 1996; Marx‐Wisconsin 1973). Morse‐Missouri2 1997 was also excluded, as it did not report the number of people randomised to each treatment group.
One further trial (Tyrer‐UK 1995), originally included in the Case Management (CM) review, was now excluded because of a methodological issue. Tyrer‐UK 1995 is a trial comparing ICM to standard care. The first issue was to clarify the ICM caseload. Thanks to further information provided from the author, we clarified that there were 25 key workers in the service looking after 400 patients on the register, therefore each key worker had a caseload of 1 to 16, or 'high‐intensity' case management by this review's definition. The second issue that arose was that the case managers in the treatment group were also workers in the control group. The problem was therefore one of contamination, as requiring someone to carry out close monitoring of one participant in the treatment group could affect their care of a similar participant in the control group in an unpredictable way. We decided to exclude this study on the grounds that we could not be sure that high‐intensity case management was really being compared with standard care.
We also excluded three trials that had been awaiting assessment in the original Case Management and Assertive Case Management reviews (see Other published versions of this review) for varying reasons (Godley‐Illinois 1994; Jerrell‐California 1989; Mulder‐Missouri 1985) (for more details see Characteristics of excluded studies).
Jerrell‐California 1989 was a partially published trial previously classified as 'awaiting further assessment' because we needed information on number of people excluded after randomisation (participants were excluded if they refused to participate after randomisation or if they had not been discharged from hospital within six months of entering the study). As these data have not become available, we have now excluded the trial.
Godley‐Illinois 1994 was an unpublished, two‐centre trial initially classified as 'awaiting further assessment' because we could not determine if the intervention was ACT or CM. During the current update we classified the intervention as ICM versus standard care. We had to exclude this study because it contained no usable data due to incomplete data reporting, and no further information became available (i.e. there was an apparent error in the reporting of numbers admitted to hospital: in one table admission rates were reported as 31/52 experimental group and 33/45 control group, while in another table admission rates were reported as 31/52 experimental and 25/45 control).
Mulder‐Missouri 1985 was a report of data from randomised and non‐randomised participants. We excluded this study because these data were not reported separately and, in addition, the intervention did not fit our inclusion criteria (ICM was compared to acute hospital admission).
Overall, we excluded 42 studies because they were not randomised or because randomisation was compromised (Jerrell‐California 1989). We had to exclude five studies because participants required immediate hospital admission (Fenton‐Canada 1978; Hoult‐Australia 1981; Muijen‐UK1 1992; Mulder‐Missouri 1985; Stein‐Wisconsin), one study because participants were dually diagnosed with intellectual disability and mental illness (Martin‐UK 2005), and one additional study because the majority of participants were simply homeless and not clearly ill (Toro‐New York 1997). Most trials had to be excluded because of the intervention: 54 because the experimental intervention was not ICM. We had to exclude Modcrin‐Kansas 1988 as caseload was not reported in either the experimental or the control group. We excluded 48 trials as the comparison intervention was neither standard care nor non‐ICM. We excluded 10 trials as the intervention administered to the experimental group was not only ICM (Chandler‐California2 2006; COAST‐UK 2004; Cosden‐California 2005; Gold‐SCarolina 2006; Grawe‐Norway 2005; Lehman‐Maryland2 1993; LEO‐UK 1994; McHugo‐Washington DC 2004; Shern‐USA2; Shern‐USA3). We excluded 10 trials as they did not present with relevant comparisons. Finally, we excluded two trials, Godley‐Illinois 1994 and Morse‐Missouri2 1997, because we could extract no usable data from the study report (as previously explained).
Awaiting classification
See: Characteristics of studies awaiting classification.
Five trials described as 'awaiting classification' in the previous review have now been excluded as more data have become available (Agius‐Croatia 2007; Kane‐Virginia 2004; Klotz‐California 2001; Li‐China 2004; NCT00781079); two more have now been excluded based only on the abstract, and so they were not included in the excluded studies section (Huang‐China and Johnson‐UK).
Twenty trials, of which three are in the Chinese language, are awaiting classification, and their authors have been contacted for further clarification.
Ongoing studies
See: Characteristics of ongoing studies.
We are aware of six currently ongoing trials, five more than the ongoing studies in the previous version of this review (Walsh‐Connecticut).
Risk of bias in included studies
For multicentre trials that provided data for individual single centres, we did not assess the risk of bias for each centre. Our judgements regarding the overall risk of bias in individual studies are illustrated in Figure 1.
Allocation
All 40 studies were stated to be randomised, but only 11 provided descriptions of the methods used to generate the sequence. We therefore classified these studies as at low risk of selection bias. The most common method of randomisation was random allocation according to a sequence of random numbers generated by a computer program in one of two sites (Bjorkman‐Sweden 2002; Essock‐Connecticut2 2006; Ford‐UK 1995; Harrison‐Read‐UK 2000; OPUS‐Denmark 1999), while Cusack‐North Carolina employed randomisation using a random number table, assigned in blocks of two. Three trials used permuted block (Marshall‐UK 1995; REACT‐UK 2002; Sytema‐Netherlands 1999), one used a table of random permutation (Pique‐California 1999), and one used coin tossing (Rosenheck‐USA 1993). In one of the two sites of the OPUS‐Denmark 1999 trial (Aahrus site), allocation was performed by drawing lots – from among five red and five white lots from a black box. Overall, however, most studies, including Chan‐Hong Kong 2000, were classified as at unclear risk of selection bias with an overestimate of positive effect, as no description of the methods used to generate the sequence was provided.
Regarding the allocation concealment, we rated only four studies as low risk of bias as they provided descriptions of the methods used to conceal random allocation (OPUS‐Denmark 1999; REACT‐UK 2002; Sytema‐Netherlands 1999; UK700‐UK 1999). All four studies used centralised allocation carried on by telephone, fax, or mail. We classified the remaining 33 studies as at unclear risk of selection bias with an overestimate of positive effect.
Blinding
We classified blinding with respect to only primary outcomes. Due to intervention characteristics, that is being a model of service organisation, we assumed participants and clinicians implicitly not being blind to treatment assignment. We also assumed that primary outcomes were likely to be influenced by participant and clinician lack of blinding, as the knowledge of treatment allocation could determine both performance and attrition bias at a level that is difficult to predict/quantify. Whereas we did not consider the primary outcomes as interviewer mediated, we assumed that lack of interviewer blinding would produce less detection bias. We therefore classified all studies providing primary outcome data as at unclear risk of performance and attrition bias. This creates further potential for overestimate of positive effects and underestimate of negative ones.
We have reported blinding to secondary outcomes in the 'Risk of bias' table, but we did not account for it in the global rating of the study blinding risk of bias. Again, if the secondary outcome was clinician/participant mediated, we rated it as unclear. If it was interviewer rated, we assessed it according to information provided in the study. We rated only Shern‐USA1 2000 as at high risk of bias, as it provided only secondary outcome data and was only interviewer mediated, and it was therefore possible to assess risk of bias for this study with greater confidence. We rated Chan‐Hong Kong 2000 as at unclear risk of performance and detection bias, as it did not clearly report any information on blinding.
Incomplete outcome data
Where information was available, we assessed incomplete outcome data separately for primary and secondary outcomes and presented both assessments in Figure 1. However, we only rated risk of bias with respect to primary outcome. Only three trials provided separate information for incomplete primary and secondary outcome data, and so we could assess the risk of bias separately (Holloway‐UK 1996; Johnston‐Australia 1998; REACT‐UK 2002). We judged nine trials as adequately addressing incomplete outcome data and rated them as at low risk of attrition bias. We so rated four of these studies because there were no missing outcome data (Bush‐Georgia 1990; Holloway‐UK 1996; REACT‐UK 2002; Sytema‐Netherlands 1999); three because they made the number and reason for missing data explicit, and the missing data were balanced across groups (Audini‐UK 1994; Essock‐Connecticut1 1995; Johnston‐Australia 1998); and two because they undertook intention‐to‐treat (ITT) analysis (OPUS‐Denmark 1999; UK700‐UK 1999).
In Cusack‐North Carolina, all analyses were intention to treat and outcomes were observed regardless of active or continued participation. Although Chan‐Hong Kong 2000 reported the analyses as ITT, it was not clearly reported whether any participants left early.
We judged Bond‐Chicago1 1990 and Ford‐UK 1995 as at high risk of attrition bias because, although clearly reporting number and reasons for missing data, the reasons for missing outcome data were likely to be related to true outcome, with imbalance either in numbers or reasons for missing data across intervention group. However, our protocol compensated for this somewhat (see Dealing with missing data), and despite the high rating, information from these studies remains included.
We rated the remaining trials as at unclear risk of attrition bias. Either they did not address this issue or presented insufficient information of attrition/exclusions to permit judgement (i.e. no reasons for missing data provided or number randomised not stated. Jerrell‐SCarolina1 1991 reported only number of randomised participants completing the study period).
Some specific examples may serve to illustrate the difficulty in rating this issue. Essock‐Connecticut2 2006 was not an ITT analysis (seven participants were excluded from the study immediately after randomisation because they were lost to follow‐up), but the authors failed to provide information on to what intervention those participants had been allocated and reason for leaving the study early. As this study provided only continuous outcome data, we reproduced completer‐only data that were reported. No action was undertaken to deal with other missing data.
Macias‐Utah 1994 had three problems. First, the study was not an ITT analysis: seven participants were excluded from the study because they were lost to follow‐up. The authors of this study broke with standard practice by failing to provide any data on participants lost to follow‐up, in particular data on admissions to hospital. Second, one participant (presumably randomised to the treatment group) was excluded after randomisation, having refused to participate (again, it was unclear whether this person had been admitted to hospital). Third, five further participants were added (randomly) to the treatment and control groups part way through the study, some as late as "late 1990" (final assessments took place in February 1991). No further information has become available since first review publication, which potentially could substantially affect findings.
In Morse‐Missouri1 1992, 28 further participants were added (randomly) to the initial randomised sample, to replace participants leaving the study within the first month after entering. As replacement was carried out through randomised assignment, we did not raise any questions on the replacement issue and included the study. We presented data from the final sample, obtained after randomised replacement had occurred.
In Muller‐Clemm‐Canada 1996, the number randomised was not clearly reported; authors declared that "Clients who withdrew from the study within the first 6 months were replaced by other clients".
Finally, Sytema‐Netherlands 1999 randomised 119 participants, but one was excluded because he or she moved to another area directly after randomisation. (We performed ITT analysis on the remaining 118 participants.)
Selective reporting
We rated most of the trials (24) as at high risk of reporting bias, as their data was presented in such a way that we could not consider it to be free of the suggestion of selective outcome reporting (i.e. prespecified outcomes were not reported, or they were reported incompletely so that they could not be entered in the analysis, or outcomes were reported that were not prespecified). We rated 16 studies as at low risk of reporting bias. We assessed two studies as at unclear risk of reporting bias.
Other potential sources of bias
Only Hampton‐Illinois 1992 was rated as at unclear risk of other potential sources of bias, as it was unclear whether the study was interrupted early in one of the two centres.
We rated all of the remaining trials as at low risk of other potential sources of bias, as we found no evidence of other bias. Most of these studies were publicly funded. No declaration of interest was made by authors, and we assume there was none to be made. However, many study authors were active pioneers in the development and implementation of the experimental intervention model across the scientific community and the clinical world. This raises the issue of how researcher beliefs could affect the entire process of evaluating an intervention in a randomised clinical trial. Although conscious of this issue, we decided not to make any attempt in rating it as it is very difficult to judge, and erroneous quantification could drive bias into our conclusions.
Effects of interventions
We categorised studies into two comparisons: Intensive Case Management versus standard care, and Intensive Case Management versus non‐Intensive Case Management. The nine main indices of outcome were:
service use;
adverse effects;
global state;
social functioning;
mental state;
behaviour;
quality of life;
satisfaction; and
direct costs.
We considered each index in turn for each of the two comparisons. We were able to extract numerical data from 40 randomised trials, among which seven multicentre trials provided data for individual single centre.
1. COMPARISON 1: INTENSIVE CASE MANAGEMENT versus STANDARD CARE
(Table 1). There were 45 outcomes in this comparison.
1.1 Service use: 1. Average number of days in hospital per month ‐ by about 24 months
Data were available from five studies presenting skewed data from a sample size greater than or equal to 200 participants and from 19 trials reporting skewed data from sample sizes less than 200. We entered these data in separate subgroups, but we also presented the overall data.
1.1.1 Skewed data (sample size ≧ 200)
In the first subgroup analysis (i.e. skewed data from studies with sample size greater than or equal to 200 participants), we found no significant difference in length of hospitalisation per month (n = 1812, 5 randomised controlled trials (RCTs), mean difference (MD) ‐0.46, confidence interval (CI) ‐0.95 to 0.03), although data suggested a trend favouring ICM (P = 0.06). This subgroup had moderate levels of heterogeneity (Chi2 = 6.36; df = 4.0; P = 0.17; I2 = 37%; Analysis 1.1).
1.1. Analysis.
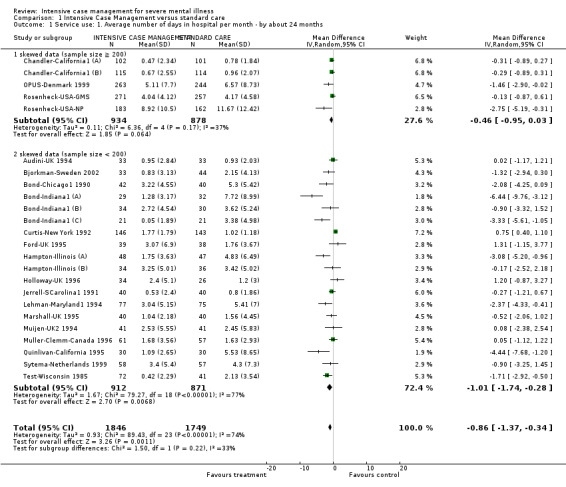
Comparison 1 Intensive Case Management versus standard care, Outcome 1 Service use: 1. Average number of days in hospital per month ‐ by about 24 months.
1.1.2 Skewed data (sample size < 200)
In the second subgroup analysis (i.e. skewed data from study sample size less than 200 participants), there was a significant difference between groups, favouring the ICM group in reducing length of hospitalisation (n = 1783, 19 RCTs, MD ‐1.01, 95% CI ‐1.74 to ‐0.28), but these data were highly heterogeneous (Chi2 = 79.27; df = 18.0; P = 0.0; I2 = 77%; Analysis 1.1).
1.1.3 Overall data (skewed data: sample size ≧ 200 and sample size < 200)
When synthesising data from the two subgroups, we found that length of hospitalisation was significantly reduced in the ICM group (n = 3595, 24 RCTs, MD ‐0.86, 95% CI ‐1.37 to ‐0.34), but the level of heterogeneity was high (Chi2 = 89.43; df = 23.0; P = 0.0; I2 = 74%; Figure 3). We investigated the heterogeneity by checking again for correctness of data and removing one outlier study from the analysis (Curtis‐New York 1992), as it was the only study favouring standard care. After excluding Curtis‐New York 1992, the level of heterogeneity was still high (I2 = 59%; P < 0.0002). We therefore removed the second‐most outlier study from the analysis (Bond‐Indiana1 (A), one of three centres from a multicentre study), as this was the most extreme result (favouring ICM). By excluding Bond‐Indiana1 (A), data remained significant, favouring ICM (n = 3245, 22 RCTs, MD ‐0.79, 95% CI ‐1.22 to ‐0.36). The heterogeneity was reduced to just within our cutoff point (I2 = 49%; P = 0.005). Removing two further outliers (Bond‐Indiana1 (C) and Quinlivan‐California 1995) reduced heterogeneity still further (I2 = 36%; P = 0.05) as well as the overall estimate, but ICM still seemed to significantly decrease time in hospital (n = 3143, 20 RCTs, MD ‐0.62, 95% CI ‐1.00 to ‐0.23, Figure 4).
3.
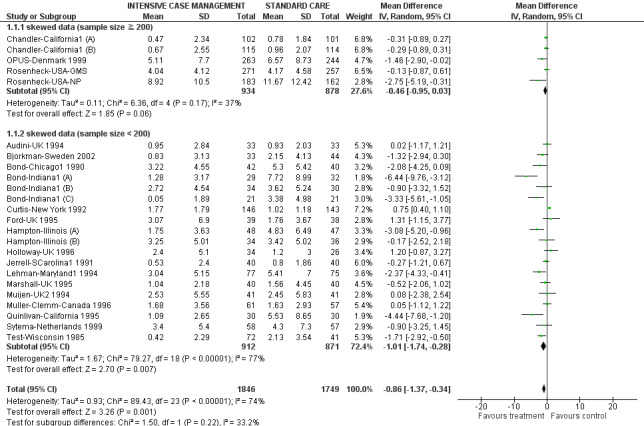
Forest plot of comparison: 1 Intensive Case Management versus standard care, outcome: 1.1 Service use: 1. Average number of days in hospital per month ‐ at about 24 months.
4.
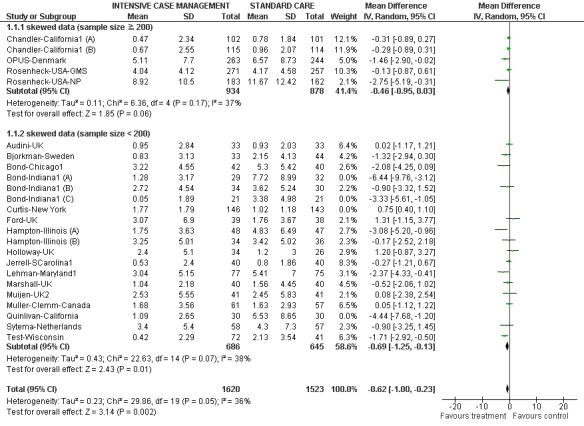
Service use: 1. Average number of days in hospital per month ‐ at about 24 months ‐ restoring homogeneity ‐ 4 studies removed from analysis.
No substantial reporting biases were highlighted when investigated through visual inspection of funnel plot (Figure 5). Two studies ‐ Bond‐Indiana1 (A) and Quinlivan‐California 1995 ‐ seemed most heterogeneous (see above).
5.
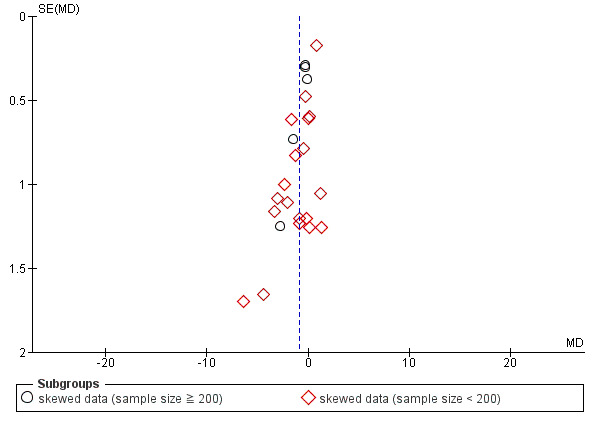
Funnel plot of comparison: 1 Intensive Case Management versus standard care, outcome: 1.1 Service use: 1. Average number of days in hospital per month ‐ by about 24 months.
We ran meta‐regression on trials providing data for the primary outcome 'average number of days in hospital per month ‐ at about 24 months' (combining data from all ICM studies within Comparison 1 and 2). Within the meta‐regression we found that i.) the more ICM is adherent to the organisation model, the better it is at decreasing time in hospital ('organisation fidelity' variable coefficient ‐0.36, 95% CI ‐0.66 to ‐0.07, Figure 6); and ii.) the higher the baseline hospital use in the population, the better ICM is at decreasing time in hospital ('baseline hospital use' variable coefficient ‐0.20, 95% CI ‐0.32 to ‐0.10, Figure 7). Combining both these variables within the model, 'organisation fidelity' is no longer significant (regression coefficient ‐0.24, 95% CI ‐0.52 to 0.04, P = 0.089), but 'baseline hospital use' resultstill significantly influences time in hospital, although it seems to lose some of its potency (regression coefficient ‐0.18, 95% CI ‐0.29 to ‐0.07, P = 0.0027) (Figure 8). Figure 8 shows the interaction of the two variables on study outcome graphically through the use of thin plate spline modelling. The plot provides a locally weighted two‐dimensional representation of the collinearity between the variables used in the regression.
6.
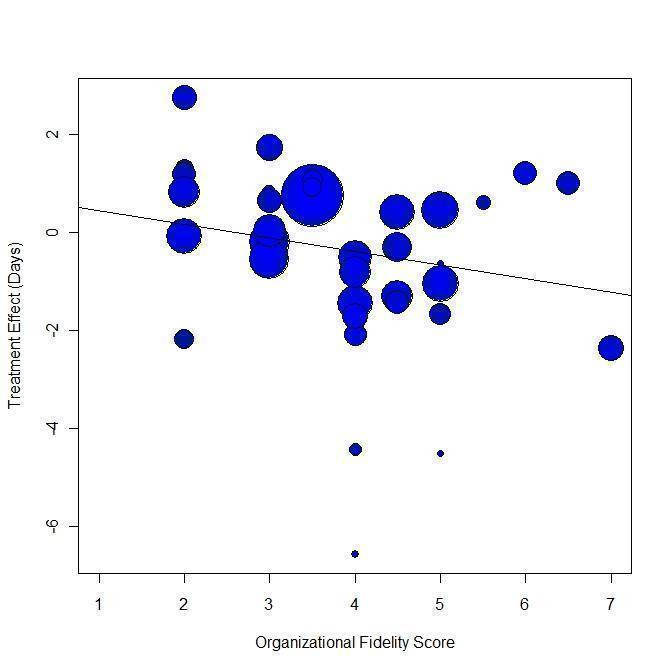
Meta‐regression: Scatterplot of IFACT organisation subscore versus mean days per month in hospital.
7.
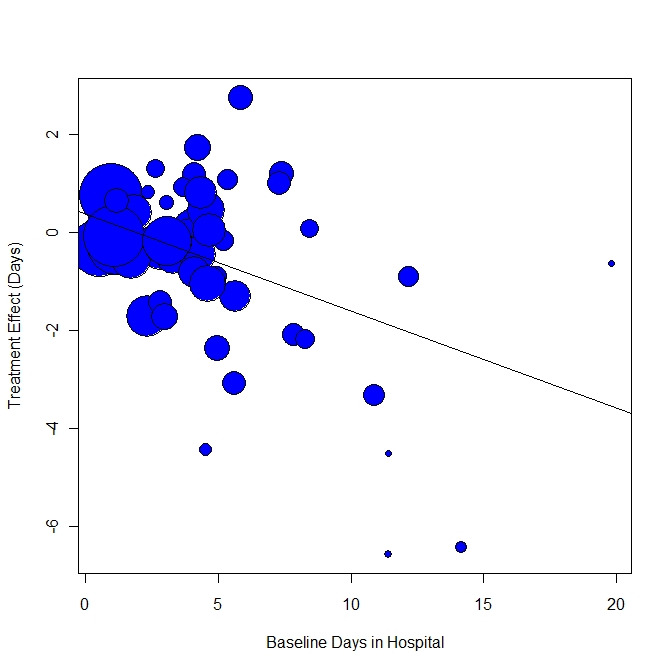
Meta‐regression: Scatterplot of mean baseline days in hospital versus mean days per month in hospital.
8.
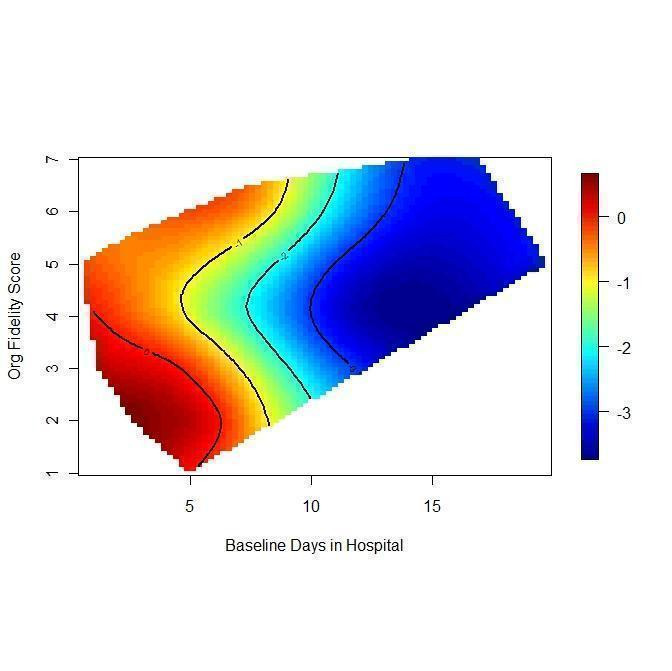
Weighted thin plate spline regression showing combined effect of baseline days in hospital and organisational fidelity score on treatment effect.
1.2 Service use: 1 Number of days in hospital ‐ by follow‐up (skewed data, sample size ≧ 200)
We identified one study relevant to this outcome, providing data by medium‐ and long‐term follow‐up (FUP) and measuring outcome during the previous year.
1.2.1 By medium‐term FUP (3 years) (previous year)
We found one trial to be relevant to this subgroup, with a total of 547 participants. For this subgroup, we did not find evidence of a clear difference between the two treatments (MD 0.1, 95% CI ‐10.26 to 10.46; Analysis 1.2).
1.2. Analysis.
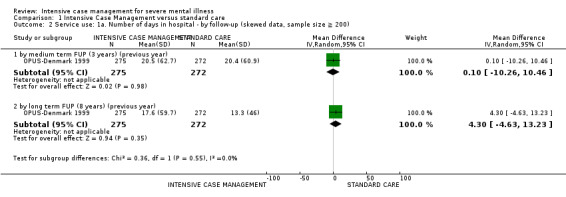
Comparison 1 Intensive Case Management versus standard care, Outcome 2 Service use: 1a. Number of days in hospital ‐ by follow ‐up (skewed data, sample size ≧ 200).
1.2.2 By long‐term FUP (8 years) (previous year)
There was a single trial in this subgroup, with a total of 547 participants. There was no clear difference between ICM and standard care within this subgroup (MD 4.3, 95% CI ‐4.63 to 13.23; Analysis 1.2).
1.3 Service use: 2. Not remaining in contact with psychiatric services
We found nine relevant studies (total n = 1633) for this outcome, providing data on different follow‐up length. Overall, when pooling studies from different time subgroups, we found a significant advantage to the ICM group, where people were less likely to be lost to psychiatric services than people in the standard care group (n = 1633, 9 RCTs, risk ratio (RR) 0.43, 95% CI 0.30 to 0.61, Figure 9). Heterogeneity was moderately high for this outcome (Chi2 = 15.57; df = 8.0; P = 0.05; I2 = 48%).
9.
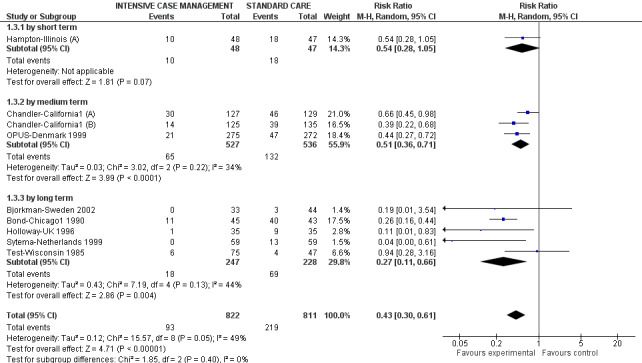
Forest plot of comparison: 1 Intensive Case Management versus standard care, outcome: 1.2 Service use: 2. Not remaining in contact with psychiatric services by short, medium, long term and overall.
As there were fewer than 10 studies for this outcome, we did not use a funnel plot (see Assessment of reporting biases).
1.3.1 By short term
We included only one short‐term study and found no significant difference between treatment groups (n = 95, 1 RCT, RR 0.54, 95% CI 0.28 to 1.05; Analysis 1.3).
1.3. Analysis.
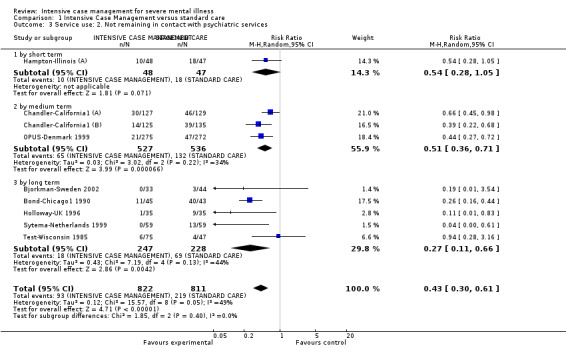
Comparison 1 Intensive Case Management versus standard care, Outcome 3 Service use: 2. Not remaining in contact with psychiatric services.
1.3.2 By medium term
Medium‐term data available from three studies showed a significant difference between treatment groups, favouring the ICM group, where participants had a lower risk of not remaining in contact with psychiatric services compared with participants in the standard care group (n = 1063, 3 RCTs, RR 0.51, 95% CI 0.36 to 0.71). Heterogeneity was moderately high for this subgroup (Chi2 = 3.02; df = 2.0; P = 0.22; I2 = 33%; Analysis 1.3).
1.3.3 By long term
Six long‐term studies data confirmed the trend favouring ICM, showing a significant advantage for the ICM group (n = 653, 6 RCTs, RR 0.35, 95% CI 0.18 to 0.68), but data were heterogeneous (I2 = 63%; P = 0.02). Herinckx‐Oregon 1996 seemed to be the sole cause of this, and on further consideration post hoc, we think we were in error in including the outcome from this study because it was defined so differently from the other trials. Herinckx‐Oregon 1996 did not include refusing to re‐interview, moving out, and death ‐ as all the other studies had done ‐ and it was impossible to amend this at this stage. We therefore feel justified in removing this study altogether from this part of the review outcomes. Once Herinckx‐Oregon 1996 was removed, the five remaining trials confirmed the significant advantage for the ICM group (n = 475, 5 RCTs, RR 0.27, 95% CI 0.11 to 0.66), and heterogeneity was restored to a moderate level (Chi2 = 7.19; df = 4.0; P = 0.13; I2 = 44%; Analysis 1.3).
1.4 Service use: 3a. Admitted to hospital
We identified 16 studies relevant to this outcome and categorised data into five subgroups (in keeping with our protocol).
1.4.1 By short term
Data were available from two short‐term studies and showed no significant differences between treatment groups (n = 244, 2 RCTs, RR 0.61, 95% CI 0.22 to 1.69), but these data were heterogeneous (Chi2 = 5.36; df = 1.0; P = 0.02; I2 = 81%; Analysis 1.4).
1.4. Analysis.
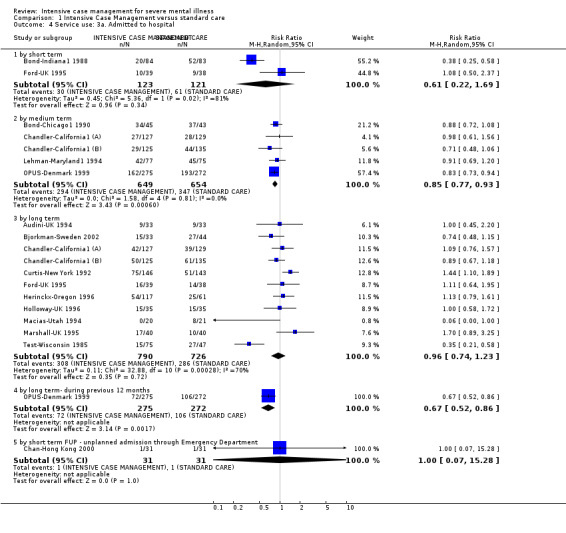
Comparison 1 Intensive Case Management versus standard care, Outcome 4 Service use: 3a. Admitted to hospital.
1.4.2 By medium term
Five studies reported medium‐term data, and these favoured the ICM group, which had less admission to hospital across time compared with standard care (n = 1303, 5 RCTs, RR 0.85, 95% CI 0.77 to 0.93; Analysis 1.4).
1.4.3 By long term
Eleven studies provided long‐term data. As with the short‐term data, they showed no significant differences between treatment groups (n = 1516, 11 RCTs, RR 0.96, 95% CI 0.74 to 1.23), but data were heterogeneous (Chi2 = 32.88; df = 10.0; P = 0.0; I2 = 69%; Analysis 1.4).
1.4.4 By long term‐ during previous 12 months
Only one study reported data by long term, but referring to the number of admissions across the previous year. We therefore could not enter this data in the long‐term data subgroup analysis. This data showed a significant effect favouring the ICM group (n = 547, 1 RCT, RR 0.67, 95% CI 0.52 to 0.86), therefore not consistent with long‐term data shown above. As these findings were based on data from one study only, we consider them less robust than the findings from the 11 long‐term studies Analysis 1.4.
1.4.5 By short term FUP ‐ unplanned admission through emergency department (ED)
We found one trial to be relevant to this subgroup (total n = 62). For this subgroup, we did not find evidence of a clear difference between the two treatments (RR 1.0, 95% CI 0.07 to 15.28; Analysis 1.4).
1.5 Service use: 3b. Average number of admissions per month (skewed data)
Data describing the average number of admissions per month were available from one medium‐term and three long‐term studies. All of these data were skewed and did not enter the analysis. Data from the medium‐term study suggested a trend favouring the ICM group. Data from the long‐term studies showed no trend favouring one group over the other. Audini‐UK 1994 and Muller‐Clemm‐Canada 1996 did not report variance measurements. We assumed consistency between studies and used the fully reported variance for Sytema‐Netherlands 1999, and employed these data for Audini‐UK 1994 and Muller‐Clemm‐Canada 1996 as well.
1.6 Service use: 4a. Admitted to ER ‐ by long term
The only study identified describing 'number admitted to ER' showed a non‐significant difference between the two groups (n = 178, 1 RCT, RR 1.13, 95% CI 0.72 to 1.76).
1.7 Service use: 4b. Average number of admissions to ER (skewed data) ‐ by medium term
The two studies describing the average number of admissions to ER reported skewed data. Skewed data were not consistent, as one study did not show any trend in the direction of effect, and the other study showed a trend favouring the ICM group. As in one study the variance measurement was not reported (Jerrell‐SCarolina1 1991), we carried the standard deviation over from the other available study (Lehman‐Maryland1 1994).
1.8 Service use: 5a. Received day hospital care ‐ by short‐term FUP
We identified only one study relevant to this outcome (total n = 62). There was not a significant difference between ICM and standard care (RR 2.0, 95% CI 0.19 to 20.93; Analysis 1.8).
1.8. Analysis.
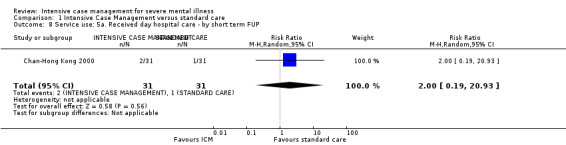
Comparison 1 Intensive Case Management versus standard care, Outcome 8 Service use: 5a. Received day hospital care ‐ by short term FUP.
1.9 Service use: 5b. Outpatient visits ‐ by short‐term FUP (6 months)
We identified only one study relevant to this outcome. There was not a significant difference between ICM and standard care (n = 62, 1 RCT, MD 0.29, 95% CI ‐0.14 to 0.72; Analysis 1.9).
1.9. Analysis.
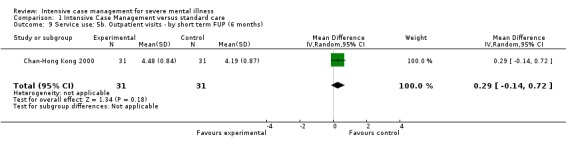
Comparison 1 Intensive Case Management versus standard care, Outcome 9 Service use: 5b. Outpatient visits ‐ by short term FUP (6 months).
1.10 Service use: 5c. Outpatient visits ‐ by medium term (skewed data)
One more small study provided data for this outcome (n = 134), but as data were skewed and the total sample less than 200, we entered them as 'Other' data. Data showed a trend favouring ICM, where the ICM group received more outpatient visits than the standard care group by medium term (Analysis 1.10).
1.10. Analysis.
Comparison 1 Intensive Case Management versus standard care, Outcome 10 Service use: 5c. Outpatient visits ‐ by medium term (skewed data).
| Service use: 5c. Outpatient visits ‐ by medium term (skewed data) | |||||
|---|---|---|---|---|---|
| Study | Intervention | Mean | SD | Total | Note |
| Cusack‐North Carolina | ICM | 95.9 | 57.1 | 72 | ‐ |
| Cusack‐North Carolina | Standard care | 43.3 | 47.9 | 62 | ‐ |
1.11 Service use: 5d. Received home visits ‐ by short‐term FUP
We found a single study showing a significant difference between ICM and standard care in the mean number of home visits received, favouring the ICM group (n = 62, 1 RCT, MD 4.32, 95% CI 3.42 to 5.22). Note that for this outcome the right graph label favours ICM (experimental group).
1.12 Adverse event: 1a. Death ‐ any cause
We found 14 relevant studies for this outcome, the data from which we divided into five subgroups according to different time to follow‐up. We found similar results in mortality across different subgroups, none of which showed a significant difference between ICM and standard carefor overall mortality.
1.12.1 By short term
We found two trials relevant to this subgroup, with a total of 161 participants. For this subgroup, two deaths occurred in the 81 people treated with ICM compared with two deaths in the 80 people treated with standard care (n = 161, 2 RCTs, RR 1.04, 95% CI 0.16 to 6.91; Analysis 1.12).
1.12. Analysis.
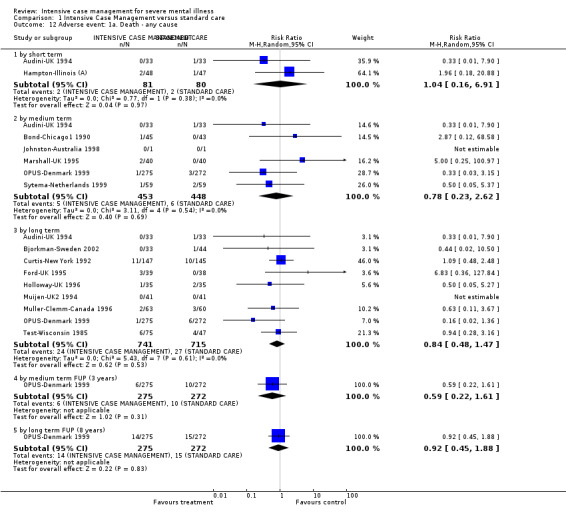
Comparison 1 Intensive Case Management versus standard care, Outcome 12 Adverse event: 1a. Death ‐ any cause.
1.12.2 By medium term
There were six relevant trials in this subgroup (total n = 901). For this subgroup, five deaths occurred in 453 people treated with ICM compared with six deaths in 448 people treated with standard care (n = 901, 6 RCTs, RR 0.78, 95% CI 0.23 to 2.62; Analysis 1.12).
1.12.3 By long term
We found nine trials relevant to this subgroup, with a total of 1456 participants. For this subgroup, 24 deaths occurred in 741 people treated with ICM compared with 27 deaths in 715 people treated with standard care (n = 1456, 9 RCTs, RR 0.84, 95% CI 0.48 to 1.47; Analysis 1.12).
1.12.4 By medium‐term FUP (3 years)
There was a single trial in this subgroup, in which six deaths occurred in 275 people treated with ICM compared with 10 deaths in 272 people treated with standard care, showing no significant difference between ICM and standard care (n = 547, 1 RCT, RR 0.59, 95% CI 0.22 to 1.61; Analysis 1.12).
1.12.5 By long‐term FUP (8 years)
There was a single trial in this subgroup, in which 14 deaths occurred in 275 people treated with ICM compared with 15 deaths in 272 people treated with standard care, showing no significant difference between ICM and standard care (n = 547, 1 RCT, RR 0.92, 95% CI 0.45 to 1.88; Analysis 1.12).
1.13 Adverse event: 1b. Death ‐ suicide
We found 12 relevant studies for this outcome and categorised data into four subgroups. Our results for mortality due to suicide were similar to those found for mortality due to all causes, that is no significant difference in suicide rate between the two intervention groups.
1.13.1 By short term
Data by short term were available from two studies, where no suicides occurred in 62 people treated with ICM compared with two suicides in 65 people treated with standard care (n = 127, 2 RCTs, RR 0.35, 95% CI 0.04 to 3.27; Analysis 1.13).
1.13. Analysis.
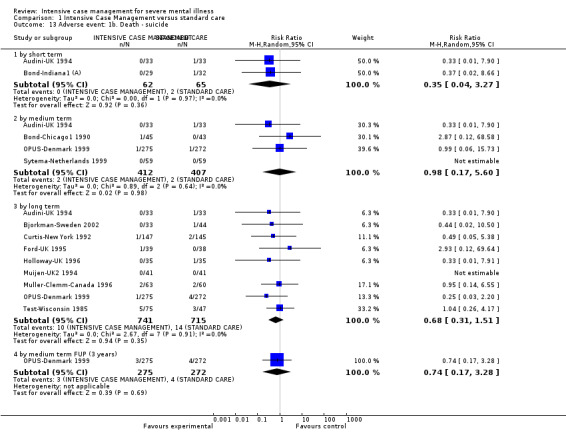
Comparison 1 Intensive Case Management versus standard care, Outcome 13 Adverse event: 1b. Death ‐ suicide.
1.13.2 By medium term
Data by medium term were available from four studies, where two suicides occurred in 412 people treated with ICM compared with two suicides in 407 people treated with standard care (n = 819, 4 RCTs, RR 0.98, 95% CI 0.17 to 5.60; Analysis 1.13).
1.13.3 By long term
Data by long term were available from nine studies, where 10 suicides occurred in 741 people treated with ICM compared with 14 suicides in 715 people treated with standard care (n = 1456, 9 RCTs, RR 0.68, 95% CI 0.31 to 1.51; Analysis 1.13).
1.13.4 By medium‐term FUP (3 years)
Data by medium‐term follow‐up (3 years) were available from one study, where three suicides occurred in 275 people treated with ICM compared with four suicides in 272 people treated with standard care (n = 547, 1 RCT, RR 0.74, 95% CI 0.17 to 3.28; Analysis 1.13).
1.14 Global state: 1. Leaving the study early
We identified 21 studies relevant to this outcome and categorised data into five subgroups (in keeping with our protocol).
1.14.1 By short term
We included five short‐term studies and found no significant differences between treatment groups for number of participants leaving the study early (n = 598, 5 RCTs, RR 0.79, 95% CI 0.44 to 1.41), but data were heterogeneous (Chi2 = 80.24; df = 4.0; P = 0.0; I2 = 95%; Analysis 1.14).
1.14. Analysis.
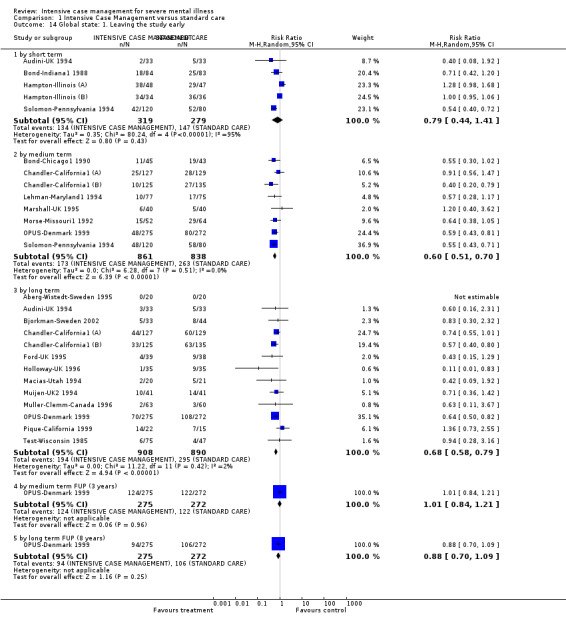
Comparison 1 Intensive Case Management versus standard care, Outcome 14 Global state: 1. Leaving the study early.
1.14.2 By medium term
We included eight medium‐term studies and found the risk of leaving the study early was lower for participants in the ICM group (n = 1699, 8 RCTs, RR 0.60, 95% CI 0.51 to 0.70; Analysis 1.14).
1.14.3 By long term
Data from 13 long‐term studies confirmed data from medium‐term studies, showing a significant advantage for ICM (n = 1798, 13 RCTs, RR 0.68, 95% CI 0.58 to 0.79; Analysis 1.14).
1.14.4 By medium‐term FUP (3 years)
There was a single trial in this subgroup, showing no significant difference between ICM and standard care (n = 547, 1 RCT, RR 1.01, 95% CI 0.84 to 1.21; Analysis 1.14).
1.14.5 By long‐term FUP (8 years)
We found one trial relevant to this subgroup, showing no significant difference between ICM and standard care (n = 547, 1 RCT, RR 0.88, 95% CI 0.7 to 1.09; Analysis 1.14).
1.15 Global state: 2. Average endpoint score (Global Assessment of Functioning Scale, high = good)
We identified five studies relevant to this outcome and categorised data into three subgroups. Note that for this outcome the right graph label favours ICM (experimental group).
1.15.1 By short term
There were four relevant trials in this subgroup (total n = 797). For this subgroup, the Global Assessment of Functioning Scale (GAF) score favoured ICM (MD 2.07, 95% CI 0.28 to 3.86; Analysis 1.15).
1.15. Analysis.
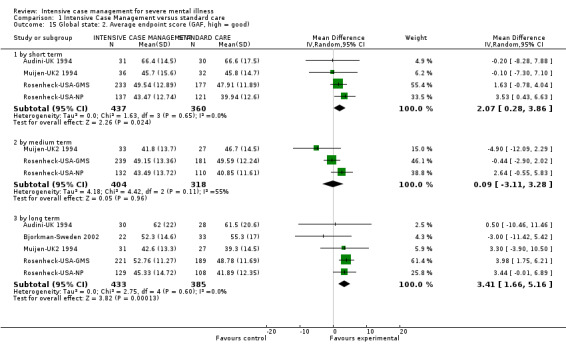
Comparison 1 Intensive Case Management versus standard care, Outcome 15 Global state: 2. Average endpoint score (GAF, high = good).
1.15.2 By medium term
Medium‐term GAF data from three studies (n = 722, 3 RCTs, MD 0.09, 95% CI ‐3.11 to 3.28) showed no significant difference between groups. This subgroup had important levels of heterogeneity (Chi2 = 4.42; df = 2.0; P = 0.11; I2 = 54%; Analysis 1.15).
1.15.3 By long term
We found five trials relevant to this subgroup, with a total of 818 participants. For this subgroup, the GAF score favoured the ICM group (MD 3.41, 95% CI 1.66 to 5.16; Analysis 1.15).
1.16 Global state: 3. Not compliant with medication ‐ by long term
We only found data from one long‐term study, which favoured the ICM group (n = 71, 1 RCT, RR 0.35, 95% CI 0.15 to 0.81).
1.17 Social functioning: 1a. Contact with legal system (various measurements)
We found 11 relevant studies for this outcome and categorised data into six subgroups, according to different time to follow‐up and different outcomes described.
1.17.1 By short term ‐ contact with the police
We only found data from one study for short‐term outcomes, describing the outcome 'contact with the police'. This study did not reveal any significant difference in the rate of contact with the police between treatment groups (n = 61, 1 RCT, RR 2.57, 95% CI 0.73 to 9.04; Analysis 1.17).
1.17. Analysis.
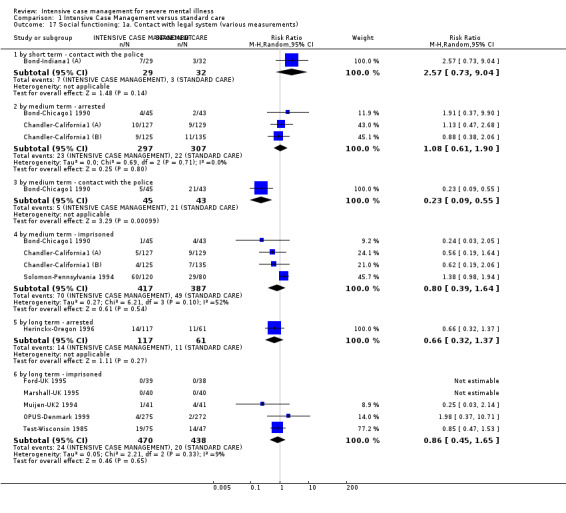
Comparison 1 Intensive Case Management versus standard care, Outcome 17 Social functioning: 1a. Contact with legal system (various measurements).
1.17.2 By medium term ‐ arrested
We found three studies describing the outcome 'number of arrested'. These studies failed to show a significant difference between the two intervention groups (n = 604, 3 RCTs, RR 1.08, 95% CI 0.61 to 1.90; Analysis 1.17).
1.17.3 By medium term ‐ contact with the police
Only one medium‐term study was available providing data on 'contact with the police'. These data favoured the ICM group in reducing the number of contacts with the police (n = 88, 1 RCT, RR 0.23, 95% CI 0.09 to 0.55; Analysis 1.17).
1.17.4 By medium term ‐ imprisoned
We found four medium‐term studies describing 'number of imprisoned'. These studies showed no significant advantage for the ICM group (n = 804, 4 RCTs, RR 0.80, 95% CI 0.39 to 1.64). This subgroup had important levels of heterogeneity (Chi2 = 6.21; df = 3.0; P = 0.1; I2 = 51%; Analysis 1.17).
1.17.5 By long term ‐ arrested
We found data from one study for long‐term outcomes, describing the outcome 'number of arrested' , and it showed no significant advantage for ICM (n = 178, 1 RCT, RR 0.66, 95% CI 0.32 to 1.37; Analysis 1.17).
1.17.6 By long term ‐ imprisoned
We found also five long‐term studies reporting data on 'number of imprisoned', again not showing any significant advantage for ICM in reducing the number of participants imprisoned by long term (n = 908, 5 RCTs, RR 0.86, 95% CI 0.45 to 1.65; Analysis 1.17).
1.18 Social functioning: 1b. Mean contacts with legal system (skewed data) ‐ by medium term
Data were available from one medium‐term trial, describing three different outcomes: bookings, jail days, and convictions. All these data were skewed and did not enter the analysis, therefore we have presented them in Analysis 1.18. Data on booking and jail days suggested a trend favouring the ICM group, reducing contacts with legal system. Data on convictions did not show a trend favouring one group over the other.
1.18. Analysis.
Comparison 1 Intensive Case Management versus standard care, Outcome 18 Social functioning: 1b. Mean contacts with legal system (skewed data) ‐ by medium term.
| Social functioning: 1b. Mean contacts with legal system (skewed data) ‐ by medium term | ||||
|---|---|---|---|---|
| Study | Intervention | Mean | SD | Total |
| Bookings | ||||
| Cusack‐North Carolina | 1. ICM | 0.64 | 1.2 | 72 |
| Cusack‐North Carolina | 2. Standard care | 1.42 | 1.86 | 62 |
| Jail days | ||||
| Cusack‐North Carolina | 1. ICM | 18.5 | 45.3 | 72 |
| Cusack‐North Carolina | 2. Standard care | 35.3 | 56.9 | 62 |
| Convictions | ||||
| Cusack‐North Carolina | 1. ICM | 0.75 | 0.77 | 72 |
| Cusack‐North Carolina | 2. Standard care | 0.85 | 1.03 | 62 |
1.19 Social functioning: 2. Employment status (various measurements)
We found six relevant studies for this outcome and categorised data into six subgroups, according to different time to follow‐up and various outcomes described.
1.19.1 By medium term ‐ not competitively employed at the end of the trial
One study reported data on 'not competitively employed at the end of the trial', and these data did not show a significant advantage for ICM in improving the number of competitively employed people (n = 88, 1 RCT, RR 1.00, 95% CI 0.91 to 1.10; Analysis 1.19).
1.19. Analysis.
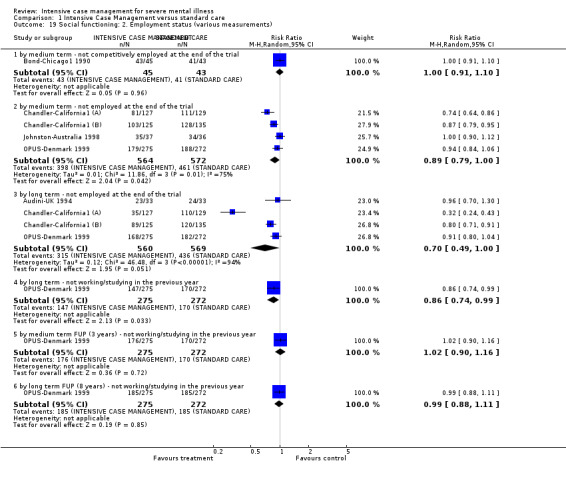
Comparison 1 Intensive Case Management versus standard care, Outcome 19 Social functioning: 2. Employment status (various measurements).
1.19.2 By medium term ‐ not employed at the end of the trial
We found four trials relevant to this subgroup; these also failed to show a significant difference between groups, although data did suggest a trend favouring ICM (n = 1136, 4 RCTs, RR 0.89, 95% CI 0.79 to 1.0). However, heterogeneity was present (Chi2 = 11.86; df = 3.0; P = 0.01; I2 = 74%; Analysis 1.19).
1.19.3 By long term ‐ not employed at the end of the trial
We found four trials relevant to this subgroup. As in the medium‐term comparison, data failed to show a significant difference, although they suggested a trend favouring the ICM group (n = 1129, 4 RCTs, RR 0.70, 95% CI 0.49 to 1.00). However, again, there was considerable heterogeneity (Chi2 = 46.48; df = 3.0; P = 0.0; I2 = 93%; Analysis 1.19).
1.19.4 By long term ‐ not working/studying in the previous year
We found one trial relevant to this subgroup, with a total of 547 participants. Data showed a significant difference between groups, favouring ICM in reducing the risk of being 'not working or not studying' compared to standard care (n = 547, 1 RCT, RR 0.86, 95% CI 0.74 to 0.99). Heterogeneity for this outcome was high (Chi2 = 0.0; df = 0.0; P = 0.0; I2 = 100%; Analysis 1.19).
1.19.5 By medium‐term FUP (3 years) ‐ not working/studying in the previous year
There was a single trial in this subgroup. Data failed to show a signiifcant difference between groups (n = 547, 1 RCT, RR 1.02, 95% CI 0.9 to 1.16; Analysis 1.19).
1.19.6 By long‐term FUP (8 years) ‐ not working/studying in the previous year
We found one trial relevant to this subgroup. Again, we did not find evidence of a clear difference between the two treatments (n = 547, 1 RCT, RR 0.99, 95% CI 0.88 to 1.11; Analysis 1.19).
1.20 Social functioning: 3a. Accommodation status (various measurements)
We found 10 relevant studies for this outcome, the data from which we divided into six subgroups according to different time to follow‐up and various outcomes described.
1.20.1 By short term ‐ homelessness
We found data on the outcome 'homelessness' from one short‐term study. This small study revealed a significant reduction in the rate of homelessness in the ICM group (n = 95, 1 RCT, RR 0.04, 95% CI 0.00 to 0.70; Analysis 1.20).
1.20. Analysis.
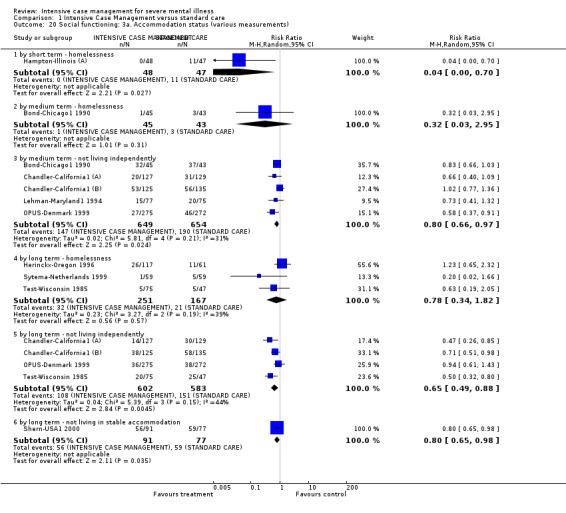
Comparison 1 Intensive Case Management versus standard care, Outcome 20 Social functioning: 3a. Accommodation status (various measurements).
1.20.2 By medium term ‐ homelessness
Medium‐term data on the outcome 'homelessness' were available from one small study. Data did not reveal any significant difference between groups in the rate of homelessness by the medium term (n = 88, 1 RCT, RR 0.32, 95% CI 0.03 to 2.95; Analysis 1.20).
1.20.3 By medium term ‐ not living independently
We found five trials relevant to this subgroup. These data showed a significant advantage for ICM in reducing the number of participants not living independently (n = 1303, 5 RCTs, RR 0.80, 95% CI 0.66 to 0.97). Heterogeneity for this subgroup was moderately high (Chi2 = 5.81; df = 4.0; P = 0.21; I2 = 31%; Analysis 1.20).
1.20.4 By long term ‐ homelessness
We found 'homelessness' data in three long‐term studies, which did not reveal any significant difference between intervention groups (n = 418, 3 RCTs, RR 0.78, 95% CI 0.34 to 1.82). This subgroup had moderate levels of heterogeneity (Chi2 = 3.27; df = 2.0; P = 0.19; I2 = 38%; Analysis 1.20).
1.20.5 By long term ‐ not living independently
There were four relevant trials in this subgroup. Data for this subgroup favoured the ICM group, where the incidence of not living independently was lower compared with the standard care group (n = 1185, 4 RCTs, RR 0.65, 95% CI 0.49 to 0.88). This subgroup had moderate levels of heterogeneity (Chi2 = 5.39; df = 3.0; P = 0.15; I2 = 44%; Analysis 1.20).
1.20.6 By long term ‐ not living in stable accommodation
The outcome 'not living in stable accommodation' was only available from one study. We found that data favoured the ICM group in reducing the number of participants not living in stable accommodation (n = 168, 1 RCT, RR 0.80, 95% CI 0.65 to 0.98; Analysis 1.20).
1.21 Social functioning: 3b. Accomodation status: mean number of days in supported house (skewed data, sample size ≧ 200)
We identified only one study relevant to this outcome, providing data at different times, but always referring to the previous year of follow‐up. Note that for this outcome the right graph label favours ICM (experimental group).
1.21.1 By long term (previous year)
There was no significant difference between ICM and standard care within this subgroup (n = 547, 1 RCT, MD 0.3, 95% CI ‐13.98 to 14.58; Analysis 1.21).
1.21. Analysis.
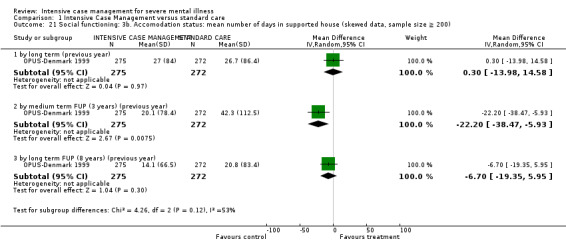
Comparison 1 Intensive Case Management versus standard care, Outcome 21 Social functioning: 3b. Accomodation status: mean number of days in supported house (skewed data, sample size ≧ 200).
1.21.2 By medium‐term FUP (3 years) (previous year)
We found evidence of a significant difference between ICM and standard care within this subgroup, with data favouring standard care over ICM (n = 547, 1 RCT, MD ‐22.2, 95% CI ‐38.47 to ‐5.93; Analysis 1.21).
1.21.3 By long‐term FUP (8 years) (previous year)
We did not find evidence of a significant difference between the two treatments for this subgroup (n = 547, 1 RCT, MD ‐6.7, 95% CI ‐19.35 to 5.95; Analysis 1.21).
1.22 Social functioning: 3c. Accommodation status (various measurements, skewed data)
Data on this outcome were available from three studies; as all of these data were skewed and did not enter the analysis, we have presented them in Analysis 1.22.
1.22. Analysis.
Comparison 1 Intensive Case Management versus standard care, Outcome 22 Social functioning: 3c. Accommodation status (various measurements, skewed data).
| Social functioning: 3c. Accommodation status (various measurements, skewed data) | ||||
|---|---|---|---|---|
| Study | Intervention | Mean | SD | Total |
| by medium term ‐ average days per month in stable accommodation | ||||
| Lehman‐Maryland1 1994 | 1. ICM | 17.5 | 9 | 77 |
| Lehman‐Maryland1 1994 | 2. Standard care | 13.34 | 9 | 75 |
| Morse‐Missouri3 2005 | 1. ICM | 5.77 | 7.42 | 54 |
| Morse‐Missouri3 2005 | 2. Standard care | 5.02 | 8.62 | 49 |
| by long term ‐ average days per month in sheltered homes | ||||
| Morse‐Missouri3 2005 | 1. ICM | 17.78 | 12.68 | 54 |
| Morse‐Missouri3 2005 | 2. Standard care | 12.59 | 13.27 | 49 |
| Sytema‐Netherlands 1999 | 1. ICM | 2.8 | 7.4 | 58 |
| Sytema‐Netherlands 1999 | 2. Standard care | 3.6 | 9.2 | 57 |
Two studies provided medium‐term data on 'average days in stable accommodation', which showed a trend favouring the ICM group, consistent with results previously described for 'not living in stable accommodation' by long term.
Two studies provided long‐term data on 'average days per month in sheltered homes'. These data were equivocal, as data from one study favoured ICM, whilst data from the second study favoured the standard care group.
1.23 Social functioning: 4a. Substance abuse
We identified only one study relevant to this outcome, providing various measures at different time of follow‐up.
1.23.1 Alcohol abuse ‐ by long term
We found one trial relevant to this subgroup (total n = 547). There was no significant difference between ICM and standard care within this subgroup (n = 547, 1 RCT, RR 0.55, 95% CI 0.26 to 1.17; Analysis 1.23).
1.23. Analysis.
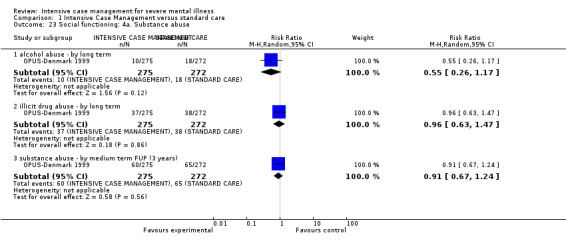
Comparison 1 Intensive Case Management versus standard care, Outcome 23 Social functioning: 4a. Substance abuse.
1.23.2 Illicit drug abuse ‐ by long term
As for alcohol abuse, data failed to show a significant difference between groups for this subgroup (n = 547, 1 RCT, RR 0.96, 95% CI 0.63 to 1.47; Analysis 1.23).
1.23.3 Substance abuse ‐ by medium‐term FUP (3 years)
We found one trial relevant to this subgroup (total n = 547). As for the two previous outcomes, data failed to show a significant difference between groups (RR 0.91, 95% CI 0.67 to 1.24; Analysis 1.23).
1.24 Social functioning: 4b. Substance abuse (Dartmouth Assessment of Lifestyle Interview (DALI), skewness not detectable) ‐ by medium term
We were unable to enter two types of data into the analysis: medium‐term data assessing alcohol and drug abuse on DALI scale. As the DALI scale averages values from positive to negative, skew is very difficult to detect, we did not enter these data in the analysis. These data tended to favour the standard care group for both the alcohol and drug abuse outcomes; we have presented them in Analysis 1.25.
1.25. Analysis.
Comparison 1 Intensive Case Management versus standard care, Outcome 25 Social functioning: 4c. Substance abuse ‐ days used per month (skewed data).
| Social functioning: 4c. Substance abuse ‐ days used per month (skewed data) | ||||
|---|---|---|---|---|
| Study | Intervention | Mean | SD | Total |
| by medium term | ||||
| Morse‐Missouri3 2005 | 1. ICM | 6.25 | 7.84 | 54 |
| Morse‐Missouri3 2005 | 2. Standard care | 6.34 | 7.52 | 49 |
| by long term | ||||
| Morse‐Missouri3 2005 | 1. ICM | 6.77 | 8.86 | 54 |
| Morse‐Missouri3 2005 | 2. Standard care | 6.42 | 7.84 | 49 |
1.25 Social functioning: 4c. Substance abuse ‐ days used per month (skewed data)
One study provided medium‐ and long‐term data from the outcome 'days of substance use per month', which were equivocal, but skewed; we have therefore presented them in Analysis 1.25.
1.26 Social functioning: 5a. Average endpoint score (various scales)
Three studies provided data from five different scales (Disability Assessment Scale (DAS), Interview Schedule for Social Interaction (ISSI), Role Functioning Scale (RFS), Social Adjustment Scale (SAS‐adapted version), Strauss‐Carpenter Outcome Scale) assessing social functioning by short, medium, and long term. As no more than one study used the same scale per time period, we did not enter more than one study per subgroup. Data from each available time period failed to show any significant difference between treatment groups, with the exception of two outcomes by long term (1.26.7 on ISSI and 1.26.8 on RFS), the first favouring the standard care group, and the second favouring the ICM group.
1.26.1 By short term (RFS, low = poor)
One trial providing data, no significant difference between groups (n = 80, 1 RCT, MD ‐0.62, 95% CI ‐2.23 to 0.99; Analysis 1.26).
1.26. Analysis.
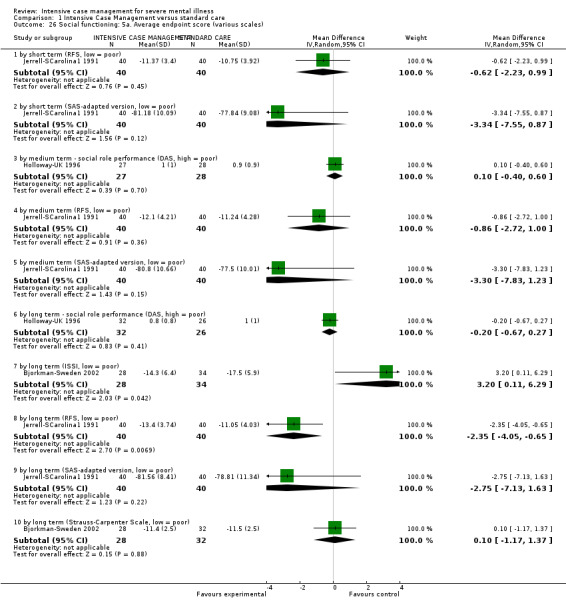
Comparison 1 Intensive Case Management versus standard care, Outcome 26 Social functioning: 5a. Average endpoint score (various scales).
1.26.2 By short term (SAS‐adapted version, low = poor)
One trial providing data, no significant difference between groups (n = 80, 1 RCT, MD ‐3.34, 95% CI ‐7.55 to 0.87; Analysis 1.26).
1.26.3 By medium term ‐ social role performance (DAS, high = poor)
One trial providing data, no significant difference between groups (n = 55, 1 RCT, MD 0.1, 95% CI ‐0.4 to 0.6; Analysis 1.26).
1.26.4 By medium term (RFS, low = poor)
One trial providing data, no significant difference between groups (n = 80, 1 RCT, MD ‐0.86, 95% CI ‐2.72 to 1.0; Analysis 1.26).
1.26.5 By medium term (SAS‐adapted version, low = poor)
One trial providing data, no significant difference between groups (n = 80, 1 RCT, MD ‐3.3, 95% CI ‐7.83 to 1.23; Analysis 1.26).
1.26.6 By long term ‐ social role performance (DAS, high = poor)
One trial providing data, no significant difference between groups (n = 58, 1 RCT, MD ‐0.2, 95% CI ‐0.67 to 0.27; Analysis 1.26).
1.26.7 By long term (ISSI, low = poor)
One trial providing data, showing a significant difference between groups favouring standard careover ICM (n = 62, 1 RCT, MD 3.2, 95% CI 0.11 to 6.29; Analysis 1.26).
1.26.8 By long term (RFS, low = poor)
One trial providing data, showing a significant difference between groups favouring ICM over standard care (n = 80, 1 RCT, MD ‐2.35, 95% CI ‐4.05 to ‐0.65; Analysis 1.26).
1.26.9 By long term (SAS‐adapted version, low = poor)
One trial providing data, no significant difference between groups (n = 80, 1 RCT, MD ‐2.75, 95% CI ‐7.13 to 1.63; Analysis 1.26).
1.26.10 By long term (Strauss‐Carpenter Outcome Scale, low = poor)
One trial providing data, no significant difference between groups (n = 60, 1 RCT, MD 0.1, 95% CI ‐1.17 to 1.37; Analysis 1.26).
1.27 Social functioning: 5b. Average endpoint score (various scales, skewed data)
Skewed data on SAS score were available by short, medium, and long term from two studies. These data were equivocal and not consistent between the two studies. One study provided long‐term data on REHAB Scale score, which tended to favour the ICM group, but were also skewed. We have presented them in Analysis 1.27.
1.27. Analysis.
Comparison 1 Intensive Case Management versus standard care, Outcome 27 Social functioning: 5b. Average endpoint score (various scales, skewed data).
| Social functioning: 5b. Average endpoint score (various scales, skewed data) | ||||
|---|---|---|---|---|
| Study | Intervention | Mean | SD | Total |
| by short term (SAS, high = poor) | ||||
| Muijen‐UK2 1994 | 1. ICM | 3.9 | 1.1 | 35 |
| Muijen‐UK2 1994 | 2. Standard care | 3.9 | 1.6 | 29 |
| by medium term (SAS, high = poor) | ||||
| Muijen‐UK2 1994 | 1. ICM | 4.3 | 1.6 | 29 |
| Muijen‐UK2 1994 | 2. Standard care | 3.7 | 1.5 | 25 |
| by long term (SAS, high = poor) | ||||
| Audini‐UK 1994 | 1. ICM | 3.0 | 1.6 | 30 |
| Audini‐UK 1994 | 2. Standard care | 2.9 | 1.1 | 28 |
| Muijen‐UK2 1994 | 1. ICM | 3.6 | 1.4 | 24 |
| Muijen‐UK2 1994 | 2. Standard care | 4.2 | 1.4 | 22 |
| by long term (REHAB, high = poor) | ||||
| Marshall‐UK 1995 | 1. ICM | 31.7 | 29.3 | 31 |
| Marshall‐UK 1995 | 2. Standard care | 40.83 | 19.65 | 30 |
1.28 Mental state: 1a. General symptoms ‐ average endpoint score (various scales)
Two sets of data were available: i.) non‐skewed data or skewed data from a sample size greater than or equal to 200 participants per study: entering analysis together; and ii.) skewed data: not entering analysis.
We identified four studies relevant to this outcome entering analysis, providing data from three different scales (Brief Psychiatric Rating Scale (BPRS‐18 items), Brief Symptom Inventory (BSI), Colorado Symptom Index (CSI)) per different time period.
1.28.1 By short term (BPRS‐18 items, high = poor)
We found two trials relevant to this subgroup. There was no significant difference between ICM and standard care within this subgroup (n = 668, 2 RCTs, MD ‐1.56, 95% CI ‐6.85 to 3.73), but data were heterogeneous (Chi2 = 12.58; df = 1.0; P = 0.0; I2 = 92%; Analysis 1.28).
1.28. Analysis.
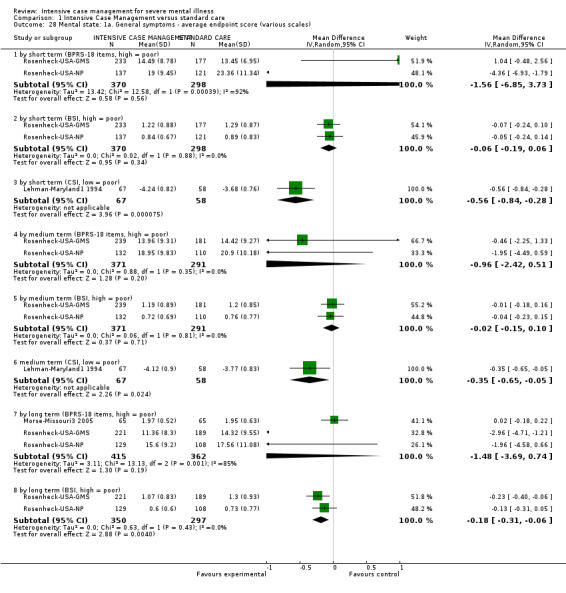
Comparison 1 Intensive Case Management versus standard care, Outcome 28 Mental state: 1a. General symptoms ‐ average endpoint score (various scales).
1.28.2 By short term (BSI, high = poor)
Short‐term mental state scores assessed with the BSI were available from the same two studies providing BPRS short‐term data. Again, data were not significantly different (n = 668, 2 RCTs, MD ‐0.06, 95% CI ‐0.19 to 0.06; Analysis 1.28); however, different from the BPRS results, these data were homogeneous.
1.28.3 By short term (CSI, low = poor)
One further trial was available providing short‐term data on mental state assessed with the CSI. These data showed a significant difference between groups favouring the ICM group (n = 125, 1 RCT, MD ‐0.56, 95% CI ‐0.84 to ‐0.28; Analysis 1.28).
1.28.4 By medium term (BPRS‐18 items, high = poor)
We found two trials relevant to this subgroup, with a total of 662 people. We did not find evidence of a significant difference between ICM and standard care within this subgroup (MD ‐0.96, 95% CI ‐2.42 to 0.51; Analysis 1.28).
1.28.5 By medium term (BSI, high = poor)
We found two trials relevant to this subgroup (total n = 662). We did not find evidence of a significant difference between ICM and standard care within this subgroup (MD ‐0.02, 95% CI ‐0.15 to 0.1; Analysis 1.28).
1.28.6 By medium term (CSI, low = poor)
There was a single trial in this subgroup. We found evidence favouring the ICM group over the standard care group (n = 125, 1 RCT, MD ‐0.35, 95% CI ‐0.65 to ‐0.05; Analysis 1.28).
1.28.7 By long term (BPRS‐18 items, high = poor)
We found three trials relevant to this subgroup (total n = 777). There was no significant difference between ICM and standard care within this subgroup (n = 777, 3 RCTs, MD ‐1.48, 95% CI ‐3.69 to 0.74), but data were heterogeneous (Chi2 = 13.13; df = 2.0; P = 0.0; I2 = 84%; Analysis 1.28).
1.28.8 By long term (BSI, high = poor)
We found two trials relevant to this subgroup, with data favouring the ICM group, in which participants reached a better mental state score by long term compared to the standard care group (n = 647, 2 RCTs, MD ‐0.18, 95% CI ‐0.31 to ‐0.06; Analysis 1.28).
1.29 Mental state: 1b. General symptoms ‐ mean change from baseline (CSI, low = poor ) ‐ by long term
Finally, one study assessed the mean change from baseline on the CSI, with data showing no difference between groups (n = 168, 1 RCT, MD ‐0.32, 95% CI ‐0.53 to ‐0.11).
1.30 Mental state: 1c. General symptoms ‐ average endpoint score (various scales, skewed data)
Skewed data were available from six studies assessing mental state by different time periods and with different scales (BPRS‐18 items, BPRS‐24 items, CPRS, PSE, SCL‐90). Data failed to show a significant trend favouring one group over the other, this report being consistent across different studies and different rating scales. We considered these data to not be robust as they were skewed, but they were in accordance with short‐, medium‐, and long‐term data. We have presented them in Analysis 1.30.
1.30. Analysis.
Comparison 1 Intensive Case Management versus standard care, Outcome 30 Mental state: 1c. General symptoms ‐ average endpoint score (various scales, skewed data).
| Mental state: 1c. General symptoms ‐ average endpoint score (various scales, skewed data) | ||||
|---|---|---|---|---|
| Study | Intervention | Mean | SD | Total |
| by short term (BPRS‐24 items, high = poor) | ||||
| Audini‐UK 1994 | 1. ICM | 39.1 | 10.0 | 31 |
| Audini‐UK 1994 | 2. Standard Care | 39.5 | 12.0 | 30 |
| Muijen‐UK2 1994 | 1. ICM | 42.4 | 16.8 | 36 |
| Muijen‐UK2 1994 | 2. Standard Care | 43.1 | 15.2 | 32 |
| by short term (PSE, high = poor) | ||||
| Audini‐UK 1994 | 1. ICM | 7.2 | 7.2 | 31 |
| Audini‐UK 1994 | 2. Standard Care | 8.4 | 9.3 | 30 |
| Muijen‐UK2 1994 | 1. ICM | 19.9 | 19.5 | 35 |
| Muijen‐UK2 1994 | 2. Standard Care | 17.3 | 15.8 | 32 |
| by medium term (BPRS‐24 items, high = poor) | ||||
| Audini‐UK 1994 | 1. ICM | 42.3 | 14.8 | 30 |
| Audini‐UK 1994 | 2. Standard Care | 41.4 | 12.2 | 28 |
| Muijen‐UK2 1994 | 1. ICM | 45.7 | 15.2 | 32 |
| Muijen‐UK2 1994 | 2. Standard Care | 43.1 | 12.7 | 26 |
| Sytema‐Netherlands 1999 | 1. ICM | 38 | 10 | 45 |
| Sytema‐Netherlands 1999 | 2. Standard Care | 42 | 11 | 36 |
| by medium term (CPRS, high = poor) | ||||
| Holloway‐UK 1996 | 1. ICM | 20.6 | 12.1 | 22 |
| Holloway‐UK 1996 | 2. Standard Care | 21.3 | 14.0 | 22 |
| by medium term (PSE, high = poor) | ||||
| Muijen‐UK2 1994 | 1. ICM | 18.7 | 15.9 | 35 |
| Muijen‐UK2 1994 | 2. Standard Care | 14.4 | 15 | 27 |
| by long term (BPRS‐18 items, high = poor) | ||||
| Ford‐UK 1995 | 1. ICM | 12.8 | 9.6 | 36 |
| Ford‐UK 1995 | 2. Standard Care | 13.5 | 11.9 | 32 |
| by long term (BPRS‐24 items, high = poor) | ||||
| Muijen‐UK2 1994 | 1. ICM | 44.4 | 13.3 | 31 |
| Muijen‐UK2 1994 | 2. Standard Care | 51.8 | 18.8 | 26 |
| by long term (CPRS, high = poor) | ||||
| Holloway‐UK 1996 | 1. ICM | 21.6 | 12.9 | 21 |
| Holloway‐UK 1996 | 2. Standard Care | 22.4 | 14.5 | 19 |
| by long term (PSE, high = poor) | ||||
| Audini‐UK 1994 | 1. ICM | 7.6 | 8.2 | 30 |
| Audini‐UK 1994 | 2. Standard Care | 10.6 | 12.2 | 28 |
| Muijen‐UK2 1994 | 1. ICM | 20.3 | 13.7 | 28 |
| Muijen‐UK2 1994 | 2. Standard Care | 27.6 | 23.5 | 25 |
| by long term (SCL‐90, high = poor) | ||||
| Bjorkman‐Sweden 2002 | 1. ICM | 102 | 68.5 | 27 |
| Bjorkman‐Sweden 2002 | 2. Standard Care | 81.4 | 55.1 | 33 |
1.31 Mental state: 2a. Specific symptoms ‐ depression at follow‐up interview
We found data on specific symptoms from only one study, which provided data on depression incidence per different time period. There was no significant difference between groups by medium term, long term, and medium‐term follow‐up (three years).
1.31.1 By medium term
One trial providing data, no significant difference between groups (n = 547, 1 RCT, RR 0.77, 95% CI 0.56 to 1.04; Analysis 1.31).
1.31. Analysis.
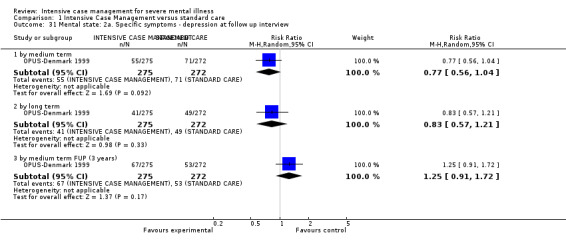
Comparison 1 Intensive Case Management versus standard care, Outcome 31 Mental state: 2a. Specific symptoms ‐ depression at follow up interview.
1.31.2 By long term
One trial providing data, no significant difference between groups (n = 547, 1 RCT, RR 0.83, 95% CI 0.57 to 1.21; Analysis 1.31).
1.31.3 By medium term FUP (3 years)
One trial providing data, no significant difference between groups (n = 547, 1 RCT, RR 1.25, 95% CI 0.91 to 1.72; Analysis 1.31).
1.32 Mental state: 2b. Specific symptoms ‐ average endpoint score (various scales, skewed data, sample size ≧ 200)
We identified only one study (n = 547) relevant to this outcome, providing data on two different dimensions (positive and negative symptoms) assessed at different times. Although skewed, data entered the analyses, as the sample size was greater than or equal to 200 participants per study. Only one comparison showed a significant advantage for the ICM group, in reducing risk of negative symptoms by long term.
1.32.1 By long term ‐ positive symptoms (Scale for the Assessment of Positive Symptoms (SAPS), high = poor)
One trial providing data, showing no significant difference between groups, although tending to favour the ICM group (n = 547, 1 RCT, MD ‐0.22, 95% CI ‐0.45 to 0.01; Analysis 1.32).
1.32. Analysis.
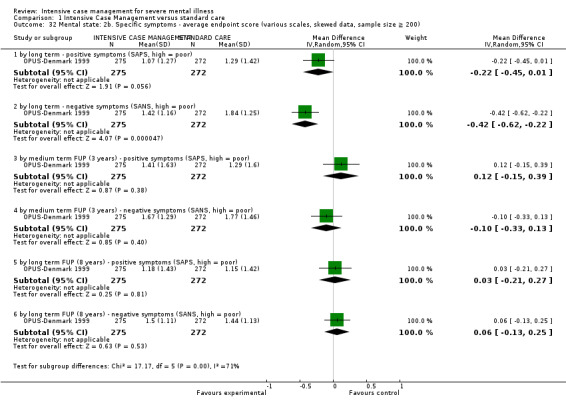
Comparison 1 Intensive Case Management versus standard care, Outcome 32 Mental state: 2b. Specific symptoms ‐ average endpoint score (various scales, skewed data, sample size ≧ 200).
1.32.2 By long term ‐ negative symptoms (Scale for the Assessment of Negative Symptoms (SANS), high = poor)
One trial providing data, showing evidence of a significant difference between groups favouring ICM over standard care (n = 547, 1 RCT, MD ‐0.42, 95% CI ‐0.62 to ‐0.22; Analysis 1.32).
1.32.3 By medium‐term FUP (3 years) ‐ positive symptoms (SAPS, high = poor)
One trial providing data, no significant difference between groups (n = 547, 1 RCT, MD 0.12, 95% CI ‐0.15 to 0.39; Analysis 1.32).
1.32.4 By medium‐term FUP (3 years) ‐ negative symptoms (SANS, high = poor)
One trial providing data, no significant difference between groups (n = 547, 1 RCT, MD ‐0.1, 95% CI ‐0.33 to 0.13; Analysis 1.32).
1.32.5 By long‐term FUP (8 years) ‐ positive symptoms (SAPS, high = poor)
One trial providing data, no significant difference between groups (n = 547, 1 RCT, MD 0.03, 95% CI ‐0.21 to 0.27; Analysis 1.32).
1.32.6 By long‐term FUP (8 years) ‐ negative symptoms (SANS, high = poor)
One trial providing data, no significant difference between groups (n = 547, 1 RCT, MD 0.06, 95% CI ‐0.13 to 0.25; Analysis 1.32).
1.33 Mental state: 2c. Specific symptoms ‐ average endpoint score (various scales, skewed data)
We found a second small study (n = 70) providing skewed data on depression symptoms assessed with the Beck Depression Inventory, and negative symptoms assessed with SANS. Neither data set was entered into the analysis. Skewed depression scores favoured the ICM group at medium and long term, whilst skewed negative symptoms scores by medium and long term were equivocal. We have reported these data in Analysis 1.33.
1.33. Analysis.
Comparison 1 Intensive Case Management versus standard care, Outcome 33 Mental state: 2c. Specific symptoms ‐ average endpoint score (various scales, skewed data).
| Mental state: 2c. Specific symptoms ‐ average endpoint score (various scales, skewed data) | ||||
|---|---|---|---|---|
| Study | Intervention | Mean | SD | Total |
| by medium term ‐ depression symptoms (BDI, high = poor) | ||||
| Holloway‐UK 1996 | 1. ICM | 11.5 | 8.9 | 23 |
| Holloway‐UK 1996 | 2. Standard care | 18.5 | 13.9 | 19 |
| by medium term ‐ negative symptoms (SANS, high = poor) | ||||
| Holloway‐UK 1996 | 1. ICM | 7.3 | 4 | 26 |
| Holloway‐UK 1996 | 2. Standard care | 6.3 | 4.4 | 22 |
| by long term ‐ depression symptoms (BDI, high = poor) | ||||
| Holloway‐UK 1996 | 1. ICM | 12.8 | 8.1 | 25 |
| Holloway‐UK 1996 | 2. Standard care | 14.8 | 11.5 | 17 |
| by long term ‐ negative symptoms (SANS, high = poor) | ||||
| Holloway‐UK 1996 | 1. ICM | 7.3 | 3.7 | 26 |
| Holloway‐UK 1996 | 2. Standard care | 7.1 | 4.1 | 20 |
1.34 Behaviour: 1. Specific behaviour ‐ self harm
We found three relevant studies for this outcome providing data per different time period. We detected no significant difference between ICM and standard care in either reducing the risk for self harm or reducing the risk for attempting suicide.
1.34.1 By medium term
There were two relevant trials in this subgroup, in which 30 events occurred in 312 people treated with ICM compared with 30 events in 308 people treated with standard care. There was no significant difference in number of participants who committed self harm between the groups (n = 620, 2 RCTs, RR 0.99, 95% CI 0.61 to 1.59; Analysis 1.34).
1.34. Analysis.
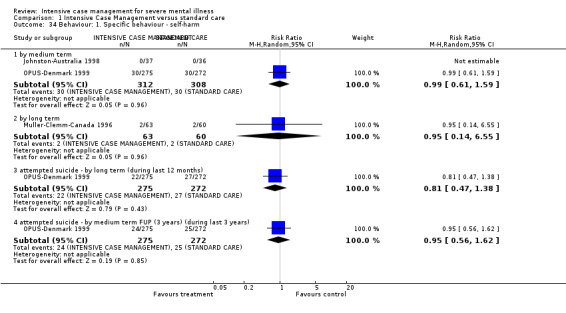
Comparison 1 Intensive Case Management versus standard care, Outcome 34 Behaviour: 1. Specific behaviour ‐ self‐harm.
1.34.2 By long term
There is a single relevant trial in this subgroup, in which 2 events occurred in 63 people treated with ICM compared with 2 events in 60 people treated with standard care. There was no significant difference in number of participants who committed self harm between the groups (n = 123, 1 RCT, RR 0.95, 95% CI 0.14 to 6.55; Analysis 1.34).
1.34.3 Attempted suicide ‐ by long term (during last 12 months)
Long term data on self harm during the previous 12 months available from a single study confirmed medium‐ and long‐term data (n = 547, 1 RCT, RR 0.81, 95% CI 0.47 to 1.38; Analysis 1.34), that is failing to show any significant difference between the two groups.
1.34.4 Attempted suicide ‐ by medium‐term FUP (during last 3 years)
The above data were again confirmed, from medium‐term follow‐up data on suicide attempts during the previous three years available from a single study. There was no significant difference between ICM and standard care (n = 547, 1 RCT, RR 0.95, 95% CI 0.56 to 1.62; Analysis 1.34).
1.35 Behaviour: 2. Social behaviour ‐ average endpoint score (Social Behaviour Scale, high = poor)
Skewed data were available from one small study (n = 70) assessing behaviour with the Social Behaviour Scale by medium and long term. These data tended to favour the ICM group.
1.36 Quality of life: 1a. Average endpoint score (various scales)
We found seven studies assessing quality of life with various scales by different time periods, and categorised data into five subgroups. Note that for this outcome the right graph label favours ICM (experimental group).
1.36.1 By short term ‐ general well‐being (Lehman's Quality of Life Interview (QOLI), high = better)
The only significant result we found was by short term: data were available from a single study and showed a significantly higher quality of life in the ICM group as assessed on the QOLI general well‐being subscale (n = 125, 1 RCT, MD 0.53, 95% CI 0.09 to 0.97; Analysis 1.36).
1.36. Analysis.
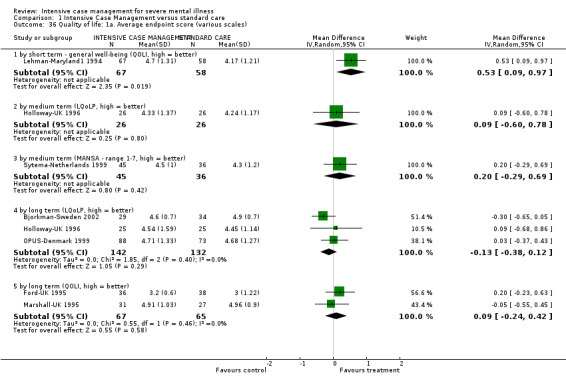
Comparison 1 Intensive Case Management versus standard care, Outcome 36 Quality of life: 1a. Average endpoint score (various scales).
1.36.2 By medium term (Lancashire Quality of Life Profile (LQoLP), high = better)
Medium‐term data assessing quality of life with LQoLP (one study) did not show a significant difference between groups (n = 52, 1 RCT, MD 0.09, 95% CI ‐0.60 to 0.78; Analysis 1.36).
1.36.3 By medium term (Manchester Short Assessment of Quality of Life (MANSA) ‐ range 1 to 7, high = better)
Medium‐term data assessing quality of life with MANSA (one study) did not show a significant difference between groups (n = 81, 1 RCT, MD 0.20, 95% CI ‐0.29 to 0.69; Analysis 1.36).
1.36.4 By long term (LQoLP, high = better)
As with the medium‐term data, long‐term data assessing quality of life with LQoLP (three studies) did not show a significant difference between groups (n = 274, 3 RCTs, MD ‐0.13, 95% CI ‐0.38 to 0.12; Analysis 1.36).
1.36.5 By long term (QOLI, high = better)
Again, as with the medium‐term data, long‐term data assessing quality of life with QOLI (two studies) did not show a significant difference between groups (n = 132, 2 RCTs, MD 0.09, 95% CI ‐0.24 to 0.42; Analysis 1.36).
1.37 Quality of life: 1b. Mean change from baseline (QOLI, high = better, skewed data) ‐ by long term
We found one further study providing data by long term for this comparison, but as data were skewed, measuring mean change from baseline on the QOLI, the study was not entered into the analysis. These data tended to favour the ICM group. We have reported these data in Analysis 1.37.
1.37. Analysis.
Comparison 1 Intensive Case Management versus standard care, Outcome 37 Quality of life: 1b. Mean change from baseline (QOLI, high = better, skewed data) ‐ by long term.
| Quality of life: 1b. Mean change from baseline (QOLI, high = better, skewed data) ‐ by long term | ||||
|---|---|---|---|---|
| Study | Intervention | Mean | SD | Total |
| Shern‐USA1 2000 | 1. ICM | 1.19 | 1.99 | 91 |
| Shern‐USA1 2000 | 2. Standard Care | ‐0.02 | 1.65 | 77 |
1.38 Participant satisfaction: 1a. Average endpoint score (Client Satisfaction Questionnaire (CSQ), high = better)
We found three relevant studies for this outcome, providing data per different time period. We found that participant satisfaction assessed with the CSQ was significantly greater in the ICM group compared with the standard care group in all three time period assessments. Note that for this outcome the right graph label favours ICM (experimental group).
1.38.1 By short term
Short‐term data were available from only one small study and showed a significant difference between groups, favouring the ICM intervention (n = 61, 1 RCT, MD 6.2, 95% CI 2.6 to 9.8; Analysis 1.38).
1.38. Analysis.
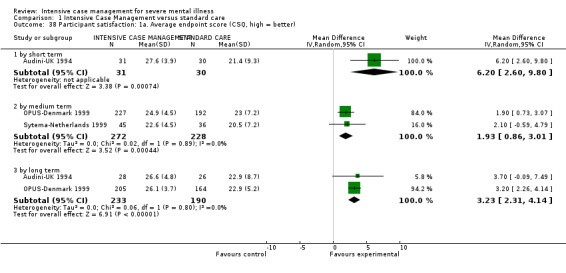
Comparison 1 Intensive Case Management versus standard care, Outcome 38 Participant satisfaction: 1a. Average endpoint score (CSQ, high = better).
1.38.2 By medium term
Medium‐term data from two studies confirmed the above results (n = 500, 2 RCTs, MD 1.93, 95% CI 0.86 to 3.01; Analysis 1.38).
1.38.3 By long term
Long‐term data also favoured the ICM group (n = 423, 2 RCTs, MD 3.23, 95% CI 2.31 to 4.14; Analysis 1.38).
1.39 Participant satisfaction: 1b. Average endpoint score (CSQ, high = better, skewed data) ‐ by short term
One further small trial provided short‐term data, but the data were skewed: attrition in the standard care arm was higher than 50%. Participant satisfaction was assessed with the CSQ, and it tended to favour the ICM group. We have reported these data in Analysis 1.39.
1.39. Analysis.
Comparison 1 Intensive Case Management versus standard care, Outcome 39 Participants satisfaction: 1b. Average endpoint score (CSQ, high = better, skewed data) ‐ by short term.
| Participants satisfaction: 1b. Average endpoint score (CSQ, high = better, skewed data) ‐ by short term | |||||
|---|---|---|---|---|---|
| Study | Intervention | Mean | SD | Total | Note |
| Muijen‐UK2 1994 | 1. ICM | 26 | 5.4 | 30 | |
| Muijen‐UK2 1994 | 2. Standard Care* | 22 | 7.5 | 13 | * Attrition >50%. |
1.40 Participant need: 1. Average endpoint score (various scales, skewed data)
We found more skewed data from two studies assessing participant need on two other scales (Camberwell Assessment of Need Interview (CAN), Camberwell Assessment of Need Short Appraisal Schedule (CANSAS)). Medium‐term data from one study assessed on CANSAS failed to show any difference between groups. Long‐term data assessed in one study with the CAN tended to favour the ICM group. We have reported these data in Analysis 1.40.
1.40. Analysis.
Comparison 1 Intensive Case Management versus standard care, Outcome 40 Participants need: 1. Average endpoint score (various scales, skewed data).
| Participants need: 1. Average endpoint score (various scales, skewed data) | |||||
|---|---|---|---|---|---|
| Study | Intervention | Mean | SD | Total | Note |
| by medium term ‐ met needs (CANSAS, high = better) | |||||
| Sytema‐Netherlands 1999 | 1. ICM | 8.5 | 4.5 | 45 | |
| Sytema‐Netherlands 1999 | 2. Standard Care | 8.6 | 4.7 | 36 | |
| by medium term ‐ unmet needs (CANSAS, high = poor) | |||||
| Sytema‐Netherlands 1999 | 1. ICM | 1.4 | 1.9 | 45 | |
| Sytema‐Netherlands 1999 | 2. Standard Care | 1.6 | 1.7 | 36 | |
| by long term (CAN, high = poor) | |||||
| Bjorkman‐Sweden 2002 | 1. ICM | 3.2 | 1.8 | 28 | |
| Bjorkman‐Sweden 2002 | 2. Standard Care | 4.6 | 3.8 | 36 | |
1.41 Costs: 1a. Direct costs of psychiatric hospital care ‐ by medium term (unit cost = USD, fiscal year 1990)
Direct medium‐term costs of psychiatric hospital care were available from two studies reporting skewed data, but with a sample size greater than 200 (Chandler‐California1 (A); Chandler‐California1 (B)). Data favoured ICM (n = 426, 2 RCTs, MD USD ‐143.74, 95% CI ‐272.40 to ‐15.08; Analysis 1.41).
1.41. Analysis.
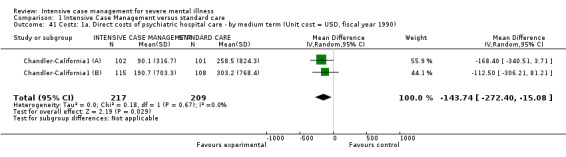
Comparison 1 Intensive Case Management versus standard care, Outcome 41 Costs: 1a. Direct costs of psychiatric hospital care ‐ by medium term (Unit cost = USD, fiscal year 1990).
1.42 Costs: 1b. Direct costs of psychiatric hospital care ‐ skewed data
Five additional studies did describe 'direct costs of psychiatric hospital care', but data were markedly skewed. Some of these data showed a trend favouring ICM, while some favoured standard care, therefore we could not highlight any trend confirming the findings from meta‐analysis. We have presented these data in Analysis 1.42.
1.42. Analysis.
Comparison 1 Intensive Case Management versus standard care, Outcome 42 Costs: 1b. Direct costs of psychiatric hospital care ‐ skewed data.
| Costs: 1b. Direct costs of psychiatric hospital care ‐ skewed data | |||||
|---|---|---|---|---|---|
| Study | Intervention | Mean | SD | Total | Note |
| by medium term | |||||
| Cusack‐North Carolina | 1. ICM* | 5,530 | 12,414 | 72 | * Unit cost US $, Inpatient costs Time period: 12 months. |
| Cusack‐North Carolina | 2. Standard care* | 8,827 | 19,289 | 62 | * Unit cost US $, Inpatient costs Time period: 12 months. |
| Lehman‐Maryland1 1994 | 1. ICM* | 2,619 | 4,440 | 77 | |
| Lehman‐Maryland1 1994 | 2. Standard care* | 4,662 | 6,034 | 75 | * Unit cost US $, fiscal year 1994.
t‐value=2.34 Time period: 12 months. |
| Morse‐Missouri3 2005 | 1. ICM* | 624 | 2,314 | 54 | |
| Morse‐Missouri3 2005 | 2. Standard care* | 439 | 1,596 | 49 | * Unit cost US $, fiscal year 2001.
"No main effect of of treatment condition for inpatient costs,F(2, 146)=0.10, p=0.9, ɧ2=0.01." Time period: 6 months. |
| by long term | |||||
| Ford‐UK 1995 | 1. ICM* | 378 | 846 | 39 | |
| Ford‐UK 1995 | 2. Standard care* | 237 | 492 | 38 | * Unit cost £, fiscal year not reported, study base year 1990.
** No statistical analysis available from the paper. Time period: 18 months. |
| Morse‐Missouri3 2005 | 1. ICM* | 855 | 2,356 | 54 | |
| Morse‐Missouri3 2005 | 2. Standard care* | 455 | 1,065 | 49 | * Unit cost US $, fiscal year 2001.
** "No main effect of treatment condition for inpatient costs,F(2, 146)=0.10, p=0.9, ɧ2=0.01." Time period: 6 months. |
| Quinlivan‐California 1995 | 1. ICM* | 301 | 397 | 30 | |
| Quinlivan‐California 1995 | 2. Standard care* | 1,636 | 2,593 | 30 | * Unit cost US $, fiscal year not reported, but study was carried on from April 1990 to March 1992.
** "Costs significantly lower for the ICM group (F=4.32, df=2.87, p=0.02.)" Time period: 24 months. |
1.43 Costs: 2a. Direct healthcare costs ‐ by long term (unit cost = USD, fiscal year 1988)
Long‐term data for direct healthcare cost were available from two studies; again studies reported skewed data, but with a sample size greater than 200, and so these data could be entered into a meta‐analysis. These data were inconclusive (n = 873, 2 RCTs, MD USD ‐529.24, 95% CI ‐2143.59 to 1085.1; Analysis 1.43), as they were highly heterogeneous (Chi2 = 17.83; df = 1.0; P = 0.0; I2 = 94%) with inconsistency in direction of effect.
1.43. Analysis.
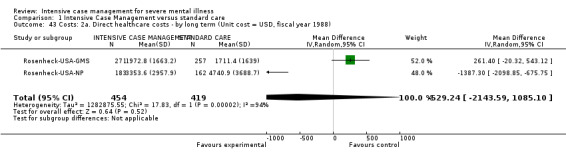
Comparison 1 Intensive Case Management versus standard care, Outcome 43 Costs: 2a. Direct healthcare costs ‐ by long term (Unit cost = USD, fiscal year 1988).
1.44 Costs: 2b. Direct healthcare costs ‐ skewed data
Other skewed data from two studies with a sample size of less than 200 could not be entered into the meta‐analysis. These studies assessed direct healthcare costs by medium term (one study) and by short‐term follow‐up (the other study). Medium‐term data did not show any significant difference between interventions, whilst short‐term FUP data seemed to favour standard care in reducing direct healthcare costs. We have reported these data in Analysis 1.44.
1.44. Analysis.
Comparison 1 Intensive Case Management versus standard care, Outcome 44 Costs: 2b. Direct healthcare costs ‐ skewed data.
| Costs: 2b. Direct healthcare costs ‐ skewed data | |||||
|---|---|---|---|---|---|
| Study | Intervention | Mean | SD | Total | Note |
| by medium term | |||||
| Lehman‐Maryland1 1994 | 1. ICM* | 4,229 | 5,058 | 77 | |
| Lehman‐Maryland1 1994 | 2. Standard care* | 5,540 | 6,368 | 75 | * Unit cost US $, fiscal year 1994.
** 'Total per‐case cost did not reach statistical significance (p = 0.07). Transformation of total costs per case to account for non‐normality (square root of total costs, t‐test=0.77, df=1,134, NS) and non‐parametric analysis (Wilcoxon test for ranks, Z=0.146, NS) also were non‐significant.' Time period 12 months. |
| by short term FUP | |||||
| Chan‐Hong Kong 2000 | 1. ICM | 14,833 | 1,539 | 31 | HK $ (HK$8=US$1, at time of study publication, 2000). Statistically significant difference (P = 0.017). |
| Chan‐Hong Kong 2000 | 2. Standard care | 11,230 | 7,979 | 31 | |
1.45 Costs: 3. Direct costs ‐ other data ‐ skewed data
Five studies described direct costs for "all care" by short, medium, and long term, and one more study described direct costs for "specific" outcome (outpatient care and prison) by medium term. As these data were skewed and from studies with a sample size of less than 200, they could not be entered into the meta‐analysis. We have presented these data in Analysis 1.45.
1.45. Analysis.
Comparison 1 Intensive Case Management versus standard care, Outcome 45 Costs: 3. Direct costs ‐ other data ‐ skewed data.
| Costs: 3. Direct costs ‐ other data ‐ skewed data | |||||
|---|---|---|---|---|---|
| Study | Intervention | Mean | SD | Total | Note |
| all care ‐ by short term | |||||
| Audini‐UK 1994 | 1.ICM* | 4,264 | 1,768 | 33 | |
| Audini‐UK 1994 | 2. Standard care* | 7,202 | 5,564 | 29 | * Unit cost £, fiscal year 1996/7.
** 'Bivariate cost comparisons (after log transformation) revealed significant advantage for ICM group (p=0.001)'. ***Time period: missing (it is not the monthly cost per patient). |
| all care ‐ by medium term | |||||
| Marshall‐UK 1995 | 1. ICM* | 1,044 | 425.3 | 31 | |
| Marshall‐UK 1995 | 2. Standard care* | 1,108 | 530.4 | 30 | * Unit cost £, fiscal year 1994.
** 'No significant differences between two groups were found.' ***Time period: mean weekly cost. |
| Morse‐Missouri3 2005 | 1. ICM* | 2,946.8 | 3,219.3 | 54 | |
| Morse‐Missouri3 2005 | 2. Standard care* | 1,899.5 | 3,629.6 | 49 | * Unit cost US $, fiscal year 2001.
** 'There was a main effect of treatment condition on total costs, F(2, 146)=4.00, p=0.02, ɧ2=0.05. Standard care condition had significantly lower costs than ICM.' ***Time period: 6 months |
| all care ‐ by long term | |||||
| Audini‐UK 1994 | 1. ICM* | 10,192 | 3,900 | 32 | |
| Audini‐UK 1994 | 2. Standard care* | 15,288 | 17,160 | 28 | * Unit cost £, fiscal year 1996/7.
** 'Bivariate cost comparisons (after log transformation) did not revealed significant advantage for ICM group (p=0.09)'. ***Time period: missing (it is not the monthly cost per patient). |
| Ford‐UK 1995 | 1. ICM* | 1,813 | 1,347 | 39 | |
| Ford‐UK 1995 | 2. Standard care* | 717 | 768 | 38 | * Unit cost £, fiscal year not reported, study base year 1990.
** 'ANOVA analysis carried on, revealing significant advantage for ICM group (p<0.05).' ***Time period: 12 months. |
| Marshall‐UK 1995 | 1. ICM* | 996 | 398 | 31 | |
| Marshall‐UK 1995 | 2. Standard care* | 1,088 | 562.4 | 30 | * Unit cost £, fiscal year 1994.
** 'No significant differences between two groups were found.' ***Time period: mean weekly cost. |
| Morse‐Missouri3 2005 | 1. ICM* | 3,190 | 3,441 | 54 | |
| Morse‐Missouri3 2005 | 2. Standard care* | 1,467 | 2,173 | 49 | * Unit cost US $, fiscal year 2001. ** 'There was a main effect of treatment condition on total costs, F(2, 146)=4.00, p=0.02, ɧ2=0.05. Standard care condition had significantly lower costs than ICM.' ***Time period: 6 months. |
| OPUS‐Denmark 1999 | 1. ICM* | 111,924 | 100,862 | 151 | |
| OPUS‐Denmark 1999 | 2. Standard Care* | 137,638 | 147,570 | 150 | *Unit cost Euro €, fiscal year 2009. **No significant difference between the groups. ***Time period: FUP 3 years. |
| specific ‐ outpatient care ‐ by medium term | |||||
| Cusack‐North Carolina | 1. ICM* | 13,481 | 9,547 | 72 | * Unit cost US $. **Time period: 12 months. |
| Cusack‐North Carolina | 2. Standard care* | 5,118 | 6,184 | 62 | * Unit cost US $. **Time period: 12 months. |
| specific ‐ prison ‐ by medium term | |||||
| Cusack‐North Carolina | 1. ICM* | 1,848 | 4,533 | 72 | * Unit cost US $. **Time period: 12 months. |
| Cusack‐North Carolina | 2. Standard care* | 3,530 | 5,690 | 62 | * Unit cost US $. **Time period: 12 months. |
Costs for all care by short term seemed to favour the ICM group, where costs were reduced (one study); by medium term one study favoured standard care (where costs were reduced), whilst the other study failed to show any difference between the two groups; and five studies provided data by long term: some of these data showed a trend favouring ICM, and some favoured standard care; these data were therefore inconclusive, and we could not highlight any trend.
Medium‐term data from one study on cost for outpatient care showed costs were higher in the ICM group compared to standard care. Data from the same study on cost for prison showed costs were higher for the standard care group compared to ICM.
2. COMPARISON 2: INTENSIVE CASE MANAGEMENT versus NON‐INTENSIVE CASE MANAGEMENT
Table 2. This comparison has 36 outcomes.
2.1 Service use: 1. Average number of days in hospital per month ‐ by about 24 months
We found 21 relevant studies for this outcome and categorised data into two subgroups (skewed data but with a sample size greater than or equal to 200, and skewed data with a sample size of less than 200). Overall, combining the two pools of studies, we found no clear difference between ICM and non‐ICM (n = 2220, 21 RCTs, MD ‐0.08, 95% CI ‐0.37 to 0.21, Figure 10). A funnel plot did not show any significant reporting bias (Figure 11).
10.
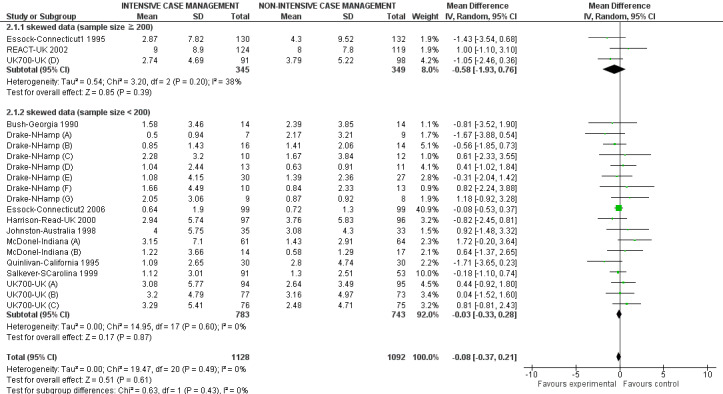
Forest plot of comparison: 2 Intensive Case Management versus non‐Intensive Case Management, outcome: 2.1 Service use: 1. Average number of days in hospital per month ‐ at about 24 months.
11.
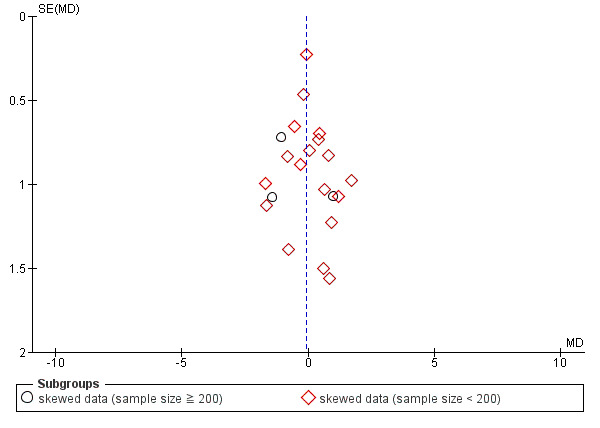
Funnel plot of comparison: 2 Intensive Case Management versus non‐Intensive Case Management, outcome: 2.1 Service use: 1. Average number of days in hospital per month ‐ by about 24 months.
2.1.1 Skewed data (sample size ≧ 200)
We found three studies reporting skewed data but with a sample size greater than or equal to 200. There was no significant difference between groups for reducing length of hospitalisation (n = 694, 3 RCTs, MD ‐0.58, 95% CI ‐1.93 to 0.76; Analysis 2.1). These findings were in accordance with the second subgroup analysis, skewed data from studies with a sample size of less than 200 participants.
2.1. Analysis.
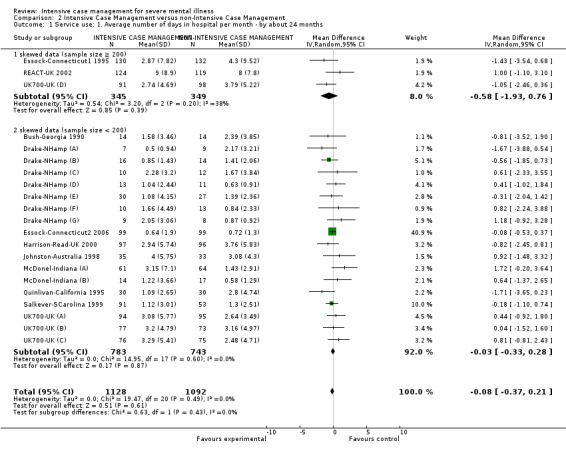
Comparison 2 Intensive Case Management versus non‐Intensive Case Management, Outcome 1 Service use: 1. Average number of days in hospital per month ‐ by about 24 months.
2.1.2 Skewed data (sample size < 200)
There were 18 relevant trials in this subgroup, with a total of 1526 people. Again, these data did not show a significant difference between groups (n = 1526, 18 RCTs, MD ‐0.03, 95% CI ‐0.33 to 0.28; Analysis 2.1).
2.2 Service use: 1a. Average number of days in hospital per month ‐ by medium/long‐term follow‐up (skewed data, sample size ≧ 200)
One study provided data by medium‐ and long‐term follow‐up, and as the sample size was greater than 200, skewed data entered the analysis.
2.2.1 By medium‐term FUP (18 months)
One study provided data on medium‐term follow‐up (18 months), confirming the results described above by 24 months. There was no clear difference between ICM and non‐ICM within this subgroup (n = 237, 1 RCTs, MD 0.6, 95% CI ‐1.25 to 2.45; Analysis 2.2).
2.2. Analysis.
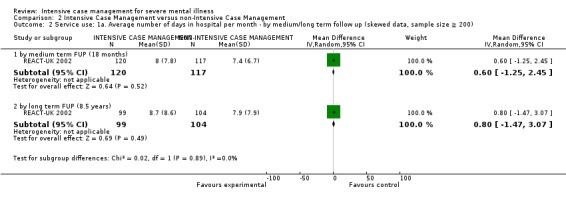
Comparison 2 Intensive Case Management versus non‐Intensive Case Management, Outcome 2 Service use: 1a. Average number of days in hospital per month ‐ by medium/long term follow up (skewed data, sample size ≧ 200).
2.2.2 By long‐term FUP (8.5 years)
The same study provided data on long‐term follow‐up (8.5 years), again showing no significant differences between interventions in reducing number of days in hospital (n = 203, 1 RCTs, MD 0.8, 95% CI ‐1.47 to 3.07; Analysis 2.2).
2.3 Service use: 2. Not remaining in contact with psychiatric services
We found four relevant studies for this outcome and categorised data into three subgroups, by different time period. Short‐term data were not available. When we pooled studies from medium and long term, data did not show significant differences between interventions, but heterogeneity was substantial (n = 1255, 4 RCTs, RR 0.63, 95% CI 0.27 to 1.49, I2 = 81%, P = 0.001). We addressed this finding by checking again for correctness of data and explored heterogeneity by dropping each study out of the analysis. Only by removing both Drake‐NHamp 1998 and UK700‐UK 1999 was homogeneity restored. As we could not ascertain any clear reason for the heterogeneity, we have therefore chosen not to pool these data, as it could be misleading to quote an average value for the intervention effect ‐ particularly in this case, when there is inconsistency in direction of effect. We did not use a funnel plot for this outcome because there were fewer than 10 studies (see Assessment of reporting biases).
2.3.1 By medium term
One small study provided medium‐term data showing a significant difference favouring the ICM group (n = 73, 1 RCT, RR 0.27, 95% CI 0.08 to 0.87; Analysis 2.3).
2.3. Analysis.
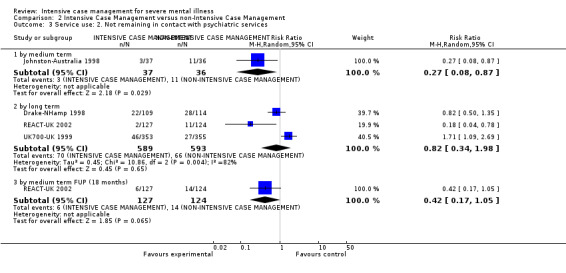
Comparison 2 Intensive Case Management versus non‐Intensive Case Management, Outcome 3 Service use: 2. Not remaining in contact with psychiatric services.
2.3.2 By long term
Long‐term data were available from three studies. Pooled data were not statistically significant (n = 1182, 3 RCTs, RR 0.82, 95% CI 0.34 to 1.98), but data were heterogeneous (Chi2 = 10.86; df = 2.0; P = 0.0; I2 = 81%) with inconsistency in direction of effect (Analysis 2.3).
2.3.3 By medium‐term FUP (18 months)
One single trial provided data for this outcome, and we found no evidence of a clear difference between the two treatments (n = 251, 1 RCT, RR 0.42, 95% CI 0.17 to 1.05; Analysis 2.3).
2.4 Service use: 3a. Admitted to hospital ‐ by long term
Binary data describing this outcome were available from three long‐term studies, reporting 'number of admitted to hospital'. These data showed a non‐significant difference in number of participants admitted to hospital between groups (n = 1132, 3 RCTs, RR 0.91, 95% CI 0.75 to 1.12; Analysis 2.4). Heterogeneity was high for this outcome (Chi2 = 5.26; df = 2.0; P = 0.07; I2 = 62%).
2.4. Analysis.
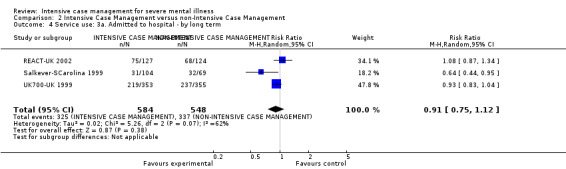
Comparison 2 Intensive Case Management versus non‐Intensive Case Management, Outcome 4 Service use: 3a. Admitted to hospital ‐ by long term.
2.5 Service use: 3b. Average number of admissions (skewed data ‐ sample size ≧ 200)
We identified two studies relevant to this outcome, one providing data by long term, the other by medium‐ and long‐term follow‐up. Data were skewed, but as the trial sample size were greater than or equal to 200, we entered these data in the analysis. Data from different time periods failed to show any significant differences between ICM and non‐ICM in average number of admissions.
2.5.1 By long term (24 months)
Data from one long‐term study failed to show any significant differences between groups (n = 678, 1 RCT, MD ‐0.18, 95% CI ‐0.41 to 0.05; Analysis 2.5).
2.5. Analysis.
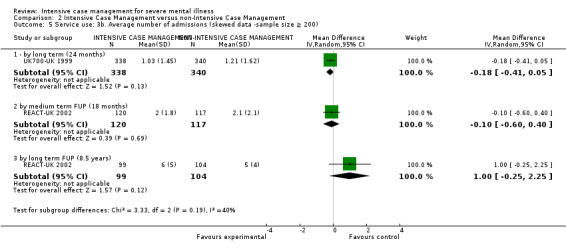
Comparison 2 Intensive Case Management versus non‐Intensive Case Management, Outcome 5 Service use: 3b. Average number of admissions (skewed data ‐sample size ≧ 200).
2.5.2 By medium term FUP (18 months)
One single study provided data by medium‐term follow‐up (18 months). Data failed to show any significant differences between groups (n = 237, 1 RCT, MD ‐0.1, 95% CI ‐0.6 to 0.4; Analysis 2.5).
2.5.3 By long‐term FUP (8.5 years)
One single study provided data by medium‐term follow‐up (8.5 years). Data failed to show any significant differences between groups (n = 203, 1 RCT, MD 1.0, 95% CI ‐0.25 to 2.25; Analysis 2.5).
2.6 Service use: 3c. Average number of admissions (skewed data) ‐ by medium term
A trial that included fewer than 200 participants presented skewed data that could not be entered into the meta‐analysis. Data were reported for the outcome 'average number of admissions' by medium term. As with previous findings, they failed to show any trend in effect between groups.
2.7 Adverse event: 1a. Death ‐ any cause
We found seven relevant studies for this outcome and categorised data into five subgroups, by different time period.
2.7.1 By short term
Short‐term data on mortality were available from one study (n = 193) reporting no deaths, therefore a measure of effect was not estimable (Analysis 2.7).
2.7. Analysis.
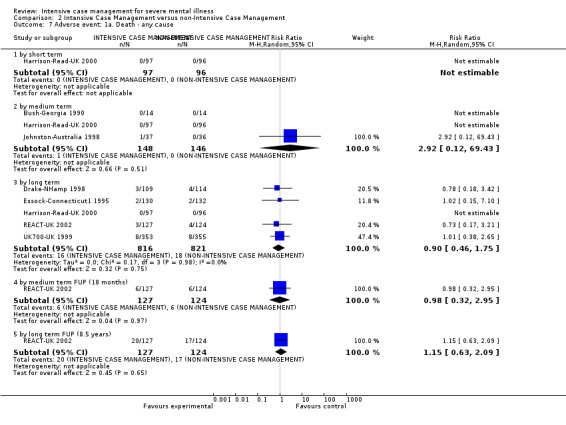
Comparison 2 Intensive Case Management versus non‐Intensive Case Management, Outcome 7 Adverse event: 1a. Death ‐ any cause.
2.7.2 By medium term
Medium‐term data were available from three studies, where 1 death occurred in 148 people treated with ICM, compared with no deaths in 146 people treated with non‐ICM. There were no significant differences in mortality between groups (n = 294, 3 RCTs, RR 2.92, 95% CI 0.12 to 69.43; Analysis 2.7).
2.7.3 By long term
We found long‐term data in five studies, reporting 16 deaths occurring in 816 people treated with ICM, compared with 18 deaths in 821 people treated with non‐ICM. These data confirmed medium‐term findings showing no differences in mortality between groups (n = 1637, 5 RCTs, RR 0.90, 95% CI 0.46 to 1.75; Analysis 2.7).
2.7.4 By medium‐term FUP (18 months)
Medium‐term follow‐up data were available from one study, where 6 deaths occurred in 127 people treated with ICM, compared with 6 deaths in 124 people treated with non‐ICM. These data confirmed the above results, showing no differences in mortality between groups (n = 251, 1 RCT, RR 0.98, 95% CI 0.32 to 2.95; Analysis 2.7).
2.7.5 By long‐term FUP (8.5 years)
Long‐term follow‐up data were available from one study, where 20 deaths occurred in 127 people treated with ICM, compared with 17 deaths in 124 people treated with non‐ICM. These data confirmed the above results, showing no differences in mortality between groups (n = 251, 1 RCT, RR 1.15, 95% CI 0.63 to 2.09; Analysis 2.7).
2.8 Adverse event: 1b. Death ‐ suicide
We found eight relevant studies for this outcome and categorised data into four subgroups, by different time period.
2.8.1 By short term
Short‐term data on suicide mortality were available from one study (n = 193), again reporting no deaths, and therefore a measure of effect was not estimable.
2.8.2 By medium term
Medium‐term data were available from six studies, where 5 suicides occurred in 464 people treated with ICM, compared with 3 suicides in 465 people treated with non‐ICM. There were no significant differences in the suicide rate between groups (n = 929, 6 RCTs, RR 1.61, 95% CI 0.26 to 9.85; Analysis 2.8).
2.8. Analysis.
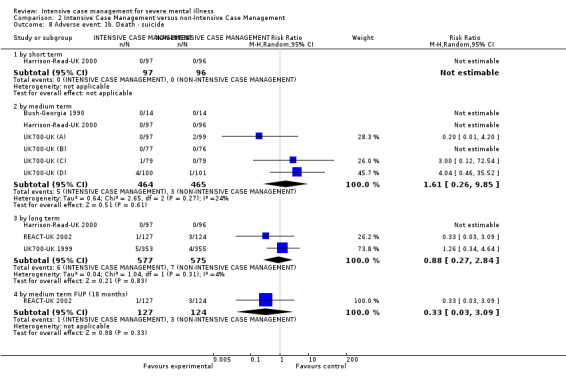
Comparison 2 Intensive Case Management versus non‐Intensive Case Management, Outcome 8 Adverse event: 1b. Death ‐ suicide.
2.8.3 By long term
Long‐term data were available from three studies, reporting 6 suicides occurring in 577 people treated with ICM, compared with 7 suicides in 575 people treated with non‐ICM. These data confirmed medium‐term data on overall mortality and on suicide, with no significant differences in the suicide rate between groups (n = 1152, 3 RCTs, RR 0.88, 95% CI 0.27 to 2.84; Analysis 2.8).
2.8.4 By medium‐term FUP (18 months)
Medium‐term follow‐up data on suicide mortality were available from one study, reporting 1 suicide occurring in 127 people treated with ICM, compared with 3 suicides in 124 people treated with non‐ICM. These data confirmed also in the follow‐up period, medium‐ and long‐term data on overall mortality and on suicide, with no significant differences in the suicide rate between groups (n = 251, 1 RCT, RR 0.33, 95% CI 0.03 to 3.09; Analysis 2.8).
2.9 Global state: 1. Leaving the study early
We found nine studies providing medium‐ and long‐term data, but not short‐term data. When pooling data from sub‐groups for two time periods, we found data still significant, showing an advantage for ICM in reducing the number of participants lost to follow‐up (n = 2195, 9 RCTs, RR 0.72, 95% CI 0.52 to 0.99). Although heterogeneity was reduced in comparison to the medium‐term subgroup data, heterogeneity was still substantial (Chi2 = 19.58; df = 8.0; P = 0.01; I2 = 59%) (Analysis 2.9).
2.9. Analysis.
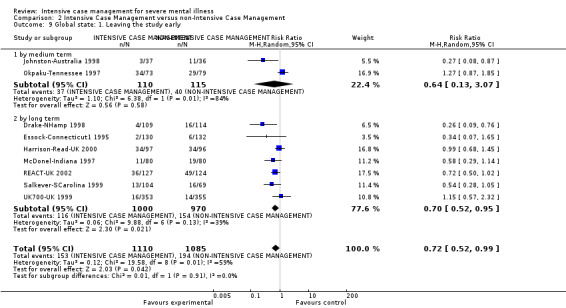
Comparison 2 Intensive Case Management versus non‐Intensive Case Management, Outcome 9 Global state: 1. Leaving the study early.
2.9.1 By medium term
Medium‐term data from two trials showed no treatment effect in reducing number of participants lost to follow‐up (n = 225, 2 RCTs, RR 0.64, 95% CI 0.13 to 3.07), but these data presented a substantial level of heterogeneity (Chi2 = 6.38; df = 1.0; P = 0.01; I2 = 84%). In addition, there was inconsistency in the direction of effect between the two studies (Analysis 2.9).
2.9.2 By long term
Long‐term data were available from seven studies, and we found a significant advantage for ICM in reducing the number of participants lost to follow‐up (n = 1970, 7 RCTs, RR 0.70, 95% CI 0.52 to 0.95). Different from the medium‐term data, long‐term subgroup analyses did not show substantial heterogeneity (Chi2 = 9.88; df = 6.0; P = 0.13; I2 = 39%) (Analysis 2.9).
2.10 Global state: 2a. Average endpoint score (Health of the Nation Outcome Scale (HoNOS), high = poor) ‐ by long term
One study reported long‐term data on global state assessed with HoNOS. These data were skewed, but as the study sample size was greater than or equal to 200 participants they entered the analysis. Data failed to show a significant difference between interventions (n = 239, 1 RCT, MD ‐0.40, 95% CI ‐1.77 to 0.97; Analysis 2.10).
2.10. Analysis.
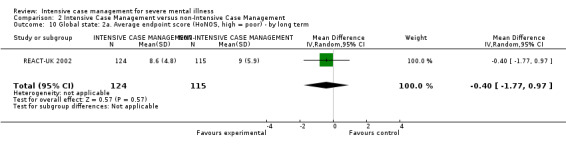
Comparison 2 Intensive Case Management versus non‐Intensive Case Management, Outcome 10 Global state: 2a. Average endpoint score (HoNOS, high = poor) ‐ by long term.
2.11 Global state: 2b. Average endpoint score (HoNOS, high = poor) ‐ skewed data
We found skewed data describing global state with HoNOS by medium and long term from one trial. These data tended to favour the standard care group (Analysis 2.11).
2.11. Analysis.
Comparison 2 Intensive Case Management versus non‐Intensive Case Management, Outcome 11 Global state: 2b. Average endpoint score (HoNOS, high = poor) ‐ skewed data.
| Global state: 2b. Average endpoint score (HoNOS, high = poor) ‐ skewed data | ||||
|---|---|---|---|---|
| Study | Intervention | Mean | SD | Total |
| medium term | ||||
| Harrison‐Read‐UK 2000 | 1. ICM | 12 | 6.8 | 54 |
| Harrison‐Read‐UK 2000 | 2. non‐ICM | 11.4 | 6.4 | 64 |
| long term | ||||
| Harrison‐Read‐UK 2000 | 1. ICM | 11.9 | 5.9 | 60 |
| Harrison‐Read‐UK 2000 | 2. non‐ICM | 10.4 | 6.4 | 59 |
2.12 Global state: 3a. Not compliant with medication ‐ by medium term
One study reported medium‐term data for the binary outcome 'number of participants not compliant with medication'. There was no significant difference between groups (n = 73, 1 RCT, RR 1.14, 95% CI 0.42 to 3.05; Analysis 2.12).
2.12. Analysis.
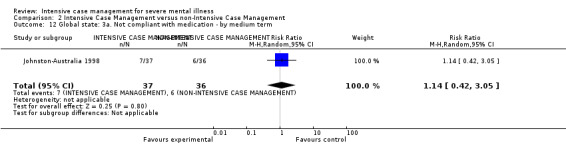
Comparison 2 Intensive Case Management versus non‐Intensive Case Management, Outcome 12 Global state: 3a. Not compliant with medication ‐ by medium term.
2.13 Global state: 3b. Compliance with medication ‐ average endpoint subscale score (Rating of Medication Influences (ROMI)) ‐ by long term
Long‐term compliance scores assessed with the ROMI compliance and non‐compliance subscales were not significantly different (compliance subscale: n = 239, 1 RCT, MD 0.60, 95% CI ‐0.05 to 1.25; non‐compliance subscale: n = 239, 1 RCT, MD ‐0.60, 95% CI ‐1.63 to 0.43), although both subscale scores tended to favour ICM. Note that for the compliance subscale (high = good), the right side of the graph favours experimental (ICM).
2.13.1 Compliance subscale (high = good)
There was a single trial in this subgroup, with a total of 239 people. There was no clear difference between ICM and non‐ICM within this subgroup (MD 0.6, 95% CI ‐0.05 to 1.25; Analysis 2.13).
2.13. Analysis.
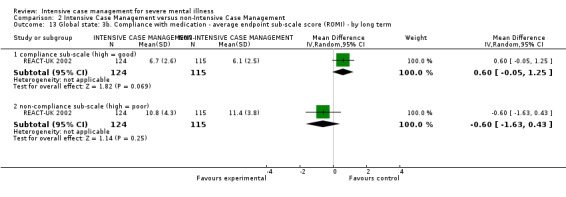
Comparison 2 Intensive Case Management versus non‐Intensive Case Management, Outcome 13 Global state: 3b. Compliance with medication ‐ average endpoint sub‐scale score (ROMI) ‐ by long term.
2.13.2 Non‐compliance subscale (high = poor)
There was a single trial in this subgroup, with a total of 239 people. There was no clear difference between ICM and non‐ICM within this subgroup (MD ‐0.6, 95% CI ‐1.63 to 0.43). This subgroup had important levels of heterogeneity (Chi2 = 0.0; df = 0.0; P = 0.0; I2 = 100%) (Analysis 2.13).
2.14 Global state: 3c. Compliance with medication ‐ average endpoint subscale score (ROMI, score 1 to 3, skewed data)
Medium‐ and long‐term skewed data were available from one study assessing compliance scores with the ROMI compliance and non‐compliance subscales. These data tended to favour standard care, where participants had a higher level of compliance (Analysis 2.14).
2.14. Analysis.
Comparison 2 Intensive Case Management versus non‐Intensive Case Management, Outcome 14 Global state: 3c. Compliance with medication ‐ average endpoint sub‐scale score (ROMI, score 1‐3, skewed data).
| Global state: 3c. Compliance with medication ‐ average endpoint sub‐scale score (ROMI, score 1‐3, skewed data) | ||||
|---|---|---|---|---|
| Study | Intervention | Mean | SD | Total |
| medium term ‐ compliance sub‐scale (high = good) | ||||
| Harrison‐Read‐UK 2000 | 1. ICM | 1.8 | 0.4 | 49 |
| Harrison‐Read‐UK 2000 | 2. non‐ICM | 2.0 | 0.5 | 61 |
| medium term ‐ non‐compliance sub‐scale (high = poor) | ||||
| Harrison‐Read‐UK 2000 | 1. ICM | 1.3 | 0.3 | 49 |
| Harrison‐Read‐UK 2000 | 2. non‐ICM | 1.2 | 0.3 | 61 |
| long term ‐ compliance sub‐scale (high = good) | ||||
| Harrison‐Read‐UK 2000 | 1. ICM | 1.8 | 0.4 | 62 |
| Harrison‐Read‐UK 2000 | 2. non‐ICM | 1.9 | 0.5 | 60 |
| long term ‐ non‐compliance sub‐scale (high = poor) | ||||
| Harrison‐Read‐UK 2000 | 1. ICM | 1.2 | 0.3 | 63 |
| Harrison‐Read‐UK 2000 | 2. non‐ICM | 1.2 | 0.3 | 61 |
2.15 Social functioning: 1. Contact with legal system (various measurements)
We identified three studies relevant to this outcome, providing data on different time periods and different measures.
2.15.1 By medium term ‐ contact with the police
Medium‐term data were available from one study reporting 'contact with the police'. We found no significant difference between groups (n = 73, 1 RCT, RR 0.32, 95% CI 0.04 to 2.97; Analysis 2.15).
2.15. Analysis.
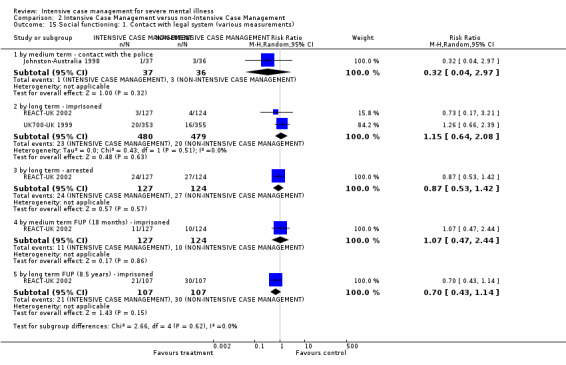
Comparison 2 Intensive Case Management versus non‐Intensive Case Management, Outcome 15 Social functioning: 1. Contact with legal system (various measurements).
2.15.2 By long term ‐ imprisoned
Long‐term data were available on both binary outcomes of 'imprisoned' and 'arrested'. We found two studies reporting the outcome 'imprisoned', and data failed to show any difference in the number of people imprisoned (n = 959, 2 RCTs, RR 1.15, 95% CI 0.64 to 2.08; Analysis 2.15).
2.15.3 By long term ‐ arrested
Only one study provided data on the outcome 'arrested'. Again, there was no clear difference between groups (n = 251, 1 RCT, RR 0.87, 95% CI 0.53 to 1.42; Analysis 2.15).
2.15.4 By medium‐term FUP (18 months) ‐ imprisoned
We found one trial relevant to this subgroup, with a total of 251 participants. There was no clear difference between ICM and non‐ICM within this subgroup (n = 251, 1 RCT, RR 1.07, 95% CI 0.47 to 2.44; Analysis 2.15).
2.15.5 By long‐term FUP (8.5 years) ‐ imprisoned
There was a single trial in this subgroup. There was no clear difference between ICM and non‐ICM within this subgroup (n = 214, 1 RCT, RR 0.70, 95% CI 0.43 to 1.14; Analysis 2.15).
2.16 Social functioning 2. Employment status (various measurements)
We identified two studies relevant to this outcome: one medium‐term study, reporting 'participant who spent more than one day employed' and 'participants on paid employment', and one long‐term follow‐up study, reporting 'unemployed'. Both medium‐term outcomes showed no significant difference between groups. The long‐term follow‐up outcome confirmed medium‐term data, showing no significant difference between ICM and non‐ICM in employment status.
2.16.1 Spent > 1 day employed ‐ by medium term
There was no significant difference between ICM and non‐ICM in increasing number of days of employment (n = 73, 1 RCT, RR 1.46, 95% CI 0.45 to 4.74; Analysis 2.16).
2.16. Analysis.
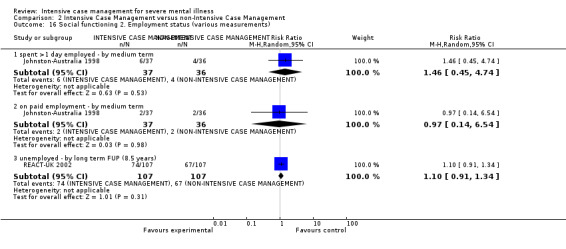
Comparison 2 Intensive Case Management versus non‐Intensive Case Management, Outcome 16 Social functioning 2. Employment status (various measurements).
2.16.2 On paid employment ‐ by medium term
There was no significant difference between ICM and non‐ICM in increasing the chance of being on paid employment by medium term (n = 73, 1 RCT, RR 0.97, 95% CI 0.14 to 6.54; Analysis 2.16).
2.16.3 Unemployed ‐ by long‐term FUP (8.5 years)
There was no significant difference between ICM and non‐ICM in decreasing the risk of unemployment (n = 214, 1 RCT, RR 1.10, 95% CI 0.91 to 1.34; Analysis 2.16).
2.17 Social functioning: 3a. Accommodation status (various measurements)
We found two relevant studies for this outcome, one providing data only for the outcome 'living in supported accomodation' by medium term. The second study provided data for all of the other outcomes, using different measures to assess accomodation status. The data failed to show significant differences between groups at any time period.
2.17.1 By medium term ‐ living in supported accommodation
The outcome 'living in supported accommodation' was only available for the medium term from one study. Data failed to show a significant difference between groups (n = 73, 1 RCT, RR 2.59, 95% CI 0.75 to 9.01; Analysis 2.17).
2.17. Analysis.
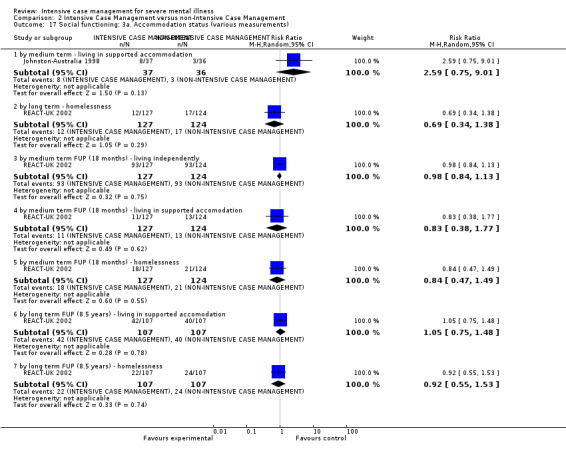
Comparison 2 Intensive Case Management versus non‐Intensive Case Management, Outcome 17 Social functioning: 3a. Accommodation status (various measurements).
2.17.2 By long term ‐ homelessness
The outcome 'homelessness' was available for the long term from one study. There were no significant differences between treatment groups in the number of people who were homeless (n = 251, 1 RCT, RR 0.69, 95% CI 0.34 to 1.38; Analysis 2.17).
2.17.3 By medium‐term FUP (18 months) ‐ living independently
One study provided data and failed to show a significant difference between groups (n = 251, 1 RCT, RR 0.98, 95% CI 0.84 to 1.13; Analysis 2.17).
2.17.4 By medium‐term FUP (18 months) ‐ living in supported accomodation
One study provided data and failed to show a significant difference between groups (n = 251, 1 RCT, RR 0.83, 95% CI 0.38 to 1.77). This subgroup had important levels of heterogeneity (Chi2 = 0.0; df = 0.0; P = 0.0; I2 = 100%; Analysis 2.17).
2.17.5 By medium‐term FUP (18 months) ‐ homelessness
One study provided data and failed to show a significant difference between groups (n = 251, 1 RCT, RR 0.84, 95% CI 0.47 to 1.49). Heterogeneity was high for this outcome (Chi2 = 0.0; df = 0.0; P = 0.0; I2 = 100%; Analysis 2.17).
2.17.6 By long‐term FUP (8.5 years) ‐ living in supported accomodation
One study provided data and failed to show a significant difference between groups (n = 214, 1 RCT, RR 1.05, 95% CI 0.75 to 1.48; Analysis 2.17).
2.17.7 By long‐term FUP (8.5 years) ‐ homelessness
One study provided data and failed to show a significant difference between groups (n = 214, 1 RCT, RR 0.92, 95% CI 0.55 to 1.53; Analysis 2.17).
2.18 Social functioning: 3b. Accommodation status ‐ average days per month in stable accommodation
The continuous outcome 'average days per month in stable accommodation' was available for short, medium, and long term (2 RCTs). Data did not show significant differences between groups at any time period.
2.18.1 By short term
One trial was relevant to this subgroup. We did not find evidence of a clear difference between the two treatments (n = 203, 1 RCT, MD ‐0.2, 95% CI ‐2.48 to 2.08; Analysis 2.18).
2.18. Analysis.
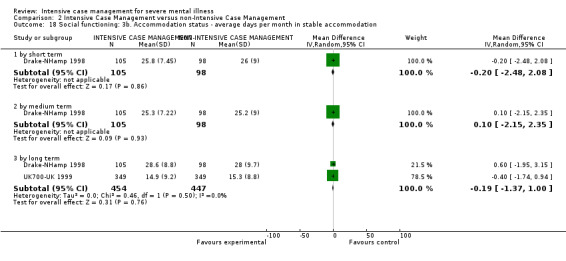
Comparison 2 Intensive Case Management versus non‐Intensive Case Management, Outcome 18 Social functioning: 3b. Accommodation status ‐ average days per month in stable accommodation.
2.18.2 By medium term
One trial was relevant to this subgroup. We did not find evidence of a clear difference between the two treatments (n = 203, 1 RCT, MD 0.1, 95% CI ‐2.15 to 2.35). This subgroup had important levels of heterogeneity (Chi2 = 0.0; df = 0.0; P = 0.0; I2 = 100%; Analysis 2.18).
2.18.3 By long term
We found two trials relevant to this subgroup (total n = 901). We did not find evidence of a clear difference between ICM and non‐ICM within this subgroup (n = 901, 2 RCTs, MD ‐0.19, 95% CI ‐1.37 to 1.0; Analysis 2.18).
2.19 Social functioning: 4a. Substance abuse ‐ by long term
We found two relevant studies for this outcome. Long‐term binary data on 'substance abuse' differentiated between 'alcohol abuse' and 'illicit drug abuse'. Data did not show significant differences between groups with any measures.
2.19.1 Alcohol abuse
There was no difference between ICM and non‐ICM in the number of people abusing alcohol (n = 251, 1 RCT, RR 1.10, 95% CI 0.67 to 1.83; Analysis 2.19).
2.19. Analysis.
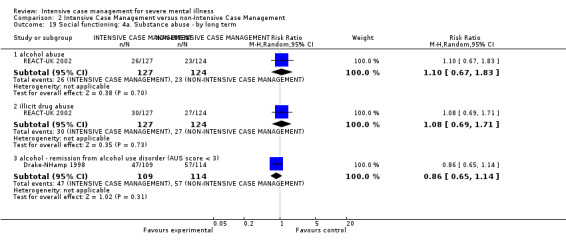
Comparison 2 Intensive Case Management versus non‐Intensive Case Management, Outcome 19 Social functioning: 4a. Substance abuse ‐ by long term.
2.19.2 Illicit drug abuse
There was no difference between ICM and non‐ICM in the number of people abusing illicit drugs (n = 251, 1 RCT, RR 1.08, 95% CI 0.69 to 1.71; Analysis 2.19).
2.19.3 Alcohol ‐ remission from alcohol use disorder (Alcohol Use Scale (AUS) score < 3)
Binary data on 'remission from alcohol use disorder' (defined AUS score < 3) also did not show any significant difference between groups by long term (n = 223, 1 RCT, RR 0.86, 95% CI 0.65 to 1.14; Analysis 2.19).
2.20 Social functioning: 4b. Substance abuse ‐ average endpoint score (Substance Abuse Treatment Scale (SATS), low = poor)
Short‐, medium‐, and long‐term continuous data were available from one study, assessing substance abuse with the SATS. These data failed to show a significant difference between groups at any time period assessment.
2.20.1 By short term
We did not find evidence of a clear difference between ICM and non‐ICM within this subgroup (n = 203, 1 RCT, MD 0.07, 95% CI ‐0.28 to 0.42; Analysis 2.20).
2.20. Analysis.
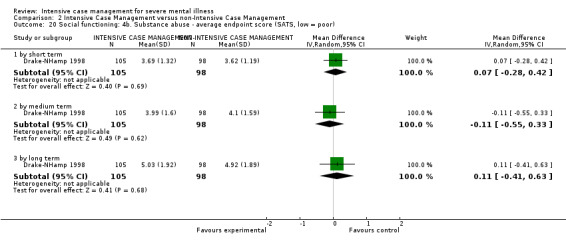
Comparison 2 Intensive Case Management versus non‐Intensive Case Management, Outcome 20 Social functioning: 4b. Substance abuse ‐ average endpoint score (SATS, low = poor).
2.20.2 By medium term
We did not find evidence of a clear difference between ICM and non‐ICM within this subgroup (n = 203, 1 RCT, MD ‐0.11, 95% CI ‐0.55 to 0.33; Analysis 2.20).
2.20.3 By long term
We did not find evidence of a clear difference between ICM and non‐ICM within this subgroup (n = 203, 1 RCT, MD 0.11, 95% CI ‐0.41 to 0.63). This subgroup had important levels of heterogeneity (Chi2 = 0.0; df = 0.0; P = 0.0; I2 = 100%; Analysis 2.20).
2.21 Social functioning: 4c. Alcohol ‐ abuse (various measurements, skewed data)
Skewed data were available from one study assessing 'days using alcohol' and 'AUS score' by short, medium, and long term. Data on 'days using alcohol' showed a trend towards a higher alcohol consumption in the ICM group in each assessed time period. This trend was confirmed by the short‐ and medium‐term findings on the AUS, where the ICM group rating had a worse outcome than the non‐ICM group; however, long‐term data showed a worse outcome in the non‐ICM group (Analysis 2.21).
2.21. Analysis.
Comparison 2 Intensive Case Management versus non‐Intensive Case Management, Outcome 21 Social functioning: 4c. Alcohol ‐ abuse (various measurements, skewed data).
| Social functioning: 4c. Alcohol ‐ abuse (various measurements, skewed data) | ||||
|---|---|---|---|---|
| Study | Intervention | Mean | SD | Total |
| short term ‐ days using alcohol during previous 6 months (TLFB) | ||||
| Drake‐NHamp 1998 | 1. ICM | 56.8 | 56.4 | 75 |
| Drake‐NHamp 1998 | 2. non‐ICM | 47.5 | 58.4 | 68 |
| short term ‐ average endpoint score (AUS, high = poor) | ||||
| Drake‐NHamp 1998 | 1. ICM | 3.09 | 1.02 | 83 |
| Drake‐NHamp 1998 | 2. non‐ICM | 2.91 | 1.08 | 73 |
| medium term ‐ days using alcohol during previous 6 months (TLFB) | ||||
| Drake‐NHamp 1998 | 1. ICM | 59.1 | 53.3 | 75 |
| Drake‐NHamp 1998 | 2. non‐ICM | 42.8 | 52.9 | 68 |
| medium term ‐ average endpoint score (AUS, high = poor) | ||||
| Drake‐NHamp 1998 | 1. ICM | 3.11 | 1.05 | 83 |
| Drake‐NHamp 1998 | 2. non‐ICM | 2.8 | 1.13 | 73 |
| long term ‐ days using alcohol during previous 6 months (TLFB) | ||||
| Drake‐NHamp 1998 | 1. ICM | 46.4 | 53.6 | 75 |
| Drake‐NHamp 1998 | 2. non‐ICM | 43.6 | 57.3 | 68 |
| long term ‐ average endpoint score (AUS, high = poor) | ||||
| Drake‐NHamp 1998 | 1. ICM | 2.64 | 1.12 | 83 |
| Drake‐NHamp 1998 | 2. non‐ICM | 2.77 | 1.18 | 73 |
2.22 Social functioning: 5a. Average endpoint score (Life Skill Profile (LSP), high = poor) ‐ by long term
We found the LSP social functioning score did not favour one group over the other by long term (n = 239, 1 RCT, MD 4.0, 95% CI ‐0.61 to 8.61).
2.23 Social functioning: 5b. Average endpoint score (Social Functioning Questionnaire (SFQ), high = poor) ‐ skewed data
Skewed data on SFQ social functioning scores showed equivocal results by medium term, and a worse outcome in the ICM group by long term. We entered these data as 'other' data (Analysis 2.23).
2.23. Analysis.
Comparison 2 Intensive Case Management versus non‐Intensive Case Management, Outcome 23 Social functioning: 5b. Average endpoint score (SFQ, high = poor) ‐ skewed data.
| Social functioning: 5b. Average endpoint score (SFQ, high = poor) ‐ skewed data | ||||
|---|---|---|---|---|
| Study | Intervention | Mean | SD | Tot |
| by medium term | ||||
| Harrison‐Read‐UK 2000 | 1. ICM | 7.3 | 5.3 | 49 |
| Harrison‐Read‐UK 2000 | 2. non‐ICM | 7.5 | 5.1 | 62 |
| by long term | ||||
| Harrison‐Read‐UK 2000 | 1. ICM | 8.9 | 4.9 | 57 |
| Harrison‐Read‐UK 2000 | 2. non‐ICM | 7.9 | 4.9 | 58 |
2.24 Mental state: 1a. General symptoms ‐ average endpoint score (various scales)
We identified two studies relevant to this outcome, assessing 'mental state: general symptoms' on two different scales (BPRS‐24 items and CPRS) at different time periods. We found BPRS mental state scores favoured neither group during the short‐, medium‐, and long‐term analysis. These data were confirmed by long‐term findings on the CPRS, where there was no significant difference between ICM and non‐ICM.
2.24.1 By short term (BPRS‐24 items, high = poor)
The single trial in this subgroup showed no difference between the two treatments (n = 203, 1 RCT, MD ‐0.65, 95% CI ‐3.99 to 2.69; Analysis 2.24).
2.24. Analysis.
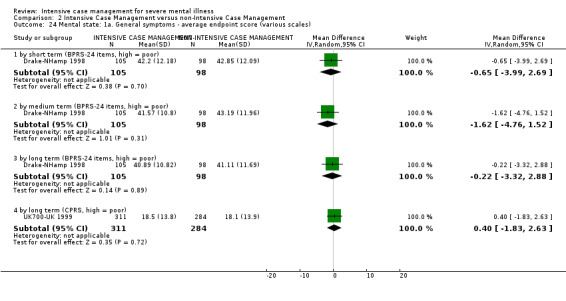
Comparison 2 Intensive Case Management versus non‐Intensive Case Management, Outcome 24 Mental state: 1a. General symptoms ‐ average endpoint score (various scales).
2.24.2 By medium term (BPRS‐24 items, high = poor)
The single trial in this subgroup showed no difference between the two treatments (n = 203, 1 RCT, MD ‐1.62, 95% CI ‐4.76 to 1.52; Analysis 2.24).
2.24.3 By long term (BPRS‐24 items, high = poor)
The single trial in this subgroup showed no difference between the two treatments (n = 203, 1 RCT, MD ‐0.22, 95% CI ‐3.32 to 2.88; Analysis 2.24).
2.24.4 By long term (CPRS, high = poor)
The single trial in this subgroup showed no difference between the two treatments (n = 595, 1 RCT, MD 0.40, 95% CI ‐1.83 to 2.63; Analysis 2.24).
2.25 Mental state: 1b. General symptoms ‐ average endpoint scores (various scales, skewed data)
Medium‐ and long‐term skewed data from the Krawiecka Scale and long‐term skewed data from the BPRS scale could not be entered into meta‐analysis. These data, provided from two different trials, consistently suggested a better mental state outcome in the non‐ICM group.
2.26 Mental state: 2a. Specific symptoms: negative symptoms ‐ average endpoint score (SANS, high = poor) ‐ by long term
Long‐term continuous data on negative symptoms from one long‐term trial did not favour either group (n = 593, 1 RCT, MD 0.20, 95% CI ‐2.32 to 2.72).
2.27 Mental state: 2b. Specific symptoms ‐ average endpoint scores (various scales, skewed data)
Skewed data were available on anxiety and depression symptoms assessed with the Hospital Anxiety and Depression Scale (HADS) anxiety and depression subscale by medium and long term. These data, provided by the same study, were not consistent between medium and long term, as they showed a better outcome in the ICM group by medium term and a worse outcome in the ICM group by long term, compared with the non‐ICM group (Analysis 2.27).
2.27. Analysis.
Comparison 2 Intensive Case Management versus non‐Intensive Case Management, Outcome 27 Mental state: 2b. Specific symptoms ‐ average endpoint scores (various scales, skewed data).
| Mental state: 2b. Specific symptoms ‐ average endpoint scores (various scales, skewed data) | ||||
|---|---|---|---|---|
| Study | Intervention | Mean | SD | Total |
| medium term ‐ anxiety (HADS, high = poor) | ||||
| Harrison‐Read‐UK 2000 | 1. ICM | 6.5 | 4.9 | 52 |
| Harrison‐Read‐UK 2000 | 2. non‐ICM | 6.7 | 4.6 | 61 |
| medium term ‐ depression (HADS, high = poor) | ||||
| Harrison‐Read‐UK 2000 | 1. ICM | 6.4 | 5.4 | 52 |
| Harrison‐Read‐UK 2000 | 2. non‐ICM | 6.6 | 4.9 | 61 |
| long term ‐ anxiety (HADS, high = poor) | ||||
| Harrison‐Read‐UK 2000 | 1. ICM | 7.5 | 5.3 | 56 |
| Harrison‐Read‐UK 2000 | 2. non‐ICM | 6.4 | 4.6 | 58 |
| long term ‐ depression (HADS, high = poor) | ||||
| Harrison‐Read‐UK 2000 | 1. ICM | 7.3 | 5.4 | 56 |
| Harrison‐Read‐UK 2000 | 2. non‐ICM | 6.8 | 5.6 | 58 |
2.28 Behaviour: 1. Specific behaviour (various measurements)
We found three relevant studies for this outcome, assessing the outcome at different time periods and using different measures. Data failed to show a significant difference between groups at any time period for any outcomes.
2.28.1 By medium term ‐ harm to self or others
Medium‐term data reporting 'harm to self or others' did not show a significant difference between groups (n = 73, 1 RCT, RR 0.88, 95% CI 0.4 to 1.9; Analysis 2.28).
2.28. Analysis.
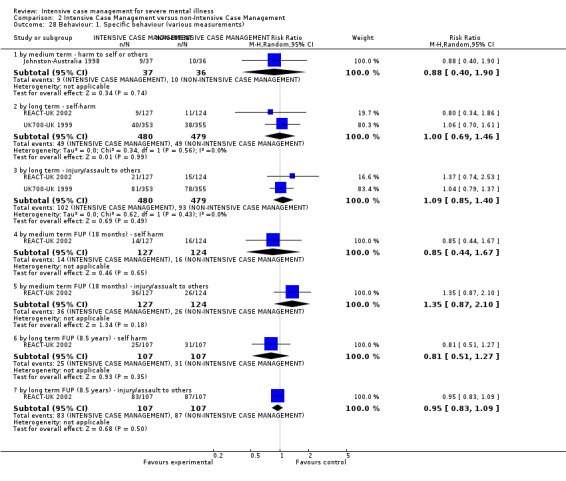
Comparison 2 Intensive Case Management versus non‐Intensive Case Management, Outcome 28 Behaviour: 1. Specific behaviour (various measurements).
2.28.2 By long term ‐ self‐harm
We found two trials relevant to this subgroup. There was no clear difference between ICM and non‐ICM within this subgroup (n = 959, 2 RCTs, RR 1.00, 95% CI 0.69 to 1.46; Analysis 2.28).
2.28.3 By long term ‐ injury/assault to others
We found two trials relevant to this subgroup. There was no clear difference between ICM and non‐ICM within this subgroup (n = 959, 2 RCTs, RR 1.09, 95% CI 0.85 to 1.4; Analysis 2.28).
2.28.4 By medium‐term FUP (18 months) ‐ self harm
There was a single trial in this subgroup. We did not find evidence of a clear difference between the two treatments (n = 251, RR 0.85, 95% CI 0.44 to 1.67; Analysis 2.28).
2.28.5 By medium‐term FUP (18 months) ‐ injury/assault to others
There was a single trial in this subgroup. We did not find evidence of a clear difference between the two treatments (n = 251, 1 RCT, RR 1.35, 95% CI 0.87 to 2.1; Analysis 2.28).
2.28.6 By long‐term FUP (8.5 years) ‐ self harm
There was a single trial in this subgroup. We did not find evidence of a clear difference between the two treatments (n = 214, 1 RCT, RR 0.81, 95% CI 0.51 to 1.27; Analysis 2.28).
2.28.7 By long‐term FUP (8.5 years) ‐ injury/assault to others
There was a single trial in this subgroup. We did not find evidence of a clear difference between the two treatments (n = 214, 1 RCT, RR 0.95, 95% CI 0.83 to 1.09; Analysis 2.28).
2.29 Quality of life: 1. Average endpoint score (various scales)
We found three studies assessing quality of life with three different scales (LQoLP, MANSA, QOLI) at different time periods. There were no significant differences between ICM and non‐ICM in any of these measures at any time period. Data on QOLI scores were available by short and medium term from one study. Long‐term data were available from three different studies measuring quality of life with three different scales, therefore not entering the analysis together. No results showed any significant difference between groups. Note that for this outcome the right graph label favours ICM (experimental group).
2.29.1 By short term ‐ overall life satisfaction (QOLI, high = better)
One study provided data, showing no difference between groups (n = 203, 1 RCT, MD ‐0.02, 95% CI ‐0.43 to 0.39; Analysis 2.29).
2.29. Analysis.
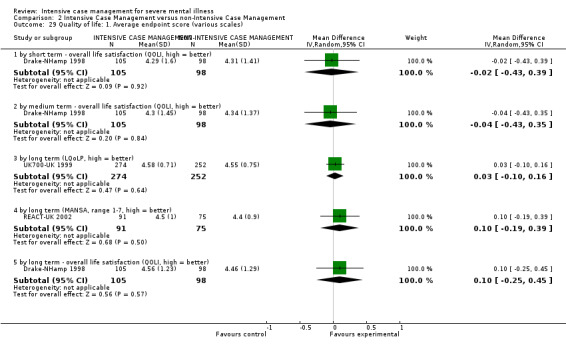
Comparison 2 Intensive Case Management versus non‐Intensive Case Management, Outcome 29 Quality of life: 1. Average endpoint score (various scales).
2.29.2 By medium term ‐ overall life satisfaction (QOLI, high = better)
One study provided data, showing no difference between groups (n = 203, 1 RCT, MD ‐0.04, 95% CI ‐0.43 to 0.35; Analysis 2.29).
2.29.3 By long term (LQoLP, high = better)
One study provided data, showing no difference between groups (n = 526, 1 RCT, MD 0.03, 95% CI ‐0.10 to 0.16; Analysis 2.29).
2.29.4 By long term (MANSA, range 1 to 7, high = better)
One study provided data, showing no difference between groups (n = 166, 1 RCT, MD 0.10, 95% CI ‐0.19 to 0.39).
2.29.5 By long term ‐ overall life satisfaction (QOLI, high = better)
One study provided data, showing no difference between groups (n = 203, 1 RCT, MD 0.1, 95% CI ‐0.25 to 0.45; Analysis 2.29).
2.30 Participant satisfaction/need: 1. Average endpoint scores (various scales) ‐ by long term
Long‐term data were available from one study, assessing participant need with CAN, and participant satisfaction with health service scale. There were no significant differences between groups as assessed with the two scales.
2.30.1 Patient need: CAN (high = poor)
One study provided data, showing no difference between groups (n = 585, 1 RCT, MD ‐0.29, 95% CI ‐0.69 to 0.11; Analysis 2.30).
2.30. Analysis.
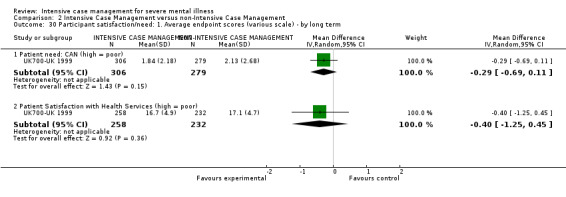
Comparison 2 Intensive Case Management versus non‐Intensive Case Management, Outcome 30 Participant satisfaction/need: 1. Average endpoint scores (various scale) ‐ by long term.
2.30.2 Patient Satisfaction With Health Services (high = poor)
One study provided data, showing no difference between groups (n = 490, 1 RCT, MD ‐0.4, 95% CI ‐1.25 to 0.45; Analysis 2.30).
2.31 Participant need: 1. Average endpoint scores (various scales, skewed data)
One study provided data suggesting a difference between interventions in participant need as assessed with CAN scores, showing a worse outcome in the ICM group in the medium and long term, but these data were skewed. A second study provided data on participant need, assessed with CANSAS by long term. These data failed to show any difference between groups. We have presented these data as 'other' data (Analysis 2.31).
2.31. Analysis.
Comparison 2 Intensive Case Management versus non‐Intensive Case Management, Outcome 31 Participants need: 1. Average endpoint scores (various scales, skewed data).
| Participants need: 1. Average endpoint scores (various scales, skewed data) | ||||
|---|---|---|---|---|
| Study | Intervention | Mean | SD | Total |
| by medium term (CAN, high = poor) | ||||
| Harrison‐Read‐UK 2000 | 1. ICM | 7.3 | 3.7 | 49 |
| Harrison‐Read‐UK 2000 | 2. non‐ICM | 6.1 | 4 | 60 |
| by long term (CAN, high = poor) | ||||
| Harrison‐Read‐UK 2000 | 1. ICM | 6.6 | 3.6 | 54 |
| Harrison‐Read‐UK 2000 | 2. non‐ICM | 5.6 | 3.8 | 59 |
| by long term (CANSAS, high = poor) | ||||
| REACT‐UK 2002 | 1. ICM | 3.3 | 2.7 | 91 |
| REACT‐UK 2002 | 2. non‐ICM | 3.4 | 2.9 | 75 |
2.32 Participant satisfaction: 1. Average endpoint scores (CSQ‐modified, high = better, skewed data) ‐ by long term
Skewed data from a different study suggested long‐term better satisfaction with treatment for the ICM group (data assessed with CSQ). We have reported these data as 'Other' data, (Analysis 2.32).
2.32. Analysis.
Comparison 2 Intensive Case Management versus non‐Intensive Case Management, Outcome 32 Participant satisfaction: 1. Average endpoint scores (CSQ‐modified, high = better, skewed data) ‐ by long term.
| Participant satisfaction: 1. Average endpoint scores (CSQ‐modified, high = better, skewed data) ‐ by long term | ||||
|---|---|---|---|---|
| Study | Intervention | Mean | SD | Total |
| REACT‐UK 2002 | 1. ICM | 77.2 | 20 | 91 |
| REACT‐UK 2002 | 2. non‐ICM | 70 | 20.6 | 75 |
2.33 Costs: 1. Direct costs of psychiatric hospital care (skewed data)
Costs were assessed measuring 'direct costs of psychiatric hospital care' and 'direct cost of all care'. No data were available on 'direct healthcare costs'.
Skewed data on direct costs of psychiatric hospital care were available from two studies by medium and long term. Medium‐ and long‐term data from one study found no significant difference between groups, whilst the second long‐term study data found costs were significantly lower for the ICM group. The latter study was small (Quinlivan‐California 1995, n = 60), where the former one was larger (Harrison‐Read‐UK 2000, n = 193). We have presented these data as 'Other' data, (Analysis 2.33).
2.33. Analysis.
Comparison 2 Intensive Case Management versus non‐Intensive Case Management, Outcome 33 Costs: 1. Direct costs of psychiatric hospital care (skewed data).
| Costs: 1. Direct costs of psychiatric hospital care (skewed data) | |||||
|---|---|---|---|---|---|
| Study | Intervention | Mean | SD | Total | Note |
| by medium term | |||||
| Harrison‐Read‐UK 2000 | 1. ICM* | 501 | 967.4 | 97 | |
| Harrison‐Read‐UK 2000 | 2. Low ICM* | 527 | 753 | 96 | * Unit cost £, fiscal year 1995/6.
** 'No significant difference between groups. Statistical analysis on non‐parametric data were performed using bootstrap methods'. ***Time period: 12 months. |
| by long term | |||||
| Harrison‐Read‐UK 2000 | 1. ICM* | 414 | 777.8 | 97 | |
| Harrison‐Read‐UK 2000 | 2. Low ICM* | 478 | 890 | 96 | * Unit cost £, fiscal year 1995/6.
** 'No significant difference between groups. Statistical analysis on non‐parametric data were performed using bootstrap methods'. ***Time period: 12 months. |
| Quinlivan‐California 1995 | 1. ICM* | 301 | 396.6 | 30 | |
| Quinlivan‐California 1995 | 2. Low ICM* | 959 | 1,572.7 | 30 | * Unit cost US $, fiscal year not reported, but study was carried on from April 1990 to March 1992.
** 'Costs significantly lower for the ICM group (F=4.32, df=2.87, p=0.02.)' ***Time period: 24 months |
2.34 Costs: 2a. Direct costs of all care ‐ by long term (2 years) ‐ unit cost GBP, fiscal year 1997/98
Direct costs of all care were available from one study reporting skewed data (UK700‐UK 1999), but with a sample size greater than 200. There was no significant difference between groups for reducing direct costs of all care (n = 667, 1 RCT, MD 77.00, 95% CI ‐66.63 to 220.63), but findings showed a trend suggesting greater cost in the ICM group. This trend suggested a cost increase of GBP 77 per person per month by long term, referred to as fiscal year 1997/98.
2.35 Costs: 2b. Direct costs of all care (skewed data) ‐ by medium term
One study (n = 58) reported skewed data on the same outcome (direct costs of all care) (Johnston‐Australia 1998). This data set showed no significant differences between groups by medium term, substantially confirming data by long term. We have reported these data as 'Other' data, (Analysis 2.35).
2.35. Analysis.
Comparison 2 Intensive Case Management versus non‐Intensive Case Management, Outcome 35 Costs: 2b. Direct costs of all care ‐ by medium term (skewed data).
| Costs: 2b. Direct costs of all care ‐ by medium term (skewed data) | |||||
|---|---|---|---|---|---|
| Study | Intervention | Mean | SD | Total | Note |
| Johnston‐Australia 1998 | 1. ICM* | 2,408 | 2,581.4 | 33 | |
| Johnston‐Australia 1998 | 2. Non‐ICM* | 1,762 | 1,872 | 25 | * Unit cost Aus $, fiscal year 1991/2.
** 'The significance test on the cost of care per patient was performed on transformed means. No significant differences were found between groups'. ***Time period: 12 months. |
2.36 Costs: 3. Total costs of care per patient ‐ unit cost GBP)
Total costs of care were available from two studies reporting skewed data (REACT‐UK 2002;UK700‐UK 1999), but with a sample size greater than 200. Total costs of care included direct and indirect costs (i.e. informal care, prison, court, probation officer, police custody, etc.).
2.36.1 By 24 months, fiscal year 1997/1998
There was no significant difference between groups for reducing total costs of care (n = 667, 1 RCT, MD 1849.00, 95% CI ‐1598.23 to 5296.23), but findings showed a trend suggesting greater cost in the ICM group (Analysis 2.36).
2.36. Analysis.
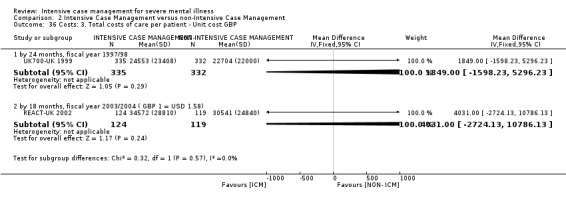
Comparison 2 Intensive Case Management versus non‐Intensive Case Management, Outcome 36 Costs: 3. Total costs of care per patient ‐ Unit cost GBP.
2.36.2 By 18 months, fiscal year 2003/2004 (GBP 1 = USD 1.58)
There was no significant difference between groups for reducing total costs of care (n = 243, 1 RCT, MD 4031.00, 95% CI ‐2724.13 to 10,786.13), but findings showed a trend suggesting greater cost in the ICM group (Analysis 2.36).
3. SENSITIVITY ANALYSES
As anticipated in the Methods section (see Methods, Sensitivity analysis), we performed the following sensitivity analyses.
3.1 Implication of randomisation
3.1.1 COMPARISON 1: INTENSIVE CASE MANAGEMENT versus STANDARD CARE
All of the included studies were described as randomised, and none were described in a way as to imply randomisation, therefore we did not include any trials in a sensitivity analysis.
3.1.2 COMPARISON 2: INTENSIVE CASE MANAGEMENT versus NON‐INTENSIVE CASE MANAGEMENT
All of the included studies were described as randomised, and none were described in a way as to imply randomisation, therefore we did not include any trials in a sensitivity analysis
3.2 Standard care caseload is over 20
3.2.1 COMPARISON 1: INTENSIVE CASE MANAGEMENT versus STANDARD CARE
Among studies reporting on our primary outcomes, only six studies reported the ratio of staff to participants, and for each study it was greater than 1:20 (Bond‐Chicago1 1990; Bond‐Indiana1 1988; Herinckx‐Oregon 1996; Jerrell‐SCarolina1 1991; OPUS‐Denmark 1999; Sytema‐Netherlands 1999).
When we entered these studies (where standard care group caseload was greater than 20) in the analysis, the first primary outcome 'average days per month in hospital' showed a significantly favourable effect in the ICM group in reducing the length of hospitalisation (n = 951, 7 RCTs/study centres, MD ‐2.01, 95% CI ‐3.36 to ‐0.67), but heterogeneity was substantial (I2 = 70%, P = 0.003). These findings confirm those obtained when all studies were entered in the analysis, regardless of caseload in the standard care comparison group.
The second primary outcome 'not remaining in contact with psychiatric services' showed that participants in the ICM group were significantly less likely to lose contact with psychiatric services than participants in the standard care group by medium term, long term, and overall (n = 931, 4 RCTs, MD 0.38, 95% CI 0.23 to 0.63), but heterogeneity was substantial (I2 = 67%, P = 0.03). These findings confirm those obtained when all studies were entered in the analysis, regardless of caseload in the standard care comparison group, however data in the sensitivity analysis showed a substantial level of heterogeneity not present when all studies were entered in the analysis.
3.3 Assumptions for lost binary data
3.3.1 COMPARISON 1: INTENSIVE CASE MANAGEMENT versus STANDARD CARE
No assumptions needed to be made regarding people lost to follow‐up for the primary binary outcome 'not remaining in contact with psychiatric services' for this comparison, therefore we did not include any trials in a sensitivity analysis.
3.3.2 COMPARISON 2: INTENSIVE CASE MANAGEMENT versus NON‐INTENSIVE CASE MANAGEMENT
For the second comparison, we needed to make assumptions regarding people lost to follow‐up for the primary binary outcome 'not remaining in contact with psychiatric services' for one trial (REACT‐UK 2002). When we compared the findings of the outcome when we used our assumption to when we used completer data only, results did not differ substantially.
3.4 Assumptions for lost continuous data (for meta‐regression)
We undertook sensitivity analysis, removing 13 out of 52 trials originally entering meta‐regression. These were trials where primary outcome standard deviation was imputed (see Table 5). Meta‐regression was therefore run on the remaining pool of 39 non‐imputed studies. Results no longer reached significance for both variables 'organisation fidelity subscore' and 'baseline hospital use' as P is at trend ˜ 0.07 ('organisation fidelity subscore': regression coefficient ‐0.2, 95% CI ‐0.48 to 0.02, P = 0.067; 'baseline hospital use': regression coefficient ‐0.18, 95% CI ‐0.39 to 0.02, P = 0.077). Removing a high‐influence outlier (Rosenheck‐USA‐NP (C)), significance returns for the effect of 'baseline hospital use' (‐0.26, 95% CI ‐0.51 to ‐0.01, P = 0.046), but not for 'organisation fidelity'. When combining the two variables within the model ('organisation fidelity subscore' and 'baseline hospital use'), the pattern of results did not change for the non‐imputed studies.
Discussion
Summary of main results
1. COMPARISON 1: INTENSIVE CASE MANAGEMENT versus STANDARD CARE
1.1 Service use
1.1.1 Service use: Average number of days in hospital per month ‐ at about 24 months
ICM does seem to reduce length of hospitalisation when compared with standard care (by 0.86 day per month over 24 months). However, these data were low quality and from a heterogeneous analysis; when certain studies are removed from the analysis, the now‐homogeneous result suggests that the saving is in the region of 0.6 days per month. We were unsure which of the two figures was the most reliable, but in any event trial findings suggest a saving of time in hospital per person of between about 7 and 10 days in hospital per year.
What is important, however, is that there was a high duration of hospital stay for these people in the two previous years (averaging 6 days per month). This was higher than for those in the ICM versus non‐ICM comparison (averaging 3.4 days per month), which found no difference between groups (see Figure 10). The impressive saving of time in hospital for ICM was greater than that of standard care, but the saving in standard care was also considerable (absolute decline for ICM was about 3 days, standard care was 1.8 days). Well‐organised standard care, for people with what would seem to be a history of considerable periods spent in hospital over the last 24 months, does seem to reduce the time in hospital for the ensuing two years. However, ICM adds more than an extra day to that gain.
The meta‐regression is a tool of limited power, employed on weak data. However, the results were in keeping with the results of one other review (Burns 2007), which suggests that the gain of ICM was not so much linked with the total fidelity score, the staff subscale, or the comparison group. It did suggest a link with the organisational subscore of the Index of Fidelity to Assertive Community Treatment (IFACT) scale (0.36 day per month out of hospital gained by each point increase of this subscore). It also suggested that ICM effect is linked to length of hospitalisation during the previous two years (0.2 day per month out of hospital gained by each day increase in the day in hospital per month during previous two years).
In other words, this means that:
if the ICM team ratio staff:client is less than 1:20 (calculated dividing the number of active clients on the caseload by the number of full‐time equivalents of direct service staff on the team), then it makes no difference how much the caseload is lower than 1:20;
the ICM team size does not matter (calculated as the number of full‐time clinical staff equivalents, as defined earlier);
the availability of a psychiatrist on the team is not pivotal; and/or
the availability of a nurse on the team is not pivotal.
It also suggested that gains in IFACT scores can reduce average hospital stay. McGrew 1994 and McGrew 1995 suggest that gain can be mediated by:
ensuring that the ICM team performed the role of primary therapist for the client (the primary therapist role designates the person within the local mental health system with primary clinical and record keeping (e.g. treatment plans) responsibility for the client);
the ICM team's offices being located in a separate building from the parent agency's main offices (i.e. usually away from the hospital site);
the ICM team sharing caseloads (rated as the degree to which all staff members on the team had contact with all clients on a regular basis, e.g. through rotation), in contrast to individual caseloads in which specific staff workers are responsible for specific clients;
the ICM team meeting as a group each weekday to discuss their entire caseload;
the ICM team’s supervisor devoting at least half time to client contacts, either cojointly during supervision of team members, or individually as part of his or her duties as a member of the team;
the ICM team providing 24‐hour direct access to the team (if access to the ICM team was triaged through the community mental health centre emergency 24‐hour on‐call service, intermediate score of 0.5 is obtained, therefore the advantage on decreasing days in hospital per month would be halved (‐0.2 days in hospital per month)); and/or
the ICM team serving clients without any expectation of transferring them to another programme.
1.1.2 Service use: Average number of days in hospital per month – by follow‐up
When the same outcome ‘average number of days in hospital per month’ was assessed on medium‐ and long‐term follow up, data did not confirm the effect of ICM in reducing length of hospitalisation assessed by 24 months. These data were provided by one large study (n = 547), where during the follow‐up period all participants received the control intervention (standard care). These data are suggestive of a loss of effect on reducing number of days in hospital over time, if ICM intervention is discontinued.
1.1.3 Service use: Not remaining in contact with psychiatric services
Overall, we found ICM to be better than standard care for retaining people in psychiatric services (n = 1633, 9 RCTs, RR 0.43, 95% CI 0.30 to 0.61). However, this effect was not seen for the short‐term analysis (n = 95, 1 RCT, RR 0.54, 95% CI 0.28 to 1.05), although confidence intervals were compatible with an effect favouring ICM (P = 0.07). Medium‐term findings did suggest an overall effect of ICM being better in reducing loss to follow‐up to psychiatric service contact (n = 1063, 3 RCTs, RR 0.51, 95% CI 0.36 to 0.71). In the longer term, this same effect was heterogeneous, due to an outlying finding of a single study (Herinckx‐Oregon). This trial had a peculiar definition for this outcome, which was different from the other studies. In Herinckx‐Oregon 'not remaining in contact with psychiatric services' did not include refusing re‐interview, moving out, and death, whereas for the other trials it did. If we exclude Herinckx‐Oregon, and only five long‐term trials are retained in the analysis, then ICM appears to be effective in preventing loss to follow‐up (n = 475, 5 RCTs, RR 0.27, 95% CI 0.11 to 0.66).
The result of a better retention in care for the ICM group strengthens the relevance of the result for the first primary outcome (i.e. ICM decreasing time in hospital). ICM decreases days of hospitalisation in a severe mentally ill population where patients are kept in close contact with services, therefore the ICM effect on reducing days in hospital might not be dissipated by a higher rate of loss to follow‐up.
1.1.4 Service use: Use of hospital
We found that ICM reduced the number of people admitted to hospital more than standard care, at least in the medium term (n = 1303, 5 RCTs, RR 0.85, 95% CI 0.77 to 0.93). Skewed data for 'average number of admissions in the medium term' were in accordance with these first findings, whilst skewed data for 'average number of admissions in the long term' failed to show any trend in the effect of intervention. Synthesis of short‐ and‐long term studies in this outcome produced heterogeneous findings. The short‐term data were from only two studies, and when the most positive one is removed (Bond‐Indiana1), the finding becomes clearly null. The long‐term data was from 11 trials; removing the three clearly outlying studies, Curtis‐New York, Macias‐Utah, and Test‐Wisconsin, also restores homogeneity and moves the finding squarely towards the null. One small study provided inconclusive data on the unplanned admission to the emergency department, an outcome describing only one option of psychiatric admission; for this reason, and because these data come from a single small study, we considered this finding weak.
Overall, the effect of ICM on admission to hospital is not strong. Whereas the time spent in hospital does seem to be less if allocated ICM ‐ at least for those whose baseline use of hospital was high ‐ the number of admissions is not greatly changed. Admissions are shorter, but not by much, if any less frequent.
1.1.5 Service use: Use of services outside of mental health provision
More outcomes were available describing ‘use of services outside of mental health provision’. Studies did not report a convincing difference in 'use of emergency room', 'rate of use of emergency room', ‘use of day hospital care’, or ‘rate of outpatient visits’. Only ‘rate of home visits’ was higher for the ICM group. However, we did not consider these data very robust, as they were based on single studies providing data per each outcome or on skewed data that were very difficult to interpret.
1.2 Adverse event
1.2.1 Death ‐ all cause and suicide
This review did not find any difference in mortality either due to all causes or to suicide in the short, medium, and long term and in medium‐ and long‐term follow‐up. Although death is a rare adverse event, the duration of the longer studies (˜ 24 months) means that some deaths would have been expected to occur and did (3.2% ICM versus 3.8% standard care). This difference was not statistically significant, but is homogeneous, and suggests a trend in terms of risk reduction (RR 0.84, 95% CI 0.48 to 1.47), partly confirmed in one large study on medium‐term follow‐up (RR 0.59, 95% CI 0.22 to 1.61). The same trend was confirmed in the ICM effect on mortality due to suicide by long term (suicide rate 1.3% ICM versus 2% standard care). Again, this difference was not statistically significant, but is homogeneous, and stronger compared to death due to all causes. If the suicide risk is in actuality so much reduced (RR 0.68, 95% CI 0.31 to 1.51), this would be a very important finding, although the quality of the evidence is low (Summary of findings table 1).
Few things have changed the outcome of death for people with schizophrenia. If, for this group of people, set in the context of a standard care with a high baseline risk of admission, ICM could decrease death, and by so much, this would be a strong argument in favour of ICM. These data on suicide are the findings of nine studies with only a total number of participants of 1456 and low‐quality evidence. A single larger trial might be able to confirm this important suggestion.
1.3 Global state
1.3.1 Global state: Relapse
No data were provided for the important outcome of relapse.
1.3.2 Global state: Leaving the study early
ICM data regarding number of participants lost to follow‐up for the short term were heterogeneous. However, we found ICM to be more advantageous than standard care in reducing rate of lost to follow‐up both in the medium term (n = 1699, 8 RCTs, RR 0.60, 95% CI 0.51 to 0.70) and long term (n = 1798, 13 RCTs, RR 0.68, 95% CI 0.58 to 0.79, low‐quality evidence). The impression remains that ICM, and again with the proviso that these findings may apply most specifically to a group with high baseline admission, holds on to people more tightly across time. This may not significantly lower admission rate, but loss to follow‐up and length of admission may decrease. Overall, these data were not of high quality (Summary of findings table 1), but there is a belief that ICM is advantageous over standard care for the higher‐risk groups. For example, in groups with only 10% loss to follow‐up across the long term, only 3 more people are not lost for every 100 given ICM. However, with more realistic figures of 50% loss to follow‐up, this figure rises to 15 more people out of every 100 who are kept in care compared with those allocated standard care.
1.3.3 Global state: Global Assessment of Functioning Scale (GAF)
Short‐term studies indicated a better improvement in GAF endpoint score for participants in the ICM group compared with those allocated standard care (short term: n = 797, 4 RCTs, MD 2.07, 95% CI 0.28 to 3.86). This effect was confirmed by the long‐term data (n = 818, 5 RCTs, MD 3.41, 95% CI 1.66 to 5.16). Whilst this is favourable for those allocated ICM, we are unsure of the clinical meaning of these data, as changes of two or three points on a scale that runs to 100 does not seem to be much. We have found no reference to the clinical meaning of such small changes.
1.3.4 Global state: Not compliant with medication
Only one long‐term study provided data on compliance with medication, and these indicated a higher compliance level in those allocated to ICM compared with those in the standard care group (n = 71, 1 RCT, RR 0.35, 95% CI 0.15 to 0.81). Again, this is an important finding and should be replicated. We are surprised that such easily recorded data are not reported in more studies.
1.4 Social functioning
1.4.1 Social functioning: Contact with legal system
Studies measuring contact with legal system used different definitions over varying time periods, which makes interpretation difficult. There was no real suggestion that ICM either increases or decreases the measures of this outcome. The ‘arrested’ and ‘imprisoned’ outcomes were the only ones with some consistency. They showed no significant difference in the intervention effect between groups. The ‘contact with the police’ outcome findings were from only one study and were not significant in the short term, but became significantly different in the medium term (favouring the ICM group). Overall, the legal outcomes were not convincing, and there is a need for more consistency in approach to this area of research.
1.4.2 Social functioning: Employment status
This review did not reveal any significant difference between ICM and standard care in employment status, as measured by different outcomes. Medium‐term findings on ‘number of people not competitively employed’ were based on only one trial. Both medium‐ and long‐term data reporting ‘not employed’ tended to favour ICM, although data were heterogeneous, and overall the quality of the evidence was very low (Summary of findings table 1). Data from one large trial on medium‐ and long‐term follow‐up failed to show any difference between interventions. Again, this is an important outcome for which more data are needed before firm conclusions can be drawn.
1.4.3 Social functioning: Accommodation status
Data on the outcome 'homelessness' were not convincing by short, medium, or long term, but were mostly derived from just a few trials.
The outcome 'not living in stable accommodation' was scarcely reported, available from only one long‐term study.
Regarding the 'not living independently’ outcome, we found that people allocated to ICM were more likely to live independently compared with those allocated standard care ‐ in the medium term, and even more so in the long term. This is another important finding of this review. If the risk of not living independently is in actuality substantially reduced by this ICM package (18% ICM versus 26% standard care, long term), at least for people with high baseline risk of admission, and if this is a desired outcome for this particular client group, then, combined with the other moderate but cumulative advantages, this finding further highlights the advantage of ICM over standard care.
Only one large study reported the outcome ‘days in supported house’, assessing it by long term and by medium‐ and long‐term follow‐up. The advantage for standard care reported on medium‐term follow‐up was not confirmed on long term or on long‐term follow‐up, failing to show a significant trend of effect.
1.4.4 Social functioning: Substance abuse
Only one study (n = 547) reported usable binary data for alcohol and drug abuse. A long‐term single study failed to show any advantage for participants treated with ICM compared to standard care. Skewed data were supplied by Sytema‐Netherlands (n = 81), with Dartmouth Assessment of Lifestyle Interviewscores tending to favour the ICM group for both drug use and alcohol consumption. However, we are unsure of the clinical meaning of these scores. Morse‐Missouri3 (n = 103) reported skewed data on days substances were used per month. There was no indication of any difference between groups. There is currently no compelling evidence that ICM affects abuse of substances or alcohol.
1.4.5 Social functioning: Various scales
Few studies reported usable data for social functioning scale, and outcome data were complicated by the use of different scales within single studies, making meta‐analysis impossible. In this confusion of evidence, we see no advantage for participants treated with ICM compared to those treated with standard care in terms of social functioning measures. This does not seem to concur with other findings on independent living. It could be that the fine‐grain measures of functioning are picking up subtle parameters of social function not effected by the package. It could also be that the measures are not sensitive enough to broad and important issues of social function.
1.5 Mental state
Rating of mental state in these trials illustrates the confusion of how such symptoms are recorded in randomised studies. Timings of use of the scales differ, and the findings are so problematic to interpret from the clinical perspective that we are left to make safe but bland conclusions.
No data were provided for the important outcome 'mental state: not improved to an important extent', and there does not seem to be any compelling evidence that, in this group of people, set where the baseline risk of admission is high, ICM in actuality substantially affects a person's mental state.
1.6 Behaviour: self harm
Based on findings from the larger of the studies, self harm was not convincingly reduced by use of the ICM model. The mortality finding discussed above, however, does seem to suggest that ICM reduced the risk of death. These findings are a little at odds with each other, although not entirely, providing all the more reason to continue to research into this area for these, the simplest of outcomes.
1.7 Quality of life
Few studies reported relevant outcomes. Short‐ and medium‐term outcome data were complicated by the use of different scales within single studies, making meta‐analysis impossible. We found that one short‐term study (n = 125) showed a better quality of life in the ICM group on the Lehman's Quality of Life Interview scale, but more medium‐ and long‐term data failed to show any advantage for participants treated in the ICM group compared with standard care. The few skewed data seem to concur with the impression that for quality of life measures used in trials, ICM confers no advantage over standard care.
1.8 Participant satisfaction/need
Participants administered ICM were more satisfied with their treatment compared with those administered standard care in these trials. These findings were based on data that were quite strong (short term, n = 61; medium term, n = 500; long term, n = 423). More satisfaction with care could enhance medication compliance, the will to keep in services, housing status, and a host of other variables. We are left doubting the size and meaning of the overall finding. We are unsure how encouraged we should be that these packages of care deliver an average of a two‐ to three‐point improvement in the Client Satisfaction Questionnaire.
Several of the smaller trials did measure need and unmet need. These skewed data were difficult to interpret, but did not seem to convincingly favour either of the groups.
1.9 Costs
With respect to cost of inpatient psychiatric care, ICM was consistently superior to standard care for the outcome 'direct costs of psychiatric hospital care', suggesting a saving of money per person of about USD 144 per month (fiscal year 1990). Two studies taking part in the same multicentre trial provided these data. Skewed data were contradictory, neither showing a trend confirming nor disputing these data.
We found no difference between groups with respect to direct healthcare costs (where skewed data were contradictory and provided by only two small studies). Results on ‘direct costs of all care’ were inconcludent, as data were skewed and different trials reported contradictory effects.
2. COMPARISON 2: INTENSIVE CASE MANAGEMENT versus NON‐INTENSIVE CASE MANAGEMENT
2.1 Service use
2.1.1 Service use: Average number of days in hospital per month ‐ at about 24 months
Moderate quality evidence from this review showed no significant advantage of ICM in reducing the average length of hospitalisation when compared with non‐ICM. This could be an important finding, and we see no good reason not to trust this result. The implications from this finding could be that if services are already providing non‐ICM, there is no point in investing in further intensiveness. We currently know of no review comparing non‐ICM with standard care and reporting relevant outcomes. This should be undertaken. It is possible that there are other features of ICM that may improve outcome, but we are not stipulating that we should specifically investigate for these. What was different between the two sets of comparisons was the baseline risk of admission in the previous two years (about 6 days per month for Comparison 1 versus about 3.4 days per month for Comparison 2). This was highlighted by the meta‐regression process. This generates further hypotheses. Baseline hospital risk is linked to service provision, service culture, severity of illness, and other issues. We do not have the sophistication of data to investigate these. What we are left with is the possibility that in a situation where people with severe mental illness have a duration in hospital of less than 4 days per month in the two years preceding the ICM package of care, the increased intensity of approach may not be justified.
2.1.2 Service use: Average number of days in hospital per month – at follow‐up
Data on medium‐ and long‐term follow‐up from one study (n = 237) failed to show a significant advantage of ICM in reducing the average length of hospitalisation when compared with non‐ICM. During the follow‐up period participants could remain in the originally allocated intervention or be transferred to the control one. These data on follow‐up confirmed the data at 24 months discussed above.
2.1.3 Service use: Not remaining in contact with psychiatric service
We found ICM to be more effective in increasing the number of people retained in contact with psychiatric service in the medium term, but we did not consider these findings robust as they were based only on one small trial (n = 73). We found no difference between interventions in the long term, but data were heterogeneous. Overall, when pooling medium‐ and long‐term data, we found no advantage for participants treated with ICM compared to non‐ICM for better retention in psychiatric service but, again, these data were heterogeneous, and we found no obvious explanation for the heterogeneity (n = 1255, 4 RCTs). Medium‐term (18 months) follow‐up data showed a trend favouring ICM in increasing the number of people retained in contact with psychiatric service.
2.1.4 Service use: Admissions
We found no difference between groups in the risk of being admitted to hospital in the long term (n = 1132, 3 RCTs, RR 0.91, 95% CI 0.75 to 1.12). These findings were confirmed by data from one long‐term study (n = 678) and one medium‐term study (n = 68) on the average number of admissions, where no advantage was shown between treatments in reducing number of admissions in the long term (moderate‐quality evidence, Table 2) or in the medium‐ and long‐term follow‐up. Data on frequency of admission and on length of hospitalisation therefore consistently show no effect of ICM for both outcomes.
2.2 Adverse events
2.2.1 Death due to all causes and to suicide
This review did not find provide strong evidence on mortality rate either due to all causes or to suicide in the short, medium, and long term, or in the medium‐ and long‐term follow‐up. These data are quite informative, especially those from long‐term studies, where the study length might balance the rarity of the event in detecting any difference between intervention effects. Some deaths occurred in the long‐term studies (2.0% ICM versus 2.2% non‐ICM) (n = 1634, 5 RCTs, RR 0.90, 95% CI 0.46 to 1.75). This impression was confirmed for studies reporting suicide only, as shown in Table 2, where low‐quality evidence also showed no difference between groups.
2.3 Global state
2.3.1 Global state: Relapse
No data were provided for this important outcome.
2.3.2 Global state: Leaving the study early
No studies were available for the short‐term outcome.
Data showed no difference between interventions by the medium term, but these data were not strong as they came from a small sample of two studies (n = 225) and were heterogeneous with inconsistency of effect.
We found ICM to be more advantageous than non‐ICM in reducing rate of lost to follow‐up by the long term.
Overall, pooling studies from subgroups for two time points, we found heterogeneous data, but substantially confirming homogeneous data obtained by long term. ICM was confirmed to be more advantageous than non‐ICM in reducing rate of lost to follow‐up (n = 2195, 9 RCTs, RR 0.72, 95% CI 0.52 to 0.99). If we consider this outcome as proxy of a better retention in care, it might overcome the inconsistency of data on 'number of people remaining in contact with psychiatric service' (see Discussion ‐ 2.1.3 Service use: Not remaining in contact with psychiatric service). ICM therefore seems to positively reduce number of lost to follow‐up, but does not affect length and frequency of admission. These data were of low quality (Table 2), but it appears that ICM has an advantage over non‐ICM for the higher‐risk groups. For example, in groups with only 10% loss to follow‐up across the long term, only three more people are not lost for every 100 given ICM. However, with a more realistic figure of 50% loss to follow‐up, this rises to 14 more people out of every 100 are kept in care compared with those allocated standard care.
2.3.3 Global state: Health of the Nation Outcome Scale (HoNOS)
Not enough studies were available to run a meta‐analysis on data derived from the HoNOS or from any other scales assessing global state. Considering the comprehensiveness of the scale assessment of other outcomes, it appears that global state as an outcome is under‐recorded by trialists, despite being informative and relevant from a clinical point of view.
2.3.4 Global state: Compliance with medication
As for the previous outcome, not enough studies were available to run a meta‐analysis. Again, a very meaningful outcome from a clinical point of view is neglected.
2.4 Social functioning
2.4.1 Social functioning: Contact with legal system
As for studies included in Comparison 1, studies measuring contact with legal system used different definitions over a variety of time periods. This makes interpretation difficult. In addition, only a few studies addressed this outcome (three trials overall). There was no real suggestion that ICM either increases or decreases the measures of this outcome. The 'imprisoned' outcome was the only one with some consistency, showing no significant difference in the intervention effect between groups. The 'contact with the police' and 'arrested' outcome findings were from only one study each and were not significant in the short and long term, respectively. Overall, the legal outcomes were not convincing, and there is a need for more consistency in approach to this area of research.
2.4.2 Social functioning: Employment status
Data available for this outcome were substantially inconclusive, reported by only one small trial (n = 73). This trial measured employment status according to two different definitions: 'spent more than one day employed' and 'on paid employment'. Both findings were not significant in the medium term, and overall quality of evidence was low (Table 2). One larger study (n = 214) provided data on long‐term follow‐up (8.5 years after the randomised allocation was broken), showing no difference between the two groups. These data did not add much to the understanding of the impact of ICM on employment status compared to non‐ICM. Again, this is an important outcome underestimated in the current studies, and at this stage more data are needed before firm conclusions can be drawn.
2.4.3 Social functioning: Accommodation status
Available data on this outcome were surprisingly scarce, as this outcome was reported in just four studies. Two studies described this outcome with binary data: one measuring just 'living in supported accommodation' by medium term, the second measuring 'living in supported accommodation', 'homelessness', and ‘living independently’ by long term and on follow‐up. All data on different measures at different time periods were based on only one trial and they were not significant.
Two more studies described this outcome with continuous data on ‘average days per months in stable accomodation’, again failing to show any difference between the two groups. Findings seemed to point at a non‐significant difference in effects of intervention, although these findings were inconclusive due to the scarcity of available data, despite being easily recorded and very relevant from the perspective of a community‐based service.
2.4.4 Social functioning: Substance abuse
Only two studies measured substance abuse, and they described this outcome as binary and continuous measures, and not consistently across studies. This makes interpretation difficult and findings unconvincing, as a single study entered each measurement, and we therefore could not carry out any meta‐analysis. As far as we could assess, there was no indication of any long‐term difference between groups in 'number of people abusing alcohol', 'number of people abusing illicit drug', or 'remission from alcohol use disorder' (defined as Alcohol Use Scale score less than 3). These findings were confirmed by those continuous data, assessing the substance abuse with Substance Abuse Treatment Scale. These data failed to show a significant difference between groups at any time period assessment. As for the first comparison, currently there is no compelling evidence that ICM affects abuse of substances or alcohol.
2.4.5 Social functioning: Scale data
Findings were equivocal on scale data measuring social functioning, as provided by only one study. We do not think that future studies should address this outcome by use of scale measurement. Scales are not sensitive measures of social functioning. More effort should be placed on consistent and wide measurements of the main issues of social functioning (such as accommodation status, employment status, contact with legal system, rate of permanent social benefits).
2.5 Mental state: General symptoms and specific symptoms
Again, outcomes measured on scales were substantially inconclusive, as the data were spread across single studies on different scales and at different time periods, making meta‐analysis impossible. According to the low‐quality data available, there does not seem to be any compelling evidence that ICM substantially affects mental state. No data were available for the significant outcome of 'important improvement in mental health'.
2.6 Behaviour: Self harm and injury to others
This review did not reveal any long‐term significant difference between ICM and non‐ICM in risk of committing self harm or injury to others. These data were based on findings from two studies (n = 959), one of which is the largest study (UK700‐UK 1999), and the other the only study providing data on medium‐ and long‐term follow‐up (REACT‐UK 2002). These findings are consistent with the mortality findings discussed above, where no significant difference was shown in death rate between groups, either for suicide and for all causes. Although these data are suggestive of no difference of effects between interventions, they are still quite weak due to limited sample size. More trials should address this outcome, one of the simplest ones to collect.
2.7 Quality of life
Quality of life rating in these trials illustrates the confusion of how such symptoms are recorded in randomised studies. The scales differ, and the timings of use of the scales also differ. There was such an inconsistency in approach to this area of research to make meta‐analysis impossible. None of the available findings showed any significant difference between interventions. There does not seem to be any compelling evidence that ICM substantially affects the quality of life of a person with severe mental illness.
2.8 Participant satisfaction/need
Findings tended to favour the ICM group in being better satisfied with health services and in reducing need. However, this difference was not significant, and both findings were based on data from the same trial, the largest one (UK700‐UK 1999, n = 585). We therefore cannot draw any conclusions, but highlight a possible favourable effect in the ICM group, which needs to be confirmed.
2.9 Costs
Studies assessed 'direct costs of psychiatric hospital care', 'direct cost of all care', and ‘total cost of care’. Regarding the first outcome, findings were based on skewed data, provided by one small trial (Quinlivan‐California 1995, n = 60) and one larger one (Harrison‐Read‐UK 2000, n = 193). There did not appear to be any compelling evidence that ICM substantially affects 'direct costs of psychiatric hospital care', either by medium or long term. Also, findings on long‐term 'direct cost of all care' did not show any difference between interventions. Again, findings on ‘total cost of care’ failed to show any difference between ICM and non‐ICM.
Overall completeness and applicability of evidence
1. Completeness
1.1 Duration of follow‐up
The majority of studies presented long‐term data, that is over one year of follow‐up. This is a reasonable length of time to sensibly assess any difference in the intervention effects.
Two studies, one in the first comparison (ICM versus standard care) and one in the second comparison (ICM versus non‐ICM) presented long‐term follow‐up (from 18 months to 8 years), assessing outcomes after the active intervention was discontinued or after participants could chose to which arm they were allocated.
1.2 Coverage of outcomes
As the experimental intervention is a service organisation model, its realisation involves health policy and research should account for efficacy and cost evaluation. The outcomes reported were mainly service use and social functioning oriented. No studies reported data on relapse (see Table 1, Table 2), carer satisfaction and family burden. Participant satisfaction was scarcely reported and in a fragmented way, therefore available data are only partially informative on the effects of these approaches. Few studies provided cost data.
2. Applicability
2.1 Origin
The origin of the data has changed in the last decade since the two original reviews (Marshall 2000a; Marshall 2000b). There are now more included trials from Europe, whereas in the past the data source was largely North America, with a few trials from Australia. Thirty per cent of the total sample included in the current review comprises randomised people from Europe. These studies add power to the result for the primary outcome, narrowing the confidence intervals, but otherwise not substantially changing the findings. As only one study was from China, and all the remaining included studies were from Europe, North America, and Australia, the findings of this review still lack applicability to low‐income countries and, more generally, to countries where mental health systems are not community based.
2.2 People
Studies included people presenting a variability that we feel is likely to reflect the heterogeneous population a clinician faces in daily practice when treating people affected by severe mental illness. This variability was in terms of diagnosis (where participants were affected by a wide diagnostic group including schizophrenic, affective, and personality disorder); comorbidity (where four studies included dually diagnosed participants) (Drake‐NHamp 1998;Essock‐Connecticut2 2006;Morse‐Missouri3 2005;Muller‐Clemm‐Canada 1996); and social characteristics (where eight trials included homeless participants). On average, studies included people with a long history of illness; only OPUS‐Denmark 1999 included participants with a first episode of psychotic illness. This fits with the concept of severe mental illness, where this label includes certain criteria relating to length of illness.
2.3 Interventions
Some studies showed a greater applicability because the experimental intervention was provided by pre‐existing team, therefore closer to the real world and less contaminated by the experimental setting.
The majority of new included trials from the 2010 update compared ICM with non‐ICM (8 out of 14 trials), and they are all from Europe, Australia, and North America. This confirms the trend of psychiatric services in those particular areas to increasingly include some elements of the original model, but also to dilute and contaminate them with the current organisation. What we call 'standard care' is therefore converging toward non‐ICM. The two studies newly included from the 2015 update compare ICM with standard care: one is from the USA and assesses ICM adapted to the forensic setting, and the other is from China, where only recently community care is catching on. For those of us who practice in Europe, the second of the two comparisons in this review may well be more applicable to everyday care. Importantly, this comparison did not illustrate a substantial difference between ICM and non‐ICM.
Quality of the evidence
As illustrated in Figure 1, it appears there is an overall unclear risk of bias in these trials. This would therefore mean there is a moderate risk of overestimate of positive effect. Also, making difficult judgements about quality has been greatly helped by a discernable improvement in reporting of methodology.
Potential biases in the review process
There were several potential biases. We have worked mainly with published reports, and only in few cases with unpublished material. By doing this we may be perpetuating a reporting and publishing bias. It would have been better to have much more original individual participant data. This review follows from two past Cochrane reviews (Marshall 2000a; Marshall 2000b), as well as much work already published in paper format (Burns 2007). The conduct of these reports has influenced this document, and it is possible that we have failed to identify systematic biases in the way we have conducted the reviews across time.
An author of this review is an active pioneer in the development and implementation of the experimental intervention model across the scientific community and clinical world (MM), and one included study is his (Marshall‐UK 1995). As a team, we tried to ensure that decisions were made by rational consensus, and not to have an expert in the team would have been an inadvisable omission.
In some cases, protocol rules were unclear, and need for subsequent clarification arose and post hoc decisions had to be taken (see Differences between protocol and review). This could have affected the review process in various cases. This has probably lowered the quality of the data included in the review, but to not include so much, for example, skewed data, would have omitted much information. Also, by breaking down studies into their centres, many fell below the 200‐participant cutoff point. We have included these data in the 'less than 200' category, whereas in previous versions of the review they would have been in the 'greater than 200' category. Due to the overall effect of the changes in protocol, it appears that we have a more inclusive review, with data that are more heterogeneous and also more favourable for the experimental interventions than otherwise would have been the case should we have used a more limited data set. Nevertheless, we did feel it important to present all of these data for the reader to consider.
We prespecified what characteristics of studies could be associated with heterogeneity, and therefore we stated in the protocol what variables were to be explored in the meta‐regression before inspecting the results of the studies. Despite this prespecification, we were not blind to what variables were probably more related to heterogeneity, as we were familiar with some study results previously published. The undertaken exploration of heterogeneity might therefore at best lead to generation of hypothesis, but it cannot provide reliable conclusions.
Agreements and disagreements with other studies or reviews
This review merges two older Cochrane reviews, fully bringing up to date how these data should be considered. This version does not disagree with the older reviews; it simply replaces them with a more current viewpoint of the data. A major improvement in this version is data on duration of admission, which were previously lacking from past reviews. Other research in this area do not provide a full summary of available evidence on ICM effects across various outcomes (Burns 2007). This Cochrane review does not disagree with the paper version; it is just much more comprehensive. Regarding the meta‐regression, this review substantially confirms the hypothesis stated elsewhere that baseline hospital use and fidelity to the model affects outcome (Burns 2007).
Authors' conclusions
Implications for practice.
1. For people with severe mental illnesses
We found ICM to be effective in ameliorating many outcomes relevant to people with severe mental illness. Compared to standard care, ICM may reduce hospitalisation and increase retention in care. In fact, ICM was shown to reduce hospitalisation, in terms of less frequent and shorter admission to hospital; increase retention in care; probably reduce the risk of death and suicide; and globally improve social functioning in terms of a better accomodation status, employment status, and showing a trend in reducing contact with legal system. Although its effect on mental state and quality of life remains unclear, ICM seems to significantly help global state compared with standard care. However, it is unclear what gain ICM provides on top of a less formal non‐ICM approach. The latter may better suit some people with severe mental illness than the more intensive full‐ICM model. Data on satisfaction with care for ICM versus non‐ICM were very few and difficult to interpret.
2. For clinicians
ICM formalises a holistic approach to care of people with severe mental illness in the era of limiting hospital admissions and subsequent hospital closure. This review suggests that this formalising is helpful across several outcomes over and above standard care, the latter largely based in outpatient departments, and that this seems acceptable to people with severe mental illness. However, when the fully formal holistic approach (ICM) is compared with the less formal, but also holistic non‐ICM, the differences are not so clear. This could be seen as encouraging, as for various reasons many clinicians are unlikely to rigidly apply full ICM. This does not abrogate the need to know and apply key components of the model of care within ICM.
3. For policymakers
We know at this juncture that ICM is of value at least to people with severe mental illness in the subgroup with a high level of hospitalisation (about 4 days per month in past 2 years). The intervention should be performed close to the original model, therefore training should be planned for relevant mental health workers. Data on costs are still scarce, and we could not draw conclusions on cost‐effectiveness. Where ICM features are already available in the community psychiatric service (the non‐ICM intervention), it is unclear if additional full development to the rigid model of ICM is of value. The results of this review could guide policies on the introduction of such an ICM service in those countries where a community psychiatric service is already set up but ICM is not in use, and in countries where a shift from hospital‐based care in favour of a more community‐focused approach has still to be developed. Particular consideration should be given to the setting where ICM is to be developed, as its value was shown where the level of hospitalisation is high. It is unclear whether the introduction of some but not all of the ICM features (the non‐ICM intervention) is of value compared with community‐based standard care, as more research is needed to clarify the effects of non‐ICM versus those of standard care.
Implications for research.
1. General
First, as we have said previously, reporting of research does seem to have improved across time, and as a result the details of the practice of modern studies are much easier to understand.
However, this review illustrates how scale measurements are much more widespread than simple clinical questions for assessing clinical outcomes. We suggest that binary data are less ambiguous than continuous. There were many scales for the same outcome, further complicating matters: we found many studies assessing the same outcome on different scales and therefore did not feel justified to run a meta‐analysis. For example, there was need for consistency in approach regarding social functioning outcomes. Heterogeneous measurements were used to describe the same outcome. This is not very informative ‐ but this review illustrates opportunities lost by researchers. As it is possible that the time for more studies has past, by not having consistency, we will always be left in doubt about important effects of care. Finally, we presume that the use of scales may discourage any worker committed to patient care from taking part in an experimental study.
More attention should be placed on patient and family perspectives, in terms of detecting patient and carer satisfaction, quality of life, and family burden.
2. Specific
2.1 More reviews
We currently know of no review comparing non‐ICM with standard care and reporting relevant outcomes. This should be undertaken. In addition, we excluded several good studies from this review as they evaluated mixed models of care, or models plus other interventions such as cognitive behavioural therapy. These studies do merit further attention from reviewers and could help clarify further ways by which either the ICM model develops or new and yet more holistic approaches evolve.
2.2 Developing this review
A full data set with all individual participant data would help in avoiding some biases and allow re‐analysis using unified definitions of outcome. Any relevant studies in this area should make a provision for prospectively providing data compatible with this review.
2.3 More trials
We do not think that more trials comparing current ICM with standard care or non‐ICM are justified. We do think that the features of ICM that may improve outcome should be researched, as it may be that the model of intervention is effective only because of some of its features. This work may involve more observational studies in order to evolve the ICM model to new and better packages of care.
What's new
| Date | Event | Description |
|---|---|---|
| 23 August 2016 | New search has been performed | Results of 2012 and 2015 update searches added to the review. Two new studies added to included studies. |
| 23 August 2016 | New citation required but conclusions have not changed | Data from two new studies did not substantially alter results or change overall conclusions. |
| 10 April 2015 | Amended | Search updated, and 299 possibly related references were added to 'Classification pending references' of the review. |
History
Protocol first published: Issue 3, 2009 Review first published: Issue 10, 2010
| Date | Event | Description |
|---|---|---|
| 12 August 2012 | Amended | Update search of Cochrane Schizophrenia Group's Trial Register (see Search methods for identification of studies), 81 studies added to awaiting classification. |
| 6 October 2010 | Amended | Contact details updated. |
Acknowledgements
We acknowledge the additional authors of the two previous Cochrane Reviews, Marshall 2000a and Marshall 2000b, and the authors of a further study, Burns 2007, that were the forerunners of this review: Tom Burns, Jocelyn Catty, Michael Dash, Alastair Gray, Rex Green, Austin Lockwood, and Chris Roberts.
We would like to thank Miranda Mugford and Ian Shemilt for economic advice and Julian Higgins for statistical advice.
We acknowledge the following authors who provided us with further information on their trials through personal communication: Bjorkman‐Sweden 2002, Essock‐Connecticut1 1995, Essock‐Connecticut2 2006, Hargreaves‐California, Holloway‐UK 1996, LEO‐UK 1994, Malm‐Sweden 2003, REACT‐UK 2002, Rutter‐UK, Shern‐USA2, Tyrer‐UK 1995.
We are grateful for the substantial contribution of Clive Adams and the staff at the Cochrane Schizophrenia Group in Nottingham, UK, for all their practical help and spiritual support during our review process.
Parts of this review were generated using RevMan HAL v 4.2. You can find more information about RevMan HAL here.
We would also like to acknowledge the The National Institute for Health Research (NIHR), the largest single funder of the Cochrane Schizophrenia Group. NIHR provided an incentive grant to help authors incorporate results from the 2015 update search (see Sources of support).
Disclaimer: The views and opinions expressed therein are those of the authors and do not necessarily reflect those of the NIHR, NHS or the Department of Health.
Appendices
Appendix 1. Previous searches
1 Search method Assertive Community Treatment Review
1.1 Electronic searches
1.1.1 CINAHL (January 1982 to May 1997)
It was searched using the CSG's terms for randomised controlled trials and the CSG's terms for schizophrenia combined with the phrase:
[and ((case or care) near management) or CPA or (Care near1 Programme near1 Approach) or (Assertive near1 Community near1 Treatment) or PACT or TCL or (Training near (community near1 living)) or (Madison near4 model)]
1.1.2 The Cochrane Schizophrenia Group's Register (1997)
It was searched using the phrase:
[and ((case or care) and management) or CPA or (Care and Programme and Approach) or (Assertive and Community and Treatment) or PACT or TCL or (Training and (community and living)) or (Madison and model)]
1.1.3 EMBASE (January 1980 to May 1997)
It was searched using the CSG's terms for randomised controlled trials and the CSG's terms for schizophrenia combined with the phrase:
[and ((case or care) near management) or CPA or (Care near1 Programme near1 Approach) or (Assertive near1 Community near1 Treatment) or PACT or TCL or (Training near (community near1 living)) or (Madison near4 model)]
1.1.4 MEDLINE (January 1966 to May 1997)
It was searched using the CSG's terms for randomised controlled trials and the CSG's terms for schizophrenia combined with the phrase:
[and ((case or care) near management) or CPA or (Care near1 Programme near1 Approach) or (Assertive near1 Community near1 Treatment) or PACT or TCL or (Training near (community near1 living)) or (Madison near4 model)]
1.1.5 PsycLIT (January 1974 to May 1997)
It was searched using the CSG's terms for randomised controlled trials and the CSG's terms for schizophrenia combined with the phrase:
[and ((case or care) near management) or CPA or (Care near1 Programme near1 Approach) or (Assertive near1 Community near1 Treatment) or PACT or TCL or (Training near (community near1 living)) or (Madison near4 model)]
1.2. Searching other resources
1.2.1 Reference searching
Each of the randomised controlled trial identified was sought as a citation on the SCISEARCH database. Reports of articles that had cited these studies were inspected in order to identify further trials. Reference lists of all included trials and identified reviews were scanned for evidence of trials missed by the computerised search.
It should be noted that in electronic searches the phrase 'ACT' is not feasible as this common word generates a very large number of false positives.
2 Search method Case Management Review
2.1. Electronic searches
The Cochrane Schizophrenia Group's Register (1997), EMBASE (January 1980 to May 1995), MEDLINE (January 1966 to May 1995), PsycLIT (January 1974 to May 1995) and CINAHL were all searched for any text containing the following phrases:
[((case or care) and (management)) or CPA or (Care Programme Approach) or (Assertive Community Treatment) or (PACT) or (TCL) or (Training near2 community living) or (Madison near model)]
Each randomised controlled trial identified by the search was sought as a citation on the SCISEARCH database.
2.2. Searching other resources
2.2.1 Hand searching
Reports of articles that had cited these studies were inspected in order to identify further trials.
Citation lists of all included trials and identified reviews were scanned for evidence of trials missed by the computerised search.
3 Search method 2009, 2012 versions ICM Review
3.1. Cochrane Schizophrenia Group Trials Register (February 2009)
The register was searched using the phrase:
(*ca?e management* OR *cpa* OR *community treatment* OR *community team* OR *community cent* OR *community care approach* OR *madison model* OR *outreach* OR *hostel* OR *aftercare* OR *residential* OR *housing* OR *transitional* OR *posthospital* OR *partial hospitali?ation* OR *Foster* OR *Guardianship* OR *daily living programme* OR *crisis intervention* OR *early intervention* OR *Ambulatory treatment* OR *Ambulatory care* OR *community living* OR *social support* OR *patient care team* OR *community mental health* OR *patient participation* OR *assertive outreach* OR *drop‐in hospital* OR *drop‐in care* OR *drop‐in treatment* OR *drop‐in cent* OR *drop‐in unit* OR *drop in hospital* OR *drop in care* OR *drop in treatment* OR *drop in cent* OR *drop in unit* OR *day hospital* OR *day care* OR *day treatment* OR *day cent* OR *day unit* OR *Intensive care* OR *Intensive interven* OR *Intensive treat* OR *Intensive therap* OR *Intensive management* OR *Intensive model* OR *Intensive programmem* OR *Intensive team* OR *Intensive service* OR *mobile care* OR *mobile interven* OR *mobile treat* OR *mobile therap* OR *mobile management* OR *mobile model* OR *mobile programmem* OR *mobile team* OR *mobile service* OR *outreach care* OR *outreach interven* OR *outreach treat* OR *outreach therap* OR *outreach management* OR *outreach model* OR *outreach programmem* OR *outreach team* OR *outreach service* OR *community care* OR *community interven* OR *community treat* OR *community therap* OR *community management* OR *community model* OR *community programmem* OR *community team* OR *community service* OR *community base* OR *home care* OR *home interven* OR *home treat* OR *home therap* OR *home management* OR *home model* OR *home programmem* OR *home team* OR *home service* OR *home base* OR *aggressive outreach* OR *broker* OR *programme* OR *care programme approach* OR *care programme* in title, abstract, index terms of REFERENCE and in interventions of STUDY) OR (*Pact* OR *tcl* In title) OR(Pact* OR tcl* in abstract and index terms of REFERENCEand in interventions of STUDY)
This register is compiled by systematic searches of major databases, hand searches and conference proceedings (see Group’s Module ‐ Specialised Register).
3.2. Cochrane Schizophrenia Group Trials Register (August) 2012
The Trials Search Co‐ordinator searched the Cochrane Schizophrenia Group’s Trials Register (August 2012)
(*ca?e management* OR *cpa* OR *community treatment* OR *community team* OR *community cent* OR *community care approach* OR *madison model* OR *outreach* OR *hostel* OR *aftercare* OR *residential* OR *housing* OR *transitional* OR *posthospital* OR *partial hospitali?ation* OR *Foster* OR *Guardianship* OR *daily living programme* OR *crisis intervention* OR *early intervention* OR *Ambulatory treatment* OR *Ambulatory care* OR *community living* OR *social support* OR *patient care team* OR *community mental health* OR *patient participation* OR *assertive outreach* OR *drop‐in hospital* OR *drop‐in care* OR *drop‐in treatment* OR *drop‐in cent* OR *drop‐in unit* OR *drop in hospital* OR *drop in care* OR *drop in treatment* OR *drop in cent* OR *drop in unit* OR *day hospital* OR *day care* OR *day treatment* OR *day cent* OR *day unit* OR *Intensive care* OR *Intensive interven* OR *Intensive treat* OR *Intensive therap* OR *Intensive management* OR *Intensive model* OR *Intensive programmem* OR *Intensive team* OR *Intensive service* OR *mobile care* OR *mobile interven* OR *mobile treat* OR *mobile therap* OR *mobile management* OR *mobile model* OR *mobile programmem* OR *mobile team* OR *mobile service* OR *outreach care* OR *outreach interven* OR *outreach treat* OR *outreach therap* OR *outreach management* OR *outreach model* OR *outreach programmem* OR *outreach team* OR *outreach service* OR *community care* OR *community interven* OR *community treat* OR *community therap* OR *community management* OR *community model* OR *community programmem* OR *community team* OR *community service* OR *community base* OR *home care* OR *home interven* OR *home treat* OR *home therap* OR *home management* OR *home model* OR *home programmem* OR *home team* OR *home service* OR *home base* OR *aggressive outreach* OR *broker* OR *programme* OR *care programme approach* OR *care programme* or *Pact* OR *tcl* iin title, abstract, index terms of REFERENCE)
The Cochrane Schizophrenia Group’s Trials Register is compiled by systematic searches of major databases, handsearches and conference proceedings (see Group’s Module). Incoming trials are assigned to existing or new review titles.
Appendix 2. Previous data collection and analyses methods
Selection of studies
The principal reviewer (MD) inspected all abstracts of studies identified as above and identified potentially relevant reports. In addition, to ensure reliability, CBI inspected a random sample of these abstracts, comprising 10% of the total. Where disagreement occurred this was resolved by discussion, or where there was still doubt, the full article was acquired for further inspection. The full articles of relevant reports were acquired for reassessment and carefully inspected for a final decision on inclusion (see Criteria for considering studies for this review). Once the full articles were obtained, in turn MD and CBI inspected all full reports and independently decided whether they met inclusion criteria. MD and CBI were not blinded to the names of the authors, institutions or journal of publication. Where difficulties or disputes arose, we asked author MM for help and if it was impossible to decide, these studies were added to those awaiting assessment and the authors of the papers contacted for clarification.
Data extraction and management
1. Extraction 1.1 Data regarding criteria and outcomes The principal reviewer (MD) extracted data from all included studies. In addition, to ensure reliability, CBI independently extracted data from a random sample of these studies, comprising 10% of the total. Again, any disagreement was discussed, decisions documented and, if necessary, authors of studies were contacted for clarification. With remaining problems MM helped clarify issues and those final decisions were documented. Data presented only in graphs and figures were extracted whenever possible, but were included only if two reviewers independently had the same result. Attempts were made to contact authors through an open‐ended request in order to obtain missing information or for clarification whenever necessary. Where possible, we extracted data relevant to each component centre of multi‐centre studies separately.
1.2 Additional data 1.2.1 Fidelity This rating related to the Intensive Case Management intervention. This rated fidelity of the intervention to assertive community treatment on the 'team membership' and 'team structure and organisation' sub‐scales of the Index of Fidelity to Assertive Community Treatment (IFACT) (McGrew 1994).
This index was derived from a survey of 20 clinical experts in assertive community treatment and validated in a survey of 18 programmes.
a. The 'team membership' sub‐scale comprises four items:
‐ ratio of patients to staff ‐ total size of team ‐ extent of psychiatric input ‐ extent of nursing input to the team
b. The 'structure and organisation' sub‐scale comprises seven items, whether the team is:
‐ the primary source of care for its patients ‐ is situated away from the hospital ‐ meets daily ‐ shares responsibility for caseloads ‐ is available 24 hours a day ‐ has a team leader who is also a case manager ‐ offers unlimited time for its services
We chose IFACT because the sub‐scales are brief and are possible to be completed from published or unpublished text. For each item on the index, a score of one indicates high fidelity to the model. Score ranges from 0 to 11, where the maximum score available on 'team membership' sub‐scale is 4, and on 'structure and organisation' sub‐scale is 7, with higher scores indicating higher fidelity to the model.
We obtained fidelity data from published and unpublished trial reports, direct contact with trialists, and data previously obtained directly from trialists by previous reviews (Burns 2001, Catty 2002, Burns 2007). Two raters (MD and CBI) independently combined these data into a single fidelity score. Multicentre trials of Intensive Case Management often struggle to implement a uniform approach, with centres operating at different degrees of fidelity. Where possible, we rated each component centre separately.
1.2.2 Baseline hospital use The average number of days per month in hospital for all participants in the two years before the study began.
We obtained this data from published and unpublished trial reports and from direct contact with trialists.
1.2.3 Service use: hospitalisation We obtained the primary outcome mean number of days per month in hospital for the included studies from published and unpublished trial reports, direct contact with trialists and data previously obtained directly from trialists reported by a previous review (Burns 2007).
2. Management 2.1 Forms Data were extracted onto standard, simple forms.
2.2 Data from multi‐centre trials Where possible MD and CBI verified independently calculated centre data against original trial reports.
3. Scale‐derived data We included continuous data from rating scales only if:
a. the psychometric properties of the measuring instrument had been described in a peer‐reviewed journal (Marshall 2000); and b. the measuring instrument was not written or modified by one of the trialists for that particular trial; and c. the measuring instrument is either i. a self‐report or ii. completed by an independent rater or relative (not the therapist).
4. Endpoint versus change data We preferred to use scale endpoint data, which typically cannot have negative values and is easier to interpret from a clinical point of view. Change data are often not ordinal and are very problematic to interpret. If endpoint data were unavailable, we used change data.
5. Skewed data 5.1 General Continuous data on clinical and social outcomes are often not normally distributed. To avoid the pitfall of applying parametric tests to non‐parametric data, we aim to apply the following standards to all data before inclusion: a) standard deviations and means are reported in the paper or obtainable from the authors; b) when a scale starts from the finite number zero, the standard deviation, when multiplied by two, is less than the mean (as otherwise the mean is unlikely to be an appropriate measure of the centre of the distribution, (Altman 1996); c) if a scale started from a positive value (such as PANSS which can have values from 30 to 210) the calculation described above was modified to take the scale starting point into account. In these cases skew is present if 2SD>(S‐S min), where S is the mean score and S min is the minimum score. Endpoint scores on scales often have a finite start and end point and these rules can be applied. When continuous data are presented on a scale which includes a possibility of negative values (such as change data), it is difficult to tell whether data are skewed or not. Skewed data from studies of less than 200 participants were entered in additional tables rather than into an analysis. Skewed data pose less of a problem when looking at means if the sample size is large and were entered into syntheses.
5.2 Specific ‐ mean number of days in hospital We implemented one exception to the above rule (5.1) in order to present more data, recognising that this is a 'post hoc' decision, but also that the rules as regards management of skewed data and how robust skewed data are within meta‐analysis is unclear (Higgins 2011). Where mean number of days in hospital data were skewed, and they were provided by studies of less than 200 participants, we nevertheless entered those data into a sub‐group of the overall analysis. We also presented the overall effect from all data pooled.
6. Common measure To facilitate comparison between trials, we intended to convert variables that can be reported in different metrics, such as days in hospital (mean days per year, per week or per month) to a common metric (e.g. mean days per month).
7. Conversion of continuous to binary Where possible, efforts were made to convert outcome measures to dichotomous data. This could be done by identifying cut‐off points on rating scales and dividing participants accordingly into 'clinically improved' or 'not clinically improved'. It was generally assumed that if there had been a 50% reduction in a scale‐derived score such as the Brief Psychiatric Rating Scale (BPRS, Overall 1962) or the Positive and Negative Syndrome Scale (PANSS, Kay 1986), this could be considered as a clinically significant response ( Leucht 2005a, Leucht 2005b). If data based on these thresholds were not available, we used the primary cut‐off point presented by the original authors.
8. Direction of graphs Where possible, we entered data in such a way that the area to the left of the line of no effect indicates a favourable outcome for Intensive Case Management.
Assessment of risk of bias in included studies
Again working independently, the principal reviewer (MD) assessed risk of bias of all included studies and the second reviewer (CBI) assessed risk of bias from a random sample of these studies, comprising 10% of the total. MD and CBI assessed risk of bias using the tool described in the Cochrane Collaboration Handbook (Higgins 2011). This tool encourages consideration of how the sequence was generated, how allocation was concealed, the integrity of blinding at outcome, the completeness of outcome data, selective reporting and other biases. We would have excluded studies where allocation was clearly not concealed.
Trials with high risk of bias (defined as at least three out of five domains categorised as 'No') were not included in the meta‐analysis. If the raters disagreed, the final rating was made by consensus with the involvement of another member of the review group. Where inadequate details of randomisation and other characteristics of trials are provided, authors of the studies were contacted in order to obtain further information. Non‐concurrence in quality assessment was reported.
Measures of treatment effect
1. Binary data For binary outcomes we calculated a standard estimation of the random‐effects risk ratio (RR) and its 95% confidence interval (CI). It has been shown that RR is more intuitive (Boissel 1999) than odds ratios and that odds ratios tend to be interpreted as RR by clinicians (Deeks 2000). For statistically significant results we had planned to calculate the number needed to treat to provide benefit /to induce harm statistic (NNTB/H), and its 95% confidence interval (CI) using Visual Rx (http://www.nntonline.net/) taking account of the event rate in the control group. This, however, was superseded by Summary of findings table 1 and the calculations therein.
2. Continuous data 2.1 Summary statistic For continuous outcomes we estimated a random‐effects mean difference (MD) between groups. We preferred not to calculate effect size measures (standardised mean difference SMD). However, in the case of where scales were of such similarity to allow presuming there was a small difference in measurement, we calculated it and, whenever possible, we transformed the effect back to the units of one or more of the specific instruments.
Unit of analysis issues
1. Cluster trials Studies increasingly employ 'cluster randomisation' (such as randomisation by clinician or practice) but analysis and pooling of clustered data poses problems. Firstly, authors often fail to account for intra‐class correlation in clustered studies, leading to a 'unit of analysis' error (Divine 1992) whereby p values are spuriously low, confidence intervals unduly narrow and statistical significance overestimated. This causes type I errors (Bland 1997, Gulliford 1999).
Where clustering is not accounted for in primary studies, we presented data in a table, with a (*) symbol to indicate the presence of a probable unit of analysis error. In subsequent versions of this review we will seek to contact first authors of studies to obtain intra‐class correlation coefficients for their clustered data and to adjust for this by using accepted methods (Gulliford 1999). Where clustering had been incorporated into the analysis of primary studies, we present these data as if from a non‐cluster randomised study, but adjusted for the clustering effect.
We have sought statistical advice and have been advised that the binary data as presented in a report should be divided by a 'design effect'. This is calculated using the mean number of participants per cluster (m) and the intra‐class correlation coefficient (ICC) [Design effect = 1+(m‐1)*ICC] (Donner 2002). If the ICC was not reported it was assumed to be 0.1 (Ukoumunne 1999).
If cluster studies has been appropriately analysed taking into account intra‐class correlation coefficients and relevant data documented in the report, synthesis with other studies would have been possible using the generic inverse variance technique.
2. Cross‐over trials A major concern of cross‐over trials is the carry‐over effect. It occurs if an effect (e.g. pharmacological, physiological or psychological) of the treatment in the first phase is carried over to the second phase. As a consequence on entry to the second phase the participants can differ systematically from their initial state despite a wash‐out phase. For the same reason cross‐over trials are not appropriate if the condition of interest is unstable (Elbourne 2002). As both effects are very likely in severe mental illness, we only used data of the first phase of cross‐over studies.
3. Studies with multiple treatment groups Where a study involved more than two treatment arms, if relevant, the additional treatment arms were presented in comparisons. Where the additional treatment arms were not relevant, these data were not reproduced.
Dealing with missing data
1. Overall loss of credibility At some degree of loss of follow‐up, data must lose credibility (Xia 2007). For any particular outcome should more than 50% of data be unaccounted for, we did not reproduce these data or use them within analyses. If, however, more than 50% of those in one arm of a study were lost, but the total loss was less than 50%, we marked such data with (*) to indicate that such a result may well be prone to bias.
2. Binary In the case where attrition for a binary outcome is between 0 and 50% and where these data were not clearly described, data were presented on a 'once‐randomised‐always‐analyse' basis (an intention to treat analysis). Those leaving the study early were all assumed to have the same rates of negative outcome as those who completed, with the exception of the outcome of death. A sensitivity analysis was undertaken testing how prone the primary outcomes were to change when data from only those who completed the study were compared with intention to treat data using the assumption outlined above.
In the case were number of death was more than 10% of the sample overall, the above statement was applied but attrition due to death was not imputed.
3. Continuous 3.1 Attrition In the case where attrition for a continuous outcome is between 0 and 50% and data from only those who completed the study are reported, we have reproduced these.
3.2 Standard deviations 3.2.1 General Where there are missing measures of variance for continuous data, but exact standard errors or confidence intervals for group means, or either ‘p’ or 't' values for differences in means, we calculated standard deviation value according to method described in Section 7.7.3 of the Cochrane Handbook for Systematic Reviews of Interventions (Higgins 2011). If standard deviations were not reported and could not be calculated from available data, we asked authors to supply the data. In the absence of data from authors, we used the mean standard deviation from other studies.
3.2.2 Standard deviation mean number of days per month in hospital For the primary outcome, mean number of days per month in hospital, if standard deviations were not reported and could not be calculated from available data, we asked authors for additional information. In the absence of data from authors, we imputed the missing standard deviations using a regression analysis of SD against mean from those trials that provided both. We documented in Table 4 in what studies we imputed SDs according to the above technique.
3.3 Last observation carried forward We anticipated that in some studies the method of last observation carried forward (LOCF) would be employed within the study report. As with all methods of imputation to deal with missing data, LOCF introduces uncertainty about the reliability of the results. Therefore, where LOCF data has been used in the trial, if less than 50% of the data had been assumed, we reproduced these data and indicated that they are the product of LOCF assumptions.
3.4 Incomplete data for meta‐regression In some cases we anticipated that IFACT score variables would not all be available. If IFACT score could not be calculated from available data, we imputed it by multiple imputation using the mi library in R (R 2008). As explained above, we only made these assumptions if we were able to directly rate over 50% of the data. We documented in Table 5 in what studies we calculated IFACT score according to the above technique.
In some cases we anticipated that baseline hospital use data would not all be available. Missing data was imputed as for the IFACT scores. As explained above, we only make these assumptions if we were able to directly rate over 50% of the data. We documented for which studies we calculated baseline hospital use data according to the above technique (Table 5).
A sensitivity analysis was undertaken testing how prone the results from meta‐regression were to change when data from only those who completed the studies were compared with the imputed data using the assumption outlined above.
Assessment of heterogeneity
1. Clinical heterogeneity We considered all included studies initially, without seeing comparison data, to judge clinical heterogeneity. We simply inspected all studies for clearly outlying situations or people, which we had not predicted would arise. When such situations or participant groups arose, these were fully discussed.
In addition two potential sources of heterogeneity were specified a priori (fidelity and baseline level of hospital use (Data extraction and management). These data were extracted as described above.
2. Methodological heterogeneity We considered all included studies initially, without seeing comparison data, to judge methodological heterogeneity. We simply inspected all studies for clearly outlying methods which we had not predicted would arise. Should such methodological outliers arise these will be fully discussed.
3. Statistical heterogeneity 3.1 Visual inspection We visually inspected graphs to investigate the possibility of statistical heterogeneity.
3.2 Employing the I2statistic Heterogeneity between studies was investigated by considering the I2 method alongside the Chi2 'p' value. The I2 provides an estimate of the percentage of inconsistency thought to be due to chance (Higgins 2003). The importance of the observed value of I2 depends on i. magnitude and direction of effects and ii. strength of evidence for heterogeneity (e.g. 'p' value from Chi2 test, or a confidence interval for I2). I2 estimate greater than or equal to 50% accompanied by a statistically significant Chi2 statistic, was interpreted as evidence of substantial levels of heterogeneity (Section 9.5.2 ‐ Higgins 2011). When substantial levels of heterogeneity were found in the primary outcome, we explored reasons for heterogeneity (Subgroup analysis and investigation of heterogeneity).
Assessment of reporting biases
Reporting biases arise when the dissemination of research findings is influenced by the nature and direction of results (Egger 1997). These are described in Section 10 of the Cochrane Handbook for Systematic Reviews of Interventions (Higgins 2011). We are aware that funnel plots may be useful in investigating reporting biases but are of limited power to detect small‐study effects. We did not use funnel plots for outcomes where there were ten or fewer studies, or where all studies were of similar sizes. In other cases, where funnel plots were possible, we sought statistical advice in their interpretation.
Data synthesis
Where possible we employed a random‐effects model for analyses. We understand that there is no closed argument for preference for use of fixed or random‐effects models. The random‐effects method incorporates an assumption that different studies are estimating different, yet related, intervention effects. According to our hypothesis of an existing variation across studies, to be explored further in the meta‐regression analysis despite being cautious that random‐effects methods does put added weight onto the smaller of the studies ‐ we favoured using random‐effects model.
Subgroup analysis and investigation of heterogeneity
1. Subgroup analyses We anticipate two sub‐group analyses. For the first version of the protocol for this review we did not anticipate any sub‐group analyses. On further consideration we now realise that analysis at separate time periods could be thought of as sub‐groups. The second sub‐group is within the primary outcome and relates to skewed and non‐skewed data. This has been introduced late into this protocol and could be considered post hoc. However, we are also conscious that our original rule for management of these data could be considered overly cautious and result in some important data not being presented (Higgins 2011).
2. Investigation of heterogeneity 2.1 Anticipated heterogeneity ‐ outcome of mean days per month in hospital Investigation of heterogeneityformed part of the secondary objectives of the review. We hypothesised that the effect of Intensive Case Management on one of our primary outcomes (mean number of days per month in hospital) differs according to fidelity of intervention to the assertive community treatment model and the baseline level of hospital use.
The association of the IFACT score and the baseline number of days in hospital with the treatment effect was examined by performing random‐effects meta‐regression analysis in R (R 2008). The script we used to perform meta‐regression analyses is reported in Appendix 3. Meta‐regression was also carried out using both variables within the same model. The relationship between the treatment effect and the two variables was also examined using a thin plate spline. If possible data from multi‐centre studies were to be entered in the meta‐regression disaggregated into the component centre with outcome and fidelity data for each.
Meta‐regression was performed:
a) only if at least ten studies per comparison are available (Higgins 2011) b) all included studies were entered into the meta‐regression. Comparison type was also tested as an additional regressor in the model.
2.2 Unanticipated heterogeneity ‐ other outcomes 2.2.1 For outcomes other than the second primary outcome (not remaining in contact with psychiatric services) If inconsistency was high this was reported and no exploration undertaken.
2.2.2 For outcome 'not remaining in contact with psychiatric services' If inconsistency was high this was reported. First we investigated whether data had been entered correctly. Second, if data had been correct, the graph was visually inspected and studies outside of the company of the rest were successively removed to see if heterogeneity was restored. Should this occur with no more than 10% of the data being excluded, data were presented. If not, data were not pooled.
Should unanticipated clinical or methodological heterogeneity be obvious we simply stated hypotheses regarding these for future reviews or versions of this review. We did not anticipate undertaking analyses relating to these.
Sensitivity analysis
1. Implication of randomisation We aimed to include trials in a sensitivity analysis if they are described in some way as to imply randomisation. For the primary outcomes we included these studies and if there was no substantive difference when the implied randomised studies were added to those with better description of randomisation, then all data were employed from these studies.
2. Standard care caseload If data were available, a sensitivity analysis was undertaken testing how prone the primary outcomes were to change when trials comparing Intensive Case Management to standard community care caseload ≦ 20 were compared with trials comparing Intensive Case Management to standard community care caseload >20. If there was a substantial difference, we reported results and discussed them but continued to pool the data.
3. Assumptions for lost binary data Where assumptions had to be made regarding people lost to follow‐up (see Dealing with missing data) we compared the findings of the primary outcomes when we used our assumption compared with completer data only. If there was a substantial difference, we reported results and discussed them but continued to employ our assumption.
4. Assumptions for incomplete data for meta‐regression Where assumptions had to be made regarding missing SDs data in studies entering meta‐regression (see Dealing with missing data), we compared the findings of the meta‐regression on our primary outcome when we used our assumption compared with data taken from only those who completed the studies. A sensitivity analysis was undertaken testing how prone results from meta‐regression were to change when data from those who completed were compared with imputed data using the assumption outlined above. If there was a substantial difference, we reported results and discussed them but continued to employ our assumption.
Appendix 3. R script used to impute data and perform meta‐regression analysis
AOIP <‐ read.csv('META‐REG_2010_fmi.csv') AOIP <‐ AOIP[1:52,] names(AOIP) AOIPM <‐ AOIP # initially replace missing SD's by simple regression model on means exp <‐ lm(AOIP$Exp_SD ˜ poly(AOIP$Exp_MEAN,2)) exp2 <‐ predict(exp, as.data.frame(AOIP$Exp_MEAN), type = 'response') # plot(AOIP$Exp_SD, AOIP$Exp_MEAN, xlim = c(0,15)) # points(exp2, AOIP$Exp_MEAN, col = 'red') exp3 <‐ AOIP$Exp_SD exp3[is.na(exp3)] <‐ exp2[is.na(exp3)] AOIP$Exp_SD <‐ exp3 exp <‐ lm(AOIP$Con_SD ˜ poly(AOIP$Con_MEAN,2)) exp2 <‐ predict(exp, as.data.frame(AOIP$Con_MEAN), type = 'response') # plot(AOIP$Con_SD, AOIP$Con_MEAN, xlim = c(0,15)) # points(exp2, AOIP$Con_MEAN, col = 'red') exp3 <‐ AOIP$Con_SD exp3[is.na(exp3)] <‐ exp2[is.na(exp3)] AOIP$Con_SD <‐ exp3 library(mi) AOIP2 <‐ cbind(AOIP[,18], AOIP[,5:11], AOIP[,13], AOIP[,16:17]) names(AOIP2)[1] <‐ names(AOIP)[18] names(AOIP2)[9] <‐ names(AOIP)[13] info.aoip <‐ mi.info(AOIP2) # info.aoip <‐ update(info.aoip, "include", # list(trial_no="FALSE",cent.no="FALSE",trial_id="FALSE",centre_id="FALSE" )) imp.aoip <‐ mi(AOIP2, info.aoip, n.iter = 30) AOIP2 <‐ mi.data.frame(imp.aoip) AOIP2 <‐ cbind(AOIP[,1:4],AOIP2) # recreate Fideltot Fideltot <‐ AOIP2$Fid.Org + AOIP2$Fidstaff AOIP2 <‐ cbind(AOIP2, Fideltot) # set OPUS baseline mean to missing is.na(AOIP2[,13]) <‐ 19 AOIP2.mi <‐ AOIP2 AOIP <‐ AOIPM # write.csv(AOIP2, 'metaregdataset_imputed2010.csv') # meta analysis library(meta) AO1 <‐ metacont(AOIP$Exp_N, AOIP$Exp_MEAN, AOIP$Exp_SD, AOIP$Con_N, AOIP$Con_MEAN, AOIP$Con_SD, AOIP$centre_id) AO2 <‐ metacont(AOIP2$Exp_N, AOIP2$Exp_MEAN, AOIP2$Exp_SD, AOIP2$Con_N, AOIP2$Con_MEAN, AOIP2$Con_SD, AOIP2$centre_id) AO3 <‐ metacont(AOIP2$Exp_N, AOIP2$Exp_MEAN, AOIP2$Exp_SD, AOIP2$Con_N, AOIP2$Con_MEAN, AOIP2$Con_SD, AOIP2$centre_id, subset = (AOIP2$SCvsLICM == 1)) AO4 <‐ metacont(AOIP2$Exp_N, AOIP2$Exp_MEAN, AOIP2$Exp_SD, AOIP2$Con_N, AOIP2$Con_MEAN, AOIP2$Con_SD, AOIP2$centre_id, subset = (AOIP2$SCvsLICM == 2)) summary(AO1) summary(AO2) # metaregression # Control type AO2rct <‐ lm(AO2$TE ˜ AOIP2$SCvsLICM, weights = AO2$w.random) summary(AO2rct) # Total fidelity score AO2r1 <‐ lm(AO2$TE ˜ AOIP2$Fideltot, weights = AO2$w.random) summary(AO2r1) plot(AO2$TE ˜ AOIP2$Fideltot) abline(lm(AO2$TE ˜ AOIP2$Fideltot, weights = AO2$w.random)) # Interaction AO2rint <‐ lm(AO2$TE ˜ AOIP2$Fideltot * AOIP2$SCvsLICM, weights = AO2$w.random) summary(AO2rint) plot(AO2$TE ˜ AOIP2$Fideltot) abline(lm(AO2$TE ˜ AOIP2$Fideltot, weights = AO2$w.random)) # Organizational fidelity score AO2r2 <‐ lm(AO2$TE ˜ AOIP2$Fid.Org, weights = AO2$w.random) summary(AO2r2) plot(AO2$TE ˜ AOIP2$Fid.Org) abline(lm(AO2$TE ˜ AOIP2$Fid.Org, weights = AO2$w.random)) # more fancy plot plot(AO1$TE ˜ AOIP$Fid.Org, pch = 21, bg = 'blue', cex = AO1$w.random*6, ylab = 'Treatment Effect (Days)', xlab = 'Organizational Fidelity Score') abline(lm(AO2$TE ˜ AOIP2$Fid.Org, weights = AO2$w.random)) # against baseline AO2r4 <‐ lm(AO2$TE ˜ AOIP2$Baseline_Mean, weights = AO2$w.random) summary(AO2r4) plot(AO2$TE ˜ AOIP2$Baseline_Mean) abline(lm(AO2$TE ˜ AOIP2$Baseline_Mean, weights = AO2$w.random)) # fancy plot plot(AO1$TE ˜ AOIP$Baseline_Mean, pch = 21, bg = 'blue', cex = AO1$w.random*6, ylab = 'Treatment Effect (Days)', xlab = 'Baseline Days in Hospital') abline(lm(AO2$TE ˜ AOIP2$Baseline_Mean, weights = AO2$w.random)) # multivariate model AO2r5 <‐ lm(AO2$TE ˜ AOIP2$Baseline_Mean + AOIP2$SCvsLICM + AOIP2$Fid.Org, weights = AO2$w.random) summary(AO2r5) # Thin plate spline library(fields) x <‐ cbind(AOIP2$Baseline_Mean[‐19], AOIP2$Fid.Org[‐19]) fit <‐ Tps( x, AO2$TE[‐19], weights = AO2$w.random[‐19], df = 10) par(mfrow=c(2,1)) surface(fit) plot(x, pch = 21, bg = 'red', cex = AO2$w.random[‐19]*4)
Appendix 4. Results of searches from previous versions of this review
1. Selection of studies (see Selection of studies). When CBI inspected a random sample of study abstracts identified as above (see Search methods for identification of studies) comprising 10% of total abstracts the principal reviewer (MD) had inspected, disagreement did occur. Full articles were therefore acquired for further inspection. At this next stage MD and CBI had full agreement on the total sample of reports selected for further inspection.
When MD and CBI in turn inspected all full articles of relevant reports and independently decided whether they met inclusion criteria (see Criteria for considering studies for this review), they fully agreed and no difficulties or disputes arose on any report. It was not necessary contact third reviewer (MM) for clarifying issues.
2. Data extraction (see Data extraction and management) When CBI independently extracted data from a random sample of included studies (10% of total) disagreements were discussed. MD and CBI reached full agreement on final decisions.
3. Original Cochrane reviews (Marshall 2000a, Marshall 2000b) 3.1 ACT (Marshall 2000b) Fourteen trials had met inclusion for the ACT versus standard care comparison. The trials included were Aberg‐Wistedt‐Sweden 1995, Audini‐UK 1994, Bond‐Chicago1 1990, Bond‐Indiana1 1988, Chandler‐California1 1991, Hampton‐Illinois 1992, Herinckx‐Oregon 1996, Jerrell‐SCarolina1 1991, Lehman‐Maryland1 1994, Morse‐Missouri1 1992, Quinlivan‐California 1995, Rosenheck‐USA 1993, Solomon‐Pennsylvania 1994 and Test‐Wisconsin 1985. All trials were included in the current review in the comparison ICM versus standard care.
For the ACT versus hospital‐based rehabilitation comparison, three trials had been eligible for inclusion (De Cangas‐Canada 1994, Lafave‐Canada 1996, Marx‐Wisconsin 1973). All three have been excluded from the current update as they did not met inclusion criteria.
Six trials were included in the ACT versus case management comparison (Bush‐Georgia 1990, Essock‐Connecticut1 1995, Jerrell‐SCarolina1 1991, Morse‐Missouri2 1997, Quinlivan‐California 1995, Solomon‐Pennsylvania 1994). Of the original six studies described above, two were included in the ICM versus standard care comparison as both are three arm studies comparing ICM (in two arms) versus standard care (Jerrell‐SCarolina1 1991, Solomon‐Pennsylvania 1994). Three trials were included in the ICM versus non‐ICM comparison (Bush‐Georgia 1990, Essock‐Connecticut1 1995, Quinlivan‐California 1995). Quinlivan‐California 1995 was included in both comparisons ICM versus standard care and ICM versus non‐ICM, as it had three arms comparing three differentiated interventions (ICM, non‐ICM and standard care). The sixth trial, Morse‐Missouri2 1997, although previously included, was excluded from the current update because it contained no usable data, as number for treatment groups were not presented.
3.2 Case Management (Marshall 2000a) Ten randomised controlled trials were included in the comparison of case management versus standard care (Curtis‐New York 1992, Ford‐UK 1995, Franklin‐Texas 1987, Jerrell‐SCarolina1 1991, Macias‐Utah 1994, Marshall‐UK 1995, Muijen‐UK2 1994, Quinlivan‐California 1995, Solomon‐Pennsylvania 1994, Tyrer‐UK 1995). Of these eight are now included (Curtis‐New York 1992, Ford‐UK 1995, Jerrell‐SCarolina1 1991, Macias‐Utah 1994, Marshall‐UK 1995, Muijen‐UK2 1994, Quinlivan‐California 1995, Solomon‐Pennsylvania 1994). Franklin‐Texas 1987 and Tyrer‐UK 1995 had to be excluded as they did not meet inclusion criteria on type of intervention.
4. 2009 update The February 2009 update search of Cochrane Schizophrenia Group’s Register of trials yielded 2565 references. We selected 55 for further inspection. Of these 14 trials met the inclusion criteria and were included (Bjorkman‐Sweden 2002, Drake‐NHamp 1998, Essock‐Connecticut2 2006, Harrison‐Read‐UK 2000, Johnston‐Australia 1998, Morse‐Missouri3 2005, Muller‐Clemm‐Canada 1996, Okpaku‐Tennessee 1997, OPUS‐Denmark 1999, Pique‐California 1999, REACT‐UK 2002, Sytema‐Netherlands 1999, Salkever‐SCarolina 1999, UK700‐UK 1999). Thirty one trials were excluded.
We added ten English language trials and five Chinese trials to those awaiting assessment and sought further information. Three trials which had been previously been awaiting assessment were able to be included as more reports had become available (Fekete 1998 now included as McDonel‐Indiana 1997, Holloway‐UK 1996, Shern‐USA1 2000).
Appendix 5. Dealing with missing data ‐ standard deviation mean number of days per month in hospital (Intensive Case Management Protocol)
3.2.2 Standard deviation mean number of days per month in hospital For the primary outcome, mean number of days per month in hospital, if standard deviations were not reported and could not be calculated from available data, we asked authors for additional information. In the absence of data from authors, we calculated missing standard deviations using a regression analysis of standard deviation against mean, based on data from studies which did report these data. If the standard deviations calculated according to the above technique were available from a previous review (published and unpublished data) (Burns 2007), we used these data.
Appendix 6. Dealing with missing data ‐ incomplete data for meta‐regression (Intensive Case Management Protocol)
3.4 Incomplete data for meta‐regression In some cases we anticipate that IFACT score variables will not all be available. Where these missing data are from multi‐centre studies from which we do have relevant data we assumed the missing variable score to be the mode of the available data from the other centres that we used as a reference. Where there was no clear reference centres, we tried to match the study to another we felt to be closest and used those scores. As explained above, we will only make these assumptions if we are able to directly rate over 50% of the data within each multi‐centre study and overall.
In some cases we anticipate that baseline hospital use data will not all be available. Where these missing data are from multi‐centre studies from which we do have relevant data we assumed the missing information to be the mean of the available data from the other centres that we used as a reference. Where there was no clear reference centres, we tried to match the study to another we felt to be closest and used those means. As explained above, we will only make these assumptions if we are able to directly rate over 50% of the data within each multi‐centre study and overall.
Data and analyses
Comparison 1. Intensive Case Management versus standard care.
| Outcome or subgroup title | No. of studies | No. of participants | Statistical method | Effect size |
|---|---|---|---|---|
| 1 Service use: 1. Average number of days in hospital per month ‐ by about 24 months | 24 | 3595 | Mean Difference (IV, Random, 95% CI) | ‐0.86 [‐1.37, ‐0.34] |
| 1.1 skewed data (sample size ≧ 200) | 5 | 1812 | Mean Difference (IV, Random, 95% CI) | ‐0.46 [‐0.95, 0.03] |
| 1.2 skewed data (sample size < 200) | 19 | 1783 | Mean Difference (IV, Random, 95% CI) | ‐1.01 [‐1.74, ‐0.28] |
| 2 Service use: 1a. Number of days in hospital ‐ by follow ‐up (skewed data, sample size ≧ 200) | 1 | Mean Difference (IV, Random, 95% CI) | Subtotals only | |
| 2.1 by medium term FUP (3 years) (previous year) | 1 | 547 | Mean Difference (IV, Random, 95% CI) | 0.10 [‐10.26, 10.46] |
| 2.2 by long term FUP (8 years) (previous year) | 1 | 547 | Mean Difference (IV, Random, 95% CI) | 4.30 [‐4.63, 13.23] |
| 3 Service use: 2. Not remaining in contact with psychiatric services | 9 | 1633 | Risk Ratio (M‐H, Random, 95% CI) | 0.43 [0.30, 0.61] |
| 3.1 by short term | 1 | 95 | Risk Ratio (M‐H, Random, 95% CI) | 0.54 [0.28, 1.05] |
| 3.2 by medium term | 3 | 1063 | Risk Ratio (M‐H, Random, 95% CI) | 0.51 [0.36, 0.71] |
| 3.3 by long term | 5 | 475 | Risk Ratio (M‐H, Random, 95% CI) | 0.27 [0.11, 0.66] |
| 4 Service use: 3a. Admitted to hospital | 16 | Risk Ratio (M‐H, Random, 95% CI) | Subtotals only | |
| 4.1 by short term | 2 | 244 | Risk Ratio (M‐H, Random, 95% CI) | 0.61 [0.22, 1.69] |
| 4.2 by medium term | 5 | 1303 | Risk Ratio (M‐H, Random, 95% CI) | 0.85 [0.77, 0.93] |
| 4.3 by long term | 11 | 1516 | Risk Ratio (M‐H, Random, 95% CI) | 0.96 [0.74, 1.23] |
| 4.4 by long term‐ during previous 12 months | 1 | 547 | Risk Ratio (M‐H, Random, 95% CI) | 0.67 [0.52, 0.86] |
| 4.5 by short term FUP ‐ unplanned admission through Emergency Department | 1 | 62 | Risk Ratio (M‐H, Random, 95% CI) | 1.0 [0.07, 15.28] |
| 5 Service use: 3b. Average number of admissions per month (skewed data) | Other data | No numeric data | ||
| 5.1 by medium term | Other data | No numeric data | ||
| 5.2 by long term | Other data | No numeric data | ||
| 6 Service use: 4a. Admitted to ER ‐ by long term | 1 | 178 | Risk Ratio (M‐H, Random, 95% CI) | 1.13 [0.72, 1.76] |
| 7 Service use: 4b. Average number of admissions to ER (skewed data) ‐ by medium term | Other data | No numeric data | ||
| 8 Service use: 5a. Received day hospital care ‐ by short term FUP | 1 | 62 | Risk Ratio (M‐H, Random, 95% CI) | 2.0 [0.19, 20.93] |
| 9 Service use: 5b. Outpatient visits ‐ by short term FUP (6 months) | 1 | 62 | Mean Difference (IV, Random, 95% CI) | 0.29 [‐0.14, 0.72] |
| 10 Service use: 5c. Outpatient visits ‐ by medium term (skewed data) | Other data | No numeric data | ||
| 11 Service use: 5d. Received home visits ‐ by short term FUP | 1 | 62 | Mean Difference (IV, Random, 95% CI) | 4.32 [3.42, 5.22] |
| 12 Adverse event: 1a. Death ‐ any cause | 14 | Risk Ratio (M‐H, Random, 95% CI) | Subtotals only | |
| 12.1 by short term | 2 | 161 | Risk Ratio (M‐H, Random, 95% CI) | 1.04 [0.16, 6.91] |
| 12.2 by medium term | 6 | 901 | Risk Ratio (M‐H, Random, 95% CI) | 0.78 [0.23, 2.62] |
| 12.3 by long term | 9 | 1456 | Risk Ratio (M‐H, Random, 95% CI) | 0.84 [0.48, 1.47] |
| 12.4 by medium term FUP (3 years) | 1 | 547 | Risk Ratio (M‐H, Random, 95% CI) | 0.59 [0.22, 1.61] |
| 12.5 by long term FUP (8 years) | 1 | 547 | Risk Ratio (M‐H, Random, 95% CI) | 0.92 [0.45, 1.88] |
| 13 Adverse event: 1b. Death ‐ suicide | 12 | Risk Ratio (M‐H, Random, 95% CI) | Subtotals only | |
| 13.1 by short term | 2 | 127 | Risk Ratio (M‐H, Random, 95% CI) | 0.35 [0.04, 3.27] |
| 13.2 by medium term | 4 | 819 | Risk Ratio (M‐H, Random, 95% CI) | 0.98 [0.17, 5.60] |
| 13.3 by long term | 9 | 1456 | Risk Ratio (M‐H, Random, 95% CI) | 0.68 [0.31, 1.51] |
| 13.4 by medium term FUP (3 years) | 1 | 547 | Risk Ratio (M‐H, Random, 95% CI) | 0.74 [0.17, 3.28] |
| 14 Global state: 1. Leaving the study early | 21 | Risk Ratio (M‐H, Random, 95% CI) | Subtotals only | |
| 14.1 by short term | 5 | 598 | Risk Ratio (M‐H, Random, 95% CI) | 0.79 [0.44, 1.41] |
| 14.2 by medium term | 8 | 1699 | Risk Ratio (M‐H, Random, 95% CI) | 0.60 [0.51, 0.70] |
| 14.3 by long term | 13 | 1798 | Risk Ratio (M‐H, Random, 95% CI) | 0.68 [0.58, 0.79] |
| 14.4 by medium term FUP (3 years) | 1 | 547 | Risk Ratio (M‐H, Random, 95% CI) | 1.01 [0.84, 1.21] |
| 14.5 by long term FUP (8 years) | 1 | 547 | Risk Ratio (M‐H, Random, 95% CI) | 0.88 [0.70, 1.09] |
| 15 Global state: 2. Average endpoint score (GAF, high = good) | 5 | Mean Difference (IV, Random, 95% CI) | Subtotals only | |
| 15.1 by short term | 4 | 797 | Mean Difference (IV, Random, 95% CI) | 2.07 [0.28, 3.86] |
| 15.2 by medium term | 3 | 722 | Mean Difference (IV, Random, 95% CI) | 0.09 [‐3.11, 3.28] |
| 15.3 by long term | 5 | 818 | Mean Difference (IV, Random, 95% CI) | 3.41 [1.66, 5.16] |
| 16 Global state: 3. Not compliant with medication ‐ by long term | 1 | 71 | Risk Ratio (M‐H, Random, 95% CI) | 0.35 [0.15, 0.81] |
| 17 Social functioning: 1a. Contact with legal system (various measurements) | 11 | Risk Ratio (M‐H, Random, 95% CI) | Subtotals only | |
| 17.1 by short term ‐ contact with the police | 1 | 61 | Risk Ratio (M‐H, Random, 95% CI) | 2.57 [0.73, 9.04] |
| 17.2 by medium term ‐ arrested | 3 | 604 | Risk Ratio (M‐H, Random, 95% CI) | 1.08 [0.61, 1.90] |
| 17.3 by medium term ‐ contact with the police | 1 | 88 | Risk Ratio (M‐H, Random, 95% CI) | 0.23 [0.09, 0.55] |
| 17.4 by medium term ‐ imprisoned | 4 | 804 | Risk Ratio (M‐H, Random, 95% CI) | 0.80 [0.39, 1.64] |
| 17.5 by long term ‐ arrested | 1 | 178 | Risk Ratio (M‐H, Random, 95% CI) | 0.66 [0.32, 1.37] |
| 17.6 by long term ‐ imprisoned | 5 | 908 | Risk Ratio (M‐H, Random, 95% CI) | 0.86 [0.45, 1.65] |
| 18 Social functioning: 1b. Mean contacts with legal system (skewed data) ‐ by medium term | Other data | No numeric data | ||
| 18.1 Bookings | Other data | No numeric data | ||
| 18.2 Jail days | Other data | No numeric data | ||
| 18.3 Convictions | Other data | No numeric data | ||
| 19 Social functioning: 2. Employment status (various measurements) | 6 | Risk Ratio (M‐H, Random, 95% CI) | Subtotals only | |
| 19.1 by medium term ‐ not competitively employed at the end of the trial | 1 | 88 | Risk Ratio (M‐H, Random, 95% CI) | 1.00 [0.91, 1.10] |
| 19.2 by medium term ‐ not employed at the end of the trial | 4 | 1136 | Risk Ratio (M‐H, Random, 95% CI) | 0.89 [0.79, 1.00] |
| 19.3 by long term ‐ not employed at the end of the trial | 4 | 1129 | Risk Ratio (M‐H, Random, 95% CI) | 0.70 [0.49, 1.00] |
| 19.4 by long term ‐ not working/studying in the previous year | 1 | 547 | Risk Ratio (M‐H, Random, 95% CI) | 0.86 [0.74, 0.99] |
| 19.5 by medium term FUP (3 years) ‐ not working/studying in the previous year | 1 | 547 | Risk Ratio (M‐H, Random, 95% CI) | 1.02 [0.90, 1.16] |
| 19.6 by long term FUP (8 years) ‐ not working/studying in the previous year | 1 | 547 | Risk Ratio (M‐H, Random, 95% CI) | 0.99 [0.88, 1.11] |
| 20 Social functioning: 3a. Accommodation status (various measurements) | 10 | Risk Ratio (M‐H, Random, 95% CI) | Subtotals only | |
| 20.1 by short term ‐ homelessness | 1 | 95 | Risk Ratio (M‐H, Random, 95% CI) | 0.04 [0.00, 0.70] |
| 20.2 by medium term ‐ homelessness | 1 | 88 | Risk Ratio (M‐H, Random, 95% CI) | 0.32 [0.03, 2.95] |
| 20.3 by medium term ‐ not living independently | 5 | 1303 | Risk Ratio (M‐H, Random, 95% CI) | 0.80 [0.66, 0.97] |
| 20.4 by long term ‐ homelessness | 3 | 418 | Risk Ratio (M‐H, Random, 95% CI) | 0.78 [0.34, 1.82] |
| 20.5 by long term ‐ not living independently | 4 | 1185 | Risk Ratio (M‐H, Random, 95% CI) | 0.65 [0.49, 0.88] |
| 20.6 by long term ‐ not living in stable accommodation | 1 | 168 | Risk Ratio (M‐H, Random, 95% CI) | 0.80 [0.65, 0.98] |
| 21 Social functioning: 3b. Accomodation status: mean number of days in supported house (skewed data, sample size ≧ 200) | 1 | Mean Difference (IV, Random, 95% CI) | Subtotals only | |
| 21.1 by long term (previous year) | 1 | 547 | Mean Difference (IV, Random, 95% CI) | 0.30 [‐13.98, 14.58] |
| 21.2 by medium term FUP (3 years) (previous year) | 1 | 547 | Mean Difference (IV, Random, 95% CI) | ‐22.20 [‐38.47, ‐5.93] |
| 21.3 by long term FUP (8 years) (previous year) | 1 | 547 | Mean Difference (IV, Random, 95% CI) | ‐6.70 [‐19.35, 5.95] |
| 22 Social functioning: 3c. Accommodation status (various measurements, skewed data) | Other data | No numeric data | ||
| 22.1 by medium term ‐ average days per month in stable accommodation | Other data | No numeric data | ||
| 22.2 by long term ‐ average days per month in sheltered homes | Other data | No numeric data | ||
| 23 Social functioning: 4a. Substance abuse | 1 | Risk Ratio (M‐H, Random, 95% CI) | Subtotals only | |
| 23.1 alcohol abuse ‐ by long term | 1 | 547 | Risk Ratio (M‐H, Random, 95% CI) | 0.55 [0.26, 1.17] |
| 23.2 illicit drug abuse ‐ by long term | 1 | 547 | Risk Ratio (M‐H, Random, 95% CI) | 0.96 [0.63, 1.47] |
| 23.3 substance abuse ‐ by medium term FUP (3 years) | 1 | 547 | Risk Ratio (M‐H, Random, 95% CI) | 0.91 [0.67, 1.24] |
| 24 Social functioning: 4b. Substance abuse (DALI, skewness not detectable) ‐ by medium term | Other data | No numeric data | ||
| 24.1 alcohol abuse (DALI, ‐4 to + 6, high = worse) | Other data | No numeric data | ||
| 24.2 drug abuse (DALI, ‐ 4 to + 4, high = worse) | Other data | No numeric data | ||
| 25 Social functioning: 4c. Substance abuse ‐ days used per month (skewed data) | Other data | No numeric data | ||
| 25.1 by medium term | Other data | No numeric data | ||
| 25.2 by long term | Other data | No numeric data | ||
| 26 Social functioning: 5a. Average endpoint score (various scales) | 3 | Mean Difference (IV, Random, 95% CI) | Subtotals only | |
| 26.1 by short term (RFS, low = poor) | 1 | 80 | Mean Difference (IV, Random, 95% CI) | ‐0.62 [‐2.23, 0.99] |
| 26.2 by short term (SAS‐adapted version, low = poor) | 1 | 80 | Mean Difference (IV, Random, 95% CI) | ‐3.34 [‐7.55, 0.87] |
| 26.3 by medium term ‐ social role performance (DAS, high = poor) | 1 | 55 | Mean Difference (IV, Random, 95% CI) | 0.10 [‐0.40, 0.60] |
| 26.4 by medium term (RFS, low = poor) | 1 | 80 | Mean Difference (IV, Random, 95% CI) | ‐0.86 [‐2.72, 1.00] |
| 26.5 by medium term (SAS‐adapted version, low = poor) | 1 | 80 | Mean Difference (IV, Random, 95% CI) | ‐3.30 [‐7.83, 1.23] |
| 26.6 by long term ‐ social role performance (DAS, high = poor) | 1 | 58 | Mean Difference (IV, Random, 95% CI) | ‐0.20 [‐0.67, 0.27] |
| 26.7 by long term (ISSI, low = poor) | 1 | 62 | Mean Difference (IV, Random, 95% CI) | 3.20 [0.11, 6.29] |
| 26.8 by long term (RFS, low = poor) | 1 | 80 | Mean Difference (IV, Random, 95% CI) | ‐2.35 [‐4.05, ‐0.65] |
| 26.9 by long term (SAS‐adapted version, low = poor) | 1 | 80 | Mean Difference (IV, Random, 95% CI) | ‐2.75 [‐7.13, 1.63] |
| 26.10 by long term (Strauss‐Carpenter Scale, low = poor) | 1 | 60 | Mean Difference (IV, Random, 95% CI) | 0.10 [‐1.17, 1.37] |
| 27 Social functioning: 5b. Average endpoint score (various scales, skewed data) | Other data | No numeric data | ||
| 27.1 by short term (SAS, high = poor) | Other data | No numeric data | ||
| 27.2 by medium term (SAS, high = poor) | Other data | No numeric data | ||
| 27.3 by long term (SAS, high = poor) | Other data | No numeric data | ||
| 27.4 by long term (REHAB, high = poor) | Other data | No numeric data | ||
| 28 Mental state: 1a. General symptoms ‐ average endpoint score (various scales) | 4 | Mean Difference (IV, Random, 95% CI) | Subtotals only | |
| 28.1 by short term (BPRS‐18 items, high = poor) | 2 | 668 | Mean Difference (IV, Random, 95% CI) | ‐1.56 [‐6.85, 3.73] |
| 28.2 by short term (BSI, high = poor) | 2 | 668 | Mean Difference (IV, Random, 95% CI) | ‐0.06 [‐0.19, 0.06] |
| 28.3 by short term (CSI, low = poor) | 1 | 125 | Mean Difference (IV, Random, 95% CI) | ‐0.56 [‐0.84, ‐0.28] |
| 28.4 by medium term (BPRS‐18 items, high = poor) | 2 | 662 | Mean Difference (IV, Random, 95% CI) | ‐0.96 [‐2.42, 0.51] |
| 28.5 by medium term (BSI, high = poor) | 2 | 662 | Mean Difference (IV, Random, 95% CI) | ‐0.02 [‐0.15, 0.10] |
| 28.6 medium term (CSI, low = poor) | 1 | 125 | Mean Difference (IV, Random, 95% CI) | ‐0.35 [‐0.65, ‐0.05] |
| 28.7 by long term (BPRS‐18 items, high = poor) | 3 | 777 | Mean Difference (IV, Random, 95% CI) | ‐1.48 [‐3.69, 0.74] |
| 28.8 by long term (BSI, high = poor) | 2 | 647 | Mean Difference (IV, Random, 95% CI) | ‐0.18 [‐0.31, ‐0.06] |
| 29 Mental state: 1b. General symptoms ‐ mean change from baseline (CSI, low = poor ) ‐ by long term | 1 | 168 | Mean Difference (IV, Random, 95% CI) | ‐0.32 [‐0.53, ‐0.11] |
| 30 Mental state: 1c. General symptoms ‐ average endpoint score (various scales, skewed data) | Other data | No numeric data | ||
| 30.1 by short term (BPRS‐24 items, high = poor) | Other data | No numeric data | ||
| 30.2 by short term (PSE, high = poor) | Other data | No numeric data | ||
| 30.4 by medium term (BPRS‐24 items, high = poor) | Other data | No numeric data | ||
| 30.5 by medium term (CPRS, high = poor) | Other data | No numeric data | ||
| 30.6 by medium term (PSE, high = poor) | Other data | No numeric data | ||
| 30.8 by long term (BPRS‐18 items, high = poor) | Other data | No numeric data | ||
| 30.9 by long term (BPRS‐24 items, high = poor) | Other data | No numeric data | ||
| 30.10 by long term (CPRS, high = poor) | Other data | No numeric data | ||
| 30.11 by long term (PSE, high = poor) | Other data | No numeric data | ||
| 30.12 by long term (SCL‐90, high = poor) | Other data | No numeric data | ||
| 31 Mental state: 2a. Specific symptoms ‐ depression at follow up interview | 1 | Risk Ratio (M‐H, Random, 95% CI) | Subtotals only | |
| 31.1 by medium term | 1 | 547 | Risk Ratio (M‐H, Random, 95% CI) | 0.77 [0.56, 1.04] |
| 31.2 by long term | 1 | 547 | Risk Ratio (M‐H, Random, 95% CI) | 0.83 [0.57, 1.21] |
| 31.3 by medium term FUP (3 years) | 1 | 547 | Risk Ratio (M‐H, Random, 95% CI) | 1.25 [0.91, 1.72] |
| 32 Mental state: 2b. Specific symptoms ‐ average endpoint score (various scales, skewed data, sample size ≧ 200) | 1 | Mean Difference (IV, Random, 95% CI) | Subtotals only | |
| 32.1 by long term ‐ positive symptoms (SAPS, high = poor) | 1 | 547 | Mean Difference (IV, Random, 95% CI) | ‐0.22 [‐0.45, 0.01] |
| 32.2 by long term ‐ negative symptoms (SANS, high = poor) | 1 | 547 | Mean Difference (IV, Random, 95% CI) | ‐0.42 [‐0.62, ‐0.22] |
| 32.3 by medium term FUP (3 years) ‐ positive symptoms (SAPS, high = poor) | 1 | 547 | Mean Difference (IV, Random, 95% CI) | 0.12 [‐0.15, 0.39] |
| 32.4 by medium term FUP (3 years) ‐ negative symptoms (SANS, high = poor) | 1 | 547 | Mean Difference (IV, Random, 95% CI) | ‐0.10 [‐0.33, 0.13] |
| 32.5 by long term FUP (8 years) ‐ positive symptoms (SAPS, high = poor) | 1 | 547 | Mean Difference (IV, Random, 95% CI) | 0.03 [‐0.21, 0.27] |
| 32.6 by long term FUP (8 years) ‐ negative symptoms (SANS, high = poor) | 1 | 547 | Mean Difference (IV, Random, 95% CI) | 0.06 [‐0.13, 0.25] |
| 33 Mental state: 2c. Specific symptoms ‐ average endpoint score (various scales, skewed data) | Other data | No numeric data | ||
| 33.3 by medium term ‐ depression symptoms (BDI, high = poor) | Other data | No numeric data | ||
| 33.4 by medium term ‐ negative symptoms (SANS, high = poor) | Other data | No numeric data | ||
| 33.7 by long term ‐ depression symptoms (BDI, high = poor) | Other data | No numeric data | ||
| 33.11 by long term ‐ negative symptoms (SANS, high = poor) | Other data | No numeric data | ||
| 34 Behaviour: 1. Specific behaviour ‐ self‐harm | 3 | Risk Ratio (M‐H, Random, 95% CI) | Subtotals only | |
| 34.1 by medium term | 2 | 620 | Risk Ratio (M‐H, Random, 95% CI) | 0.99 [0.61, 1.59] |
| 34.2 by long term | 1 | 123 | Risk Ratio (M‐H, Random, 95% CI) | 0.95 [0.14, 6.55] |
| 34.3 attempted suicide ‐ by long term (during last 12 months) | 1 | 547 | Risk Ratio (M‐H, Random, 95% CI) | 0.81 [0.47, 1.38] |
| 34.4 attempted suicide ‐ by medium term FUP (3 years) (during last 3 years) | 1 | 547 | Risk Ratio (M‐H, Random, 95% CI) | 0.95 [0.56, 1.62] |
| 35 Behaviour: 2. Social behaviour ‐ average endpoint score (SBS, high = poor) | Other data | No numeric data | ||
| 35.1 by medium term | Other data | No numeric data | ||
| 35.2 by long term | Other data | No numeric data | ||
| 36 Quality of life: 1a. Average endpoint score (various scales) | 7 | Mean Difference (IV, Random, 95% CI) | Subtotals only | |
| 36.1 by short term ‐ general well‐being (QOLI, high = better) | 1 | 125 | Mean Difference (IV, Random, 95% CI) | 0.53 [0.09, 0.97] |
| 36.2 by medium term (LQoLP, high = better) | 1 | 52 | Mean Difference (IV, Random, 95% CI) | 0.09 [‐0.60, 0.78] |
| 36.3 by medium term (MANSA ‐ range 1‐7, high = better) | 1 | 81 | Mean Difference (IV, Random, 95% CI) | 0.20 [‐0.29, 0.69] |
| 36.4 by long term (LQoLP, high = better) | 3 | 274 | Mean Difference (IV, Random, 95% CI) | ‐0.13 [‐0.38, 0.12] |
| 36.5 by long term (QOLI, high = better) | 2 | 132 | Mean Difference (IV, Random, 95% CI) | 0.09 [‐0.24, 0.42] |
| 37 Quality of life: 1b. Mean change from baseline (QOLI, high = better, skewed data) ‐ by long term | Other data | No numeric data | ||
| 38 Participant satisfaction: 1a. Average endpoint score (CSQ, high = better) | 3 | Mean Difference (IV, Random, 95% CI) | Subtotals only | |
| 38.1 by short term | 1 | 61 | Mean Difference (IV, Random, 95% CI) | 6.20 [2.60, 9.80] |
| 38.2 by medium term | 2 | 500 | Mean Difference (IV, Random, 95% CI) | 1.93 [0.86, 3.01] |
| 38.3 by long term | 2 | 423 | Mean Difference (IV, Random, 95% CI) | 3.23 [2.31, 4.14] |
| 39 Participants satisfaction: 1b. Average endpoint score (CSQ, high = better, skewed data) ‐ by short term | Other data | No numeric data | ||
| 40 Participants need: 1. Average endpoint score (various scales, skewed data) | Other data | No numeric data | ||
| 40.1 by medium term ‐ met needs (CANSAS, high = better) | Other data | No numeric data | ||
| 40.2 by medium term ‐ unmet needs (CANSAS, high = poor) | Other data | No numeric data | ||
| 40.4 by long term (CAN, high = poor) | Other data | No numeric data | ||
| 41 Costs: 1a. Direct costs of psychiatric hospital care ‐ by medium term (Unit cost = USD, fiscal year 1990) | 2 | 426 | Mean Difference (IV, Random, 95% CI) | ‐143.74 [‐272.40, ‐15.08] |
| 42 Costs: 1b. Direct costs of psychiatric hospital care ‐ skewed data | Other data | No numeric data | ||
| 42.1 by medium term | Other data | No numeric data | ||
| 42.2 by long term | Other data | No numeric data | ||
| 43 Costs: 2a. Direct healthcare costs ‐ by long term (Unit cost = USD, fiscal year 1988) | 2 | 873 | Mean Difference (IV, Random, 95% CI) | ‐529.24 [‐2143.59, 1085.10] |
| 44 Costs: 2b. Direct healthcare costs ‐ skewed data | Other data | No numeric data | ||
| 44.1 by medium term | Other data | No numeric data | ||
| 44.2 by short term FUP | Other data | No numeric data | ||
| 45 Costs: 3. Direct costs ‐ other data ‐ skewed data | Other data | No numeric data | ||
| 45.1 all care ‐ by short term | Other data | No numeric data | ||
| 45.2 all care ‐ by medium term | Other data | No numeric data | ||
| 45.3 all care ‐ by long term | Other data | No numeric data | ||
| 45.4 specific ‐ outpatient care ‐ by medium term | Other data | No numeric data | ||
| 45.5 specific ‐ prison ‐ by medium term | Other data | No numeric data |
1.5. Analysis.
Comparison 1 Intensive Case Management versus standard care, Outcome 5 Service use: 3b. Average number of admissions per month (skewed data).
| Service use: 3b. Average number of admissions per month (skewed data) | |||||
|---|---|---|---|---|---|
| Study | Intervention | Mean | SD | Total | Note |
| by medium term | |||||
| Bond‐Chicago1 1990 | 1. ICM | 0.16 | 0.15 | 42 | |
| Bond‐Chicago1 1990 | 2. Standard care | 0.26 | 0.23 | 40 | |
| by long term | |||||
| Audini‐UK 1994 | 1. ICM | 0.02 | 0.05* | 33 | |
| Audini‐UK 1994 | 2. Standard care | 0.03 | 0.06* | 33 | * Carried over from Sytema‐Netherlands. |
| Muller‐Clemm‐Canada 1996 | 1. ICM | 0.09 | 0.05* | 61 | |
| Muller‐Clemm‐Canada 1996 | 2. Standard care | 0.08 | 0.06* | 57 | * Carried over from Sytema‐Netherlands. |
| Sytema‐Netherlands 1999 | 1. ICM | 0.05 | 0.05 | 58 | |
| Sytema‐Netherlands 1999 | 2. Standard care | 0.05 | 0.06 | 57 | |
1.6. Analysis.
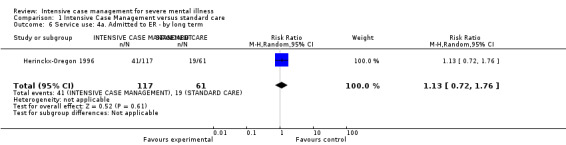
Comparison 1 Intensive Case Management versus standard care, Outcome 6 Service use: 4a. Admitted to ER ‐ by long term.
1.7. Analysis.
Comparison 1 Intensive Case Management versus standard care, Outcome 7 Service use: 4b. Average number of admissions to ER (skewed data) ‐ by medium term.
| Service use: 4b. Average number of admissions to ER (skewed data) ‐ by medium term | |||||
|---|---|---|---|---|---|
| Study | Intervention | Mean | SD | Total | Note |
| Jerrell‐SCarolina1 1991 | 1. ICM | 0.85 | 1.7* | 40 | |
| Jerrell‐SCarolina1 1991 | 2. Standard care | 0.73 | 3.3* | 40 | * Carried over from Lehman‐Maryland1. |
| Lehman‐Maryland1 1994 | 1. ICM | 0.9 | 1.7 | 77 | |
| Lehman‐Maryland1 1994 | 2. Standard care | 2 | 3.3 | 75 | |
1.11. Analysis.

Comparison 1 Intensive Case Management versus standard care, Outcome 11 Service use: 5d. Received home visits ‐ by short term FUP.
1.16. Analysis.
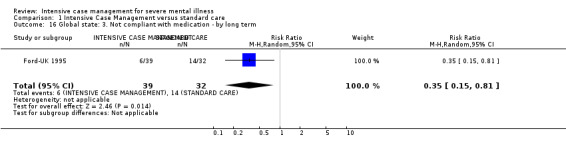
Comparison 1 Intensive Case Management versus standard care, Outcome 16 Global state: 3. Not compliant with medication ‐ by long term.
1.24. Analysis.
Comparison 1 Intensive Case Management versus standard care, Outcome 24 Social functioning: 4b. Substance abuse (DALI, skewness not detectable) ‐ by medium term.
| Social functioning: 4b. Substance abuse (DALI, skewness not detectable) ‐ by medium term | ||||
|---|---|---|---|---|
| Study | Intervention | Mean | SD | Total |
| alcohol abuse (DALI, ‐4 to + 6, high = worse) | ||||
| Sytema‐Netherlands 1999 | 1. ICM | ‐0.8 | 2.7 | 45 |
| Sytema‐Netherlands 1999 | 2. Standard Care | ‐1.2 | 2.4 | 36 |
| drug abuse (DALI, ‐ 4 to + 4, high = worse) | ||||
| Sytema‐Netherlands 1999 | 1. ICM | ‐1.4 | 1.3 | 45 |
| Sytema‐Netherlands 1999 | 2. Standard Care | ‐1.8 | 1.3 | 36 |
1.29. Analysis.
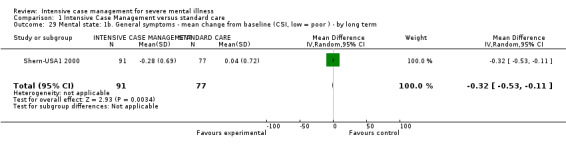
Comparison 1 Intensive Case Management versus standard care, Outcome 29 Mental state: 1b. General symptoms ‐ mean change from baseline (CSI, low = poor ) ‐ by long term.
1.35. Analysis.
Comparison 1 Intensive Case Management versus standard care, Outcome 35 Behaviour: 2. Social behaviour ‐ average endpoint score (SBS, high = poor).
| Behaviour: 2. Social behaviour ‐ average endpoint score (SBS, high = poor) | ||||
|---|---|---|---|---|
| Study | Intervention | Mean | SD | Total |
| by medium term | ||||
| Holloway‐UK 1996 | 1. ICM | 3.2 | 2.8 | 33 |
| Holloway‐UK 1996 | 2. Standard Care | 2.4 | 2.9 | 30 |
| by long term | ||||
| Holloway‐UK 1996 | 1. ICM | 3.3 | 2.8 | 34 |
| Holloway‐UK 1996 | 2. Standard Care | 2.7 | 2.2 | 26 |
Comparison 2. Intensive Case Management versus non‐Intensive Case Management.
| Outcome or subgroup title | No. of studies | No. of participants | Statistical method | Effect size |
|---|---|---|---|---|
| 1 Service use: 1. Average number of days in hospital per month ‐ by about 24 months | 21 | 2220 | Mean Difference (IV, Random, 95% CI) | ‐0.08 [‐0.37, 0.21] |
| 1.1 skewed data (sample size ≧ 200) | 3 | 694 | Mean Difference (IV, Random, 95% CI) | ‐0.58 [‐1.93, 0.76] |
| 1.2 skewed data (sample size < 200) | 18 | 1526 | Mean Difference (IV, Random, 95% CI) | ‐0.03 [‐0.33, 0.28] |
| 2 Service use: 1a. Average number of days in hospital per month ‐ by medium/long term follow up (skewed data, sample size ≧ 200) | 1 | Mean Difference (IV, Random, 95% CI) | Subtotals only | |
| 2.1 by medium term FUP (18 months) | 1 | 237 | Mean Difference (IV, Random, 95% CI) | 0.60 [‐1.25, 2.45] |
| 2.2 by long term FUP (8.5 years) | 1 | 203 | Mean Difference (IV, Random, 95% CI) | 0.80 [‐1.47, 3.07] |
| 3 Service use: 2. Not remaining in contact with psychiatric services | 4 | Risk Ratio (M‐H, Random, 95% CI) | Subtotals only | |
| 3.1 by medium term | 1 | 73 | Risk Ratio (M‐H, Random, 95% CI) | 0.27 [0.08, 0.87] |
| 3.2 by long term | 3 | 1182 | Risk Ratio (M‐H, Random, 95% CI) | 0.82 [0.34, 1.98] |
| 3.3 by medium term FUP (18 months) | 1 | 251 | Risk Ratio (M‐H, Random, 95% CI) | 0.42 [0.17, 1.05] |
| 4 Service use: 3a. Admitted to hospital ‐ by long term | 3 | 1132 | Risk Ratio (M‐H, Random, 95% CI) | 0.91 [0.75, 1.12] |
| 5 Service use: 3b. Average number of admissions (skewed data ‐sample size ≧ 200) | 2 | Mean Difference (IV, Random, 95% CI) | Subtotals only | |
| 5.1 ‐ by long term (24 months) | 1 | 678 | Mean Difference (IV, Random, 95% CI) | ‐0.18 [‐0.41, 0.05] |
| 5.2 by medium term FUP (18 months) | 1 | 237 | Mean Difference (IV, Random, 95% CI) | ‐0.10 [‐0.60, 0.40] |
| 5.3 by long term FUP (8.5 years) | 1 | 203 | Mean Difference (IV, Random, 95% CI) | 1.0 [‐0.25, 2.25] |
| 6 Service use: 3c. Average number of admissions (skewed data) ‐ by medium term | Other data | No numeric data | ||
| 7 Adverse event: 1a. Death ‐ any cause | 7 | Risk Ratio (M‐H, Random, 95% CI) | Subtotals only | |
| 7.1 by short term | 1 | 193 | Risk Ratio (M‐H, Random, 95% CI) | 0.0 [0.0, 0.0] |
| 7.2 by medium term | 3 | 294 | Risk Ratio (M‐H, Random, 95% CI) | 2.92 [0.12, 69.43] |
| 7.3 by long term | 5 | 1637 | Risk Ratio (M‐H, Random, 95% CI) | 0.90 [0.46, 1.75] |
| 7.4 by medium term FUP (18 months) | 1 | 251 | Risk Ratio (M‐H, Random, 95% CI) | 0.98 [0.32, 2.95] |
| 7.5 by long term FUP (8.5 years) | 1 | 251 | Risk Ratio (M‐H, Random, 95% CI) | 1.15 [0.63, 2.09] |
| 8 Adverse event: 1b. Death ‐ suicide | 8 | Risk Ratio (M‐H, Random, 95% CI) | Subtotals only | |
| 8.1 by short term | 1 | 193 | Risk Ratio (M‐H, Random, 95% CI) | 0.0 [0.0, 0.0] |
| 8.2 by medium term | 6 | 929 | Risk Ratio (M‐H, Random, 95% CI) | 1.61 [0.26, 9.85] |
| 8.3 by long term | 3 | 1152 | Risk Ratio (M‐H, Random, 95% CI) | 0.88 [0.27, 2.84] |
| 8.4 by medium term FUP (18 months) | 1 | 251 | Risk Ratio (M‐H, Random, 95% CI) | 0.33 [0.03, 3.09] |
| 9 Global state: 1. Leaving the study early | 9 | 2195 | Risk Ratio (M‐H, Random, 95% CI) | 0.72 [0.52, 0.99] |
| 9.1 by medium term | 2 | 225 | Risk Ratio (M‐H, Random, 95% CI) | 0.64 [0.13, 3.07] |
| 9.2 by long term | 7 | 1970 | Risk Ratio (M‐H, Random, 95% CI) | 0.70 [0.52, 0.95] |
| 10 Global state: 2a. Average endpoint score (HoNOS, high = poor) ‐ by long term | 1 | 239 | Mean Difference (IV, Random, 95% CI) | ‐0.40 [‐1.77, 0.97] |
| 11 Global state: 2b. Average endpoint score (HoNOS, high = poor) ‐ skewed data | Other data | No numeric data | ||
| 11.1 medium term | Other data | No numeric data | ||
| 11.2 long term | Other data | No numeric data | ||
| 12 Global state: 3a. Not compliant with medication ‐ by medium term | 1 | 73 | Risk Ratio (M‐H, Random, 95% CI) | 1.14 [0.42, 3.05] |
| 13 Global state: 3b. Compliance with medication ‐ average endpoint sub‐scale score (ROMI) ‐ by long term | 1 | Mean Difference (IV, Random, 95% CI) | Subtotals only | |
| 13.1 compliance sub‐scale (high = good) | 1 | 239 | Mean Difference (IV, Random, 95% CI) | 0.60 [‐0.05, 1.25] |
| 13.2 non‐compliance sub‐scale (high = poor) | 1 | 239 | Mean Difference (IV, Random, 95% CI) | ‐0.60 [‐1.63, 0.43] |
| 14 Global state: 3c. Compliance with medication ‐ average endpoint sub‐scale score (ROMI, score 1‐3, skewed data) | Other data | No numeric data | ||
| 14.1 medium term ‐ compliance sub‐scale (high = good) | Other data | No numeric data | ||
| 14.2 medium term ‐ non‐compliance sub‐scale (high = poor) | Other data | No numeric data | ||
| 14.3 long term ‐ compliance sub‐scale (high = good) | Other data | No numeric data | ||
| 14.4 long term ‐ non‐compliance sub‐scale (high = poor) | Other data | No numeric data | ||
| 15 Social functioning: 1. Contact with legal system (various measurements) | 3 | Risk Ratio (M‐H, Random, 95% CI) | Subtotals only | |
| 15.1 by medium term ‐ contact with the police | 1 | 73 | Risk Ratio (M‐H, Random, 95% CI) | 0.32 [0.04, 2.97] |
| 15.2 by long term ‐ imprisoned | 2 | 959 | Risk Ratio (M‐H, Random, 95% CI) | 1.15 [0.64, 2.08] |
| 15.3 by long term ‐ arrested | 1 | 251 | Risk Ratio (M‐H, Random, 95% CI) | 0.87 [0.53, 1.42] |
| 15.4 by medium term FUP (18 months) ‐ imprisoned | 1 | 251 | Risk Ratio (M‐H, Random, 95% CI) | 1.07 [0.47, 2.44] |
| 15.5 by long term FUP (8.5 years) ‐ imprisoned | 1 | 214 | Risk Ratio (M‐H, Random, 95% CI) | 0.7 [0.43, 1.14] |
| 16 Social functioning 2. Employment status (various measurements) | 2 | Risk Ratio (M‐H, Random, 95% CI) | Subtotals only | |
| 16.1 spent >1 day employed ‐ by medium term | 1 | 73 | Risk Ratio (M‐H, Random, 95% CI) | 1.46 [0.45, 4.74] |
| 16.2 on paid employment ‐ by medium term | 1 | 73 | Risk Ratio (M‐H, Random, 95% CI) | 0.97 [0.14, 6.54] |
| 16.3 unemployed ‐ by long term FUP (8.5 years) | 1 | 214 | Risk Ratio (M‐H, Random, 95% CI) | 1.10 [0.91, 1.34] |
| 17 Social functioning: 3a. Accommodation status (various measurements) | 2 | Risk Ratio (M‐H, Random, 95% CI) | Subtotals only | |
| 17.1 by medium term ‐ living in supported accommodation | 1 | 73 | Risk Ratio (M‐H, Random, 95% CI) | 2.59 [0.75, 9.01] |
| 17.2 by long term ‐ homelessness | 1 | 251 | Risk Ratio (M‐H, Random, 95% CI) | 0.69 [0.34, 1.38] |
| 17.3 by medium term FUP (18 months) ‐ living independently | 1 | 251 | Risk Ratio (M‐H, Random, 95% CI) | 0.98 [0.84, 1.13] |
| 17.4 by medium term FUP (18 months) ‐ living in supported accomodation | 1 | 251 | Risk Ratio (M‐H, Random, 95% CI) | 0.83 [0.38, 1.77] |
| 17.5 by medium term FUP (18 months) ‐ homelessness | 1 | 251 | Risk Ratio (M‐H, Random, 95% CI) | 0.84 [0.47, 1.49] |
| 17.6 by long term FUP (8.5 years) ‐ living in supported accomodation | 1 | 214 | Risk Ratio (M‐H, Random, 95% CI) | 1.05 [0.75, 1.48] |
| 17.7 by long term FUP (8.5 years) ‐ homelessness | 1 | 214 | Risk Ratio (M‐H, Random, 95% CI) | 0.92 [0.55, 1.53] |
| 18 Social functioning: 3b. Accommodation status ‐ average days per month in stable accommodation | 2 | Mean Difference (IV, Random, 95% CI) | Subtotals only | |
| 18.1 by short term | 1 | 203 | Mean Difference (IV, Random, 95% CI) | ‐0.20 [‐2.48, 2.08] |
| 18.2 by medium term | 1 | 203 | Mean Difference (IV, Random, 95% CI) | 0.10 [‐2.15, 2.35] |
| 18.3 by long term | 2 | 901 | Mean Difference (IV, Random, 95% CI) | ‐0.19 [‐1.37, 1.00] |
| 19 Social functioning: 4a. Substance abuse ‐ by long term | 2 | Risk Ratio (M‐H, Random, 95% CI) | Subtotals only | |
| 19.1 alcohol abuse | 1 | 251 | Risk Ratio (M‐H, Random, 95% CI) | 1.10 [0.67, 1.83] |
| 19.2 illicit drug abuse | 1 | 251 | Risk Ratio (M‐H, Random, 95% CI) | 1.08 [0.69, 1.71] |
| 19.3 alcohol ‐ remission from alcohol use disorder (AUS score < 3) | 1 | 223 | Risk Ratio (M‐H, Random, 95% CI) | 0.86 [0.65, 1.14] |
| 20 Social functioning: 4b. Substance abuse ‐ average endpoint score (SATS, low = poor) | 1 | Mean Difference (IV, Random, 95% CI) | Subtotals only | |
| 20.1 by short term | 1 | 203 | Mean Difference (IV, Random, 95% CI) | 0.07 [‐0.28, 0.42] |
| 20.2 by medium term | 1 | 203 | Mean Difference (IV, Random, 95% CI) | ‐0.11 [‐0.55, 0.33] |
| 20.3 by long term | 1 | 203 | Mean Difference (IV, Random, 95% CI) | 0.11 [‐0.41, 0.63] |
| 21 Social functioning: 4c. Alcohol ‐ abuse (various measurements, skewed data) | Other data | No numeric data | ||
| 21.1 short term ‐ days using alcohol during previous 6 months (TLFB) | Other data | No numeric data | ||
| 21.2 short term ‐ average endpoint score (AUS, high = poor) | Other data | No numeric data | ||
| 21.3 medium term ‐ days using alcohol during previous 6 months (TLFB) | Other data | No numeric data | ||
| 21.4 medium term ‐ average endpoint score (AUS, high = poor) | Other data | No numeric data | ||
| 21.5 long term ‐ days using alcohol during previous 6 months (TLFB) | Other data | No numeric data | ||
| 21.6 long term ‐ average endpoint score (AUS, high = poor) | Other data | No numeric data | ||
| 22 Social functioning: 5a. Average endpoint score (LSP, high = poor) ‐ by long term | 1 | 239 | Mean Difference (IV, Random, 95% CI) | 4.0 [‐0.61, 8.61] |
| 23 Social functioning: 5b. Average endpoint score (SFQ, high = poor) ‐ skewed data | Other data | No numeric data | ||
| 23.1 by medium term | Other data | No numeric data | ||
| 23.2 by long term | Other data | No numeric data | ||
| 24 Mental state: 1a. General symptoms ‐ average endpoint score (various scales) | 2 | Mean Difference (IV, Random, 95% CI) | Subtotals only | |
| 24.1 by short term (BPRS‐24 items, high = poor) | 1 | 203 | Mean Difference (IV, Random, 95% CI) | ‐0.65 [‐3.99, 2.69] |
| 24.2 by medium term (BPRS‐24 items, high = poor) | 1 | 203 | Mean Difference (IV, Random, 95% CI) | ‐1.62 [‐4.76, 1.52] |
| 24.3 by long term (BPRS‐24 items, high = poor) | 1 | 203 | Mean Difference (IV, Random, 95% CI) | ‐0.22 [‐3.32, 2.88] |
| 24.4 by long term (CPRS, high = poor) | 1 | 595 | Mean Difference (IV, Random, 95% CI) | 0.40 [‐1.83, 2.63] |
| 25 Mental state: 1b. General symptoms ‐ average endpoint scores (various scales, skewed data) | Other data | No numeric data | ||
| 25.1 by medium term (Krawiecka Scale, high = poor) | Other data | No numeric data | ||
| 25.2 by long term (Krawiecka Scale, high = poor) | Other data | No numeric data | ||
| 25.3 by long term (BPRS 24‐items, high = good) | Other data | No numeric data | ||
| 26 Mental state: 2a. Specific symptoms: negative symptoms ‐ average endpoint score (SANS, high = poor) ‐ by long term | 1 | 593 | Mean Difference (IV, Random, 95% CI) | 0.20 [‐2.32, 2.72] |
| 27 Mental state: 2b. Specific symptoms ‐ average endpoint scores (various scales, skewed data) | Other data | No numeric data | ||
| 27.1 medium term ‐ anxiety (HADS, high = poor) | Other data | No numeric data | ||
| 27.2 medium term ‐ depression (HADS, high = poor) | Other data | No numeric data | ||
| 27.3 long term ‐ anxiety (HADS, high = poor) | Other data | No numeric data | ||
| 27.5 long term ‐ depression (HADS, high = poor) | Other data | No numeric data | ||
| 28 Behaviour: 1. Specific behaviour (various measurements) | 3 | Risk Ratio (M‐H, Random, 95% CI) | Subtotals only | |
| 28.1 by medium term ‐ harm to self or others | 1 | 73 | Risk Ratio (M‐H, Random, 95% CI) | 0.88 [0.40, 1.90] |
| 28.2 by long term ‐ self‐harm | 2 | 959 | Risk Ratio (M‐H, Random, 95% CI) | 1.00 [0.69, 1.46] |
| 28.3 by long term ‐ injury/assault to others | 2 | 959 | Risk Ratio (M‐H, Random, 95% CI) | 1.09 [0.85, 1.40] |
| 28.4 by medium term FUP (18 months) ‐ self harm | 1 | 251 | Risk Ratio (M‐H, Random, 95% CI) | 0.85 [0.44, 1.67] |
| 28.5 by medium term FUP (18 months) ‐ injury/assualt to others | 1 | 251 | Risk Ratio (M‐H, Random, 95% CI) | 1.35 [0.87, 2.10] |
| 28.6 by long term FUP (8.5 years) ‐ self harm | 1 | 214 | Risk Ratio (M‐H, Random, 95% CI) | 0.81 [0.51, 1.27] |
| 28.7 by long term FUP (8.5 years) ‐ injury/assault to others | 1 | 214 | Risk Ratio (M‐H, Random, 95% CI) | 0.95 [0.83, 1.09] |
| 29 Quality of life: 1. Average endpoint score (various scales) | 3 | Mean Difference (IV, Random, 95% CI) | Subtotals only | |
| 29.1 by short term ‐ overall life satisfaction (QOLI, high = better) | 1 | 203 | Mean Difference (IV, Random, 95% CI) | ‐0.02 [‐0.43, 0.39] |
| 29.2 by medium term ‐ overall life satisfaction (QOLI, high = better) | 1 | 203 | Mean Difference (IV, Random, 95% CI) | ‐0.04 [‐0.43, 0.35] |
| 29.3 by long term (LQoLP, high = better) | 1 | 526 | Mean Difference (IV, Random, 95% CI) | 0.03 [‐0.10, 0.16] |
| 29.4 by long term (MANSA, range 1‐7, high = better) | 1 | 166 | Mean Difference (IV, Random, 95% CI) | 0.10 [‐0.19, 0.39] |
| 29.5 by long term ‐ overall life satisfaction (QOLI, high = better) | 1 | 203 | Mean Difference (IV, Random, 95% CI) | 0.10 [‐0.25, 0.45] |
| 30 Participant satisfaction/need: 1. Average endpoint scores (various scale) ‐ by long term | 1 | Mean Difference (IV, Random, 95% CI) | Subtotals only | |
| 30.1 Patient need: CAN (high = poor) | 1 | 585 | Mean Difference (IV, Random, 95% CI) | ‐0.29 [‐0.69, 0.11] |
| 30.2 Patient Satisfaction with Health Services (high = poor) | 1 | 490 | Mean Difference (IV, Random, 95% CI) | ‐0.40 [‐1.25, 0.45] |
| 31 Participants need: 1. Average endpoint scores (various scales, skewed data) | Other data | No numeric data | ||
| 31.1 by medium term (CAN, high = poor) | Other data | No numeric data | ||
| 31.2 by long term (CAN, high = poor) | Other data | No numeric data | ||
| 31.3 by long term (CANSAS, high = poor) | Other data | No numeric data | ||
| 32 Participant satisfaction: 1. Average endpoint scores (CSQ‐modified, high = better, skewed data) ‐ by long term | Other data | No numeric data | ||
| 33 Costs: 1. Direct costs of psychiatric hospital care (skewed data) | Other data | No numeric data | ||
| 33.3 by medium term | Other data | No numeric data | ||
| 33.4 by long term | Other data | No numeric data | ||
| 34 Costs: 2a. Direct costs of all care ‐ by long term (2 years). Unit cost GBP, fiscal year 1997/98 | 1 | Mean Difference (IV, Random, 95% CI) | Subtotals only | |
| 35 Costs: 2b. Direct costs of all care ‐ by medium term (skewed data) | Other data | No numeric data | ||
| 36 Costs: 3. Total costs of care per patient ‐ Unit cost GBP | 2 | Mean Difference (IV, Fixed, 95% CI) | Subtotals only | |
| 36.1 by 24 months, fiscal year 1997/98 | 1 | 667 | Mean Difference (IV, Fixed, 95% CI) | 1849.0 [‐1598.23, 5296.23] |
| 36.2 by 18 months, fiscal year 2003/2004 ( GBP 1 = USD 1.58) | 1 | 243 | Mean Difference (IV, Fixed, 95% CI) | 4031.00 [‐2724.13, 10786.13] |
2.6. Analysis.
Comparison 2 Intensive Case Management versus non‐Intensive Case Management, Outcome 6 Service use: 3c. Average number of admissions (skewed data) ‐ by medium term.
| Service use: 3c. Average number of admissions (skewed data) ‐ by medium term | ||||
|---|---|---|---|---|
| Study | Intervention | Mean | SD | Total |
| Johnston‐Australia 1998 | 1. ICM | 1.6 | 2 | 35 |
| Johnston‐Australia 1998 | 2. non‐ICM | 1.9 | 2.4 | 33 |
2.22. Analysis.
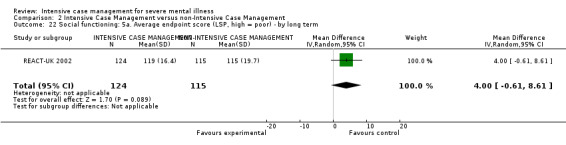
Comparison 2 Intensive Case Management versus non‐Intensive Case Management, Outcome 22 Social functioning: 5a. Average endpoint score (LSP, high = poor) ‐ by long term.
2.25. Analysis.
Comparison 2 Intensive Case Management versus non‐Intensive Case Management, Outcome 25 Mental state: 1b. General symptoms ‐ average endpoint scores (various scales, skewed data).
| Mental state: 1b. General symptoms ‐ average endpoint scores (various scales, skewed data) | ||||
|---|---|---|---|---|
| Study | Intervention | Mean | SD | Total |
| by medium term (Krawiecka Scale, high = poor) | ||||
| Harrison‐Read‐UK 2000 | 1. ICM | 8.8 | 5.6 | 57 |
| Harrison‐Read‐UK 2000 | 2. non‐ICM | 8 | 4.5 | 65 |
| by long term (Krawiecka Scale, high = poor) | ||||
| Harrison‐Read‐UK 2000 | 1. ICM | 9.2 | 5.5 | 47 |
| Harrison‐Read‐UK 2000 | 2. non‐ICM | 7.9 | 4.5 | 57 |
| by long term (BPRS 24‐items, high = good) | ||||
| REACT‐UK 2002 | 1. ICM | 32.9 | 9 | 91 |
| REACT‐UK 2002 | 2. non‐ICM | 33.5 | 8.6 | 75 |
2.26. Analysis.
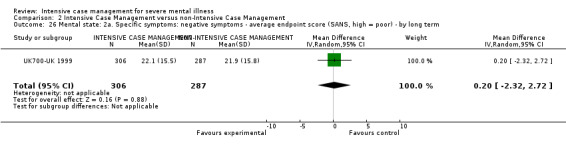
Comparison 2 Intensive Case Management versus non‐Intensive Case Management, Outcome 26 Mental state: 2a. Specific symptoms: negative symptoms ‐ average endpoint score (SANS, high = poor) ‐ by long term.
2.34. Analysis.
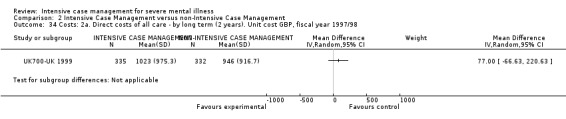
Comparison 2 Intensive Case Management versus non‐Intensive Case Management, Outcome 34 Costs: 2a. Direct costs of all care ‐ by long term (2 years). Unit cost GBP, fiscal year 1997/98.
Characteristics of studies
Characteristics of included studies [ordered by study ID]
Aberg‐Wistedt‐Sweden 1995.
| Methods | Allocation: randomised. Design: single centre. Duration: 24 months. Country: Stockholm, Sweden. | |
| Participants | Diagnosis: schizophrenic disorder (DSM‐III‐R). N = 40. Setting: community setting. Age: 25 to 55 years, mean ˜ 38 years. Sex: 65% M (26M, 14F). Ethnicity: not reported. History: recently admitted to ward or currently in outpatient department. | |
| Interventions | 1. ICM: interdisciplinary‐team based. Caseload: 1:2.5. N = 20. 2. Standard care: multidisciplinary psychiatric outpatient team, specialised in people with schizophrenia. Caseload: ˜ 1:10/15. N = 20. | |
| Outcomes | Global state: leaving the study early. Unable to use ‐ Service use: average number of days in hospital per month and number of emergency visits (no mean, no SD). Quality of life: (no mean, no SD). Social network size: (measure validated on children only, no mean, no SD). Burden of care: (no mean, no SD). |
|
| Notes | ||
| Risk of bias | ||
| Bias | Authors' judgement | Support for judgement |
| Random sequence generation (selection bias) | Unclear risk | Randomised. No further details. |
| Allocation concealment (selection bias) | Unclear risk | No details |
| Blinding (performance bias and detection bias) All outcomes | Unclear risk | Primary outcome: not available. Secondary outcomes: clinician/participant mediated ‐ rating ‐ Unclear. |
| Blinding of participants and personnel (performance bias) All outcomes | High risk | Problematic to blind participants and those providing the intervention in studies comparing ICM intervention with standard care. |
| Blinding of outcome assessment (detection bias) All outcomes | Unclear risk | Service utilisation (emergency and inpatient services): data collected from patient records. Blinding not reported. Participant's quality of life, size of social networks, and their relatives' burden of care self reported. |
| Incomplete outcome data (attrition bias) All outcomes | Unclear risk | The study did not address this outcome. |
| Selective reporting (reporting bias) | High risk | Most outcomes of interest are reported incompletely. |
| Other bias | Low risk | No details. No evidence of the presence of other bias. |
Audini‐UK 1994.
| Methods | Allocation: randomised. Design: single centre. Duration: 15 months. Country: London, UK. | |
| Participants | Diagnosis: serious mental illness (30% schizophrenia according DSM‐III‐R). N = 66. Setting: psychiatric community services. Age: 18 to 64 years, median ˜ 37 years. Sex: 45% M (30M, 36F). Ethnicity: 26% Afro‐Caribbean. History: mean ˜ 0.2 admissions in last year; completed at least 18 months in ACT programme*. Excluded: primary addiction, primary organic brain damage. | |
| Interventions | 1. ICM: ACT (Stein and Test model). Caseload: 1:12. N = 33**. 2. Standard care: routine care from psychiatric services, as outpatients or inpatients, or both as necessary, with community support services. N = 33. |
|
| Outcomes | Service use: average number of days in hospital per month***. Admitted to hospital. Average number hospital admissions***. Death: suicide. Global state: leaving the study early. GAF. Social functioning: SAS, employment status. Mental state: BPRS 24‐item, PSE. Participant satisfaction: CSQ. Costs: costs of all care. Unable to use ‐ Carer satisfaction: Relative's Satisfaction (scale not peer reviewed, attrition > 50%). |
|
| Notes | Loss to follow‐up: 12.1% *Participants in this study were recruited from the treatment arm of a trial on ACT 20 to 30 months long. **Authors report that "the team became depleted and demoralised" in the course of this trial. ***Variance not reported ‐ data from another study used. | |
| Risk of bias | ||
| Bias | Authors' judgement | Support for judgement |
| Random sequence generation (selection bias) | Unclear risk | Randomised. No further details. |
| Allocation concealment (selection bias) | Unclear risk | No details |
| Blinding (performance bias and detection bias) All outcomes | Unclear risk | Primary outcome: clinician/participant mediated ‐ rating ‐ Unclear. Secondary outcomes: interviewer rated ‐ rating ‐ Unclear. No details provided. |
| Blinding of participants and personnel (performance bias) All outcomes | High risk | Problematic to blind participants and those providing the intervention in studies comparing ICM intervention with standard care. |
| Blinding of outcome assessment (detection bias) All outcomes | Unclear risk | Clinical (mental state) and social function assessed by independent raters. Blinding not tested. Participant's and relative's satisfaction self reported. |
| Incomplete outcome data (attrition bias) All outcomes | Low risk | Number and reasons for attrition reported. Missing outcome data balanced in numbers across intervention groups, with similar reasons for missing data across groups. |
| Selective reporting (reporting bias) | Low risk | All listed outcomes are reported completely. |
| Other bias | Low risk | No details. No evidence of the presence of other bias. |
Bjorkman‐Sweden 2002.
| Methods | Allocation: randomised. Design: single centre. Duration: 36 months. Country: Lund, Sweden. | |
| Participants | Diagnosis*: serious mental illness, according to DSM‐III‐R. N = 77. Setting: community psychiatric service. Age*: 19 to 55 years, mean ˜ 37 years. Sex: 36M, 41F. Ethnicity: not reported. History: i. serious mental illness for > 2 yrs, ii. impairment due to illness (social‐relationship, housing, or work situation) for more than 2 yrs, iii. no primary diagnosis of substance‐ or alcohol‐related disorders, iv. informed consent given. | |
| Interventions | 1. ICM: Case Management service based on the Strength Model. Caseload: ˜ 1:9. N = 33. 2. Standard care: comprehensive psychiatric service with joint management for outpatient, inpatient, and day care facilities. N = 44. |
|
| Outcomes | Service use: average number of days in hospital per month, not remaining in contact with psychiatric services, admitted to hospital.
Death: suicide.
Global state: leaving the study early, GAF.
Social functioning: Strauss‐Carpenter Scale, social network (ISSI).
Mental state: general symptoms, SCL‐90.
Quality of life: LQoLP.
Participant satisfaction: CAN. Unable to use ‐ Client satisfaction: questionnaire by the Swedish Institute for Health Services Development (modified version, not peer reviewed). |
|
| Notes | *51.9% schizophrenia‐like disorder. **ICM group significantly older than standard care group (5 yrs older on average). | |
| Risk of bias | ||
| Bias | Authors' judgement | Support for judgement |
| Random sequence generation (selection bias) | Low risk | Randomised: used a computer random number generator. |
| Allocation concealment (selection bias) | Unclear risk | Random selection performed by one of the trialist. No further details. |
| Blinding (performance bias and detection bias) All outcomes | Unclear risk | Primary outcomes: clinician/participant mediated ‐ rating ‐ Unclear. Secondary outcomes: interviewer rated ‐ rating ‐ Unclear. Interviewers formally blind to participant group allocation. Not tested. |
| Blinding of participants and personnel (performance bias) All outcomes | High risk | Problematic to blind participants and those providing the intervention in studies comparing ICM intervention with standard care. |
| Blinding of outcome assessment (detection bias) All outcomes | Unclear risk | Clinical (mental state) and social function assessed by independent raters. Blinding not tested. Service utilisation. Blinding not reported. Participant's and relative's satisfaction self reported, not blinded. |
| Incomplete outcome data (attrition bias) All outcomes | Unclear risk | Analysis performed on an ITT basis, but "clients who were not available for or refused contact at follow‐up were excluded from the respective analysis on an individual basis". |
| Selective reporting (reporting bias) | Low risk | All listed outcomes of interest reported. |
| Other bias | Low risk | No details. No evidence of the presence of other bias. |
Bond‐Chicago1 1990.
| Methods | Allocation: randomised. Design: single centre. Duration: 12 months. Country: Chicago, Illinois, USA. | |
| Participants | Diagnosis*: serious mental illness (schizophrenia, schizoaffective disorder, affective disorder, personality disorder) according to RDC and SADS. N = 88. Setting: private psychiatric rehabilitation agency. Age: > 18 years, mean ˜ 34 years. Sex: 56.8% M (50M, 38F). Ethnicity: non‐white 36%. History**: i. 3 admissions in the last 2 years or total of 5 admissions in life, ii. had no prior contact of more than 1 month's duration with either study programme, iii. informed consent given. | |
| Interventions | 1. ICM***: a large‐city adaptation of ACT model according to Stein and Test. Caseload 1:10. N = 45. 2. Standard care***: provided from drop‐in centre (day treatment, central meeting place, no requirement for frequent contacts). Caseload: 1:≧20. N = 43. | |
| Outcomes | Service use: average number of days in hospital per month, not remaining in contact with psychiatric services, admitted to hospital, average number of admissions.
Death: all causes, suicide.
Global state: leaving the study early.
Social functioning: police contact, arrested, imprisoned, accomodation status. Unable to use ‐ Global functioning: GAS (no SD, no sample size providing data). Social functioning: Areas of Difficulty Checklist (ADC) (scale not peer reviewed, no SD). Quality of life: Life Satisfaction Checklist (LSC) (scale not peer reviewed, no SD). Satisfaction with care: Satisfaction with Services (SWS), author‐modified version of CSQ (not peer reviewed, no SD). Cost: no SD, no sample size. |
|
| Notes | *Schizophrenia ˜ 37%; primary or secondary diagnosis of substance abuse = 26% . **At the time of study admission, 62% in ICM group and 54% in SC group were in a psychiatric hospital. ***Author reporting: "ACT had been in existence for 6 yrs, SC service for 2 yrs. In both programmes staff were enthusiastically committed to the respective programme philosophy". | |
| Risk of bias | ||
| Bias | Authors' judgement | Support for judgement |
| Random sequence generation (selection bias) | Unclear risk | Randomised. No further details. |
| Allocation concealment (selection bias) | Unclear risk | Random assignment achieved by individual sealed envelopes (not specified if opaque), the assignment was carried out by a person unconnected to research programme. |
| Blinding (performance bias and detection bias) All outcomes | Unclear risk | Primary outcome: clinician/participant mediated ‐ rating ‐ Unclear. Secondary outcomes: most are clinician/participant mediated ‐ rating ‐ Unclear. |
| Blinding of participants and personnel (performance bias) All outcomes | High risk | Problematic to blind participants and those providing the intervention in studies comparing ICM intervention with standard care. |
| Blinding of outcome assessment (detection bias) All outcomes | High risk | Interviewer was not blind to treatment condition. |
| Incomplete outcome data (attrition bias) All outcomes | High risk | Missing outcome data not balanced in numbers across intervention groups, but similar reasons for missing data across groups. |
| Selective reporting (reporting bias) | High risk | Some outcomes of interest are reported incompletely and are not usable (due to missing SD or sample size providing data). |
| Other bias | Low risk | Publicly funded (by the State Department of Mental Health). No further details. No evidence of the presence of other bias. |
Bond‐Indiana1 (A).
| Methods | Methods: see above Bond‐Indiana1 1988. | |
| Participants | Participants: see above Bond‐Indiana1 1988. N = 61. |
|
| Interventions | Interventions: see above Bond‐Indiana1 1988. 1. ICM: N = 29. 2. Standard care: N = 32. |
|
| Outcomes | Service use: average number of days in hospital per month*.
Death: suicide.
Social functioning: contact with the police. Unable to use ‐ Costs: total inpatient cost, total treatment cost (no SD). |
|
| Notes | *Variance not reported ‐ data from another study used. | |
Bond‐Indiana1 (B).
| Methods | Methods: see above Bond‐Indiana1 1988. | |
| Participants | Participants: see above Bond‐Indiana1 1988. N = 64. |
|
| Interventions | Interventions: see above Bond‐Indiana1 1988. 1. ICM: N = 34. 2. Standard care: N = 30. |
|
| Outcomes | Service use: average number of days in hospital per month*. | |
| Notes | *Variance not reported ‐ data from another study used. | |
Bond‐Indiana1 (C).
| Methods | Methods: see above Bond‐Indiana1 1988. | |
| Participants | Participants: see above Bond‐Indiana1 1988. N = 42. |
|
| Interventions | Interventions: see above Bond‐Indiana1 1988. 1. ICM: N = 21. 2. Standard care: N = 21. |
|
| Outcomes | Service use: average number of days in hospital per month*. | |
| Notes | *Variance not reported ‐ data from another study used. | |
Bond‐Indiana1 1988.
| Methods | Allocation: randomised. Design: multicentre, 3 centres (3 CMHCs)*. Duration: 6 months. Country: Indiana, USA. | |
| Participants | Diagnosis**: psychotic disorder (DSM‐III). N = 67. Setting: CMHCs. Age: > 17 years, mean ˜ 35 years. Sex: 61.6% M (103M, 64F). Ethnicity: black (understood to be African‐American) 34%. History***: high risk of hospitalisation, described as: i. discharged within last year and either rehospitalised ≧ 3 times in previous 2 years or determined by mental health services staff to be at high risk for readmission, ii. committed or awaiting commitment to hospitals, iii. presenting for admission at CMHC inpatient unit and having ≧ 4 psychiatric hospitalisations in last 2 years. | |
| Interventions | 1. ICM: Assertive Case Management, according to the ACT model (Stein and Test), in addition to all other available mental health programmes. Caseload: 1:8‐12. N = 84. 2. Standard care: as provided at CMHCs (including case management services with large caseload). N = 83. | |
| Outcomes | Service use: average number of days in hospital per month****, (data available for single centre, see below); admitted to hospital.
Death: all causes (data from centre A only).
Global state: leaving the study early.
Social functioning: contact with the police (data from centre A only). Unable to use ‐ Quality of life: self report instrument (no data, scale not peer reviewed, compiled by the therapist). Global state: compliance with medication (data not reported). Costs: available only for centre A (no SD). |
|
| Notes | *Among client groups at the 3 centres, significant differences were found in: age, gender, race, education, employment, diagnosis, and history at baseline. **Schizophrenia‐like disorder: 61%; substance abuse: 39%. ***Average 8.8 lifetime hospitalisation and 1.5 hospitalisation in the previous year. ****Variance not reported ‐ data from another study used. | |
| Risk of bias | ||
| Bias | Authors' judgement | Support for judgement |
| Random sequence generation (selection bias) | Unclear risk | Randomised for single centre. No further details. |
| Allocation concealment (selection bias) | Unclear risk | No details. |
| Blinding (performance bias and detection bias) All outcomes | Unclear risk | Primary outcome: clinician/participant mediated ‐ rating ‐ Unclear. Secondary outcomes: most are clinician/participant mediated ‐ rating ‐ Unclear. |
| Blinding of participants and personnel (performance bias) All outcomes | Unclear risk | No details |
| Blinding of outcome assessment (detection bias) All outcomes | Unclear risk | No details |
| Incomplete outcome data (attrition bias) All outcomes | Unclear risk | Number of lost to follow‐up reported, but no reasons for missing data provided. |
| Selective reporting (reporting bias) | High risk | Prespecified outcomes not reported (medication compliance) or reported incompletely (days in hospital: SD missing). |
| Other bias | Low risk | No details. No evidence of the presence of other bias. |
Bush‐Georgia 1990.
| Methods | Allocation: randomised. Design: single site. Duration: 12 months. Country: Atlanta, USA. | |
| Participants | Diagnosis*: severe mental illness. N = 28. Age: 25 to 56 years. Sex: 57% M (16M, 12F). Ethnicity: 50% African‐American. History: high rates of hospital readmissions (2 to 18 previous admissions), difficulty in community living. | |
| Interventions | 1. ICM: clinical case management, providing intensive support and outreach (according to the Stein and Test model TCL). N = 14. 2. non‐ICM: standard care providing case management at a lower level of intensity and rehabilitation services. N = 14. | |
| Outcomes | Service use: average number of days in hospital per month**.
Death: all causes, suicide. Unable to use ‐ Service use: number of hospital admissions (no individual group data); emergency room visits (no individual group data). Global state: compliance: adherence to service and medication plan (incompletely reported data). Social functioning: appropriate living status (incompletely reported data). Costs: no individual group data. |
|
| Notes | *86% schizophrenia. **Variance not reported ‐ data from another study used. | |
| Risk of bias | ||
| Bias | Authors' judgement | Support for judgement |
| Random sequence generation (selection bias) | Unclear risk | Randomised. No further details. |
| Allocation concealment (selection bias) | Unclear risk | No details |
| Blinding (performance bias and detection bias) All outcomes | Unclear risk | Primary outcome: clinician/participant mediated ‐ rating ‐ Unclear. Secondary outcome: leaving the study early ‐ clinician/participant mediated ‐ rating ‐ Unclear. |
| Blinding of participants and personnel (performance bias) All outcomes | High risk | Problematic to blind participants and those providing the intervention in studies comparing ICM intervention with standard care. |
| Blinding of outcome assessment (detection bias) All outcomes | Unclear risk | Service use and appropriate living conditions collected from records. Blinding not reported. |
| Incomplete outcome data (attrition bias) All outcomes | Low risk | No missing outcome data. |
| Selective reporting (reporting bias) | High risk | Outcomes not pre‐stated. Most of the reported outcomes are reported incompletely (data not usable). |
| Other bias | Low risk | No details. No evidence of the presence of other bias. |
Chan‐Hong Kong 2000.
| Methods | Allocation: randomised. Design: single site. Duration: 11 months (5‐month intervention period, 6‐month follow‐up). Country: Hong Kong. | |
| Participants | Diagnosis: chronic schizophrenia.
N = 62. Setting: recruited from a community mental hospital. Age: 21 to 65 years. Sex: 71% female. Ethnicity: not reported. History: suffered from schizophrenia for 2 or more years; had 3 or more hospitalisations in the past 24 months before admission; required supervision in living skills; unemployed for 3 or more months; and unreliable in compliance to treatment. |
|
| Interventions | 1. ICM: based on the developed case management model, with a community psychiatric nurse case manager co‐ordinating care. Caseload 1:3. N = 31. 2. Standard care: traditional community psychiatric nursing care. Caseload 1:3. N = 31. | |
| Outcomes | All of the usable outcomes are provided at the 6 months' follow‐up. Service use: unplanned admission through the Accident and Emergency Department; day hospital care; outpatient visits; home visits. Costs: direct healthcare costs. Unable to use ‐ SD or equivalent not reported: BPRS; Specific Level of Functioning scale (SLOF); Patient Satisfaction Instrument (PSI). Average number of days in hospital per month: it may have been possible to calculate this outcome (imputing SD), but we decided not to use it as the study reports data only on "unplanned admission", therefore the available data misses data on overall admission (planned and unplanned). |
|
| Notes | ||
| Risk of bias | ||
| Bias | Authors' judgement | Support for judgement |
| Random sequence generation (selection bias) | Unclear risk | "Patients who met the inclusion criteria and provided consent were randomised to case management or conventional care after recruitment"; no further details were provided. |
| Allocation concealment (selection bias) | Unclear risk | No details on allocation concealment were reported. |
| Blinding (performance bias and detection bias) All outcomes | Unclear risk | No details reported. |
| Blinding of participants and personnel (performance bias) All outcomes | Unclear risk | Details on blinding participants and personnel were not reported. |
| Blinding of outcome assessment (detection bias) All outcomes | Unclear risk | Details on blinding outcome assessors were not reported. |
| Incomplete outcome data (attrition bias) All outcomes | Unclear risk | Analyses were reported as ITT; it was not reported whether any participants left early. |
| Selective reporting (reporting bias) | High risk | For many of the outcome scales, only items that had a significant difference between experimental and control groups were reported. |
| Other bias | Low risk | The study seems to be free of other bias. The study reports that baseline characteristics were similar, although only age and gender were reported. |
Chandler‐California1 (A).
| Methods | Site A: Long Beach. Methods: see above Chandler‐California1 1991. |
|
| Participants | Participants: see above Chandler‐California1 1991. N = 256. |
|
| Interventions | Interventions: see above Chandler‐California1 1991. ICM = 127. SC = 129. |
|
| Outcomes | Service use: average number of days per month in hospital, not remaining in contact with psychiatric services, admitted to hospital. Global state: leaving the study early. Social functioning: employment status, arrested, imprisoned, accomodation status. Costs: direct costs of psychiatric hospital care. | |
| Notes | ||
Chandler‐California1 (B).
| Methods | Site B: Stanislaus County. Methods: see above Chandler‐California1 1991. |
|
| Participants | Participants: see above Chandler‐California1 1991. N = 260. |
|
| Interventions | Interventions: see above Chandler‐California1 1991. ICM = 125. SC = 135. |
|
| Outcomes | Service use: average number of days per month in hospital, not remaining in contact with psychiatric services, admitted to hospital. Global state: leaving the study early. Social functioning: employment, arrested, imprisoned, accomodation status. Costs: direct costs of psychiatric hospital care. | |
| Notes | ||
Chandler‐California1 1991.
| Methods | Allocation: randomised. Design: multicentre, 2 sites*** (site A: Long Beach, urban site; site B: Stanislaus County, rural site). Duration: 36 months. Country: California, USA. | |
| Participants | Diagnosis: serious and persistent mental illness (DSM‐III‐R).* N = 516. Setting: 1 urban, 1 rural but integrated service agencies. Age: 30% > 45 years. Sex: 52% M. Ethnicity: 26% non‐white. History**: i. functional impairment due to mental disorder, ii. eligibility for public assistance, iii. not a primary diagnosis of substance abuse, iv. informed consent given. | |
| Interventions | 1. ICM***: ACT provided by integrated service agencies, according to Training in Community Living Programme (Stein and Test). Caseload: 1:10. N = 252. 2. Standard care: usual mental health service (i.e. outpatients: day treatment, case management; inpatients: minimal rehabilitation services). N = 264. | |
| Outcomes | Service use: average number of days in hospital per month Following outcomes available for single centre. Service use: not remaining in contact with psychiatric services, admitted to hospital. Global state: leaving the study early. Social functioning: employment, arrested, imprisoned, accomodation status. Costs: cost of psychiatric hospital care. Unable to use ‐ Mental state: general symptoms: Colorado Symptom Index (no data reported). Self esteem: New York Self Esteem Scale (no data reported). Quality of life: Lehman's Quality of Life Instrument (no data reported). Social functioning: level of social activities (scale not peer reviewed). Family burden: subscales adapted from Tessler's Family Burden Interview (not peer reviewed, attrition > 50%). Participant satisfaction: scale for overall satisfaction with mental health services (scale not peer reviewed). Costs: direct costs of health care and of all care (no SD), all mental health care (not listed as review outcome of interest). |
|
| Notes | *61% schizophrenia **28% admitted in previous year ***Intervention programme in 2 sites slightly different: Site A puts more emphasis on employment services and social and therapeutic activities. Site B emphasises avoiding hospitalisation through use of crisis house. | |
| Risk of bias | ||
| Bias | Authors' judgement | Support for judgement |
| Random sequence generation (selection bias) | Unclear risk | Randomised for single centre. No further details. |
| Allocation concealment (selection bias) | Unclear risk | No details |
| Blinding (performance bias and detection bias) All outcomes | Unclear risk | Primary outcome: clinician/participant mediated ‐ rating ‐ Unclear. Secondary outcomes: clinician/participant mediated ‐ rating ‐ Unclear. |
| Blinding of participants and personnel (performance bias) All outcomes | High risk | Problematic to blind participants and those providing the intervention in studies comparing ICM intervention with standard care. |
| Blinding of outcome assessment (detection bias) All outcomes | Unclear risk | Employment, arrest, conviction, homelessness, and service use (hospitalisation) were compiled from state and local databases. Blinding not reported. For mental state (symptomology), independent research staff conducted interviews. Blinding not reported. Quality of life and personal safety self reported. Not blinded. |
| Incomplete outcome data (attrition bias) All outcomes | Unclear risk | Number of lost to follow‐up reported, but reasons for missing data not provided. LOCF for continuous data. |
| Selective reporting (reporting bias) | High risk | Listed outcomes of interest not reported (continuous data from scales not reported; days in hospital reported only for site A, no SD). |
| Other bias | Low risk | Publicly funded (California Department of Mental Health, NIMH). No details. No evidence of the presence of other bias. |
Curtis‐New York 1992.
| Methods | Allocation: randomised. Design: single centre. Duration: 14 months. Country: New York, USA. Follow‐up*: range of 18 to 52 months. | |
| Participants | Diagnosis**: not stated, DSM‐III. N = 292. Setting: Harlem Hospital Center (HHC). Age: age 18 to 54 years, mean ± SD 35.9 ± 12.1 yrs (N = 430). Sex: 59% F. Ethnicity: 91% black (understood to be African‐American). History***: i. about to be discharged from hospital, ii. local residents, iii. without a sole diagnosis of substance abuse or organic mental disorder, iv. inpatients for > 7 days, and not eligible for the "Community Support System" programme ‐ that is no psychiatric admission of > 6 months duration/3 admissions of > 10 days within the last 2 years, v. informed consent given. | |
| Interventions | 1. ICM: intensive outreach case management from a multidisciplinary team at HHC, which implemented a discharge treatment plan and monitored clinical and social problems. The team did not "assume direct responsibility for care but [...] help[ed] the patient enrol in a day hospital programme, adult mental health clinic, rehabilitation programme, or alcohol treatment programme". Caseload: 1:17. N = 147. 2. Standard care: routine aftercare, within the discharge treatment plan prescribed for each patient by HHC; "most received at least initial treatment form various divisions of the departments of psychiatry within the Health and Hospitals Corporation". N = 145. |
|
| Outcomes | Service use: average number of days in hospital per month, admitted to hospital.
Death: all causes and suicide. Unable to use ‐ Use of ambulatory services: this outcome is not listed as an outcome of interest for the review. Quality of life: measuring instrument written by trialists for this particular trial and was not published in peer‐reviewed journal (EAF ‐ Evaluation Aftercare Form). |
|
| Notes | *Follow‐up period variable, depending on date of participant's entry into the study.
**Schizophrenia 38%; alcohol or drug abuse or dependence 39%.
***Mean number of previous admissions > 1. Some more severely ill clients not included in this part of study as they were eligible for "Community Support System" programme group. |
|
| Risk of bias | ||
| Bias | Authors' judgement | Support for judgement |
| Random sequence generation (selection bias) | Unclear risk | Randomised. No further details. |
| Allocation concealment (selection bias) | Unclear risk | No details. |
| Blinding (performance bias and detection bias) All outcomes | Unclear risk | Primary outcome: clinician/participant mediated ‐ rating ‐ Unclear. Secondary outcomes: some are clinician/participant mediated ‐ rating ‐ Unclear. |
| Blinding of participants and personnel (performance bias) All outcomes | High risk | Problematic to blind participants and those providing the intervention in studies comparing ICM intervention with standard care. |
| Blinding of outcome assessment (detection bias) All outcomes | Unclear risk | Service use (rehospitalisations, hospital‐based ambulatory services) and mortality derived from the shared medical billings systems. Blinding not reported. |
| Incomplete outcome data (attrition bias) All outcomes | Unclear risk | Missing data are not addressed. |
| Selective reporting (reporting bias) | Low risk | Listed outcomes are reported completely. |
| Other bias | Low risk | Funded by public institution (New York City Health and Hospitals Corporation and foundations). No details. No evidence of the presence of other bias. |
Cusack‐North Carolina.
| Methods | Allocation: randomised. Design: single site. Duration: 24 months. Country: USA. Duration: 2 years. | |
| Participants | Diagnosis: DSM‐IV axis I major mental disorder. N = 134. Setting: Harlem Hospital Center (HHC). Age: 37 (SD 10) years. Sex: 59% male. Ethnicity: 63% Caucasian (understood to be white participants). History: detained in county prison at enrolment and diagnosed with major mental disorder. Comorbid substance abuse (66%) or additional mental disorder diagnosis were not excluded. Candidates ever charged with a serious, violent offence, or "third strike" candidates were excluded. | |
| Interventions | 1. ICM: Forensic Assertive Community Treatment (FACT)*, with team‐based mental health and substance abuse services, as well as support for housing, employment assistance, benefits applications, advocacy, and a full‐time peer recovery specialist and a full‐time probation officer. Caseload: < 20. N = 72. 2. Standard care: treatment as usual (TAU): services routinely available in the county‐operated public behavioural health system, such as psychiatric assessment, psychiatric medications in both outpatient and inpatient general hospital settings, outpatient mental health and substance abuse counselling, and case management. N = 62. |
|
| Outcomes | Service use: mean number of outpatient visits. Social functioning: contact with legal system (bookings, jail days, convictions). Costs: direct costs of psychiatric hospital care; direct costs for outpatient care, jail. Not used ‐ Service use: mean number of hospital days (could not be converted to average number of days per month), crisis contacts. |
|
| Notes | *With high fidelity to the ACT model, DACTS scores 4.5 and 4.6. | |
| Risk of bias | ||
| Bias | Authors' judgement | Support for judgement |
| Random sequence generation (selection bias) | Low risk | Randomisation using a random number table, assignment in blocks of 2. |
| Allocation concealment (selection bias) | Unclear risk | Allocation concealment details were not reported. |
| Blinding (performance bias and detection bias) All outcomes | Unclear risk | No details |
| Blinding of participants and personnel (performance bias) All outcomes | Unclear risk | No details on blinding participants and personnel were reported. |
| Blinding of outcome assessment (detection bias) All outcomes | Low risk | Results relied on external administrative data. |
| Incomplete outcome data (attrition bias) All outcomes | Low risk | All analyses were ITT; outcomes were observed regardless of active or continued participation. |
| Selective reporting (reporting bias) | Low risk | Listed outcomes are reported completely. |
| Other bias | Low risk | No indication of other bias; baseline characteristics similar between groups, except, on average, participants in the FACT group were nearly 4.5 years older than participants in the TAU condition. However, after adjusting for age, the results were essentially the same. |
Drake‐NHamp (A).
| Methods | Methods: see above Drake‐NHamp 1998. | |
| Participants | Participants: see above Drake‐NHamp 1998. For this centre, sample providing data: N = 23. | |
| Interventions | Interventions: see above Drake‐NHamp 1998. For this centre, sample providing data: 1. ICM: N = 11. 2. Standard care: N = 12. | |
| Outcomes | Service use: average number of days in hospital per month. | |
| Notes | ||
Drake‐NHamp (B).
| Methods | Methods: see above Drake‐NHamp 1998. | |
| Participants | Participants: see above Drake‐NHamp 1998. For this centre, sample providing data: N = 23. | |
| Interventions | Interventions: see above Drake‐NHamp 1998. For this centre, sample providing data: 1. ICM: N = 10. 2. Standard care: N = 13. | |
| Outcomes | Service use: average number of days in hospital per month. | |
| Notes | ||
Drake‐NHamp (C).
| Methods | Methods: see above Drake‐NHamp 1998. | |
| Participants | Participants: see above Drake‐NHamp 1998. For this centre, sample providing data: N = 25. | |
| Interventions | Interventions: see above Drake‐NHamp 1998. For this centre, sample providing data: 1. ICM: N = 14. 2. Standard care: N = 11. | |
| Outcomes | Service use: average number of days in hospital per month. | |
| Notes | ||
Drake‐NHamp (D).
| Methods | Methods: see above Drake‐NHamp 1998. | |
| Participants | Participants: see above Drake‐NHamp 1998. For this centre, sample providing data: N = 60. | |
| Interventions | Interventions: see above Drake‐NHamp 1998. For this centre, sample providing data: 1. ICM: N = 30. 2. Standard care: N = 30. | |
| Outcomes | Service use: average number of days in hospital per month. | |
| Notes | ||
Drake‐NHamp (E).
| Methods | Methods: see above Drake‐NHamp 1998. | |
| Participants | Participants: see above Drake‐NHamp 1998. For this centre, sample providing data: N = 32. | |
| Interventions | Interventions: see above Drake‐NHamp 1998. For this centre, sample providing data: 1. ICM: N = 17. 2. Standard care: N = 15. | |
| Outcomes | Service use: average days per month in hospital. | |
| Notes | ||
Drake‐NHamp (F).
| Methods | Methods: see above Drake‐NHamp 1998. | |
| Participants | Participants: see above Drake‐NHamp 1998. For this centre, sample providing data: N = 17. | |
| Interventions | Interventions: see above Drake‐NHamp 1998. For this centre, sample providing data: 1. ICM: N = 9. 2. Standard care: N = 8. | |
| Outcomes | Service use: average number of days in hospital per month. | |
| Notes | ||
Drake‐NHamp (G).
| Methods | Methods: see above Drake‐NHamp 1998. | |
| Participants | Participants: see above Drake‐NHamp 1998. For this centre, sample providing data: N = 16. | |
| Interventions | Interventions: see above Drake‐NHamp 1998. For this centre, sample providing data: 1. ICM: N = 7. 2. Standard care: N = 9. | |
| Outcomes | Service use: average number of days in hospital per month. | |
| Notes | ||
Drake‐NHamp 1998.
| Methods | Allocation: randomised. Design: multicentre (7 sites(CHMCs), 2 in urban areaand 5 in rural area). Duration: 36 months. Country: New Hampshire, USA. | |
| Participants | Diagnosis: schizophrenia, schizoaffective or bipolar disorder (DSM‐III‐R) and active substance user disorder within past 6 months (DSM‐III‐R)*. N = 225. Setting: CHMCs. Age: 18 to 60 years, mean ˜ 34 years. Sex: 74.4% M (167M, 58F). Ethnicity: ethnic minority 3.4%. History: i. no mental retardation or medical conditions that would prevent participation, ii. written informed consent given. | |
| Interventions | 1. ICM: ACT teams with special training in substance abuse treatment. Caseload: 1:12. N = 109. 2. Non‐ICM: standard non‐Intensive Case Management, incorporating most of the ACT principle, but providing less individual service for substance abuse. Caseload: 1:25. N = 114. | |
| Outcomes | Service use: average number of days in hospital per month, not remaining in contact with psychiatric services.
Death: all causes.
Global state: leaving the study early.
Mental state: BPRS‐24 item.
Social functioning: average days in stable accomodation, Alcohol Use Scale (AUS), Substance Abuse Treatment Scale (SATS), alcohol use days (TLFB), remission from alcohol use disorder.
Quality of life: QOLI. Unable to use ‐ Substance abuse: drug use scale (DUS), drug use days (TLFB) and not in remission: attrition > 50%, Addiction Severity Index (ASI) (data not reported). Service use: Service Utilization Interview (data not reported). Costs: direct costs of psychiatric hospital care (no SD), average total study cost (not listed as outcome of interest in the review). |
|
| Notes | *53% schizophrenia, 22% schizoaffective, 24% bipolar disorder, 72.6% alcohol abuse, 41.8% drug abuse. | |
| Risk of bias | ||
| Bias | Authors' judgement | Support for judgement |
| Random sequence generation (selection bias) | Unclear risk | Randomised. No further details. |
| Allocation concealment (selection bias) | Unclear risk | No details |
| Blinding (performance bias and detection bias) All outcomes | Unclear risk | Primary outcome: clinician/participant mediated ‐ rating ‐ Unclear. Secondary outcomes: some are clinician/participant mediated ‐ rating ‐ Unclear, some are interviewer rated ‐ rating ‐ Unclear. Interviewer blind, not tested. |
| Blinding of participants and personnel (performance bias) All outcomes | Unclear risk | Blinding not reported. |
| Blinding of outcome assessment (detection bias) All outcomes | Unclear risk | Independent raters, blind to study condition, separately rated alcohol and drug use as well as substance abuse treatment. Service use was obtained from outpatient records and hospital records, blinding not reported. Blinding not reported for mental state, quality of life, or homelessness. |
| Incomplete outcome data (attrition bias) All outcomes | Unclear risk | Number of lost to follow‐up is reported, but reasons for missing data are not reported for each randomised treatment group (reported overall, information not usable). |
| Selective reporting (reporting bias) | Low risk | Prespecified outcomes of interest are reported. |
| Other bias | Low risk | No information available. No evidence of the presence of other bias. |
Essock‐Connecticut1 1995.
| Methods | Allocation: randomised. Design*: multicentre, 3 sites, all in city area (data for single centre not available). Duration: 18 months. Country: Connecticut, USA. | |
| Participants | Diagnosis**: major depression, bipolar disorder, schizophrenia, schizoaffective disorder according to DSM‐III‐R. N = 262. Age: mean ˜ 41 years. Sex: 64% M. History***: high level of service use (defined as: i. ≧ 2 psychiatric hospitalisations in last 2 years, ii. 1 psychiatric hospitalisation longer than 180 days in last yr, or iii. ≧ 2 contacts with crisis services in last 2 years) and significant difficulties meeting the demands of everyday life (defined as: 1. homeless in past year, or ii. requiring extensive supervision or assistance at least weekly to meet personal‐care needs), informed consent given. | |
| Interventions | 1. ICM: Assertive Community Treatment teams (Stein and Test model), but having a richer staff and achieving 24‐hour coverage. Caseload: 1:5‐7. N = 130****. 2. Non‐ICM: generalist model, but providing mobile case managers. Caseload: 1:25‐30. N = 132****. | |
| Outcomes | Service use: average number of days in hospital per month.
Death: all causes.
Global state: leaving the study early. Unable to use ‐ Mental state: modified version of SCL‐90 (no peer‐reviewed scale, no SD). Social functioning: accomodation status, number of days homeless (no SD), imprisoned (not reported). Quality of life: modified version of QOLI (no peer‐reviewed scale, no SD). Carer satisfaction: Family Burden Interview (no SD). Costs: data reported incompletely. |
|
| Notes | *Authors state that the same treatments provided in different sites were not identical ("different styles of providing services were used at different sites"), but single‐centre data not available. **67% schizophrenia or schizoaffective disorder. ***62% participants had lifetime history of substance abuse or dependence and 25% participants were hospitalised at the study entry. | |
| Risk of bias | ||
| Bias | Authors' judgement | Support for judgement |
| Random sequence generation (selection bias) | Unclear risk | Randomised. Randomisation counterbalanced "so that within each site clients had 50% likelihood of being assigned to either ICM or non‐ICM and counterbalanced so that clients hospitalised at the time of assignment had 50% likelihood of being assigned to either ICM or non‐ICM." |
| Allocation concealment (selection bias) | Unclear risk | No details |
| Blinding (performance bias and detection bias) All outcomes | Unclear risk | Primary outcome: clinician/participant mediated ‐ rating ‐ Unclear. Secondary outcomes: leaving the study early ‐ clinician/participant mediated ‐ rating ‐ Unclear. |
| Blinding of participants and personnel (performance bias) All outcomes | Unclear risk | Blinding not reported. |
| Blinding of outcome assessment (detection bias) All outcomes | Unclear risk | Service use (hospitalisation), housing (homelessness, temporary housing): source of data and blinding not reported. |
| Incomplete outcome data (attrition bias) All outcomes | Low risk | Number and reasons for missing data clearly reported. Missing outcome data balanced across intervention groups. |
| Selective reporting (reporting bias) | High risk | Listed outcome of interest not reported or reported incompletely. |
| Other bias | Low risk | Funded by public health institutes and private foundation. No other details provided. No evidence of the presence of other bias. |
Essock‐Connecticut2 2006.
| Methods | Allocation: randomised. Design: multicentre, 2 urban sites (data for single centre not available). Duration: 36 months. Country: Bridgeport, Connecticut, USA. | |
| Participants | Diagnosis*: schizophrenia, schizoaffective disorder, depression with psychotic features, bipolar disorder according to DSM‐III‐R. N** = 198 (randomised to site A: N = 100, to site B: N = 98). Setting: 2 state‐operated outpatient CMHCs. Age: mean 36.5 years (SD 7.8 years). Sex: 72% M (143M, 55F). Ethnicity: African‐American 55%; Hispanic 14%. History: i. active substance use disorder (abuse or dependence on alcohol or other drugs previous 6 months), ii. high service use previous 6 months (≧ 2 between: psychiatric hospitalisation, stays in a psychiatric crisis or respite programme, emergency department visit, or incarceration), iii. homeless or unstably housed, iv. poor independent living skills, v. no pending legal charge, vi. no medical condition or mental retardation, vii. written informed consent given. | |
| Interventions | 1. ICM***: Assertive Case Management. Caseload: 1:10‐15. N = 99. 2. Non‐ICM***: Clinical Case Management provided by clinicians. Caseload: 1:20‐30. N = 99. | |
| Outcomes | Service use: average number of days in hospital per month. Unable to use ‐ Global state: leaving the study early, GAS (N for single intervention group not reported). Social functioning: days in stable accomodation (N for single intervention group not reported), imprisoned (days in jail reported with days in hospital). Social functioning: SATS, AUS, DUS (scales rated by clinicians), days of alcohol/drug use (N for single intervention group not reported). Mental state: BPRS‐24 item (N for single intervention group not reported). Client satisfaction: General Life Satisfaction (N for single intervention group not reported). Costs: not reported. |
|
| Notes | *76% schizophrenia or schizoaffective disorder; 17% mood disorder; 74% alcohol disorder; 81% substance use disorder. **Original randomised sample N = 205. 7 participants left for administrative reason. Authors did not report to which group they were assigned. ***Both interventions addressed substance use disorders. | |
| Risk of bias | ||
| Bias | Authors' judgement | Support for judgement |
| Random sequence generation (selection bias) | Low risk | Randomised using separate computer‐generated randomisation stream for each site. |
| Allocation concealment (selection bias) | Unclear risk | No details |
| Blinding (performance bias and detection bias) All outcomes | Unclear risk | No details |
| Blinding of participants and personnel (performance bias) All outcomes | Unclear risk | No details |
| Blinding of outcome assessment (detection bias) All outcomes | Unclear risk | No details |
| Incomplete outcome data (attrition bias) All outcomes | Unclear risk | Insufficient reporting of missing data (number and reasons for missing data reported for the total sample, not for each intervention group). 7 randomised participants were lost due to administrative reason, but their intervention allocation was not reported. |
| Selective reporting (reporting bias) | High risk | Listed outcomes of interest are fully reported for each site, but authors did not provide sample size. |
| Other bias | Low risk | Publicly funded. No further details. No evidence of the presence of other bias. |
Ford‐UK 1995.
| Methods | Allocation: randomised. Design: single centre (multisite study, but randomisation is used in only one site; we have reported data from this site). Duration: 18 months. Country: North Southwark, London, UK. | |
| Participants | Diagnosis*: psychotic illness, severely and persistently mentally ill (criteria not reported). N = 77. Setting: Centre for Mental Health. Age: mean ˜ 46 years. Sex: 47% M. Ethnicity: 30% ethnic minority. History: i. either: recent inpatient admission, or impairment in social functioning, or problems in compliance with medication/treatment regimens, or problem in receiving help from multi‐agency; ii. no primary diagnosis of organic psychosis, personality disorder, drug/alcohol abuse, learning difficulty. | |
| Interventions | 1. ICM: multidisciplinary team, providing Assertive Community Care not following any specific model of case management. Caseload: < 15 clients per case manager. ICM provided in addition to standard mental health service. N = 39. 2. Standard care: provided by psychiatric services. N = 38. | |
| Outcomes | Service use: average number of days in hospital per month, admitted to hospital.
Death**: all causes and suicide.
Global state: leaving the study early, compliance with medication.
Social functioning: imprisoned.
Mental state: BPRS‐18 item.
Quality of life: objective quality of life through QOLI.
Costs: direct costs of psychiatric hospital care, direct costs of all care. Unable to use ‐ Social functioning: Life Skill Profile (LSP) (rated by the therapist, not independent rater). Social support: data not reported due to "high level of missing data". |
|
| Notes | *Schizophrenia 81%. **Difference of 1 death (all causes) between 2 reports (3 to 4 deaths reported in ICM group). (Number of suicide consistent between reports). Reported lowest number of death here. | |
| Risk of bias | ||
| Bias | Authors' judgement | Support for judgement |
| Random sequence generation (selection bias) | Low risk | Randomised. Sequence of random number generated by computer program. |
| Allocation concealment (selection bias) | Unclear risk | No details |
| Blinding (performance bias and detection bias) All outcomes | Unclear risk | Primary outcome: clinician/participant mediated ‐ rating ‐ Unclear. Secondary outcomes: some are clinician/participant mediated ‐ rating ‐ Unclear, some are interviewer rated ‐ rating ‐ Unclear. No details. |
| Blinding of participants and personnel (performance bias) All outcomes | High risk | Problematic to blind participants and those providing the intervention in studies comparing ICM intervention with standard care. |
| Blinding of outcome assessment (detection bias) All outcomes | Unclear risk | Service use, costs, convictions/imprisonment, and mortality were collected by independent researchers. Blinding not reported. |
| Incomplete outcome data (attrition bias) All outcomes | High risk | Number and reasons for missing dichotomous outcome data reported; imbalance in numbers and reasons for missing data across intervention groups, which is not addressed for continuous outcome data. |
| Selective reporting (reporting bias) | Low risk | Listed outcome of interest reported, or if not reported, reason is provided (i.e. social support data are not reported due to high level of missing data). |
| Other bias | Low risk | No details. No evidence of the presence of other bias. |
Hampton‐Illinois (A).
| Methods | Site A ‐ Bridge West. Methods: see above Hampton‐Illinois 1992. |
|
| Participants | Participants: see above Hampton‐Illinois 1992.
Site A provided the following information: Diagnosis: 78% (74/95) primary diagnosis of major mental illness (schizophrenia, affective disorder, other psychosis), ˜ 13% (12/95) have primary diagnosis of alcohol or substance abuse. N = 95. Sex: 80% M (76M, 19F). Ethnicity: non‐white: 50.5% (48/95). Age: average ˜ 38 years. History: average age at first psychiatric contact ˜ 23.5 years, average duration of homeless before entering the study ˜ 44.6 months. |
|
| Interventions | Interventions: see also above Hampton‐Illinois 1992.
Site A provided the following information: 1. ICM: N = 48. 2. Standard care: provided by psychiatric services, including traditional office‐based outpatient care and case management. N = 47. |
|
| Outcomes | Service use: average number of days in hospital per month*, not remaining in contact with psychiatric services.
Death: all causes.
Global state: leaving the study early.
Social functioning: accomodation status. Unable to use ‐ Service use: mean number of admissions (data not reported). Social functioning: imprisoned (data not reported). |
|
| Notes | *Variance not reported ‐ data from another study used. | |
Hampton‐Illinois (B).
| Methods | Site B ‐ Bridge South. Methods: see above Hampton‐Illinois 1992. |
|
| Participants | Participants: see above Hampton‐Illinois 1992.
Site B provided the following information: Diagnosis: 54% (38/70) have primary diagnosis of schizophrenia, 27% (19/70) have primary diagnosis of affective disorder, 1% (1/70) have primary diagnosis of substance abuse. N = 70. Sex: 71% M (M59/70). Age: average ˜ 35 years. History: average age at first psychiatric contact ˜ 23 years, average homeless before entering the study ˜ 18 months. |
|
| Interventions | Interventions: see above Hampton‐Illinois 1992.
Site B provided the following information: 1. ICM: N = 34. 2. Standard care: N = 36. |
|
| Outcomes | Service use: average number of days in hospital per month*.
Global state: leaving the study early. Unable to use** ‐ Service use: not remaining in contact with psychiatric services. Death: all causes. Social functioning: accomodation status, imprisoned. |
|
| Notes | *Variance not reported ‐ data from another study used. **Data excluded due to an incomplete report (figures in project report do not add up; > than total N in study). | |
Hampton‐Illinois 1992.
| Methods | Allocation: randomised. Design: multicentre (2 centres: Site A ‐ Bridge West; Site B ‐ Bridge South). Duration: 12 months. Country: Chicago, USA. | |
| Participants | Diagnosis*: serious mental illness. N = 165. Setting: community mental health service. Age: ≧ 18 years, mean ˜ 37 years. Sex: 77% M (127M, 38F). Ethnicity: 55.7% black (understood to be African‐American). History: i. admitted to inpatient units of 2 state hospitals, ii. homeless on admission or at risk of homelessness on discharge, iii. informed consent given (site A). | |
| Interventions | 1. ICM: Assertive Case Management (Stein and Test model). Caseload: ˜ 1:10. N = 82. 2. Standard care: provided by psychiatric services. N = 83. (Site A included traditional office‐based outpatient care and case management.) | |
| Outcomes | Outcomes from different centres are reported separately; we assumed a single‐centre randomisation procedure. See below in Hampton‐Illinois (A) and Hampton‐Illinois (B). | |
| Notes | *Schizophrenia 42%. | |
| Risk of bias | ||
| Bias | Authors' judgement | Support for judgement |
| Random sequence generation (selection bias) | Unclear risk | Randomised. No further details. Although this was not explicit, we assumed an independent randomisation for each centre. Authors reported: "Project staff recruited clients on varying days to reduce bias". We interpreted this as meaning that different days were used for recruitment to the whole study, and not that group of allocation was determined by day. |
| Allocation concealment (selection bias) | Unclear risk | Described as "blinded randomisation". No further details. |
| Blinding (performance bias and detection bias) All outcomes | Unclear risk | Primary outcome: clinician/participant mediated ‐ rating ‐ Unclear. Secondary outcomes: some clinician/participant mediated ‐ rating ‐ Unclear. |
| Blinding of participants and personnel (performance bias) All outcomes | Unclear risk | No details |
| Blinding of outcome assessment (detection bias) All outcomes | Unclear risk | No details |
| Incomplete outcome data (attrition bias) All outcomes | Unclear risk | Insufficient reporting of attrition/exclusions to permit judgement. |
| Selective reporting (reporting bias) | High risk | In both centres, Hampton‐Illinois (A) and Hampton‐Illinois (B), some listed outcomes of interest were not reported or were reported incompletely (i.e. days spent in hospital: no SD). |
| Other bias | Unclear risk | Publicly funded (National Institute of Mental Health). It is unclear whether the study was interrupted earlier in Hampton‐Illinois (B). Authors reported: "The study sample for Site B was inadequate due to late start, implementation problems and high dropout rate"; for this reason, they reported data only by 6 months. |
Harrison‐Read‐UK 2000.
| Methods | Allocation: randomised. Design: single centre. Duration: 24 months. Country: London, UK. | |
| Participants | Diagnosis*: "heavy psychiatric service users", no diagnostic criteria reported. N = 193. Setting: community psychiatric services. Age: 16 to 64 years, mean ˜ 39 years. Sex: 53% M (102M, 91F). History: admitted within the last 3 years and had at least 2 admissions in the last 6.5 years. Excluded: participants who were continuously hospitalised during 8 months' recruitment. | |
| Interventions | 1. ICM: enhanced community management on ACT principles (Stein model) provided by dedicated multiprofessional team. Caseload: 1:8‐15. N = 97. 2. Non‐ICM: locality‐based community psychiatric services using the UK Care Programme Approach. Caseload: 1 ≧20. N = 96. | |
| Outcomes | Service use: average number of days in hospital per month.
Death: all causes, suicide.
Global state: leaving the study early, compliance, Rating of Medication Influences (ROMI).
Social functioning: Social Functioning Questionnaire (SFQ).
Mental state: Krawiecka Scale (KS), Health of the Nation Outcome Scale (HoNOS), Hospital Anxiety and Depression Scale (HADS).
Participant satisfaction: Camberwell Assessment of Need (CAN).
Costs: direct costs of psychiatric hospital care. Unable to use ‐ Mental state: general symptoms, Well‐being Questionnaire (W‐BQ) (not peer‐reviewed scale and modified from the original). |
|
| Notes | *Schizophrenia ˜ 65%. **Median number of 5 admissions over 6.5 years. | |
| Risk of bias | ||
| Bias | Authors' judgement | Support for judgement |
| Random sequence generation (selection bias) | Low risk | Random sequence generated by computer program. |
| Allocation concealment (selection bias) | Unclear risk | No details |
| Blinding (performance bias and detection bias) All outcomes | Unclear risk | Primary outcome: clinician/participant mediated ‐ rating ‐ Unclear. Secondary outcomes: some are interviewer rated ‐ rating ‐ No. Interviewers are not blind to treatment assignment. |
| Blinding of participants and personnel (performance bias) All outcomes | Unclear risk | Blinding not reported. |
| Blinding of outcome assessment (detection bias) All outcomes | High risk | Interviewers were not blinded. |
| Incomplete outcome data (attrition bias) All outcomes | Unclear risk | Number of lost to follow‐up reported, but reasons for attrition not reported. Number of lost to follow‐up balanced between 2 groups. Some participants were excluded after randomisation, but reasons for exclusion not stated. |
| Selective reporting (reporting bias) | Low risk | Listed outcomes of interest are fully reported. |
| Other bias | Low risk | Publicly funded (National Health Service). No further details. No evidence of other bias. |
Herinckx‐Oregon 1996.
| Methods | Allocation: randomised. Design: single centre. Duration: 29 months. Country: Portland, Oregon, USA. | |
| Participants | Diagnosis: schizophrenia, major affective disorder, paranoid disorder, or another severe mental disorder; diagnostic criteria not reported. N = 178. Setting: community. Age: > 18 years, mean 36.5 ± 10.3 years (N = 163). Sex: 61% M (N = 163). Ethnicity: 18% black (understood to be African‐American). *History: i. chronically mentally ill, ii. history of persistent psychotic symptoms not due to substance abuse, iii. impaired functioning in > 2 of (i) social role, (ii) daily living, (iii) social acceptability, iv. no mental retardation. In process of being discharged from hospital or transferring to new service providers within community. | |
| Interventions | 1.ICM**: Assertive Community Treatment from combined teams staffed by consumers (N = 58) and not staffed by consumers (N = 59). ACT following the Stein and Test model. Caseload: 1:10. N = 117. 2. Standard care***: provided by 1 of 4 CMHCs and a number of smaller, more specialised agencies (none providing assertive outreach). Average caseload ˜ 1:27. N = 61. | |
| Outcomes | Service use: not remaining in contact with psychiatric services****, admitted to hospital, number visits to emergency room.
Social functioning: accomodation status, arrests. Unable to use ‐ Social functioning: employment status, illicit drug use (not reported). Mental state: general symptoms (not reported). Quality of life: measurement instrument not specified (data not reported). Satisfaction with services: measurement instrument not specified (not reported). |
|
| Notes | *60% psychotic disorders, 40% affective disorders, 33% severe alcohol or drug use comorbidity, 61% 2+ admissions in last 6 months. **Staff members were self identified mental health consumers DSM‐III‐R axis I diagnosis (˜ 50% of staff had a diagnosis of bipolar disorder). ***In the standard care group: caseload ˜ 1:15 is provided to ˜ 33% participants. ****Disengagement does not include who moved out, who refused to be re‐interviewed, death. | |
| Risk of bias | ||
| Bias | Authors' judgement | Support for judgement |
| Random sequence generation (selection bias) | Unclear risk | Randomised. Ratio randomisation between interventions: ICM:SC = 2:1. No further details. |
| Allocation concealment (selection bias) | Unclear risk | No details |
| Blinding (performance bias and detection bias) All outcomes | Unclear risk | Primary outcome: clinician/participant mediated ‐ rating ‐ Unclear. Secondary outcomes: clinician/participant mediated ‐ rating ‐ Unclear. |
| Blinding of participants and personnel (performance bias) All outcomes | High risk | Problematic to blind participants and those providing the intervention in studies comparing ICM intervention with standard care. |
| Blinding of outcome assessment (detection bias) All outcomes | Unclear risk | Source of data not reported. |
| Incomplete outcome data (attrition bias) All outcomes | Unclear risk | Missing data are not addressed. |
| Selective reporting (reporting bias) | High risk | Not all listed outcomes of interest are reported. |
| Other bias | Low risk | No details. No evidence of the presence of other bias. |
Holloway‐UK 1996.
| Methods | Allocation: randomised. Design: single centre. Duration: 18 months. Country: East Lambeth, London, UK. | |
| Participants | Diagnosis*: hospital diagnosis of functional psychosis (no diagnostic criteria stated). N = 70. Setting: community psychiatric service. Age: 16 to 64 years, mean ˜ 35 years. Sex: 66% M (46M, 24F). Ethnicity: not available. History**: referred by teams as being "hard to treat" (previous non‐compliance with treatment, frequent readmission or poor symptomatic response to conventional management), ii. live locally, iii. informed consent given. | |
| Interventions | 1. ICM: intensive team‐based Case Management. "Continuing care team" providing Assertive Case Management (according to the Clinical Case Management Model. Caseload: 1:8. N = 35. 2. Standard care: provided by community psychiatric nursing service. N = 35. | |
| Outcomes | Service use: average number of days in hospital per month, not remaining in contact with psychiatric services, admitted to hospital.
Death: all causes and suicide.
Global state: leaving the study early.
Social functioning: Disability Assessment Scale (DAS).
Mental state: Comprehensive Psychopathological Rating Scale (CPRS), Schedule for the Assessment of Negative Symptoms (SANS), depression, Beck Depression inventory (BDI).
Quality of life: Lancashire Quality of Life Profile (LQoLP).
Behaviour: Social Behaviour Scale (SBS). Unable to use ‐ Participant satisfaction: satisfaction interview (not peer reviewed, scale developed by the research team). |
|
| Notes | *66% schizophrenia/schizoaffective disorder; 26% bipolar disorder. **All had 1 or more psychiatric admission, years since onset of illness ≃ mean 11 years. | |
| Risk of bias | ||
| Bias | Authors' judgement | Support for judgement |
| Random sequence generation (selection bias) | Unclear risk | Randomised. No further details. |
| Allocation concealment (selection bias) | Unclear risk | Randomisation by sealed envelopes (not stated if opaque). |
| Blinding (performance bias and detection bias) All outcomes | Unclear risk | Primary outcome: clinician/participant mediated ‐ rating ‐ Unclear. Secondary outcomes: most are interviewer rated ‐ rating ‐ No. Interviewers are not blind to treatment condition. |
| Blinding of participants and personnel (performance bias) All outcomes | High risk | Problematic to blind participants and those providing the intervention in studies comparing ICM intervention with standard care. |
| Blinding of outcome assessment (detection bias) All outcomes | Unclear risk | Source of data and blinding not reported for mortality and service use. Raters were not blinded for mental state and social functioning outcomes. |
| Incomplete outcome data (attrition bias) All outcomes | Low risk | YES ‐ Primary outcomes: average number of days in hospital per month; not remaining in contact with psychiatric services. No missing data. NO ‐ Secondary outcomes: imbalance in numbers for missing data across intervention groups. |
| Selective reporting (reporting bias) | Low risk | All listed outcomes of interest are fully reported. |
| Other bias | Low risk | No details. No evidence of the presence of other bias. |
Jerrell‐SCarolina1 1991.
| Methods | Allocation: randomised. Design: single‐centre trial. Duration: 18 months. Country: South Carolina, USA. | |
| Participants | Diagnosis*: psychotic or major affective disorders (DSM‐III‐R, according to the Computer based Diagnostic Interview Schedule Revised (C‐DIS‐R)). N = 122. Age: 18 to 59 years, 55% > 34 years. Sex: 68M, 54F. Ethnicity: ˜ 28% non‐white. Setting: large urban mental health service. History: i. participants were being discharged from the most recent of 2+ inpatient admissions in last year or subacute care episodes or lengthy residential treatment and repeated emergency psychiatric visits; ii. 2+ years of poor work history, eligible for public assistance, poor living skills, poor social support, history of inappropriate behaviour. | |
| Interventions | 1. **ICM (1): Programme Assertive Community Treatment (PACT) adaptation. Caseload: 1:15/20. N = 40. 2. **ICM (2): Intensive Broker Case Management Model. Caseload: 1:15/18. N = 42. 3. Standard care: from 1 of 4 multidisciplinary psychiatric teams. Clinical approach according to a generalist model with supplemental case management provided to ≃ 25% of the most unstable clients. Caseload: 1:35 to 1:45. N = 40. | |
| Outcomes | Service use: average number of days in hospital per month***, average visits to emergency room***.
Social functioning: Social Adjustment Scale‐II (SAS‐II), Role Functioning Scale (RFS). Unable to use ‐ Mental state: not reported with the psychometric measurement instrument. Social functioning: use of alcohol and drug, legal system involvement (not reported). Participant satisfaction: satisfaction with service (instrument not stated, data not reported). Satisfaction with Life Scale (SLS) (not reported). Costs: direct costs of psychiatric inpatient care (no SD). |
|
| Notes | *Schizophrenia ˜ 75%. **Both intervention (1) and intervention (2) would fit into the definition of Intensive Case Management as described in this review, hence they could be considered as a single intervention. But as they were reported separately in the original study, it was not possible to present data from these two samples combined (it is not possible to sum up SD data). We decided to present only data from intervention (1) versus standard care. ***Variance not reported ‐ data from another study used. | |
| Risk of bias | ||
| Bias | Authors' judgement | Support for judgement |
| Random sequence generation (selection bias) | Unclear risk | Randomised. No further details. |
| Allocation concealment (selection bias) | Unclear risk | No information |
| Blinding (performance bias and detection bias) All outcomes | Unclear risk | Primary outcome: clinician/participant mediated ‐ rating ‐ Unclear. Secondary outcomes: interviewer rated ‐ rating ‐ Unclear. No information. |
| Blinding of participants and personnel (performance bias) All outcomes | Unclear risk | Blinding not reported. |
| Blinding of outcome assessment (detection bias) All outcomes | Unclear risk | Cost‐of‐care data were based on both public and private mental health services. Blinding not reported. Blinding for interviewers for social adjustment, mental state not reported. |
| Incomplete outcome data (attrition bias) All outcomes | Unclear risk | Number of randomised participants is not stated; only number of randomised participants completing the study period is reported. |
| Selective reporting (reporting bias) | High risk | Listed outcome of interest not reported or reported incompletely (i.e. service use: no SD). |
| Other bias | Low risk | Publicly funded (National Institute of Mental Health). No details. No evidence of the presence of other bias. |
Johnston‐Australia 1998.
| Methods | Allocation: randomised. Design: single centre. Duration: 12 months. Country: Sydney, Australia. Setting: Eastern Suburb Mental Health Service (ESMHS). | |
| Participants | Diagnosis*: schizophrenia, bipolar disorder (diagnostic criteria not reported). N = 73. Setting: Eastern Suburb Mental Health Service (ESMHS). Age: 16 to 70 years, mean ˜ 42 years. Sex: 56% M (41M, 32F). History: at least 3 of: i. high relapse rate over previous 2 years, ii. poor compliance, iii. disturbing behaviour, iv. frequent changes of accommodation, v. poor budgeting skills, vi. low quality of life, vii. difficulty to manage in existing service. Resident of the ESMHS catchment area. No primary diagnosis of substance misuse, organic brain disorder, or intellectual disability. | |
| Interventions | 1. ICM**: Caseload: 1:8‐10. N = 37. 2. Non‐ICM: Caseload: 1:20‐40. N = 36. | |
| Outcomes | Service use: average number of days in hospital per month, not remaining in contact with psychiatric services, admission to hospital.
Death: all causes.
Global state: leaving the study early, compliance with medication.
Social functioning: accomodation status, number living in supported accomodation, employment, participants spending at least 1 day employed, participants on paid employment, number of participants having contact with police or legal system.
Behaviour: number of participants having incident of self harm or harm to others.
Costs: direct costs of all care. Unable to use ‐ Service use: number admitted to hospital (not reported), use of general practitioner (not listed as review outcome of interest). Global state: clinically significant improvement (as Life Skill Profile (LSP) improvement ≧ 18 points/12 months) (scale assessment completed by the therapist, not reported what measurement used). Social functioning: accomodation changes (not listed as review outcome of interest), LSP (assessment completed by the therapist). Costs: direct costs of psychiatric hospital care (no SD). |
|
| Notes | *Schizophrenia 89%. **Main difference between teams was in ratio of staff to participant. Both are multidisciplinary, co‐ordinate and provide a variety of services, have access to inpatient, rehabilitation, and 24‐hour crisis service. | |
| Risk of bias | ||
| Bias | Authors' judgement | Support for judgement |
| Random sequence generation (selection bias) | Unclear risk | Randomised. No further details. |
| Allocation concealment (selection bias) | Unclear risk | No details |
| Blinding (performance bias and detection bias) All outcomes | Unclear risk | Primary outcome: clinician/participant mediated ‐ rating ‐ Unclear. Secondary outcomes: most are clinician/participant mediated ‐ rating ‐ Unclear. |
| Blinding of participants and personnel (performance bias) All outcomes | Unclear risk | Blinding not reported. |
| Blinding of outcome assessment (detection bias) All outcomes | Unclear risk | Service use (hospitalisations), social functioning (accomodation status, employment, police and legal involvement), behaviour (self harm and harm to others): collected and reported by the case manager. Blinding not reported. |
| Incomplete outcome data (attrition bias) All outcomes | Low risk | YES ‐ Primary outcomes: average number of days in hospital per month, not remaining in contact with psychiatric services. Numbers and reasons for missing data clearly reported and balanced between groups. NO ‐ Secondary outcomes: imbalance in numbers for missing data across intervention groups. |
| Selective reporting (reporting bias) | Low risk | All listed outcomes of interest are fully reported. |
| Other bias | Low risk | No details. No evidence of the presence of other bias. |
Lehman‐Maryland1 1994.
| Methods | Allocation: randomised. Design: single centre. Duration: 12 months. Country: Baltimore, Maryland, USA. | |
| Participants | Diagnosis*: severe mental disorder (schizophrenia, schizoaffective disorder, or any other diagnosis axis I and extensive prior hospitalisation history, according to the DSM‐III‐R). N = 152. Setting: CMHCs. Age: 18 to 64 years, mean ˜ 37 years. Sex: 67% M (102M, 50F). History**: i. homeless***, ii. severe mental disorder****, iii. written consent given. | |
| Interventions | 1. ICM: Programme of Assertive Community Treatment (Stein and Test model). Caseload: 1:10‐12. N = 77. 2. Standard care: care from community mental health centres and emergency facilities, though also a small amount of non‐ICM. N = 75. | |
| Outcomes | Service use: average number of days in hospital per month, admitted to hospital, average number of admissions to emergency room (mean adjusted for race as covariate).
Global state: leaving the study early.
Social functioning: not living independently, days in stable accomodation.
Mental state: Colorado Symptom Index (CSI) (mean adjusted for race as covariate).
Quality of life: Lehman's Quality of Life Index (QOLI), satisfaction with general well‐being (mean adjusted for race as covariate).
Costs: direct cost of psychiatric hospital, direct costs of all health care. Unable to use ‐ Social functioning: days in prison (reported data are not complete). Quality of life: specific items reported from Quality of Life Scale (QOLS) (not global assessments). Social functioning: objective QOLS (no data), days homeless (split reporting of different types of homelessness, no SD). General health: Medical Outcomes Study 36‐Item Short Form Health Survey (SF‐36) (mean adjusted for race as covariate) (not listed as outcome of interest for the review). |
|
| Notes | *Schizophrenia‐like disorder: 58%, bipolar disorder 20%, major depression 8%, comorbid for substance use disorders 71%. **74% homeless for at least 1 year in total; 34% homeless for ≧ 4 years. ***Homeless defined as: on street or shelter for ≧ 5 days last 45 or ≧ 14 last 180, or in temporary accommodation with ≧ 2 residential moves in last 6 months. ****Severe mental disorder: defined as diagnosis of schizophrenia or schizophrenia‐like illness or receiving benefit because of mental disorder or had another axis I disorder and either: > 2 hospitalisations of > 21 days in past 3 years or a total of > 42 days prior to current hospitalisation or ≧ 90 days in psychiatric hospital or nursing home in past 3 years or mental disability lasting > 1 year during which unable to spend > 75% of time in some gainful activity. Note complex inclusion criteria. | |
| Risk of bias | ||
| Bias | Authors' judgement | Support for judgement |
| Random sequence generation (selection bias) | Unclear risk | Randomised (stratified random assignment). No further details. |
| Allocation concealment (selection bias) | Unclear risk | No details |
| Blinding (performance bias and detection bias) All outcomes | Unclear risk | Primary outcome: clinician/participant mediated ‐ rating ‐ Unclear. Secondary outcomes: those interviewer rated ‐ rating ‐ Unclear. No details. |
| Blinding of participants and personnel (performance bias) All outcomes | High risk | Problematic to blind participants and those providing the intervention in studies comparing ICM intervention with standard care. |
| Blinding of outcome assessment (detection bias) All outcomes | Unclear risk | Source of data not reported for service use (hospitalisations, emergency room visits, outpatient visits for general medical care), social functioning (homelessness, incarceration). Blinding not reported for mental state. Quality of life and health survey self reported. |
| Incomplete outcome data (attrition bias) All outcomes | Unclear risk | Insufficient reporting of attrition/exclusion (no reasons for missing data provided). |
| Selective reporting (reporting bias) | High risk | Not all listed outcomes of interest are reported completely. |
| Other bias | Low risk | Publicly funded (Center for Mental Health Services, Maryland). No details. No evidence of the presence of other bias. |
Macias‐Utah 1994.
| Methods | Allocation: randomised. Design: single centre. Duration: 18 months. Country: Utah, USA. | |
| Participants | Diagnosis*: serious and persistent mental disorder. N = 41. Setting: mental health centre. Age: not reported. Sex: 56% M. Ethnicity: 100% Caucasian (understood to be white). History: unclear, no primary diagnosis of mental retardation or substance abuse. | |
| Interventions | 1. ICM: psychosocial rehabilitation programme at CMHC + Case Management (CM is modelled as Strengths CM). Caseload: 1:20. N = 20. 2. Standard care: psychosocial rehabilitation programme** at CMHC. N = 21. | |
| Outcomes | Service use: admitted to hospital.
Global state: leaving the study early. Unable to use ‐ Mental state: Brief Psychological Well‐Being Index (BPWI) (unpublished scales, designed by authors especially for the population under study). Global state: Self Report Inventory (SRI) (unpublished scales, designed by authors especially for the population under study). Carer satisfaction: Utah Family Burden Scale (unpublished, designed by authors especially for the population under study). Social functioning: Utah Case Management Consumer Assessment Record (not independently rated, no summary score, no SD). |
|
| Notes | *Schizophrenia 46%, major depression 22%. **Described as "a high quality rehabilitation program that informally provides many services typical of case management". It is not a specific package of care and does not refer to a specific intervention. | |
| Risk of bias | ||
| Bias | Authors' judgement | Support for judgement |
| Random sequence generation (selection bias) | Unclear risk | Randomised. No further details. |
| Allocation concealment (selection bias) | Unclear risk | No details |
| Blinding (performance bias and detection bias) All outcomes | Unclear risk | Primary outcome: clinician/participant mediated ‐ rating ‐ Unclear. Secondary outcomes: clinician/participant mediated ‐ rating ‐ Unclear. |
| Blinding of participants and personnel (performance bias) All outcomes | Unclear risk | No details |
| Blinding of outcome assessment (detection bias) All outcomes | Unclear risk | No details |
| Incomplete outcome data (attrition bias) All outcomes | Unclear risk | Insufficient reporting of attrition/exclusion (no reasons for missing data provided). |
| Selective reporting (reporting bias) | Unclear risk | One listed outcome of interest is not reported completely (Utah Case Management Consumer Assessment Record: no summary report, no SD). |
| Other bias | Low risk | Funded by public institution (NIMH). No details. No evidence of the presence of other bias. |
Marshall‐UK 1995.
| Methods | Allocation: randomised. Design: single centre. Duration: 14 months. Country: Oxford, UK. | |
| Participants | Diagnosis*: severe persistent psychiatric disorder. N = 80. Setting: Oxford Social Service. Age: 20 to over 60 years, mean ˜ 48 years. Sex: 85% M (68M, 12F). Ethnicity: not reported. History**: i. either homeless, at risk of homelessness, living in supported, temporary or poor‐quality accommodation, experiencing social isolation, or causing disturbances, ii. not already receiving case management, iii. informed consent given. | |
| Interventions | 1. ICM: Case Management from team of social services case managers (case managers are free to choose how much time to offer each patient, but at minimum provided some intervention). Caseload: ˜ 1:10. N = 40. 2. Standard care: provided by CMHTs. N = 40. | |
| Outcomes | Service use: average number of days in hospital per month, admitted to hospital.
Death: all causes.
Global state: leaving the study early.
Social functioning: REHAB scale, imprisonment, employment.
Quality of life: Quality of Life Index.
Costs: costs of all care per week (including accomodation). Unable to use ‐ Need for care: Medical Research Council (MRC) Needs for Care Schedule (version modified by authors). Behaviour: Social Integration Questionnaire (not published in peer‐reviewed journal). Social functioning: accomodation status (the definition of "better" and "worse" accommodation status was not clearly stated), employment (no mean and SD reported). Costs: direct cost of psychiatric hospital care and of health care (no SD). |
|
| Notes | *Schizophrenia and related disorder 74%. **40% illness > 1 yr, 85% previous psychiatric admission. | |
| Risk of bias | ||
| Bias | Authors' judgement | Support for judgement |
| Random sequence generation (selection bias) | Low risk | Randomisation by permuted block. No further details. |
| Allocation concealment (selection bias) | Unclear risk | Randomisation by sealed envelopes (not stated if opaque). |
| Blinding (performance bias and detection bias) All outcomes | Unclear risk | Primary outcome: clinician/participant mediated ‐ rating ‐ Unclear. Secondary outcomes: those interviewer rated ‐ rating ‐ Unclear. No details. |
| Blinding of participants and personnel (performance bias) All outcomes | High risk | Problematic to blind participants and those providing the intervention in studies comparing ICM intervention with standard care. |
| Blinding of outcome assessment (detection bias) All outcomes | Unclear risk | Data for service use (hospitalisation), costs, social functioning (employment; accomodation), non‐psychiatric health care, psychiatric health care provided by the respective healthcare providers. Blinding not reported. Mental state and social functioning (social behaviour measured by REHAB) rated by a trained observer. Blinding not reported. Social functioning and quality of life self reported. |
| Incomplete outcome data (attrition bias) All outcomes | Unclear risk | Insufficient reporting of attrition/exclusion (no reasons for missing data provided). Lost to follow‐up reported at 7 months, not at 14 months. Reasons for attrition reported only for the experimental sample. |
| Selective reporting (reporting bias) | Low risk | Listed outcomes reported completely. |
| Other bias | Low risk | No details. No evidence of the presence of other bias. |
McDonel‐Indiana (A).
| Methods |
McDonel‐Indiana (A) refers to 4 centres grouped together, providing data on service use. Methods: see above McDonel‐Indiana 1997. |
|
| Participants | Participants: see above McDonel‐Indiana 1997. N = 160. |
|
| Interventions | Interventions: see above McDonel‐Indiana 1997. 1. ICM: N = 80. 2. Non‐ICM: N = 80. |
|
| Outcomes | Service use: average number of days in hospital per month. | |
| Notes | ||
McDonel‐Indiana (B).
| Methods |
McDonel‐Indiana (B) refers to the 5th centre alone, providing data on service use. Methods: see above McDonel‐Indiana 1997. |
|
| Participants | Participants: see above McDonel‐Indiana 1997. N = 40. |
|
| Interventions | Interventions: see above McDonel‐Indiana 1997. 1. ICM: N = 20. 2. Control group: N = 20. |
|
| Outcomes | Service use: average number of days in hospital per month. | |
| Notes | ||
McDonel‐Indiana 1997.
| Methods | Allocation: randomised. Design: multicentre (5 rural sites). Duration: 24 months. Country: Indiana, USA. | |
| Participants | Diagnosis*: severe mental illness (DSM‐III‐R coded between 295 and 301.99). N = 200 (40 participants for each site). Setting: 5 rural CMHCs. Age: > 18 years, mean ˜ 38.1 years (SD 11.1). Sex: 43% M (86M, 114F). Ethnicity: 98% Caucasian (understood to be white). History**: i. poor utilisation of community mental health services and frequent use of psychiatric hospital or emergency room, ii. difficulties with the legal system or in maintaining stable housing, iii. more than 1 episode of intensive psychiatric care lasting > 2 months, iv. impaired role functioning on a continuing or intermittent basis for at least 2 years. | |
| Interventions | 1. ICM: Assertive Community Treatment (1 site had addition of Rhinelander model to ACT). Caseload: 1:10. N = 100. 2. Non‐ICM: provided by the mental health services: office‐based; subscribed to the tradition of individual Case Management (including day treatment, partial hospitalisation, outpatient therapy, residential services). Caseload: 1:30 to 1:60. N = 100. | |
| Outcomes | Service use: average number of days in hospital per month (provided for 2 groups of centres, see below in McDonel‐Indiana 1997 A and McDonel‐Indiana 1997 B).
Global state: leaving the study early. Unable to use ‐ Service use: admission (sample size not reported). Global functioning: Global Assessment of Functioning (GAF) (rated by the therapist), compliance with medication on 11‐item client‐rated checklist (not a peer‐reviewed scale). Social functioning: Indiana Level of Functioning (Indiana LOF) (rated by the therapist), accomodation quality and employment scale (not a peer‐reviewed scale). Social functioning: days in jail, number of police contacts (sample size not reported). Mental state: Brief Psychiatric Rating Scale (BPRS) (rated by the therapist). Quality of life: scale modified by the trialist (not a peer‐reviewed scale). Satisfaction with services: satisfaction with service scale (not peer‐reviewed scale). |
|
| Notes | *Schizophrenia 48%, affective disorder 32%. N = 153. **Mean lifetime hospitalisation: 8.4 (SD 7.5), mean hospitalisation in the previous years: 1.3 (SD 1.1). N = 153. | |
| Risk of bias | ||
| Bias | Authors' judgement | Support for judgement |
| Random sequence generation (selection bias) | Unclear risk | Randomised. No further details. |
| Allocation concealment (selection bias) | Unclear risk | No details |
| Blinding (performance bias and detection bias) All outcomes | Unclear risk | Primary outcome: clinician/participant mediated ‐ rating ‐ Unclear. Secondary outcome: clinician/participant mediated ‐ rating ‐ Unclear. |
| Blinding of participants and personnel (performance bias) All outcomes | Unclear risk | Blinding not reported. |
| Blinding of outcome assessment (detection bias) All outcomes | Unclear risk | Service use (hospitalisation) was obtained from agency records and the state Department of Mental Health database. Blinding not reported. Accomodation, legal involvement, and education outcomes were self reported and verified by case managers. Blinding not reported. |
| Incomplete outcome data (attrition bias) All outcomes | Unclear risk | Insufficient reporting of attrition/exclusion (number of missing data is reported, but no reasons provided). Number of participants randomised to each group not clearly reported (some participants refused to participate and they were not clearly accounted for in each group). |
| Selective reporting (reporting bias) | High risk | Some listed outcomes of interest are reported incompletely (sample size not reported for social functioning and admission). |
| Other bias | Low risk | Publicly funded (NIMH grant). No details. No evidence of the presence of other bias. |
Morse‐Missouri1 1992.
| Methods | Allocation: randomised. Design: single site. Duration: 12 months. Country: Missouri, USA. | |
| Participants | Diagnosis*: psychiatric diagnosis (DSM‐III‐R). N = 178** Setting: community (drop‐in daytime centres for homeless in St Louis area, mental health clinic operated by Missouri Department of Mental Health). Age: mean ˜ 33.7 years. Sex: 58% M (103M, 75F). Ethnicity: 52.5% non‐white, mostly African‐American. History***: i. serious psychiatric disorder defined as a) previous psychiatric hospitalisation or b) above 90th centile on Global Severity Index or c) above 90th centile on psychoticism, paranoid ideation, or depression subscales of the Brief Symptom Inventory severity index, ii. currently homeless, iii. plans to stay in the study area for its duration, iv. no serious violent behaviour. | |
| Interventions | 1. ICM: clinical case management based on ACT principles (TCL model). Caseload: 1:10. N = 52. 2. Standard care: traditional outpatient treatment provided at local mental health clinic (offered psychotherapy, medication, and assistance in obtaining social services). N = 64. 3. Drop‐in centres****: 2 daytime centres made available, 1 exclusively for women. Centre offered respite when other emergency shelters closed. Provided food, clothing, showers, some recreational activity. Social workers available for referrals to other social services, staff‐client ratio 1:40. N = 62. |
|
| Outcomes | Global state: leaving the study early. Unable to use ‐ Social functioning: Personality and Social Network Adjustment Scale (N for treatment groups not presented). Social functioning: mean number of days spent homeless in past month (N for treatment groups not presented), monthly quantity and frequency of alcohol consumption based on form developed by the National Institute on Alcohol Abuse and Alcoholism (N for treatment groups not presented). Mental state: global severity index of Brief Symptom Inventory (N for treatment groups not presented). Participant satisfaction: measuring instrument not reported (N for treatment groups not presented). Self esteem: Rosenberg's Self Esteem Scale (not peer reviewed, N for treatment groups not presented). Costs: mean monthly income (not described as a review outcome of interest, N for treatment groups not presented). |
|
| Notes | *30.1% schizophrenia, 21% major depression, 8% bipolar, 5% other psychotic disorder, 12% alcohol abuse, 4% other drug abuse, 15% other axis I disorder, 5% no diagnosis. Of those with major axis I disorder, 23% had dual diagnosis with substance abuse. N = 155 (as for remaining 23 participants, it was not possible to assess diagnosis). **Initially 50 people assigned to each treatment group, but if they were lost to follow‐up within the first month after entering the study, they were replaced by random assignment. ***Mean length of time since last stable address 16.6 months, 71.9% had previous psychiatric hospitalisation. ****Data from the drop‐in centre arm were not presented as the intervention provided did not fit the inclusion criteria for any of the interventions addressed in this review. | |
| Risk of bias | ||
| Bias | Authors' judgement | Support for judgement |
| Random sequence generation (selection bias) | Unclear risk | Randomised. No further details. Participants lost to follow‐up within first month were replaced, replacement was performed through random allocation. |
| Allocation concealment (selection bias) | Unclear risk | Not described |
| Blinding (performance bias and detection bias) All outcomes | Unclear risk | Primary outcome: not available. Secondary outcomes: clinician/participant mediated ‐ rating ‐ Unclear. |
| Blinding of participants and personnel (performance bias) All outcomes | High risk | Problematic to blind participants and those providing the intervention in studies comparing ICM intervention with standard care. |
| Blinding of outcome assessment (detection bias) All outcomes | Unclear risk | Blinding not reported. |
| Incomplete outcome data (attrition bias) All outcomes | Unclear risk | Number and reasons for lost to follow‐up incompletely reported. |
| Selective reporting (reporting bias) | High risk | All data presented but not usable due to N for treatment groups missing. |
| Other bias | Low risk | Publicly funded (grants from National Institute of Mental Health). No further details. No evidence of the presence of other bias. |
Morse‐Missouri3 2005.
| Methods | Allocation: randomised. Design: single site. Duration: 24 months. Country: Missouri, USA. | |
| Participants | Diagnosis*: severe mental illness and substance abuse disorder (according to DSM‐IV). N = 196. Age: 18 to 66 years, mean ˜ 40 years. Sex: ˜ 80% M. Ethnic: 73% African‐American, 25% Caucasian (understood to be white), 2% other minority. History**: currently homeless and severely mentally ill, not already enrolled in an Intensive Case Management programme. | |
| Interventions | 1. ICM: clinical team trained to deliver psychiatric care package following ACT principles and practices. Caseload: 1:10. Treatment of participant's substance abuse via referral to other community providers for outpatient or individual substance abuse services, 12‐step group. N = 46. 2. Standard care: participants shown a list of community agencies that provided mental health and/or substance abuse treatment***. Team also provided linkage assistance to help participants access these services. N = 49. 3. Integrated Community Treatment: combination of Integrated Treatment Services and Assertive Community Treatment (IACT), clinical team trained to deliver psychiatric care package following ACT principles and practices. Also trained to follow Integrated Treatment principles and practices. Substance abuse services provided directly via counselling and bi‐weekly treatment groups. Substance abuse specialist part of IACT team. N = 54****. |
|
| Outcomes | Social functioning: number of days homeless per month, mean number of days used substances.
Costs: inpatient psychiatric costs, healthcare costs, costs of all care. Unable to use ‐ Service use: contacts with treatment programme ‐ not clearly defined (not described as a review outcome of interest). Global state: leaving the study early (overall loss given, no individual group data). Mental state: 24‐item BPRS (data reported are not likely to be obtained through the stated measurement instrument, as rating scores reported are not consistent with this scale). Satisfaction: client satisfaction (modified scale used; not peer reviewed). Social functioning: substance abuse rating score (scale not described or referenced). Costs: emergency shelter costs (not described as a review outcome of interest). |
|
| Notes | *48% schizophrenia, 19% schizoaffective disorder, 11% atypical psychotic disorder, 11% bipolar, 9% major depression‐recurrent disorder, 2% delusional disorder. **Mean 12.5 days homeless in previous month. ***Most agencies specialised in either mental health treatment or substance abuse treatment, but not both. ****Data from this group not used in final analysis, as ACT plus another treatment. | |
| Risk of bias | ||
| Bias | Authors' judgement | Support for judgement |
| Random sequence generation (selection bias) | Unclear risk | Randomised, but no description given. |
| Allocation concealment (selection bias) | Unclear risk | Not described |
| Blinding (performance bias and detection bias) All outcomes | Unclear risk | Primary outcome: not available. Secondary outcomes: interviewer rated ‐ rating ‐ Unclear. Not described. |
| Blinding of participants and personnel (performance bias) All outcomes | High risk | Problematic to blind participants and those providing the intervention in studies comparing ICM intervention with standard care. |
| Blinding of outcome assessment (detection bias) All outcomes | Unclear risk | Service use data were obtained from service agencies, claim records, and participant self report. Services provided. Blinding not reported. Homelessness, income, alcohol consumption self reported. |
| Incomplete outcome data (attrition bias) All outcomes | Unclear risk | Attrition described for the total sample and analysed for effect on outcome. Number and reasons for loss to follow‐up not reported for single arm. |
| Selective reporting (reporting bias) | Low risk | All outcomes reported. |
| Other bias | Low risk | No details. No evidence of the presence of other bias. |
Muijen‐UK2 1994.
| Methods | Allocation: randomised. Design: single centre. Duration: 18 months. Country: Greenwich Health District, London, UK. | |
| Participants | Diagnosis*: severe mental illness: psychotic disorder (schizophrenia or affective psychosis) (diagnostic criteria not reported). N = 82. Setting: Health District. Age: 18 to 64 years, mean ˜ 37 years. Sex: 56% M (46M, 36F). Race: 23.1% African/Afro‐Caribbean. History**: schizophrenia or affective psychosis lasting > 2 years, ≧ 2 hospital admissions last 2 years, about to be discharged, no primary organic disorder. | |
| Interventions | 1. ICM: Case Management approach provided by a Community Support Team (community psychiatric nurses and team leader). The team acts as advocate, practical assistance with welfare benefits and housing, no‐discharge policy. Caseload: 1:8‐11 for the first 15 months (until April 1990), then increased to caseload: 1:20‐25 for the last 3 months, until the end of the trial. N = 41. 2. Standard care: provided by community psychiatric nurses (CPNs) working independently and based in primary care. N = 41. | |
| Outcomes | Service use: average number of days in hospital per month.
Death: all causes and suicide.
Global state: leaving the study early.
Mental state: BPRS 24‐item, PSE.
Social functioning scale: GAS, SAS, imprisoned.
Participant satisfaction (by short term).
Costs: direct costs of all care. Unable to use ‐ Social functioning: accomodation (authors reported data on "patients using hostel accommodations"; it is unclear what is included in this definition). Participant satisfaction (by medium and long term). Client Satisfaction Questionnaire (CSQ) (attrition > 50%). Carer satisfaction (attrition > 50%). Costs: other costs (no SD). |
|
| Notes | *Schizophrenia‐like disorder 83%; mania 12%; psychotic depression 0.5%. **Baseline mean number of admissions: 5.7. | |
| Risk of bias | ||
| Bias | Authors' judgement | Support for judgement |
| Random sequence generation (selection bias) | Unclear risk | Randomised. No details. |
| Allocation concealment (selection bias) | Unclear risk | No details |
| Blinding (performance bias and detection bias) All outcomes | Unclear risk | Primary outcome: clinician/participant mediated ‐ rating ‐ Unclear. Secondary outcomes: those interviewer rated ‐ rating ‐ Unclear. No details. |
| Blinding of participants and personnel (performance bias) All outcomes | High risk | Problematic to blind participants and those providing the intervention in studies comparing ICM intervention with standard care. |
| Blinding of outcome assessment (detection bias) All outcomes | Unclear risk | Service use, income, and accomodation data were collected using the Client Service Receipt Interview. Information was also taken from case records on frequency and duration of input from CPNs. Blinding not reported. |
| Incomplete outcome data (attrition bias) All outcomes | Unclear risk | Number of lost to follow‐up is stated, but reason for attrition is reported generically, referred to the entire sample size and not the single intervention sample. |
| Selective reporting (reporting bias) | High risk | All listed outcomes of interest are fully reported (but some economic outcomes missing any variance measurement). |
| Other bias | Low risk | No details. No evidence of the presence of other bias. |
Muller‐Clemm‐Canada 1996.
| Methods | Allocation: randomised. Design: multicentre (2 sites: Site A, New West; Site B, Surrey ‐ individual centre data not reported). Duration: 24 months. Country: British Columbia, Canada. | |
| Participants | Diagnosis*: majority of participants affected by schizophrenic disorder, others any DSM‐III axis I or axis II (including dual diagnosis). N = 123. Setting: CMHC. Ethnicity: data not available. Age: 19 to 64 years (randomised sample age not reported). Sex: 49.5% M (61M, 62F). History: i. serious and persistent mental illness with impaired role functioning, ii. about to be discharged from hospital, iii. high risk of rehospitalisation, iv. no primary diagnosis of substance abuse, organic brain disease, or developmental disorder, v. no recent history of severe violence, vi. informed consent to participate. | |
| Interventions | 1. ICM: care from a CMHC plus additional Assertive Case Management according to Stein and Test model. Caseload: ˜ 1:10. N = 63. 2. Standard care: care from a CMHC. N = 60. | |
| Outcomes | Service use: average number of days in hospital per month**, number of admissions**.
Death: all causes and suicide.
Global state: leaving the study early. Unable to use ‐ Quality of life: scale (not peer reviewed). |
|
| Notes | *Schizophrenia‐like disorder (60.2%). **Variance not reported ‐ data from another study used. | |
| Risk of bias | ||
| Bias | Authors' judgement | Support for judgement |
| Random sequence generation (selection bias) | Unclear risk | Randomised. No further details. |
| Allocation concealment (selection bias) | Unclear risk | No details |
| Blinding (performance bias and detection bias) All outcomes | Unclear risk | Primary outcome: clinician/participant mediated ‐ rating ‐ Unclear. Secondary outcome: those clinician/participant mediated ‐ rating ‐ Unclear. |
| Blinding of participants and personnel (performance bias) All outcomes | High risk | Problematic to blind participants and those providing the intervention in studies comparing ICM intervention with standard care. |
| Blinding of outcome assessment (detection bias) All outcomes | Unclear risk | Hospitalisation based on hospital records. Blinding not reported. Quality of life self reported. |
| Incomplete outcome data (attrition bias) All outcomes | Unclear risk | Number randomised not clearly reported, as authors declared that "Clients who withdrew from the study within the first 6 months were replaced by other clients". |
| Selective reporting (reporting bias) | High risk | Outcome length of hospitalisation reported incompletely (no SD). |
| Other bias | Low risk | No details. No evidence of the presence of other bias. |
Okpaku‐Tennessee 1997.
| Methods | Allocation: randomised. Design: single centre. Duration*: 4 months. Country: Nashville, Tennessee, USA. | |
| Participants | Diagnosis**: mental illness causing significant impairment. No further information provided. N = 152. Setting: urban mental health centres. Age: 18 to 55 years, mean ˜ 36.8 years (SD 9.1). Sex: 59% M. Ethnicity: 40% non‐white. History: i. clients of mental health centres, ii. serious mental illness as judged by eligibility for disability benefits. | |
| Interventions | 1. ICM***: employment‐oriented case management provided by psychiatric vocational rehabilitation specialists, supervised by the multidisciplinary team, vocational rehabilitation specialists. Caseload: 1:10. N = 73. 2. Non‐ICM: standard case management services from CMHC. Caseload: 1:40 to 90. N = 79. |
|
| Outcomes | Global state: leaving the study early. Unable to use ‐ Service use: admission data (not reported). Social functioning: employment status (data are reported referring to the full trial length, although intervention was provided for only first 4 months)*. Costs: insufficient data reported. |
|
| Notes | *Variable follow‐up period ‐ all received 4 months' intervention and one 3‐month follow‐up interview, some participants were followed up for as long as 24 months (intervention duration was 4 months). We reported data from only 4 months' follow‐up. **Schizophrenia 23%, mood disorder 21%, 33% no current diagnosis according to SCID diagnostic criteria. ***The psychiatric vocational rehabilitation specialist intervention was provided for 4 months. The project specialist engaged the clients in therapeutic and rehabilitation activities and assisted mental health workers to obtain services more expeditiously, the psychiatrist was available 24 hours a day for consultation. | |
| Risk of bias | ||
| Bias | Authors' judgement | Support for judgement |
| Random sequence generation (selection bias) | Unclear risk | Randomised. No further details. |
| Allocation concealment (selection bias) | Unclear risk | No details |
| Blinding (performance bias and detection bias) All outcomes | Unclear risk | Primary outcome: not available. Secondary outcome: clinician/participant mediated ‐ rating ‐ Unclear. |
| Blinding of participants and personnel (performance bias) All outcomes | Unclear risk | Blinding not reported. |
| Blinding of outcome assessment (detection bias) All outcomes | High risk | Hospitalisation, employment, income, illegal activity self reported. |
| Incomplete outcome data (attrition bias) All outcomes | Unclear risk | Insufficient reporting of attrition/exclusion to permit judgement (number for missing to follow‐up is reported, but reason is not reported). |
| Selective reporting (reporting bias) | High risk | More listed outcomes of interest are reported incompletely. |
| Other bias | Low risk | Publicly funded (grant from the Social Security Administration). No further details. No evidence of the presence other bias. |
OPUS‐Denmark 1999.
| Methods | Allocation: randomised.
Design: multicentre (5 centres, in Copenhagen and Aarhus, data not available for single centres).
Duration: 24 months of active treatments after randomisation. Follow‐up: 5 and 10 years after randomisation (i.e. 3 and 8 years after the active intervention was provided). Starting from 2 years after randomisation, all participants received standard care (both those randomised to the experimental intervention and those randomised to standard care). Country: Copenhagen and Aahrus, Denmark. |
|
| Participants | Diagnosis*: schizophrenia or schizophrenia‐like psychosis (according to ICD‐10) (main diagnosis and comorbidity based on SCAN 2.0 and SCAN 2.1). N = 547. Setting: public mental health service. Age: 18 to 45 years, mean 26.6 years. Sex: 59% M (323M, 224F). Ethnicity: not reported. History**: i. prior treatment of mental disorder has not been adequate (i.e. ≦ 12 weeks of continuous antipsychotic medication in antipsychotic dosage), ii. absence of learning disability, organic mental disorder, and psychotic condition due to psychoactive substance use, iii. Danish speaker, iv. written informed consent, v. legal residence in the catchment area, vi. the use of psychoactive drug did not cause exclusion. | |
| Interventions | 1. ICM***: modified Assertive Community Treatment (including individual case manager, recommendation of antipsychotic medications, psycho‐educational family treatment****, and social skill training). Caseload: 1:15. N = 275. 2. Standard care***: treatment in a CMHC. Caseload: 1:20‐30. N = 272. | |
| Outcomes | Service use: average number of days in hospital per month; not in contact with service, defined as "an unplanned break of at least 30 days in treatment or between treatment regimens or status (i.e. from discharge to outpatient status)"; admitted to hospital (during previous 12 months); proportion not hospitalised; proportion without outpatient contacts; proportion without psychiatric emergency room contacts.
Death: all causes, suicide.
Global state: leaving the study early.
Social functioning: not working or in education, not living independently, alcohol and drug abuse diagnosed with SCAN, contact with the legal system ‐ imprisonment (2‐year treatment and 3‐year follow‐up), number of days in supported housing, number of days in a homeless shelter.
Mental state, specific symptoms: positive symptoms (Scale for Assessment of Positive Symptoms ‐ SAPS), negative symptoms (Scale for Assessment of Negative Symptoms ‐ SANS), comorbidity with depression.
Participant satisfaction: Client Satisfaction Questionnaire (CSQ).
Behaviour: specific behaviour, self harm (measured by self reporting of suicide attempts). Unable to use ‐ Global state: compliance with medications: defined "good compliance" as having taken the prescribed antipsychotic medications in the recommended doses regularly during previous 3 months (not reported), GAF (reported only subscale data, not global score). Social functioning: Social Network Size (not published measure instrument), Social Network Schedule (SNS); various outcomes on accomodation status (as proportion spending at least 1 day in supported housing or in homeless shelter): not listed as a review outcome of interest. Mental state, specific symptoms: disorganised dimension (not stated how it is measured) and suicidal ideation (not listed as a review outcome of interest). Quality of life: not reported. Participant satisfaction: Camberwell Assessment of Need (CAN) (not reported). Relative satisfaction: Client Satisfaction Questionnaire 8‐item, adapted version (not reported). Behaviour: Social Behaviour Assessment Schedule (SBAS) (reported only score on subscale). Use of coercive measure: not listed as a review outcome of interest. Assessment of expressed emotion: not listed as a review outcome of interest. |
|
| Notes | *Schizophrenia 66%; schizotypal disorder ˜ 15%; schizoaffective disorder ˜ 5%. **Median duration of untreated psychosis ˜ 50 weeks. ***In both interventions use of antipsychotics followed the guidelines from the Danish Psychiatry Society (recommending a low‐dose strategy for patients with first‐episode psychosis and the use of second‐generation drugs as first choice). ****Family treatment followed McFarlane's manual for psychoeducational treatment for multiple‐family group (18 months' treatment, 1.5 hours twice a week, in a multiple‐family group with 2 therapists and 4 to 6 patients with their families). Focus on problem solving and development of skills to cope with illness. | |
| Risk of bias | ||
| Bias | Authors' judgement | Support for judgement |
| Random sequence generation (selection bias) | Low risk | Randomised. In Copenhagen, allocation sequence was computer generated. In Aahrus, a secretary drew a lot among 5 red and 5 white lots from a black box. Central randomisation. Randomisation was 1:1, in block of 6, stratified for each of the 5 centres. |
| Allocation concealment (selection bias) | Low risk | In Copenhagen, randomisation was carried out through centralised telephone allocation. In Aahrus, researchers were informed on the randomisation assignment after they had finished the entry assessment. Block sizes were unknown to investigator. |
| Blinding (performance bias and detection bias) All outcomes | Unclear risk | Primary outcome: clinician/participant mediated ‐ rating ‐ Unclear. Secondary outcome: those interviewer rated ‐ rating ‐ No. Reported: "Investigators were not blind to treatment allocation". |
| Blinding of participants and personnel (performance bias) All outcomes | High risk | Problematic to blind participants and those providing the intervention in studies comparing ICM intervention with standard care. |
| Blinding of outcome assessment (detection bias) All outcomes | Unclear risk | Service use based on official registers, blinding not reported. Interviewers for mental state unblinded. Client satisfaction, suicide attempts, and suicidal ideation self reported. |
| Incomplete outcome data (attrition bias) All outcomes | Low risk | Numbers and reasons for missing data are clearly reported. Analysis was conducted on an ITT basis. |
| Selective reporting (reporting bias) | High risk | Authors reported change of primary outcome stated in the protocol (from "relapse and positive symptoms" to "psychotic and negative symptoms"), as high attrition occurred in the former outcome measurements. Some listed outcomes of interest are not reported. |
| Other bias | Low risk | Publicly funded. No declaration of interest. No further details. No evidence of the presence of other bias. |
Pique‐California 1999.
| Methods | Allocation: randomised. Design: single centre. Duration: 24 months. Country: San Francisco, USA. | |
| Participants | Diagnosis: severe and persistent mental illness (psychiatric disorder as the primary source of disability). N = 37. Setting: Department of Psychiatry, San Francisco General Hospital. Age: ≧ 18 years. Sex: not reported. Ethnicity: European (understood to be white) or African‐American. History: high user of intensive treatment care who had experienced an unsatisfactory quality of life in the community, i. recently hospitalised; ii. no primary diagnosis of (a) organic brain disease, (b) substance abuse disorder with no other psychiatric disorder, or (c) learning disability; iii. no history of violence not due to treatable psychiatric symptoms; iv. written informed consent. | |
| Interventions | 1. ICM: standard care + Assertive Community Treatment according to Stein and Test model, culturally focused on needs of Afro‐American population. Caseload: 1:10. N = 22. 2. Standard care: Caseload: 1:30. N = 15. | |
| Outcomes | Global state: leaving the study early. Unable to use ‐ Service use: average number of days in hospital per month (not reported). Global functioning: GAF (attrition 57%). Costs: reported incompletely (no mean, no SD). |
|
| Notes | ||
| Risk of bias | ||
| Bias | Authors' judgement | Support for judgement |
| Random sequence generation (selection bias) | Low risk | Randomised. Stratified by sex, ethnicity, recruitment centre, assignment to intervention 2:1. Randomisation sequence constructed by independent investigator using a table of random permutation. |
| Allocation concealment (selection bias) | Unclear risk | Randomisation sequence in sealed, opaque envelopes, unused assignment envelopes kept in a locked container (available to the recruiter psychiatrists). |
| Blinding (performance bias and detection bias) All outcomes | Unclear risk | Primary outcome: not available. Secondary outcome: clinician/participant mediated ‐ rating ‐ Unclear. |
| Blinding of participants and personnel (performance bias) All outcomes | High risk | Problematic to blind participants and those providing the intervention in studies comparing ICM intervention with standard care. |
| Blinding of outcome assessment (detection bias) All outcomes | Unclear risk | Service use data were obtained from the county database. Costs were obtained from billing records. Blinding not reported. |
| Incomplete outcome data (attrition bias) All outcomes | Unclear risk | Author did not address this outcome. Reasons for missing outcome data not reported. |
| Selective reporting (reporting bias) | High risk | Listed outcome of interest reported incompletely (costs: no mean, no SD). |
| Other bias | Low risk | No details. No evidence of the presence of other bias. |
Quinlivan‐California 1995.
| Methods | Allocation: randomised. Design: single centre. Duration: 24 months. Country: San Diego, California, USA. | |
| Participants | Diagnosis*: major disorder DSM‐III‐R axis I. N = 90. Setting: San Diego County Mental Health Service. Age: > 18 years, 33% > 40 years, mean ˜ 37 years. Sex: 44% M (40M, 50F). Ethnicity: 43% non‐white (18% African‐American). History: ≧ 3 hospitalisations last 2.5 years. | |
| Interventions | 1. ICM: Assertive Community Treatment according to Stein and Test model. Caseload: 1:15. N = 30. 2. Non‐ICM: traditional CM programme, no team approach. Caseload: 1:40‐60. N = 30. 3. Standard care: services offered by the public mental health system. N = 30. | |
| Outcomes | Service use: average number of days in hospital per month.
Costs: direct costs of psychiatric hospital care. Unable to use ‐ Service use: other service use than hospital (reported incompletely). Global state: leaving the study early (not reported). Costs: direct costs of other psychiatric care (outcomes relevant to this review not directly examined). |
|
| Notes | *56% schizophrenia; 23% bipolar disorder. This is a 3‐arm study, data from the study are included in both comparisons addressed by the review: ICM versus non‐ICM and ICM versus standard care. |
|
| Risk of bias | ||
| Bias | Authors' judgement | Support for judgement |
| Random sequence generation (selection bias) | Unclear risk | Randomised, no further details. |
| Allocation concealment (selection bias) | Unclear risk | No information |
| Blinding (performance bias and detection bias) All outcomes | Unclear risk | Primary outcome: clinician/participant mediated ‐ rating ‐ Unclear. Secondary outcomes: ‐ rating ‐ Yes. No information provided, but available outcomes are not likely to be influenced by lack of blinding. |
| Blinding of participants and personnel (performance bias) All outcomes | Unclear risk | Blinding not reported. |
| Blinding of outcome assessment (detection bias) All outcomes | Low risk | Hospitalisation data were obtained from the county mental health services division's management information system. Costs were based on budgeted unit cost of each service multiplied by the total number of units as reported in the management information system. |
| Incomplete outcome data (attrition bias) All outcomes | Unclear risk | The study did not address this outcome. |
| Selective reporting (reporting bias) | Low risk | Listed outcomes of interest are reported completely. |
| Other bias | Low risk | No data provided. No evidence of the presence of other bias. |
REACT‐UK 2002.
| Methods | Allocation: randomised.
Design: multicentre (2 centres, information for single centre not available).
Duration: 18 months. During this period, participants remained allocated in their trial arm. Follow‐up: 36 months and 10 years after randomisation (i.e. 18 months and 8.5 years after the active intervention was provided). During the follow‐up period, participants could remain in the originally allocated intervention (ICM) or be transferred to the control one. Country: London, UK. |
|
| Participants | Diagnosis*: SMI (schizophrenia, schizoaffective disorder, other chronic psychosis, bipolar affective disorder). N = 251. Setting: community services in 2 inner London boroughs (Camden and Islington). Age: mean 39 years (SD 11). Sex: 58% M. Ethnicity: African‐Caribbean 36%. History: i. living independently or in low‐supported accomodation, ii. under the care of CMHT ≧ 12 months and having difficulty engaging with standard community care, iii. recent high use of inpatient care (i.e. ≧ 100 consecutive inpatient days or ≧ 5 admissions during previous 2 years, or ≧ 50 consecutive inpatient days or ≧ 3 admissions previous 1 year), iv. substance misuse or personality disorder eligible if these were secondary diagnosis, v. no organic brain damage. | |
| Interventions | 1. ICM: Assertive Community Treatment (as described by McGrew 1995). Caseload: 1:12. N = 127. 2. Non‐ICM: services offered by CMHT (according to Care Programme Approach). Caseload: 1:35. N = 124. | |
| Outcomes | Service use: average number of days in hospital per month, not remaining in contact with psychiatric services (defined as no face‐to‐face contacts between staff and client in previous 3 months), average admission, admitted to hospital.
Death: all causes and suicide.
Global state: leaving the study early, Health of the Nation Outcome Scale (HoNOS), Rating of Medication Influence scale (ROMI).
Social functioning: arrested, imprisoned, number homeless, living independently, living in supported accomodation, Life Skill Profile (LSP), substance abuse: assessed through various scales (Alcohol Use Scale ‐ AUS, Drug Use Scale ‐ DUS, Substance Abuse Treatment Scale ‐ SATS), but reported as binary outcome.
Mental state: Brief Psychiatric Rating Scale (BPRS‐24 item).
Behaviour: self harm, injury to others.
Quality of life: Manchester Short Assessment of Quality of Life (MANSA).
Participant satisfaction: Client Satisfaction Questionnaire modified version (CSQ‐modified), Camberwell Assessment Need abbreviated form (CAN). Unable to use ‐ Use of Mental Health Act (not listed as review outcome of interest). Quality of engagement: adapted form of Homeless Engagement Acceptance Scale (HEAS) (not listed as review outcome of interest). |
|
| Notes | *53% schizophrenia; 13% schizoaffective; 4% bipolar; 26% illicit drug misuse; 25% alcohol misuse. | |
| Risk of bias | ||
| Bias | Authors' judgement | Support for judgement |
| Random sequence generation (selection bias) | Low risk | Randomised: permuted block randomisation with a block size of 8 ensuring parity between CMHT in proportions randomised to ICM. |
| Allocation concealment (selection bias) | Low risk | The interviewer contacted an administrator at the trial centre who opened the appropriate numbered envelope communicating the outcome of randomisation. Participants and referrers were informed of the treatment assignment by letter. |
| Blinding (performance bias and detection bias) All outcomes | Unclear risk | Primary outcome: clinician/participant mediated ‐ rating ‐ Unclear. Secondary outcomes: interviewer rated ‐ rating ‐ No. Interviewers were independent of clinical care, but not blind. |
| Blinding of participants and personnel (performance bias) All outcomes | Unclear risk | Blinding not reported. |
| Blinding of outcome assessment (detection bias) All outcomes | High risk | Source of service use data not reported. Self harm, violence, contact with legal services, quality of life, compliance with medication, and mental state were obtained from interviews with clients. Other scales were completed by care co‐ordinators. All additional data were collected from case notes. Assessors not blinded. |
| Incomplete outcome data (attrition bias) All outcomes | Low risk | YES ‐ Primary outcomes: average number of days in hospital per month. No missing data (except death, balanced in numbers across groups). YES ‐ Secondary outcomes: number and reasons for missing data are reported. Analysis carried out on an ITT basis. |
| Selective reporting (reporting bias) | Low risk | All of the listed outcomes of interest are completely reported. |
| Other bias | Low risk | Publicly funded (Camden and Islington Health Authority; King's Fund; Department of Health). Competing interesting declared: none. No further details. No evidence of the presence of other bias. |
Rosenheck‐USA 1993.
| Methods | Allocation: randomised. Design: multicentre. 10 sites: 6 General Medical and Surgical centres (GMS) and 4 Neuropsychiatric (NP) centres. Data available both for single centre and for 2 pooled centre groups (GMS and NP). See below. Duration: 24 months. Country: Northeastern United States | |
| Participants | Diagnosis*: primary psychiatric disorder. N = 873. Setting: community‐based psychiatric care ‐ Department of Veterans Affairs (VA). Age: 48% > 45 years, mean 47.6 years. Sex: 100% M. Ethnicity: 20% non‐white. History: i. current inpatient in VA psychiatric unit, ii. no primary diagnosis of substance abuse or organic brain disease, iii. recent high user of psychiatric care (definition varied between GMS and NP centres), iv. written consent. | |
| Interventions | 1. ICM: Intensive Psychiatric Community Care programme, providing ACT intervention according to Stein and Test model. Caseload: average 1:7‐15. N = 454. 2. Standard care**: routine care from psychiatric services provided by Veterans Affairs, including inpatient and outpatient psychiatric treatment, psychopharmacological treatment, and rehabilitation service. N = 419. | |
| Outcomes | Service use: average number of days in hospital per month (both pooled data for GMS and NP centres and data for single centre available; see below)***.
Global state: GAS (authors reported results pooled for GMS and NP centres; see below).
Mental state: BPRS‐18 item, BSI (authors reported results pooled for GMS and NP centres; see below).
Costs: total healthcare cost (authors reported results pooled for GMS and NP centres; see below). Unable to use ‐ Global state: self reported measure (not published, not peer reviewed). Participant satisfaction: satisfaction with service (measurement instrument not published, not peer reviewed). Social functioning: Addiction Severity Index (ASI) (reported only a subscale, not the overall score). Costs: non‐healthcare costs (not listed as an outcome of interest in the review). |
|
| Notes | *Schizophrenia 50.5%, dual diagnosis 28%, bipolar disorder 10%. **Standard care provided by both types of centre did not differ programme wise. ***Pooled data for GMS and NP entered the meta‐analysis; data for single centre entered in meta‐regression. | |
| Risk of bias | ||
| Bias | Authors' judgement | Support for judgement |
| Random sequence generation (selection bias) | Low risk | Randomised through coin tossing. |
| Allocation concealment (selection bias) | Unclear risk | No details (reported only that the assignment by coin tossing was performed by an independent researcher). |
| Blinding (performance bias and detection bias) All outcomes | Unclear risk | Primary outcome: clinician/participant mediated ‐ rating ‐ Unclear. Secondary outcomes: interviewer rated ‐ rating ‐ Unclear. Authors report that interviewers are independent, but it is not stated whether they are blind to participant assignment. |
| Blinding of participants and personnel (performance bias) All outcomes | High risk | Problematic to blind participants and those providing the intervention in studies comparing ICM intervention with standard care. |
| Blinding of outcome assessment (detection bias) All outcomes | Unclear risk | Service use (hospital and nursing home service use) was derived from the VA's national computerised workload monitoring systems. Blinding not reported. Costs were determined using VA's standardised Cost Distribution Report. |
| Incomplete outcome data (attrition bias) All outcomes | Unclear risk | The study did not address this outcome. |
| Selective reporting (reporting bias) | High risk | Some listed outcomes of interest are not reported completely (i.e. substance abuse, which is reported only as a subscale score and not general score). |
| Other bias | Low risk | No details. No evidence of the presence of other bias. |
Rosenheck‐USA‐GMS.
| Methods |
Rosenheck‐USA‐GMS refers to 6 General Medical and Surgical centres (GMS) pooled together (centre A, B, D, F, I, J). Methods: see above Rosenheck‐USA 1993. |
|
| Participants | Participants: see above Rosenheck‐USA 1993. Following data are specific for Rosenheck‐USA‐GMS: N = 528. Setting: Department of Veterans Affairs (VA) ‐ 6 GMS centres enrolled in the Intensive Psychiatric Community Care programme. GMS centres are located in urban centres, provide shorter‐term, crisis‐oriented, inpatient care. History: i. current inpatient in VA psychiatric unit, ii. no primary diagnosis of substance abuse or organic brain disease, iii. recent high user of psychiatric care (defined as i. ≧ 40 days in hospital or ii. ≧ 2 admissions in the previous year), iv. written consent. |
|
| Interventions | 1. ICM*: Intensive Psychiatric Community Care programme, providing ACT intervention according to Stein and Test model. Caseload: average 1:7‐15. N = 271. 2. Standard care: routine care from psychiatric services provided by Veterans Affairs, including inpatient and outpatient psychiatric treatment, psychopharmacological treatment, and rehabilitation service. N = 257. | |
| Outcomes | Service use: average number of days in hospital per month**. Global state: GAS. Mental state: BPRS‐18 item, BSI. Costs: costs of health care. | |
| Notes | *Centre J: caseload 1:44. **Entered in the meta‐analysis. | |
Rosenheck‐USA‐GMS (A).
| Methods |
Rosenheck‐USA‐GMS (A) is a GMS centre. Methods: see above Rosenheck‐USA 1993 and Rosenheck‐USA‐GMS. |
|
| Participants | Participants: see above Rosenheck‐USA 1993 and Rosenheck‐USA‐GMS. N = 79. |
|
| Interventions | Interventions: see above Rosenheck‐USA 1993 and Rosenheck‐USA‐GMS. 1. ICM: N = 44. 2. Standard care: N = 35. |
|
| Outcomes | Service use: average number of days in hospital per month*. | |
| Notes | *Entered in the meta‐regression. | |
Rosenheck‐USA‐GMS (B).
| Methods |
Rosenheck‐USA‐GMS (B) is a GMS centre. Methods: see above Rosenheck‐USA 1993 and Rosenheck‐USA‐GMS. |
|
| Participants | Participants: see above Rosenheck‐USA 1993 and Rosenheck‐USA‐GMS. N = 94. |
|
| Interventions | Interventions: see above Rosenheck‐USA 1993 and Rosenheck‐USA‐GMS. 1. ICM: N = 47. 2. Standard care: N = 47. |
|
| Outcomes | Service use: average number of days in hospital per month*. | |
| Notes | *Entered in the meta‐regression. | |
Rosenheck‐USA‐GMS (D).
| Methods |
Rosenheck‐USA‐GMS (D) is a GMS centre. Methods: see above Rosenheck‐USA 1993 and Rosenheck‐USA‐GMS. |
|
| Participants | Participants: see above Rosenheck‐USA 1993 and Rosenheck‐USA‐GMS. N = 102. |
|
| Interventions | Interventions: see above Rosenheck‐USA 1993 and Rosenheck‐USA‐GMS. 1. ICM: N = 49. 2. Standard care: N = 53. |
|
| Outcomes | Service use: average number of days in hospital per month*. | |
| Notes | *Entered in the meta‐regression. | |
Rosenheck‐USA‐GMS (F).
| Methods |
Rosenheck‐USA‐GMS (F) is a GMS centre. Methods: see above Rosenheck‐USA 1993 and Rosenheck‐USA‐GMS. |
|
| Participants | Participants: see above Rosenheck‐USA 1993 and Rosenheck‐USA‐GMS. N = 78. |
|
| Interventions | Interventions: see above Rosenheck‐USA 1993 and Rosenheck‐USA‐GMS. 1. ICM: N = 43. 2. Standard care: N = 35. |
|
| Outcomes | Service use: average number of days in hospital per month*. | |
| Notes | *Entered in the meta‐regression. | |
Rosenheck‐USA‐GMS (I).
| Methods |
Rosenheck‐USA‐GMS (I) is a GMS centre. Methods: see above Rosenheck‐USA 1993 and Rosenheck‐USA‐GMS. |
|
| Participants | Participants: see above Rosenheck‐USA 1993 and Rosenheck‐USA‐GMS. N = 88. |
|
| Interventions | Interventions: see above Rosenheck‐USA 1993 and Rosenheck‐USA‐GMS. 1. ICM: N = 44. 2. Standard care: N = 44. |
|
| Outcomes | Service use: average number of days in hospital per month*. | |
| Notes | *Entered in the meta‐regression. | |
Rosenheck‐USA‐NP.
| Methods |
Rosenheck‐USA‐NP refers to 4 Neuropsychiatric centres (NP) pooled together (centre C, E, G, H). Methods: see above Rosenheck‐USA 1993. |
|
| Participants | Participants: see above Rosenheck‐USA 1993. Following data are specific for Rosenheck‐USA‐NP: N = 345. Setting: Department of Veterans Affairs (VA) ‐ 4 NP centres enrolled in the Intensive Psychiatric Community Care programme. NP centres are large facilities providing long‐term mental health care in suburban or rural settings. History*: i. current inpatient in VA psychiatric unit, ii. no primary diagnosis of substance abuse or organic brain disease, iii. recent high user of psychiatric care (defined as i. ≧ 180 days in hospital or ii. ≧ 4 admissions in the previous year), iv. written consent. |
|
| Interventions | 1. ICM: Intensive Psychiatric Community Care programme, providing ACT intervention according to Stein and Test model. Caseload: average 1:7‐15. N = 183. 2. Standard care: routine care from psychiatric services provided by Veterans Affairs, including inpatient and outpatient psychiatric treatment, psychopharmacological treatment, and rehabilitation service. N = 162. | |
| Outcomes | Service use: average number of days in hospital per month**. Global state: GAS. Mental state: BPRS‐18 item, BSI. Costs: direct costs of health care. | |
| Notes | *Characteristic at baseline differs between NP sites regarding inpatient days before programme entry. Difference was attributable to site C. To compensate for this imbalance, the authors made an adjustment. The adjusted value was used in all the calculations, but the results they yielded did not differ substantially from those obtained with unadjusted value. **Entered in the meta‐analysis. | |
Rosenheck‐USA‐NP (C).
| Methods |
Rosenheck‐USA‐NP (C) is a NP centre. Methods: see above Rosenheck‐USA 1993 and Rosenheck‐USA‐NP. |
|
| Participants | Participants: see above Rosenheck‐USA 1993 and Rosenheck‐USA‐NP. N = 93. |
|
| Interventions | Interventions: see above Rosenheck‐USA 1993 and Rosenheck‐USA‐NP. 1. ICM: N = 50. 2. Standard care: N = 43. |
|
| Outcomes | Service use: average number of days in hospital per month*. | |
| Notes | *Entered in the meta‐regression. | |
Rosenheck‐USA‐NP (E).
| Methods |
Rosenheck‐USA‐NP (E) is a NP centre. Methods: see above Rosenheck‐USA 1993 and Rosenheck‐USA‐NP. |
|
| Participants | Participants: see above Rosenheck‐USA 1993 and Rosenheck‐USA‐NP. N = 67. |
|
| Interventions | Interventions: see above Rosenheck‐USA 1993 and Rosenheck‐USA‐NP. 1. ICM: N = 34. 2. Standard care: N = 33. |
|
| Outcomes | Service use: average number of days in hospital per month*. | |
| Notes | *Entered in the meta‐regression. | |
Rosenheck‐USA‐NP (G).
| Methods |
Rosenheck‐USA‐NP (G) is a NP centre. Methods: see above Rosenheck‐USA 1993 and Rosenheck‐USA‐NP. |
|
| Participants | Participants: see above Rosenheck‐USA 1993 and Rosenheck‐USA‐NP. N = 71 |
|
| Interventions | Interventions: see above Rosenheck‐USA 1993 and Rosenheck‐USA‐NP. 1. ICM: N = 40. 2. Standard care: N = 31. |
|
| Outcomes | Service use: average number of days in hospital per month*. | |
| Notes | *Entered in the meta‐regression. | |
Rosenheck‐USA‐NP (H).
| Methods |
Rosenheck‐USA‐NP (H) is a NP centre. Methods: see above Rosenheck‐USA 1993 and Rosenheck‐USA‐NP. |
|
| Participants | Participants: see above Rosenheck‐USA 1993 and Rosenheck‐USA‐NP. N = 114. |
|
| Interventions | Interventions: see above Rosenheck‐USA 1993 and Rosenheck‐USA‐NP. 1. ICM: N = 59. 2. Standard care: N = 55. |
|
| Outcomes | Service use: average number of days in hospital per month*. | |
| Notes | *Entered in the meta‐regression. | |
Salkever‐SCarolina 1999.
| Methods | Allocation: randomised. Design: single centre. Duration: 18 months. Country: Charleston, South Carolina, USA. | |
| Participants | Diagnosis*: schizophrenia, schizoaffective disorder, bipolar disorder or other psychotic disorder (DSM‐III‐R). N = 173. Setting: Charleston and Darchester CMHCs. Age: 18 to 65 years, mean ≃ 35.5 yrs. Sex: 54.8% M. (N = 114). Ethnicity: 62.5% non‐white. (N = 114). History: i. history or high risk for high services use patterns (i.e. long‐term or multiple hospitalisation), ii. difficulty with treatment compliance, independent living, or activities of daily living, iii. no primary diagnosis of personality disorder or substance abuse or organic brain syndrome, iv. no need for 24‐hour supervision, v. no assault behaviour in the previous year not associated with psychosis. | |
| Interventions | 1. ICM**: Programme of Assertive Community Treatment (PACT) provided by 2 different locations (treatment based in CMHC and treatment run by nonprofit organisation located near CMHC). Caseload: ranging during the trial duration from 1:6.5 to 1:13. N = 104. 2. Non‐ICM: standard care from CMHC, providing primarily office‐based case management programme. Caseload: decreased during the trial duration from 1:68 to 1:34. N = 69. | |
| Outcomes | Service use: average number of days in hospital per month***; admitted to hospital.
Global state: leaving the study early. Unable to use ‐ Costs: direct costs of psychiatric hospital care (no SD). |
|
| Notes | *N = 114, 81.5% schizophrenia or schizoaffective disorder, 50.8% secondary diagnosis of substance abuse disorder. **PACT provided by the 2 sites did not differ. ***Variance not reported ‐ data from another study used. | |
| Risk of bias | ||
| Bias | Authors' judgement | Support for judgement |
| Random sequence generation (selection bias) | Unclear risk | Randomised. No further details. |
| Allocation concealment (selection bias) | Unclear risk | No details |
| Blinding (performance bias and detection bias) All outcomes | Unclear risk | Primary outcome: clinician/participant mediated ‐ rating ‐ Unclear. Secondary outcomes: clinician/participant mediated ‐ rating ‐ Unclear. |
| Blinding of participants and personnel (performance bias) All outcomes | Unclear risk | No details |
| Blinding of outcome assessment (detection bias) All outcomes | Unclear risk | No details |
| Incomplete outcome data (attrition bias) All outcomes | Unclear risk | Insufficient reporting of missing data (number for missing data is provided, but reason is provided for the whole sample, is not stated for single intervention group). |
| Selective reporting (reporting bias) | High risk | Listed outcomes of interest are fully reported, but any variance measurements are missing. |
| Other bias | Low risk | Publicly funded (by NIMH and grant from universities and university centres for research). No further details. No evidence of the presence of other bias. |
Shern‐USA1 2000.
| Methods | Allocation: randomised. Design: single centre. Duration: 24 months. Country: New York, USA. | |
| Participants | Diagnosis*: severe mental illness causing severe disability (definition not clearly reported). N = 168. Setting: community services. Age: ≧ 18 years, mean ˜ 40 years, range 21 to 66 years. Sex: 76% M (128M, 40F). Ethnicity: 61% black (understood to be African‐American). History: i. homeless for 7 of last 14 nights, ii. no primary diagnosis of substance abuse or learning disability, iii. not considered dangerous to self or others, iv. informed consent given. | |
| Interventions | 1. ICM: from the CHOICE programme, which aims to develop "housing readiness" (i.e. compliance with psychiatric treatment and period of sobriety). The main features are: i. drop‐in centre, ii. Case Management intervention modelled according to main principles of the ACT model. Caseload: ˜ 1:13. N = 91. 2. Standard care**: homelessness and specialty mental health services provided from a variety of agencies (including drop‐in centres, outreach services, mental health and health services, soup kitchen, shelters). It could involve non‐ICM. N = 77. | |
| Outcomes | Social functioning: not living in stable accomodation.
Mental state: Colorado Symptom Index.
Quality of Life: Lehman's Quality of life Index (QOLI). Unable to use ‐ Service use: hospital use (data partially reported). Social functioning: police contact ‐ imprisoned, arrested (data partially reported), change in proportion of time spent in residential setting (incompletely reported). Self esteem: Rosenberg's Self Esteem Scale (not peer reviewed). Coping: Pearlin and Schooler's Mastery Scale (not listed as a review outcome of interest). Participant satisfaction: unmet needs (measurement instrument not described). |
|
| Notes | *˜ 9% no major mental illness. **People randomised to standard care were just "provided informations by the research interviewers about local homelessness service programmes". No attempts were made to arrange the first contact to available local services. | |
| Risk of bias | ||
| Bias | Authors' judgement | Support for judgement |
| Random sequence generation (selection bias) | Unclear risk | Randomised. No further details. |
| Allocation concealment (selection bias) | Unclear risk | No details |
| Blinding (performance bias and detection bias) All outcomes | High risk | Primary outcome: not provided. Secondary outcomes: interviewer mediated ‐ rating ‐ No. Not clearly stated, but it is implicitly not blind. |
| Blinding of participants and personnel (performance bias) All outcomes | High risk | Problematic to blind participants and those providing the intervention in studies comparing ICM intervention with standard care. |
| Blinding of outcome assessment (detection bias) All outcomes | High risk | Service use and housing status were assessed in face‐to face interviews, protocols were used. Interviewers not blinded. |
| Incomplete outcome data (attrition bias) All outcomes | Unclear risk | Authors declared "using alternative techniques for accommodate missing observations". Our main concern was regarding the high attrition rate the authors declared, but was not clearly reported as presented data were already transformed through statistician techniques accounting for missing observation. |
| Selective reporting (reporting bias) | High risk | Some listed outcomes of interest are not usable due to incomplete reporting (service use, social functioning, quality of life outcomes). |
| Other bias | Low risk | Publicly funded (NIMH). No further details. No evidence of the presence of other bias. |
Solomon‐Pennsylvania 1994.
| Methods | Allocation: randomised.
Design: single centre.
Duration: 12 months.
Country: Philadelphia, Pennsylvania, USA. Not entering meta‐regression. |
|
| Participants | Diagnosis*: seriously mentally ill (schizophrenia, affective or personality disorder according to DSM‐III‐R). N = 200. Setting: CMHC. Age: mean 35.2 years (SD 9.4). Sex: 86.5% M. Ethnicity: Afro‐American 81% History: i. about to be released from prison, ii. homeless (i.e. situational, episodically, or chronically without a domicile or if jail detention resulted in the loss of a stable housing situation), iii. state hospitalisation ≧ 60 days in previous 2 years or a significant amount of outpatient treatment, iv. GAF ≦ 40 or GAF ≦ 60 if age ≦ 35 years, v. written informed consent. | |
| Interventions | 1**. ICM: Assertive Community Treatment according to the Stein and Test model. Caseload: 1:8‐12. N = 60. 2**. ICM: Intensive Case Management provided from an individual forensic case manager who worked at CMHC, but as individual rather than as part of a treatment team. Caseload: not available. N = 60. 3. Standard care: from local CMHC (2 clients received ICM services at times during the year in the study). N = 80. | |
| Outcomes | Global state: leaving the study early.
Social functioning: imprisonment***. Unable to use ‐ Service use: days in hospital, hospitalisation (data not available); drug and alcohol use Addiction Severity Index (data not available); accomodation, employment, arrest (data not available), Pattison Psychosocial Network Inventory (data not available). Mental state: BPRS (data not available). Quality of life: Lehman's Quality of Life Interview (objective and subjective components). |
|
| Notes | *Schizophrenia 82.5%, major affective disorder 10%, other (unspecified psychotic disorder and personality disorder) 3%, substance abuse disorder 52%. N = 200. **We considered both arms as a single intervention. ***Attrition in the control group > 50%. | |
| Risk of bias | ||
| Bias | Authors' judgement | Support for judgement |
| Random sequence generation (selection bias) | Unclear risk | Randomised. Authors reported that "slightly higher number of clients were assigned to the control treatment", but it is not clear if it was a stratified randomisation. No further details provided. |
| Allocation concealment (selection bias) | Unclear risk | No details |
| Blinding (performance bias and detection bias) All outcomes | Unclear risk | Primary outcome: not available. Secondary outcome: clinician/participant mediated ‐ rating ‐ Unclear. |
| Blinding of participants and personnel (performance bias) All outcomes | High risk | Participants and personnel not blinded. |
| Blinding of outcome assessment (detection bias) All outcomes | Unclear risk | Blinding not reported. |
| Incomplete outcome data (attrition bias) All outcomes | Unclear risk | Incomplete reporting of missing data (number of missing data is reported, but reasons not provided). |
| Selective reporting (reporting bias) | High risk | Some listed outcomes of interest are not reported (i.e. service use, quality of life, etc.). |
| Other bias | Low risk | No evidence of the presence of other bias. |
Sytema‐Netherlands 1999.
| Methods | Allocation: randomised. Design: single centre. Duration*: follow‐up variable (minimum 12 months, maximum 24 months). Country: Netherlands. | |
| Participants | Diagnosis**: severe mental illness (diagnostic criteria not reported). N = 118***. Setting: rural catchment area, community mental health service. Age: mean ˜ 41.5 yrs (SD ˜ 11 years). Sex: 68.6% M. Ethnicity: not reported. History: Health of the Nation Outcome Scale (HoNOS) ≧ 15. | |
| Interventions | 1. ICM: ACT model according to a fidelity scale (DACTS). Caseload: 1:10. N = 59. 2. Standard care: provided by CMHT. Caseload: 1:40. N = 59. | |
| Outcomes | Service use: average number of days in hospital per month, not remaining in contact with psychiatric services (defined by authors as "not having any registered contact with the mental health services during the last 12 months of observation"), average number of admissions per month.
Death: all causes, suicide.
Social functioning: homeless at the end of the trial, average days per month in sheltered houses, Dartmouth Assessment of Lifestyle Interview (DALI).
Mental state: BPRS‐24 item.
Participant satisfaction: Client Satisfaction Questionnaire (CSQ), Camberwell Assessment of Needs Short Appraisal Schedule (CANSAS). Unable to use ‐ Social functioning: Social Functioning Scale (SFS) (data not clearly reported). |
|
| Notes | *Participant inclusion in the study started April 2004 and was closed at 1 June 2005. All participants were followed up until August 2006. **Schizophrenia 51.7%, major depression 13.5%, bipolar 3%. ***The number of participants randomised was 119, but 1 participant was excluded from sample because he or she moved to another area directly after randomisation. | |
| Risk of bias | ||
| Bias | Authors' judgement | Support for judgement |
| Random sequence generation (selection bias) | Low risk | Randomised, based on block design (block size of 5). |
| Allocation concealment (selection bias) | Low risk | Participant included in the study received ID number from service administration. The new ID number was emailed to a researcher who had a pre‐arranged list of ID numbers randomised. |
| Blinding (performance bias and detection bias) All outcomes | Unclear risk | Primary outcome: clinician/participant mediated ‐ rating ‐ Unclear. Secondary outcomes: interviewer rated ‐ rating ‐ No. Open‐label. |
| Blinding of participants and personnel (performance bias) All outcomes | High risk | Problematic to blind participants and those providing the intervention in studies comparing ICM intervention with standard care. |
| Blinding of outcome assessment (detection bias) All outcomes | Unclear risk | Blinding not reported. |
| Incomplete outcome data (attrition bias) All outcomes | Low risk | YES ‐ Primary outcomes: service use data. No missing data (but 1 participant excluded from sample because he or she moved to another area directly after randomisation). UNCLEAR ‐ Secondary outcomes: number of missing data is provided, but reasons not stated. |
| Selective reporting (reporting bias) | Low risk | All listed outcomes of interest are completely reported. |
| Other bias | Low risk | Publicly funded (grant from The Netherlands Organisation for Health Research and Development). No further details. No evidence of the presence of other bias. |
Test‐Wisconsin 1985.
| Methods | Allocation: randomised. Design: single centre. Duration: total duration of the trial 12 years, participants were followed at least 5 years, extended to 12 years for those who first entered the study. Some data available at 4 years, some at 24 months. Country: Dane County, Wisconsin, USA. | |
| Participants | Diagnosis*: schizophrenia or schizoaffective disorder (according to RDC), or schizotypal personality (according to DSM‐III). N = 122. Setting: CMHS. Age: 18 to 30 years. Sex: 67.2% M (82M, 40F). Ethnicity: white 95.9%. History**: i. resident of Dane County, ii. < 12 months total prior time spent in psychiatric and penal institutions, iii. no primary diagnosis of mental retardation, organic brain syndrome, or alcoholism, iv. informed consent. | |
| Interventions | 1. ICM: Assertive Community Treatment according to Stein and Test model. Caseload: ˜1:9. N = 75. 2. Standard care: routine care from Dane County psychiatric services ‐ included an unspecified degree of case management. N = 47. | |
| Outcomes | Service use: average number of days in hospital per month, not remaining in contact with psychiatric services, admitted to hospital.
Death: all causes, suicide.
Global state: leaving the study early.
Social functioning: number homeless or living in sheltered accomodation (at least 1 day), not living independently, imprisoned. Unable to use ‐ Mental state: BPRS, BSI (no data). Social functioning: days homeless (no SD), days in jail (no SD), Community Adjustment Form (scale not peer reviewed, no data). Quality of life: Satisfaction with Life Scale (scale not peer reviewed, no data). |
|
| Notes | *Schizophrenia 73.8%; schizoaffective disorder ˜ 23%. **Average age first contact with mental health system: 19.02 yrs. | |
| Risk of bias | ||
| Bias | Authors' judgement | Support for judgement |
| Random sequence generation (selection bias) | Unclear risk | Randomised (randomised assignment to experimental and control intervention on a ratio 6:4), no further details. |
| Allocation concealment (selection bias) | Unclear risk | No details |
| Blinding (performance bias and detection bias) All outcomes | Unclear risk | Primary outcome: clinician/participant mediated ‐ rating ‐ Unclear. Secondary outcomes: most are clinician/participant mediated ‐ rating ‐ Unclear. |
| Blinding of participants and personnel (performance bias) All outcomes | High risk | Problematic to blind participants and those providing the intervention in studies comparing ICM intervention with standard care. |
| Blinding of outcome assessment (detection bias) All outcomes | Unclear risk | Blinding not reported. |
| Incomplete outcome data (attrition bias) All outcomes | Unclear risk | Number and reasons for missing data are not clearly reported. |
| Selective reporting (reporting bias) | High risk | Listed outcomes of interest not reported or reported incompletely, BPRS and BSI (not reported), days in jail and days in hospital (no SD). |
| Other bias | Low risk | Publicly funded (grant by NIMH). No further details. No evidence of the presence of other bias. |
UK700‐UK (A).
| Methods | Centre: St. George's ‐ London. Methods: see above UK700‐UK 1999. |
|
| Participants | Participants: see above UK700‐UK 1999. N = 196. |
|
| Interventions | Methods: see above UK700‐UK 1999. Sample size providing data: 1. ICM: N = 96. 2. Non‐ICM: N = 99. |
|
| Outcomes | Service use: average number of days in hospital per month. | |
| Notes | ||
UK700‐UK (B).
| Methods | Centre: King's ‐ London. Methods: see above UK700‐UK 1999. |
|
| Participants | Participants: see above UK700‐UK 1999. N = 153. |
|
| Interventions | Methods: see above UK700‐UK 1999. Sample size providing data: 1. ICM: N = 77. 2. Non‐ICM: N = 74. |
|
| Outcomes | Service use: average number of days in hospital per month. | |
| Notes | ||
UK700‐UK (C).
| Methods | Centre: Manchester. Methods: see above UK700‐UK 1999. |
|
| Participants | Participants: see above UK700‐UK 1999. N = 158. |
|
| Interventions | Methods: see above UK700‐UK 1999. 1. ICM: N = 79. 2. Non‐ICM: N = 79. |
|
| Outcomes | Service use: average number of days in hospital per month. | |
| Notes | ||
UK700‐UK (D).
| Methods | Centre: St. Mary's* ‐ London. Methods: see above UK700‐UK 1999. |
|
| Participants | Participants: see above UK700‐UK 1999. N = 201. |
|
| Interventions | Methods: see above UK700‐UK 1999. Sample size providing data: 1. ICM: N = 99. 2. Non‐ICM: N = 101. |
|
| Outcomes | Service use: average number of days in hospital per month. | |
| Notes | *In St. Mary's centre staff were randomly assigned to ICM or non‐ICM position. | |
UK700‐UK 1999.
| Methods | Allocation: randomised. Design: multicentre (4 sites, 3 in London and 1 in Manchester). Duration: 24 months. Country: UK. | |
| Participants | Diagnosis*: psychotic illness (diagnosed through OPCRIT). N = 708. Setting: inner‐city mental health services. Age: 18 to 65 years, mean ˜ 37.3 years. Sex: 57% M (404M, 304F). Ethnicity: Afro‐Caribbean 28%. History: i. psychotic illness for at least 2 years, ii. ≧ 2 previous hospital admissions, 1 within past 2 years, iii. no organic brain disease or primary diagnosis of substance misuse, iv. written informed consent. | |
| Interventions | 1. ICM**: Caseload: 1:10‐15. N = 353. 2. Non‐ICM: Caseload: 1:30‐35. N = 355. | |
| Outcomes | Service use: average number of days in hospital per month (available for single centre, see below), not remaining in contact with psychiatric services (reported as not remaining in contact with case manager), admitted to hospital, mean number of admissions.
Death: all causes and suicide.
Global state: leaving the study early.
Social functioning: time in independent living accomodation (reported as time spent in stable accomodation), imprisoned, Camberwell Assessment of Need (CAN).
Mental state: general symptoms CPRS, negative symptoms (SANS).
Behaviour: self harm, harm to others.
Quality of life: Lancashire Quality of Life Profile (LQoLP).
Participant satisfaction: Patients' satisfaction with health services questionnaire.
Costs: direct costs of all care. Unable to use ‐ Social functioning: DAS (scale adapted by the trialist, not peer reviewed). Mental state: subscale of CPRS for depression (Montgomery–Åsberg Depression Rating Scale) and for psychotic symptoms (no SD), for anxiety and for behavioural disturbance (no SD, not peer‐reviewed scale). Carer satisfaction: Experience of Caregiving Inventory, 12‐Item General Health Questionnaire (attrition 83.6%). Costs: direct costs of health care and of psychiatric hospital care (no SD). Adverse drug effects: Abnormal Involuntary Movement Scale (not listed as outcome of interest of the review). |
|
| Notes | *Schizophrenia 38%, schizoaffective 49%, mania or bipolar 5%. **The team organisation varied slightly across centres. | |
| Risk of bias | ||
| Bias | Authors' judgement | Support for judgement |
| Random sequence generation (selection bias) | Unclear risk | Randomised, randomisation stratified by centre. No further details. |
| Allocation concealment (selection bias) | Low risk | Randomised allocation assigned by telephone or fax by an independent statistical centre. |
| Blinding (performance bias and detection bias) All outcomes | Unclear risk | Primary outcome: clinician/participant mediated ‐ rating ‐ Unclear. Secondary outcomes: interviewer rated ‐ rating ‐ No. (Researchers were not masked to treatment allocation.) |
| Blinding of participants and personnel (performance bias) All outcomes | Unclear risk | Blinding not reported. |
| Blinding of outcome assessment (detection bias) All outcomes | Unclear risk | Blinding not reported. |
| Incomplete outcome data (attrition bias) All outcomes | Low risk | Number and reasons for attrition stated. Analysis performed on an ITT basis. |
| Selective reporting (reporting bias) | Unclear risk | Most of the listed outcomes are reported completely (the only exception is for CPRS subscale: SD missing). |
| Other bias | Low risk | Publicly funded (grants from the UK Department of Health and NHS research and development programme). No further details. No evidence of the presence of other bias. |
ACT ‐ Assertive Community Treatment CM ‐ Case Management CMHC ‐ Community Mental Health Center CMHT ‐ Community Mental Health Team CPA ‐ Care Programme Approach: the CPA is a combination of non‐Intensive Case Management and care from a CMHT, introduced in England in the mid‐1990s and becoming standard care thereafter CPNS ‐ Community Psychiatric Nursing Service DSM‐III‐R ‐ Diagnostic and Statistical Manual of Mental Disorders, 3rd Edition, Revised (APA 1987) DSM IV ‐ Diagnostic and Statistical Manual of Mental Disorders, 4th Edition (APA 1994) F ‐ female ICD‐10 ‐ International Statistical Classification of Diseases and Related Health Problems 10th Revision (WHO 1992) ICM ‐ Intensive Case Management ITT ‐ intention to treat LOCF ‐ last observation carried forward M ‐ male N ‐ number NIMH ‐ National Institute of Mental Health (USA) non‐ICM ‐ non‐Intensive Case Management OPCRIT ‐ Operational Criteria (McGuffin 1991) OPD ‐ outpatient department PACT ‐ Programme of Assertive Community Treatment P/T ‐ part time RDC ‐ Research Diagnostic Criteria (Spitzer 1978) SADS ‐ Schedule for Affective Disorders and Schizophrenia interview (Endicott 1978) SC ‐ standard care SCAN 2.0 ‐ 2.1: Schedule for Clinical Assessment in Neuropsychiatry (SCAN 2.0 in 1998, SCAN 2.1 since 1999) (WHO 1998) SCID ‐ Structured Clinical Interview for DSM‐IV (First 1997) SD ‐ standard deviation SMI ‐ severe mental illness TCL ‐ Training in Community Living VA ‐ Veterans administration Yrs ‐ years
Scales
ACL ‐ Adjective Checklists ASI ‐ Addiction Severity Index AUS ‐ Alcohol Use Scale BDI ‐ Beck Depression Inventory BPRS ‐ Brief Psychiatric Rating Scale BSI ‐ Brief Symptom Inventory CAN ‐ Camberwell Assessment of Need Interview CANSAS ‐ Camberwell Assessment of Need Short Appraisal Schedule CPRS ‐ Comprehensive Psychopathological Rating Scale C‐DIS‐R ‐ Computer‐based Diagnostic Interview Schedule Revised CSI ‐ Colorado Symptom Index CSQ ‐ Client Satisfaction Questionnaire CSRI ‐ Client Service Receipt Inventory DALI ‐ Dartmouth Assessment of Lifestyle Interview DACTS ‐ Dartmouth Assertive Community Treatment Scale DAS ‐ Disability Assessment Scale DUS ‐ Drug Use Scale GAF ‐ Global Assessment of Functioning Scale GAS ‐ Global Assessment Scale GSI ‐ Global Severity Index HADS ‐ Hospital Anxiety and Depression Scale HEAS ‐ Homeless Engagement Acceptance Scale HoNOS ‐ Health of the Nation Outcome Scale IMPS ‐ Inpatient Multidimensional Psychiatric Scale Indiana LOF ‐ Indiana Level of Functioning ISSI: Interview Schedule for Social Interaction KS ‐ Krawiecka Scale LQoLP ‐ Lancashire Quality of Life Profile LSP ‐ Life Skill Profile MANSA ‐ Manchester Short Assessment of Quality of Life PANSS ‐ Positive and Negative Syndrome Scale PSE ‐ Present State Examination PSNAS ‐ Personality and Social Network Adjustment Scale QOLI ‐ Lehman's Quality of Life Interview REHAB ‐ a scale of social functioning (REHAB GB: general behaviour); (REHAB DB: deviant behaviour) ROMI ‐ Rating of Medication Influences RSES ‐ Rosenberg Self Esteem Scale SAI ‐ Scale for the Assessment of Insight SAI‐E ‐ Scale for the Assessment of Insight‐expanded SANS ‐ Scale for the Assessment of Negative Symptoms SAPS ‐ Scale for the Assessment of Positive Symptoms SAS ‐ Social Adjustment Scale SATS ‐ Substance Abuse Treatment Scale SBS ‐ Social Behaviour Scale SCL‐90: Hopkins Symptoms Check List‐90 SCRS ‐ Short Clinical Rating Scale SFQ ‐ Social Functioning Questionnaire SLS ‐ Satisfaction with Life Scale TLFB ‐ Timeline Followback W‐BQ ‐ Well‐being Questionnaire
Characteristics of excluded studies [ordered by study ID]
| Study | Reason for exclusion |
|---|---|
| Agius‐Croatia 2007 | Allocation: not randomised (cohort study). |
| An 2013 | Allocation: randomised. Participants: schizophrenia. Interventions: 1. Community‐based follow‐up interventions. 2. Care as usual. Not ICM. |
| An Qi 2013 | Allocation: randomised. Participants: primary schizophrenia. Interventions: 1. Family intervention. 2. Care as usual. Not ICM. |
| Bao 2012 | Allocation: unclear. Not RCT. |
| Bao‐China 2005 | Allocation: randomised. Participants: people with schizophrenia. Intervention: 1. Family intervention, community based. Not ICM. 2. Standard care. |
| Barbic 2009 | Allocation: randomised. Participants: people who met DSM‐IV diagnostic criteria for schizophrenia, schizoaffective disorder, schizophreniform disorder, delusional disorder, or bipolar disorder. Intervention: No relevant comparison: ACT vs ACT + Recovery Workbook. |
| Barekatain‐Iran 2014 | Allocation: randomised. Participants: age 18 to 65 years. DSM‐IV diagnosis of bipolar I disorder (mania or mixed), schizophrenia, or schizoaffective disorder. Intervention: 1. Psychoeducation program for families, explicity operationalised, provided within a package of care close to the ICM model (caseload 1:12). 2. Standard care: routine psychiatric treatments. Caseload not reported. N = 62. |
| Bigelow‐Oregon 1991 | Allocation: not randomised, quasi‐experimental design. |
| Bond‐Chicago2 1989 | Allocation: not randomised, matched‐groups design. Interventions: 2 types of crisis housing. |
| Bond‐Indiana2 1991 | Allocation: not randomised, allocation to ACT and reference group was not random in 1 of the 3 participating centres. The study could be included if separate data can be obtained from the 2 centres where randomisation took place. |
| Borland‐Washington 1989 | Allocation: not randomised. |
| Borras 2009 | Allocation: randomised. Participants: all meeting ICD‐10 criteria for a diagnosis of schizophrenia or other non‐ affective psychoses. Interventions: no relevant comparison: traditional psychiatric outpatient care or case management vs traditional psychiatric outpatient care or case management + self esteem module. |
| Botha 2014 | Allocation: randomised. Participants: adults with severe mental illness. Intervention: 1. Modified assertive intervention. 2. Standard care. Caseload > 20. |
| Burns 2013 | Allocation: randomised. Participants: adult patients diagnosed with psychosis. Interventions: 1. Community treatment orders (CTOs): program for patient who needs supervision after a period of involuntary hospital treatment and who, without it, is highly likely to relapse and be readmitted involuntarily. Not ICM. 2. Section 17 leave: a well‐established rehabilitation practice, used for brief periods to assess the stability of a patient’s recovery after or during a period of involuntary hospital treatment. |
| Burns‐UK 1993 | Allocation: randomised. Participants: people who were (a) aged between 18 and 74 years, (b) from the appropriate catchment area of Psychiatric Service, (c) not in treatment during the preceding 12 months, (d) able to be interviewed in English. Intervention: multidisciplinary team home treatment, not ICM. |
| Champney‐Ohio 1992 | Allocation: randomised. Participants: adults with severe mental disabilities. Intervention: all 4 comparison groups received some form of case management, no ACT. Neither standard care nor non‐ICM in the comparison group. |
| Chandler 1999 | Allocation: randomised. Participants: volunteers randomly assigned to ACT. Not exclusively community setting. |
| Chandler 2000 | Allocation: randomised. Participants: not clear, described as "high cost inpatient users". Intervention: no relevant comparison: ACT + social skills training vs ACT. |
| Chandler‐California2 2006 | Allocation: randomised.
Participants: current serious mental illness and substance use disorder.
Intervention: 1. In‐custody standard care + brief aftercare + Integrated Dual Disorders Treatment. Postcustody treatment includes ICM and specific intervention addressing substance abuse disorder. Not exclusively community setting; not only ICM. 2. Service as usual: in‐custody standard care + usual postcustody services + 60 days of postrelease case management and housing assistance. Not exclusively community setting. |
| Chang 2013 | Allocation: randomised. Participants: 18 to 35 years with a diagnosis of schizophrenia, non‐affective psychosis, affective disorders with psychotic features, or delusional disorder. Intervention: 1. Community‐based case management (n = 79). 2. Standard care: general psychiatric care with all auxiliary care options unchanged (n = 77). All participants had been enrolled in the Early Assessment Service for Young People with Early Psychosis (EASY) for 2 years before starting this trial. Not ICM, caseload 1:80. |
| Chatterjee 2014 | Allocation: randomised. Participants: patients aged 16 to 60 years with a primary diagnosis of schizophrenia according to the ICD‐10 Diagnostic Criteria for Research (DCR). Intervention: 1. Collaborative community‐based care plus facility‐based care. 2. Facility‐based care alone. Not ICM. |
| Chen XZ 2012 | Allocation: randomised. Participants: schizophrenia. Interventions: 1. Home visit. 2. Education. Not ICM. |
| Chen‐China 2007 | Allocation: randomised.
Participants: adults with schizophrenia (non‐acute).
Intervention: 1. Antipsychotic + Digital Network + Community Support Network. 2. Antipsychotic + Community Support Network. Digital Network involves providing online consultation to patients, emailing them periodically, providing online health education. Community Support Network involves providing physical, psychological, and rehabilitation treatment to non‐acute patients. Not ICM. |
| COAST‐UK 2004 | Allocation: randomised. Participants: those with any functional psychosis. Interventions: 1. ICM: Assertive Outreach Team model; caseload: 1:12. Also includes individual therapy for residual positive symptoms of psychosis (CBT) and family intervention, if appropriate. Not only ICM. 2. Non‐ICM: usual services available to a local multidisciplinary team (according to Care Programme Approach); caseload: 1:35. Does not include any specialised psychological interventions. |
| COMO‐UK 2003 | Allocation: cluster randomisation. Participants: case manager providing care to patients with psychosis and comorbid substance misuse ("dual diagnosis"). Interventions: 1. Training in dual‐diagnosis intervention (i.e. i. treatment manual; ii. 5‐day training course in assessment and management of dual diagnosis; iii. subsequent monthly supervision). Not ICM. 2. CMHT management as usual. |
| Cook 2013 | Allocation: randomised. Participants: patients with serious mental illness as defined by federal Public Law 102–321 specifying diagnosis, duration, and level of disability (schizophrenia, schizoaffective, bipolar, depressive, other); age ≥ 18 years. Interventions: 1. Wellness Recovery Action Planning: an evidence‐based practice that consisted of 9, 2.5‐hour group sessions that were facilitated free of charge by 2 trained and certified instructors in recovery from mental illness, with backup instructors available as needed. Not ICM. 2. Choosing Wellness: Healthy Eating Curriculum: a nutrition education intervention holistically focused on wellness. |
| CORE 2014 | Allocation: randomised. Participants: patients diagnosed with bipolar disorder, anxiety disorder, major depressive disorder, schizophrenia, personality disorder, panic disorder, age 16 to 64 years. Intervention: 1. Co‐design technique to optimise psychosocial recovery. Not ICM. 2. Waiting list. |
| Cosden‐California 2005 | Allocation: randomised. Participants: offenders with serious mental illness. Interventions: 1. ICM + non‐adversarial court proceeding. 2. Non‐ICM + adversarial court proceeding. 2 arms are provided with different intervention between groups in addition to ICM and non‐ICM. |
| CRIMSON‐UK 2008 | Allocation: randomised. Participants: diagnosis of psychotic illness; ≧ 1 admission to a psychiatric inpatient service during previous 2 yrs. Interventions: 1. Joint Crisis Plan: aims to empower the client and to facilitate early detection and treatment of relapse. Plan contains client's treatment preferences for any future psychiatric emergency, when the client may be too unwell to express clear views. Not ICM. 2. Standard treatment: as provided by CMHT. |
| Cui 2012 | Allocation: randomised. Participants: schizophrenia. Interventions: 1. Case management. 2. Outpatient visits. Not ICM. |
| De Cangas‐Canada 1994 | Allocation: randomised. Intervention: hospital‐based care for those in control group, not community‐based ICM. |
| Dean‐UK1 1990 | Allocation: not randomised. |
| Dean‐UK2 1993 | Allocation: not randomised, quasi‐experimental study. |
| Dekker‐Netherlands 2002 | Allocation: randomised, but randomisation is compromised because after initial randomisation control group were combined with control group from another study that experienced problems. Participants: chronic psychiatric patients with a history of several admissions. Interventions: 1. ACT; caseload: 1:30. Not ICM. 2. Standard care. |
| Deng‐China 2006 | Allocation: quasi‐randomised (randomisation according to hospital admission number). Participants: admitted to hospital for a first‐onset schizophrenia. Interventions: hospital based, not community based. |
| Dharwadkar‐Victoria 1994 | Allocation: not randomised, before‐and‐after design. |
| Dinitz 1965 | Allocation: randomised. Participants: acutely mentally ill patients in a hospital setting. |
| Er 2013 | Allocation: randomised. Participants: chronic schizophrenia. Interventions: 1. Antipsychotics + family education, and rehabilitation instruction 2. Care as usual. Not ICM. |
| Fenton‐Canada 1978 | Allocation: randomised. Participants: people with schizophrenia, acutely ill, requiring immediate hospital admission. Intervention: home‐care community‐based treatment vs hospital care. Not ICM in the experimental group; comparison group not community based. |
| Franklin‐Texas 1987 | Allocation: randomised. Participants: people who at least had 2 discharges from mental hospital. Intervention: Assertive Community Treatment caseload over 30. Not ICM. |
| Gao 2013 | Allocation: randomised. Participants: schizophrenia. Interventions: 1. Hospital‐community‐family integrated management. 2. Care as usual. Caseload not reported. |
| Gaughran 2013 | Allocation: randomised. Participants: patients with a ICD‐10 diagnosis of psychotic disorder (F20‐29, F31.2, F31.5). Intervention: 1. Improving physical health and reducing substance use in psychosis (IMPACT)‐Health Promotion Intervention. Not ICM. 2. Standard care. |
| Glick‐New York 1986 | Allocation: randomised. Intervention: day hospital care vs outpatient group therapy, not ICM. |
| Godley‐Illinois 1994 | Allocation: randomised. Participants: major psychiatric and substance abuse diagnosis. Intervention: 1. ICM: specialised case management. Caseload ˜ 1:15. 2. Standard care. Outcome: incomplete data reporting. Not providing usable outcomes. |
| Goering‐Canada 1988 | Allocation: not randomised, used historical controls. |
| Gold‐SCarolina 2006 | Allocation: randomised. Participants: adults with severe mental illness. Intervention: ACT + Individual Placement and Support (integrated supported employment programme). Not only ICM. 2. Traditional programme: providing mental health and brokered case management services in parallel to vocational services. Not only standard‐care services. 2 arms are provided with different interventions between groups in addition to ACT and standard care. |
| Gong 2014 | Allocation: randomised. Participants: adults with severe mental illness. Interventions: 1. Case management provided by village doctors. 2. Usual care. Not ICM. |
| Grawe‐Norway 2005 | Allocation: randomised. Participants: people with recent‐onset schizophrenia. Interventions: 1. Integrated treatment: package of care provided by a multidisciplinary team with management caseload ˜ 1:10; cognitive‐behavioural family treatment and home‐based crisis management. Not only ICM. 2. Standard treatment: clinical‐based case management caseload ˜ 1:10 and crisis inpatient treatment. |
| Gu‐China 2010 | Allocation: randomised (multicentre trial; 4 centres). Participants: patients suffering from schizophrenia. 1. Integrated training: the intervention includes life skill training, occupational skill training, communication training, psycho‐education, and family visiting. Delivered by nurses. Caseload is probably 1<20. 2. Standard care. Routine training, no more details. Not ICM in the intervention. |
| Han SH 2012 | Allocation: randomised. Participants: primary schizophrenia. Interventions: 1. Antipsychotics, psycho‐education, family visit, and instruction. 2. Antipsychotics and psycho‐education. Not ICM. |
| Hargreaves‐California | Allocation: not randomised. |
| Havassy‐California 2000 | Allocation: randomised.
Participants: seriously mentally ill adults with and without substance dependence.
Interventions: 1. Intensive Clinical Case Management community‐based.
2. Expanded brokerage case management program (data on caseload not available; it could be either ICM or non‐ICM), hospital based, providing intensive support during the initial postdischarge period, with a maximum of 60 days. Outcome: poor reporting data results, not usable. 2 reasons for exclusion: intervention (not clear if the comparison intervention is ICM or non–ICM) and not providing usable data (comparison is between the 2 subgroups “with or without substance dependence”, not between the 2 interventions). |
| He‐China 2004 | Allocation: quasi‐randomised (randomised allocation according to register number). |
| Hornstra‐Kansas 1993 | Allocation: not randomised, historical controls. |
| Hoult‐Australia 1981 | Allocation: randomised. Participants: people with schizophrenia, acutely ill, requiring immediate hospital admission. Interventions: ICM vs acute admission to a psychiatric hospital. |
| Huang 2012 | Allocation: unclear. Not RCT. |
| Huang 2013 | Allocation: randomised. Participants: schizophrenia. Interventions: 1. Community nursing intervention and rehabilitation training. 2. Treatment as usual. Not ICM. |
| Hui 2014 | Allocation: randomised. Participants: patients diagnosed with schizophrenia, schizophreniform disorder, schizoaffective disorder, delusional disorder, brief psychotic disorder, psychotic disorder not otherwise specified, or manic episodes with psychotic features (DSM‐IV); age 22 to 55 years. Interventions: 1. Early Intervention Program: specialised and individualised case management as well as community‐based group programmes. Caseload > 20. 2. Standard care. |
| Hurlburt‐California 1996 | Allocation: randomised.
Participants: severe mental illness.
Interventions: 1. Non‐ICM: comprehensive case management; caseload 1:22. Not ICM. 2. Non‐ICM: traditional case management; caseload 1:40. Not ICM. 3. Non‐ICM: comprehensive case management; caseload 1:22 + high‐level access to independent housing. Not ICM. 4. Non‐ICM: traditional case management; caseload 1:40 + high‐level access to independent housing. Not ICM. |
| ISRCTN73683215 | Allocation: randomised. Participants: adults with severe mental illness who received mental health care in clinical settings. Interventions: Not ICM. Boston Psychiatric Rehabilitation Approach versus treatment as usual. |
| Jerrell‐California 1989 | Allocation: randomised. Randomisation is compromised because number of people excluded after randomisation is not reported (patients were excluded if they refused to participate after randomisation or if they had not been discharged from hospital within 6 months of entering the study). Participants: severe mental illness. Intervention: 1. ICM, according to the ACT Stein and Test model. 2. Standard care: provided in the community setting. |
| Jerrell‐SCarolina2 1994 | Allocation: randomised. Interventions: ACT vs 12‐step recovery programme and behavioural skills training + standard care. Not standard care only in the comparison group. |
| Jiang 2012 | Allocation: randomised. Participants: primary schizophrenia Interventions: 1. Family intervention plus antipsychotics. 2. Antipsychotics alone. Not ICM. |
| Jiang 2013 | Allocation: randomised. Participants: chronic schizophrenia. Interventions: 1. Intergrated community‐based intervention. 2. Care as usual. Not ICM. |
| Jorgensen 2012 | Allocation: randomised. Participants: patients meeting the criteria for schizophrenia according to ICD10 F.20.09 or schizoaffective disorder according to ICD10 F.25.09; age 18to 70 years. Interventions: 1. Guided Self Determination: 21 worksheets designed to guide patient and mental health professionals through autonomy‐supportive problem solving. The worksheets are filled in by the patient before and between conversations with their community nurse over 10 sessions, each approximately 1 hour. Not ICM. 2. Waiting list *Trial status: ongoing (trial registration form only). |
| Kane‐Virginia 2004 | Not randomised. |
| Kilbourne 2014 | Allocation: randomised. Participants: Adult Veterans Administration (VA) Center patients diagnosed with an ICD‐9 diagnosis of schizophrenia or related disorder or bipolar disorder who was lost to care. Interventions: 1: Re‐Engage: a national VA outreach program consisting of risk assessment (i.e. identifying the patient's current status, including clinical care needs and current disposition) and outreach services (i.e. attempting to contact patients and invite them back to receive health services). Not ICM. 2. Standard care. |
| Klotz‐California 2001 | Wrote to author for further information. Received email from D. Innes‐Gomberg on 4 January 2016 stating that there is no data. Consequently, this study is excluded. |
| Knight‐California 1990 | Allocation: not randomised, quasi‐experimental design. |
| Kuldau‐California 1977 | Allocation: randomised. Interventions: rapid discharge vs hospital care, not ICM. |
| Lafave‐Canada 1996 | Allocation: randomised. Intervention: hospital‐based care for control group, not community‐based care. Neither standard care nor non‐ICM in the comparison group. |
| Langley 2009 | Allocation: randomised Participants: diagnosed with a DSM‐IV axis 1 disorder. Interventions: ACT vs ICM. No relevant comparison: both interventions types of ICM. |
| Langsley‐Colorado 1968 | Allocation: randomised. Interventions: outpatient family crisis management vs hospital admission. Not ICM. |
| Lehman‐Maryland2 1993 | Allocation: randomised. Participants: dually diagnosed people. Interventions: 1. ICM + experimental group treatment Being Sober Group (addressing the specific problems of dually diagnosed adults). 2. Non‐ICM. In the experimental group: not only ICM. |
| LEO‐UK 1994 | Allocation: randomised. Participants: people with non‐affective psychosis. Interventions: 1. ICM: Assertive Outreach model; caseload ˜ 1:7. Including also: i. CBT based on manualised protocol; ii. family counselling and vocational strategies based on established protocols. Not only ICM. 2. Non‐ICM: delivered by the sector community mental health teams (according to Care Programme Approach). No CBT, no family counselling and vocational strategies. |
| Li 2011 | Study design: randomised.
Participants: inpatients with schizophrenia (Chinese Classification of Mental Disorders (CCMD‐3)).
Interventions: hospital‐based intervention, not community based. Assessed by Sai Zhao. |
| Li 2012 | Allocation: randomised. Participants: primary schizophrenia. Interventions: 1. Community comprehensive intervention. 2. Care as usual. Not ICM. |
| Li 2013 | Allocation: randomised. Participants: schizophrenia. Interventions: 1. Care package involving family intervention, psycho‐education, and drug therapy. 2. Care as usual. Not ICM. |
| Li JX 2013 | Allocation: randomised. Participants: primary schizophrenia. Interventions: 1. Individulised rehabilitation training. 2. Care as usual. Not ICM. |
| Li MD 2013 | Allocation: randomised. Participants: schizophrenia. Interventions: 1. Family intervention plus usual care. 2. Care as usual. Not ICM. |
| Li Ning 2013 | Allocation: randomised. Participants: schizophrenia. Interventions: 1. Community‐based comprehensive intervention. 2. Standard community intervention. Caseload not reported. |
| Li WX 2013 | Allocation: randomised. Participants: schizophrenia. Interventions: 1. Community‐based interventions. 2. Long‐term hospitalisation. Not ICM. |
| Li‐China 2004 | Not community setting: hospital setting. In Chinese. Assessment by Tao Yuan Li Jun and Chunbo Lee. |
| Liang 2009 | Allocation: not randomised. The author randomly selected 188 participants and divided them into 2 groups.
Participants: schizophrenia.
Interventions: talking therapy and instruction for medication. Assessed by Sai Zhao. |
| Liang 2012 | Allocation: randomised. Participants: schizophrenia. Interventions: 1. Family intervention and antipsychotic medication. 2. Antipsychotics alone. Not ICM. |
| Liao 2010 | Study design: RCT.
Participants: inpatients with schizophrenia.
Interventions: hospital‐based intervention included psycho‐education, social skills training, family education, etc. Assessed by Sai Zhao. |
| Lichtenberg‐Israel 2008 | Allocation: randomised. Participants: people with at least 3 psychiatric admissions during the previous 2 yrs. Diagnosis is not stated. Interventions: 1. Non‐ICM; caseload 1:30. Not ICM. 2. Standard care: provided by the mental healthcare centres. |
| Lin‐China 1998 | Allocation: not randomised. |
| Liu 2010 | Study design: RCT.
Participants: inpatients with schizophrenia.
Interventions: hospital‐based group psycho‐education. Assessed by Sai Zhao. |
| Lloyd 2000 | Allocation: not randomised. |
| Lu 2013 | Allocation: randomised. Participants: schizophrenia. Interventions: 1. Hospital‐community integrated management model. 2. Care as usual. Caseload not reported. |
| Malm‐Sweden 2003 | Allocation: randomised. Participants: diagnosed according to DSM‐IV schizophrenia, schizophreniform, schizoaffective, or delusion disorders. Intervention: 1. "Integrated Care" vs 2. "Rational Rehabilitation". Both of the compared treatment programmes were delivered in the context of clinical case management by CMHTs. They actively incorporated some key features of ACT; caseloads ˜ 1:40. The additional component in the Integrated Care programme was the continuous social network resource group for each patient. Not ICM. |
| Martin‐Delaware 1993 | Allocation: not randomised. |
| Martin‐UK 2005 | Allocation: randomised. Participants: people with intellectual disability and mental illness. |
| Marx‐Wisconsin 1973 | Allocation: randomised. Interventions: hospital‐based care for control group, not community‐based care. Neither standard care nor non‐ICM in the comparison group. |
| McDonell 2013 | Allocation: randomised. Participants: patients meeting Mini International Neuropsychiatric Interview criteria for schizophrenia, schizoaffective disorder, bipolar I or II disorder, or recurrent major depressive disorder and methamphetamine, amphetamine, or cocaine dependence who had used stimulants during the past 30 days. Intervention: 1. Contingency management for stimulant abstinence. Not ICM. 2. Treatment as usual. |
| McFarlane‐New York 1992 | Allocation: unclear if randomised. Interventions: ACT vs Family‐Aided Assertive Community Treatment (FACT). Neither standard care nor non‐ICM in the comparison group. |
| McGowan‐California 1995 | Allocation: unclear if randomised; control and treatment groups were "randomly selected" from a population already receiving ACT or standard care. |
| McGrew‐Indiana 1994 | Allocation: not randomised (study was a before‐and‐after design examining the effects of implementing ACT teams in 6 sites in Indiana). |
| McHugo‐Washington DC 2004 | Allocation: randomised. Participants: adults with severe mental illness at high risk for homelessness. Intervention: 1. Parallel housing services programme: including ICM ‐ caseload 1:15, implemented by mobile ACT team, and housing by routine community‐based landlords. Not only ICM. 2. Integrated housing services programme: including ICM ‐ caseload 1:15; case management and housing services were provided by teams within a single agency and were closely co‐ordinated. Neither standard care nor non‐ICM in the comparison group. |
| MECCA‐Europe 2002 | Allocation: cluster randomisation. Participants: people with functional psychosis. Intervention: 1. Treatment as usual + "outcome management". The latter is an innovative treatment where every 2 months a key‐worker assesses patient's subjective quality of life, treatment satisfaction, and wishes for additional/different support using a questionnaire (MECCA). It is expected that the results will directly feed into the therapeutic dialogue and be discussed by the patient and key‐worker together. Not ICM. 2. Treatment as usual. |
| Meneghelli‐Italy 2000 | Allocation: not randomised. |
| Merson‐UK 1992 | Allocation: randomised. Interventions: multidisciplinary team home treatment vs emergency assessment at hospital. Neither standard care nor non‐ICM in the comparison group. |
| Modcrin‐Kansas 1988 | Allocation: randomised. Participants: chronically mentally ill. Interventions: strengths model of case management versus standard case management. As caseload is not reported for either group, it is unclear if experimental intervention could be considered ICM and comparison group could be considered standard care or non‐ICM. The study could be included if more data can be obtained on caseload. |
| Morse‐Missouri2 1997 | Allocation: randomised. Participants: homeless people with severe mental illness. Interventions: 1. ICM: ACT, caseload 1:10; vs 2. Non‐ICM: Brokered Case Management, caseload 1:85; vs 3. ACT plus community worker support, caseload 1:10. Outcomes: unable to use data, numbers for treatment groups not presented. |
| Morthorst 2012 | Allocation: randomised. Participants: patients admitted after a suicide attempt to acute emergency units, intensive care units, paediatric units, and psychiatric emergency rooms: age: ≥ 12 (subgroup analysis according to age reported). Excluded patients who had been diagnosed with severe mental illness (i.e. schizophrenia spectrum disorders, severe depression, severe bipolar disorder). |
| Mosher‐California 1975 | Allocation: not randomised, alternative assignment. |
| Muijen‐UK1 1992 | Allocation: randomised. Participants: those with severe mental illness requiring immediate emergency admission. Interventions: ICM vs acute admission to a psychiatric hospital. |
| Mulder‐Missouri 1985 | Allocation: randomised, but data from randomised and non‐randomised patients not reported separately. Participants: people with schizophrenia, acutely ill, presenting for psychiatric hospital admission. Interventions: 1. ICM: modelled according to the PACT model (as an alternative to current hospitalisation). 2. Standard care: usual hospital admission procedure, and at discharge the usual aftercare case management services. |
| NCT00781079 | Allocation: randomised. Participants: must have serious mental illness and must be working with Veterans Affairs ICM team. Interventions: No relevant comparison: ICM + peer specialists vs ICM only. |
| NCT01597141 | Allocation: randomised. Participants: aged 12 to 35 years, with prodromal schizophrenia, psychotic disorders, severe bipolar disorder with psychotic features, or severe major depression with psychotic features. Interventions: 1. Family‐Aided Assertive Community Treatment (FACT) (a combination of family psycho‐education, ACT, supported education/employment, and psychotropic medication). 2. Enhanced standard treatment: the participants will receive the same psychotropic drugs, but will receive individual case management, family education, and crisis intervention. Not ICM vs standard care or ICM vs non‐ICM. |
| Nieves 2002 | Allocation: not a randomised study: "quasi‐experimental design with a matched‐groups comparison of outcomes achieved by patients in two community mental health centers in the South Bronx area of New York City". |
| Odom 2005 | Allocation: non‐randomised, post‐hoc analysis of RCT. |
| Pai‐India 1982 | Allocation: not randomised, alternative assignment. |
| Pioli 2006 | Allocation: randomised. Participants: aged between 18 and 65 years; affected by severe mental illness. Intervention: generic rehabilitation interventions, not ICM. Setting: conducted partially in residential rehabilitation centre. |
| Polak‐Colorado 1976 | Allocation: randomised. Participants: not clearly specified. Interventions: admission to small "community‐based therapeutic environments" vs standard hospital care. Not ICM. |
| PRiSM‐UK 1998 | Allocation: not randomised. |
| Ren‐China 2004 | Allocation: not clearly stated if randomised. Participants: people with chronic schizophrenia, admitted to rehabilitation hospital. Interventions: rehabilitation hospital based, not community based. |
| Roldan‐Merino 2012 | Allocation: randomised Participants: patients diagnosed with schizophrenia with an evolution of 2 or more years since the moment of the diagnosis. Interventions: 1. Personalised in‐home nursing care plan: periodic home visits, with maximum intervals of 21 days between visits. Not ICM. 2. Standard care. |
| Rossler‐Germany1 1992 | Allocation: not randomised, case control study. |
| Rossler‐Germany2 1995 | Allocation: not randomised, case control study. |
| Rutter‐UK | Allocation: randomised. Participants. severe mental illness. Interventions: 1. ICM: case management provided by a case manager internal to the CMHT; caseload 1:15. 2. ICM: case management provided by a case manager outside the CMHT; caseload 1:15. The comparison group was neither standard care nor non‐ICM. |
| Salyers 2010 | Allocation: randomised. Participants: adults with severe mental illness. Interventions: Not ICM. Illness Management and Recovery (IMR) vs intensive problem solving. IMR: psycho‐education, cognitive behavioural approaches, relapse prevention, social skills training, and coping skills training. |
| Salyers 2014 | Allocation: randomised. Participants: patients diagnosed with schizophrenia or schizoaffective disorder, currently receiving (or newly admitted to) mental health services at a Veterans Administration (VA) or community mental health centre; age 18 or older. Interventions: 1. Group‐based Illness Management and Recovery (IMR) program: developed to incorporate effective strategies including psycho‐education, cognitive behavioural approaches to medication adherence, relapse prevention, social skills training, and coping skills training. 2. Equally intensive problem‐solving (PS) control group. Not ICM and irrelevant comparison. |
| Santiago‐Arizona 1985 | Allocation: randomised. Participants: those with serious mental illnesses, recently admitted to hospital and ready for discharge. Intervention: 1. Treatment Network Team provided both in community‐ and hospital‐based setting. Caseload not stated. Not ICM. 2. Standard care. Unable to use all outcomes. |
| Sato 2012 | Allocation: randomised. Participants: hospitalised patients. |
| Schmidt 2005 | Not randomised: retrospective cohort design using an approximation of random assignment. |
| Segal 2010 | Allocation: randomised. Participants: adults with severe mental illness. Interventions: 1. Community Mental Health Agencies (CMHA) treatment vs 2. CMHA treatment and Self‐Help Agencies. Not ICM. |
| Segal 2011 | Allocation: randomised. Participants: adults with serious mental illness (schizophrenia or schizoaffective disorder, major affective disorder). Interventions: 1. CMHA outpatient treatment. Not ICM. 2. A combination of CMHA outpatient treatment and consumer‐operated service programs (COSP). |
| Sha 2010 | Allocation: randomised.
Participants: inpatients with schizophrenia (Chinese Classification of Mental Disorders (CCMD‐3)).
Interventions: hospital‐based intervention, not community based. Assessed by Sai Zhao. |
| Shen WW 2013 | Allocation: randomised. Participants: schizophrenia. Interventions: 1. Hospital‐community‐family integrated management. 2. Care as usual. Caseload not reported. |
| Shern‐USA2 | Allocation: randomised. Participants: serious and persistent mental health disorder + homelessness. Interventions: 1. Pathways to Housing: supporting housing programme, providing permanent, independent housing + ACT (according to Stein and Test model); caseload 1:10. Not only ICM. 2. Standard care: provided by social agencies (i.e. outreach teams, drop‐in centres). If participant has no current affiliation to service providers, information was given about where services could be obtained. No active engagement. |
| Shern‐USA3 | Allocation: randomised. Participants: severe mental illness, co‐occurring addiction and homelessness. Interventions: 1. Housing First programme: providing permanent, independent housing without prerequisites for sobriety and treatment + ACT; vs 2. Standard care. Not only ACT. |
| Shern‐USA4 | Allocation: randomised. Participants: homeless mentally ill population. Interventions: 1. Pathways to Housing: supporting‐housing programme, providing permanent, independent housing; vs 2. Standard residential treatment. Not ICM. |
| Solomon 2014 | Intervention: Not ICM: Transitional Care Model is a time‐limited (90 days), transitional intervention from release from acute hospitalisation to full engagement with community mental health care 1. Transitional Care with case management: nurse practitioner managing risk factors to prevent further cognitive or emotional decline, managing problem behaviours, assessing and managing physical symptoms, preventing functional decline; promoting adherence to therapies, assuring proper medical management and continuity of care, and helping case managers understand the integrated mental and physical care approach. 2. Usual case management: a case manager was assigned to the participant and a psychiatrist provided medication management. |
| Solomon‐Pennsylvania1 | Allocation: randomised. Intervention: 1 type of case management vs another. Neither standard care nor non‐ICM in the comparison group. |
| Somers 2013 | Allocation: randomised Participants: homelessness or precarious housing participants with current mental disorder status meeting Mini‐International Neuropsychiatric Interview criteria for major depressive episode, manic or hypomanic episode, post‐traumatic stress disorder, mood disorder with psychotic features, and psychotic disorder. Interventions: 1. Housing First + ICM. Not ICM alone. 2. Usual care. |
| Song 2013 | Allocation: randomised. Participants: schizophrenia. Interventions: 1. Family psychological care plus social skills training and antipsychotics. 2. Antipsychotics alone. Not ICM. |
| Stein 1974 | Allocation: randomised Participants: adults with severe mental illness; age 18 to 62 years. Interventions: 1. Training in community living. 2. Hospital care. Control group not in community. |
| Stein‐Wisconsin | Allocation: randomised. Participants: those with severe mental illness requiring immediate emergency admission. Intervention: ICM (according to the ACT model) vs acute admission to a psychiatric hospital. |
| Stultz 2014 | Allocation: randomised Participants: patients in need for acute psychiatric inpatient care Intervention: 1. Community treatment (not specified). 2. Hospital admission and inpatient treatment. Control group not community treated. *Trial status: ongoing (trial registration form only). |
| Sungur 2011 | Allocation: randomised. Participants: between the ages of 18 and 45 years; a DSM‐IV diagnosis of schizophrenia confirmed by Structured Clinical Interview for DSM‐IV (SCID‐IV) interviews; duration of illness of less than 10 years; living with a family member the year prior to admission; a resident of Ankara; completed written informed consent approved by the ethics committee (caregivers were also required to provide written informed consent. Intervention: 1. Optimal case management. Caseload: 4:50. 2. Routine case management. Caseload: 4:50. |
| Supereden 2012 | Allocation: randomised Participants: patients with nonaffective psychosis who had been with Early Intervention Service (EIS) between 1 and 2 years and who showed a low level of structured activity after at least 1 year of treatment (defined as 30 hours or less per week). Interventions:1. Social recovery‐oriented cognitive behavioural therapy + standard care. Not ICM. 2. Standard care. |
| Susser‐New York 1997 | Allocation: randomised. Participants: severe mental illness. Interventions: 1. "Critical time intervention": a time‐limited approach aimed at stabilising the patient's social support network, designed for transitions from various institutions to the community; the goal is to enhance continuity of care, strengthening the individual's long‐term ties to services. Not ICM. 2. Standard care: community‐based services. |
| Tang 2013 | Allocation: randomised. Participants: schizophrenia. Interventions: 1. Carers‐provided home‐based rehabilitation intervention. 2. Professional‐provided home visit. Not ICM. |
| Tao‐China 2004 | Allocation: randomised. Participants: people with schizophrenia, admitted to hospital. Intervention: provided pre‐discharging. Hospital, not community, based. |
| Teague‐New Hampshire 1995 | Allocation: not randomised. |
| Thornicroft‐Maryland 1991 | Allocation: not randomised. |
| Tomita 2011 | Allocation: randomised. Participants: 150 previously homeless individuals with severe and persistent mental illness after discharge from inpatient treatment. Intervention: Critical Time Intervention (primarily designed to prevent homelessness) is not ICM; it is transitional care from hospital to full engagement with community mental health services. |
| Toro‐New York 1997 | Allocation: randomised. Participants: a minority of the participants suffered from severe mental illness; around 80% were simply homeless. |
| Tyrer‐UK 1995 | Allocation: randomised Participants: psychotic illness. Intervention: 1. ICM. 2. Standard treatment: provided by social and psychiatric services. The case managers for the treatment group were also the case managers for the control group (see Excluded studies section). |
| van Meijel 2003 | Allocation: randomised Participants: adults with severe mental illness. Interventions: 1. Relapse Prevention Plan: includes detecting the early signs of difficulty and actions that could be taken when psychotic relapse threatens (not ICM). 2. Usual care. |
| Vesterager 2011 | Allocation: randomised, parallel‐group clinical trial. Participants: outpatients, aged 18 to 35 years, diagnosed with first‐episode psychosis or schizotypal disorder within F2 spectrum in ICD‐10. Participants were in a postacute phase of illness, had sufficient comprehension of Danish (i.e. did not need an interpreter), and provided written informed consent. Intervention: 1. OPUS + cognitive training vs 2. OPUS only. OPUS consists of affiliation with a primary contact person, involvement of family, possibility of psycho‐education and social skills training. Depending on individual needs, patients are can take part in group therapy, either social skills training or cognitive behavioural therapy. No relevant comparison. |
| Vincent‐Ohio 1977 | Allocation: not randomised, alternative assignment. |
| Wang 2008a | Not randomised. |
| Wang F 2012 | Allocation: randomised. Participants: chronic schizophrenia. Interventions: 1. Family rehabilitation intervention. 2. Care as usual. Not ICM. |
| Wang FY 2013 | Allocation: randomised. Participants: schizophrenia. Interventions: 1. Family rehabilitation intervention. 2. Care as usual. Not ICM. |
| Wang YL 2012 | Allocation: randomised. Participants: schizophrenia. Interventions: 1. Family nursing intervention. 2. Care as usual. Not ICM. |
| Wang YQ 2010a | Allocation: randomised.
Participants: inpatients with schizophrenia.
Interventions: hospital‐based intervention. Assessed by Sai Zhao. |
| Wang Z 2012 | Allocation: randomised. Participants: schizophrenia. Interventions: 1. Family intervention plus antipsychotics. 2. Antipsychotics alone. Not ICM. |
| Wen 2010 | Allocation: randomised.
Participants: schizophrenia.
Interventions: family interventions; the nurses made an individualised treatment plan for each participant, then implemented intervention according to the plan. The effects of the intervention on outcomes were evaluated and treatments revised according to specific problems of the participant. Assessed by Sai Zhao. |
| Wirshing 2006 | Allocation: randomised. Participants: all with a diagnosis of DSM‐IV schizophrenia or schizoaffective disorder. Interventions: not ICM (Community Re‐Entry Program), not outpatient/community setting (delivered during brief hospitalisations). |
| Wood‐New Zealand 1994 | Allocation: not randomised, case control study. |
| Wu 2013 | Allocation: randomised. Participants: schizophrenia. Interventions: 1. Group psychotherapy combined with family intervention. 2. Care as usual. Not ICM. |
| Wunderink 2015 | Allocation: randomised. Participants: severely mentally ill patients. Interventions: 1. Enhanced Assertive Community Treatment: ACT enhanced with evidence‐based interventions. 2. Standard care. *Trial status is ongoing (trial registration form only). |
| Xing 2013 | Allocation: randomised. Participants: chronic schizophrenia. Interventions: 1. Rehabilitation training. 2. Control group. Not ICM. |
| Yang 2013 | Allocation: randomised. Participants: schizophrenia. Interventions: 1. Rehabilitation training. 2. Treatment as usual. Not ICM. |
| Yao 2013 | Allocation: randomised. Participants: schizophrenia. Interventions: 1. Case management model. 2. No case management. Not ICM. |
| Yao 2014 | Allocation: randomised. Participants: chronic schizophrenia. Interventions: 1. Day nursing care in community. 2. Care as usual. Not ICM. |
| Yu 2011 | Study design: not randomised. Allocation based on admission sequences. Assessed by Sai Zhao. |
| Yuan 2013 | Allocation: randomised. Participants: schizophrenia. Interventions: 1. Case management model. 2. Conventional community management model. Caseload not reported. |
| Zhang SY 2013 | Allocation: randomised. Participants: schizophrenia. Interventions: 1. Enhanced family nursing intervention. 2. Conventional family intervention. Not ICM. |
| Zhang YF 2012 | Allocation: randomised. Participants: schizophrenia. Interventions: 1. Community visit and antipsychotics. 2. Antipsychotics alone. Not ICM. |
| Zhang YM 2013 | Allocation: randomised. Participants: schizophrenia. Interventions: 1. Comprehensive intervention (family visit, medicine compliance intervention, family intervention, crisis intervention). 2. Telephone follow‐up. Not ICM. |
| Zhao HM 2013 | Allocation: randomisation. Participants: schizophrenia. Intervention: 1. Comprehensive community rehabilitation intervention. 2. Standard drug therapy. Caseload not reported. |
| Zhu 2009 | Allocation: not randomised. Allocation based on admission sequences. Assessed by Sai Zhao. |
| Zhu DP 2012 | Allocation: randomised. Participants: schizophrenia. Interventions: 1. Family intervention plus antipsychotics. 2. Antipsychotics alone. Not ICM. |
ACT ‐ Assertive Community Treatment CBT ‐ cognitive behavioural therapy CMHA ‐ Community Mental Health Agencies CMHT: Community Mental Health Team CPA ‐ Care Programme Approach: the CPA is a combination of non‐ICM and care from a CMHT, introduced in England in the mid‐1990s and becoming standard care thereafter DSM ‐ Diagnostic and Statistical Manual of Mental Disorders ICD‐10 ‐ 10th revision of the International Statistical Classification of Diseases and Related Health Problems ICM ‐ Intensive Case Management non‐ICM ‐ non‐Intensive Case Management PACT ‐ Programme of Assertive Community Treatment RCT ‐ randomised controlled trial
Characteristics of studies awaiting assessment [ordered by study ID]
Bonsack‐Switzerland.
| Methods | Allocation: randomised. |
| Participants | Aged 18 to 65 years, following psychiatric hospitalisation. |
| Interventions | 1. Transitional Case Management. 2. Standard care. |
| Outcomes | Adherence to outpatient care; working alliance; number of readmissions; degree of psychiatric symptoms (SCL‐90 R); etc. |
| Notes | ClinicalTrials.gov (clinicaltrials.gov/ct2/show/NCT02258737): "This study has been completed."; no results posted or publication announced. Written to investigator for clarification. |
ChiCTR‐TRC‐13003407.
| Methods | Allocation: randomised. |
| Participants | Adults with severe mental illness. |
| Interventions | 1. Assertive Community Treatment. 2. Standard community service. |
| Outcomes | |
| Notes | Insufficient information in trial registry entry to determine inclusion/exclusion. Written to investigator for clarification. |
Dick‐UK 2000.
| Methods | Allocation: randomised. |
| Participants | People with chronic functional psychosis. |
| Interventions | Community rehabilitation programme. |
| Outcomes | |
| Notes | Not available as full report, written to investigator for clarification, awaiting response. |
Guo‐China 2003.
| Methods | Allocation: randomised, no further details. |
| Participants | Participants: people with schizophrenia (CCMD‐3), living in the community. |
| Interventions | Intervention: community‐based. 1. Experimental intervention: provided by team composed by nurses, social worker; caseload 1:10. Providing: i. Expressed Emotion intervention; ii. psycho‐education (how to prevent relapse, how to deal with adverse effects); iii. daily living activity. 2. Standard care. Awaiting further information on comparison treatment. |
| Outcomes | Outcomes: awaiting for data extraction. |
| Notes | In Chinese. Written to investigator for clarification. |
Kawanishi‐Japan 2014.
| Methods | Allocation: randomised; multicentre. |
| Participants | People with mental health problems who have attempted suicide. |
| Interventions | 1. Assertive case management 2. Enhanced usual care. |
| Outcomes | |
| Notes | Caseload not reported. Written to investigator for clarification. |
Kossobudzka‐Poland 2001.
| Methods | Allocation: randomised. |
| Participants | People with chronic psychoses, mostly schizophrenia; N = 107. |
| Interventions | 1. Mobile community teams. 2. Traditional psychiatric care. |
| Outcomes | |
| Notes | To be assessed, in Polish. |
Li 2010.
| Methods | Allocation: randomised. |
| Participants | People with chronic schizophrenia. |
| Interventions | Interventions: community‐based integrated intervention includes supportive psychosocial therapy, family therapy, rehabilitation training, and antipsychotics. Caseload: the author did not state the caseload. |
| Outcomes | |
| Notes | In Chinese. Assessed by Sai Zhao. (Li 2010). Insufficient information to determine inclusion or exclusion; written to investigator. |
Linszen‐Netherlands 2002.
| Methods | Allocation: randomised. |
| Participants | Young patients with recent‐onset psychosis. |
| Interventions | |
| Outcomes | |
| Notes | Not enough information in the published conference abstracts to determine intervention or age of participants (described as "young"). Written to authors for more published reports. |
Manuel 2009.
| Methods | |
| Participants | |
| Interventions | |
| Outcomes | |
| Notes | To be assessed. PDF not yet retrieved. |
O'Donnell‐Australia 1999.
| Methods | Allocation: randomised. |
| Participants | Clients with schizophrenia and bipolar disorder, 18 to 65 years of age, referred for case management by community health services. |
| Interventions | 1. Standard case management. 2. Client‐focused case management. 3. Client‐focused case management plus consumer advocacy. |
| Outcomes | |
| Notes | Written to authors asking for caseload. |
Rivera‐New York 2007.
| Methods | Allocation: randomised. |
| Participants | 203 clients with severe and persistent mental illness. |
| Interventions | ICM vs peer‐enhanced ICM vs clinic‐based ICM. |
| Outcomes | |
| Notes | Written to authors asking for caseload. |
Ruggeri‐Italy.
| Methods | Allocation: randomised. |
| Participants | Adults with severe mental illness. |
| Interventions | 1. Multi‐element psychosocial intervention. 2. Standard care. |
| Outcomes | |
| Notes | Caseloads not reported. Unclear whether intervention is ICM. Written to authors for clarification. |
Sells‐Connecticut 2006.
| Methods | Allocation: randomised.
Design: multicentre (2 cities in Connecticut, not stated which ones).
Duration: 12 months.
Country: Connecticut, USA. Not entering meta‐regression. |
| Participants | Diagnosis*: severe mental illness (schizophrenia spectrum disorder, major mood disorder, or both). N = 137. Setting: public mental health centres, urban site. Age: 20 to 63 years, mean 41 yrs (SD 9 years). Sex: 61% M. Ethnicity: African‐American 28.5%. History: i. treatment disengagement, ii. informed consent provided. |
| Interventions | 1. ICM**: Case management services from peer providers partnered with ACT teams. Peer case manager. Caseload: 1:10‐12. N = 68. 2. Non‐ICM***: regular case management from regular providers. Caseload: ˜ 1:20‐24. N = 69. |
| Outcomes | Unable to use ‐ Service use: 26‐item self reported measure of service use (not peer reviewed). Level of engagement: rated using 1 item of Level of Care Utilization System (subscale not validated). Social functioning: subscale from Addiction Severity Index (ASI) (subscale not peer reviewed, data not reported). Client‐counsellor relationship: modified version of Barrett‐Lennard Relationship Inventory (BLRI) (not peer reviewed, modified by authors). |
| Notes | *61% psychiatric disorder; 63% major mood disorder; 72% substance abuse disorder; 70% co‐occurring disorder (psychotic disorder, mood disorder, or both plus substance abuse disorder).
**All peer staff had publicly disclosed histories of severe mental illness and some of co‐occurring drug use disorder. They received broad‐based training concerning the provision of case management service.
***Regular providers worked alongside peer providers on the same treatment teams. 1 additional paper requested. |
Sharifi‐Iran 2009.
| Methods | Allocation: randomised. |
| Participants | People with severe mental disorders. N = 120. |
| Interventions | 1. Home aftercare service: home visits by multidisciplinary teams, including general practitioners, nurses, and social workers supervised by psychiatrists. 2. Treatment as usual. |
| Outcomes | |
| Notes | Conference abstract, not enough information to determine inclusion/exclusion. Written to authors for clarification. |
Su‐China 2008.
| Methods | Allocation: randomised. |
| Participants | People with schizophrenia. |
| Interventions | Interventions: community‐based integrated intervention includes rehabilitation consultant, develop individualised rehabilitation plan, telephone follow‐up, and family psycho‐education. Caseload: the author did not state the caseload. |
| Outcomes | |
| Notes | In Chinese. To be assessed. |
Tan‐China 2005.
| Methods | Allocation: randomised, no further details. |
| Participants | Diagnosis: schizophrenia. |
| Interventions | 1. Experimental intervention: provided by team, caseload not reported. Providing: i. antipsychotic drug treatment; ii. family intervention; iii. occupational intervention; iv. rehabilitation intervention. 2. Control intervention: no details provided. |
| Outcomes | Awaiting further information from author about experimental intervention caseload. |
| Notes | In Chinese. To be assessed. |
Verhaegh‐Netherlands 2006.
| Methods | Allocation: unclear. |
| Participants | People with first‐episode psychosis, 18 to 35 years of age. |
| Interventions | 1. ACT with different modalities. 2. Care as usual. |
| Outcomes | |
| Notes | Unclear if this is a randomised study (caseload is also unclear). Main paper in Dutch to be assessed. Written to authors for clarification. |
Wang 2009.
| Methods | Allocation: randomised. |
| Participants | People with schizophrenia. |
| Interventions | Interventions: community‐based integrated intervention includes psycho‐education, direction on use of medication, social rehabilitation training, psychological intervention, and crisis intervention. Caseload: the author did not state the caseload. |
| Outcomes | |
| Notes | In Chinese. Asessed by Sai Zhao. (Wang 2009). Insufficient information to determine inclusion or exclusion; written to investigator. |
Zhang 2009.
| Methods | Allocation: randomised. |
| Participants | People with schizophrenia. |
| Interventions | Interventions: community‐based integrated intervention includes psycho‐education, life skill training, and cognitive therapy. Caseload: the author did not state the caseload. |
| Outcomes | |
| Notes | In Chinese. Assessed by Sai Zhao. (Zhang 2009). Insufficient information to determine inclusion or exclusion; written to investigator. |
Zoeteman‐Netherlands.
| Methods | Allocation: randomised. |
| Participants | Homeless patients with severe mental illness. |
| Interventions | 1. ACT. 2. Case management. |
| Outcomes | |
| Notes | Trial completed, but no results or publication found. Caseload unclear. Written to investigator for clarification. |
ACT ‐ Assertive Community Treatment CCMD‐3 ‐ Chinese Classification of Mental Disorders ICM ‐ Intensive Case Management SD ‐ standard deviation
Characteristics of ongoing studies [ordered by study ID]
Koike‐Japan.
| Trial name or title | Comprehensive early intervention for patients with first‐episode psychosis in Japan (J‐CAP): study protocol for a randomised controlled trial. |
| Methods | Allocation: randomised. Blinding: Only assessors blinded. |
| Participants | People who received a diagnosis of F2 or F3 (ICD‐10), with psychotic symptoms. |
| Interventions | 1. Comprehensive community‐based care. 2. Standard care. N = expected 150. Age: 15 to 35 years. |
| Outcomes | Primary outcome: Global Assessment of Functioning (GAF‐F) scores at the first endpoint. Secondary outcomes: GAF‐F at the second and last endpoints, symptom domain of Global Assessment of Functioning (GAF‐S), PANSS, the World Health Organization Quality of Life 26‐item version (WHOQOL‐BREF), Brief Evaluation of Medication Influences and Beliefs (BEMIB), care satisfaction of participants and their families, educational and vocational recovery rates, remission rate, readmission rate, lost to follow‐up rate, self harm and suicide attempt rate, suicide rate, engagement behaviour, and direct and indirect costs at each endpoint. |
| Starting date | March 2011. |
| Contact information | skoike‐tky@umin.ac.jp; nishida‐at@igakuken.or.jp |
| Notes | The University Hospital Medical Information Network Clinical Trials Registry (No. UMIN000005092). Expected completion date: September 2017. |
Lutgens 2015.
| Trial name or title | A five‐year randomized parallel and blinded clinical trial of an extended specialized early intervention vs. regular care in the early phase of psychotic disorders. |
| Methods | Allocation: randomised. |
| Participants | People with first‐episode psychosis. |
| Interventions | 1. Extended Specialized Early Intervention: modified assertive case management; psycho‐education for families; multiple‐family intervention; cognitive behavioural therapy; and substance abuse treatment and monitoring. 2. Regular care. |
| Outcomes | Primary outcomes: proportion of participants in complete remission and mean length of remission achieved. Secondary outcomes: relapse, functioning, quality of life. |
| Starting date | |
| Contact information | Danyael Lutgens: Danyael.Lutgens@douglas.mcgill.ca |
| Notes |
Malla‐Canada.
| Trial name or title | Extending specialized early intervention service from 2 to 5 years: a randomised controlled trial. |
| Methods | Allocation: randomised. |
| Participants | Adults with severe mental illness. |
| Interventions | 1. Extended Specialized Early Intervention. 2. Usual care. |
| Outcomes | Rates of sustained engagement, length of remission, health economic indices. |
| Starting date | |
| Contact information | Ashok Malla: ashok.malla@mcgill.ca |
| Notes | Conference abstracts with brief interim results only. |
NCT01313052.
| Trial name or title | Forensic Assertive Community Treatment: an emerging model of service delivery (FACT). |
| Methods | Allocation: randomised, open, and parallel. |
| Participants | Individuals diagnosed with any psychotic disorder such as schizophrenia, schizoaffective disorder, bipolar disorder with psychotic features, depressive disorder with psychotic features, and psychotic disorder, not otherwise specified, who currently face misdemeanor or violation charges and have not yet been sentenced; N = 53. |
| Interventions | 1. Forensic Assertive Community Treatment (FACT): services of an Assertive Community Treatment team and close supervision of a judge trained in the FACT model. 2. Enhanced treatment as usual: expedited appointment at a clinic specialising in the treatment of psychotic disorders; services of a therapist, psychiatrist, and case manager. |
| Outcomes | Jail recidivism; mental health service utilisation. |
| Starting date | May 2008. |
| Contact information | Steven Lamberti, University of Rochester. |
| Notes | Completed, no results posted, no publications found. Written to author for further information. Received email from S. Lamberti on 30 December 2015 stating that they are unable to share the results at this time as they are being prepared for publication. Awaiting publication. |
RISE ‐ Ethiopia.
| Trial name or title | RISE (Rehabilitation Intervention for People With Schizophrenia in Ethiopia). |
| Methods | Cluster randomised trial. |
| Participants | Adults with a diagnosis of schizophrenia spectrum disorder (schizophrenia, schizoaffective disorder, or schizophreniform disorder) using (DSM‐IV) criteria. |
| Interventions | 1. Communitybased rehabilitation: delivered to participants and their caregivers at their home, comprising psycho‐education, adherence support, rehabilitation (including self care and social skills), family support groups, and accessing existing community organisations. The intervention also involves community awareness raising and education and mobilisation of community leaders; antipsychotic medication prescribed by a nurse or clinical officer in a health centre; and basic psycho‐education. 2. Facility‐based usual care: antipsychotic medication prescribed by a nurse or clinical officer in a health centre and basic psycho‐education. |
| Outcomes | Disability, symptom severity, Clinical Global Impression, relapse, functioning, economic activity of participant (employment, income, and household work), medication adherence, engagement with facility‐based care, proportion with human rights problems, nutritional status (BMI), serious adverse events, etc. |
| Starting date | September 2015. |
| Contact information | Mary De Silva, PhD MSc, London School of Hygiene and Tropical Medicine. Abebaw Fekadu, Addis Ababa University Department of Psychiatry. |
| Notes | Currently recruiting. |
Walsh‐Connecticut.
| Trial name or title | Specialized Treatment Early in Psychosis (STEP). |
| Methods | Allocation: randomised. Blinding: open label. |
| Participants | Diagnosis: schizophrenia spectrum psychosis or affective psychosis (DSM‐IV, SCID). N = expected 200. Age: 16 to 45 years. History: ≦ 8 weeks of received antipsychotic treatment lifetime, informed consent, no psychosis believed due to substance use. |
| Interventions | 1. Specialised early treatment: including individual case management, antipsychotic prescription, multifamily group therapy, group cognitive behavioural therapy, and cognitive remediation. 2. Standard care: usual referral to CMHC. |
| Outcomes | Primary outcomes: service use: rehospitalisation (measured every 6 months for 5 yrs). Secondary outcomes: relapse, overall functioning, quality of life, education and employment status, treatment satisfaction, adherence, substance use, adverse effects (including self harm and violence), medication side effect, economic measures. |
| Starting date | March 2006. |
| Contact information | barbara.walsh@yale.edu; vinod.srihari@yale.edu |
| Notes | ClinicalTrials.gov identifier: NCT00309452
Expected completion: September 2011. NOTE: Results are available in Srihari VH, Tek C, Kucukgoncu S, Phutane VH, Breitborde NJ, Pollard J, Ozkan B, Saksa J, Walsh BC, Woods SW. First‐episode services for psychotic disorders in the U.S. public sector: a pragmatic randomized controlled trial. Psychiatric Services 2015 Jul;66(7):705‐12. |
BMI ‐ body mass index CMHC ‐ Community Mental Health Centre DSM ‐ Diagnostic and Statistical Manual of Mental Disorders ICD‐10 ‐ International Statistical Classification of Diseases and Related Health Problems 10th Revision PANSS ‐ Positive and Negative Syndrome Scale SCID ‐ Structured Clinical Interview for DSM‐IV (First 1997)
Differences between protocol and review
The following section follows the numbering system of the methods of the review. 1.) Types of outcome measures (see Types of outcome measures) The time grouping of outcomes has been slightly amended in the review, introducing a different timing for follow‐up assessed once the active intervention was stopped. We have reported the protocol version below.
Outcomes were grouped by time into short term (up to and including 6 months), medium term (7 months to up to and including 12 months) and long term (over 12 months). Where available, 24 months was the preferred follow‐up point for calculating mean days per months in hospital. If more than one follow‐up point within the same period were available, we reported the latest one.
2.) Some social functioning and costs outcomes have been slightly amended in the review (see Secondary outcomes). We have reported the protocol version below.
4. Social functioning
4.1 Imprisonment (i.e. police contacts & arrests)
9. Economic
9.1 Costs of psychiatric hospital care 9.2 Costs of health care 9.3 Costs of all care
3.) Compliance with medication (see Secondary outcomes) This secondary outcome was listed twice in the protocol due to inattention (both as global state and behaviour). We have amended it, listing 'compliance with medication' just under 'global state' outcome.
4.) Data regarding criteria and outcomes (see Data extraction and management) We further clarified this section in the review. We have reported the protocol version below.
1. Extraction
1.1 Data regarding criteria and outcomes Authors MD and CBI independently extracted data from included studies. Again, any disagreement was discussed, decisions documented and, if necessary, authors of studies were contacted for clarification. With remaining problems MM helped clarify issues and those final decisions were documented. Data presented only in graphs and figures were extracted whenever possible, but were included only if two reviewers independently had the same result. Attempts were made to contact authors through an open‐ended request in order to obtain missing information or for clarification whenever necessary. Where possible, we extracted data relevant to each component centre of multi‐centre studies separately.
5.) Skewed data (see Data extraction and management) We had not anticipated the following clarification in the protocol, but added it in the review.
We implemented one exception to the above rules in order to present more data, recognising that this is a post hoc decision, but also that the rules with regards to management of skewed data and how robust skewed data are within meta‐analysis are unclear (Higgins 2011). Where mean number of days in hospital data were skewed, and they were provided by studies of fewer than 200 participants, we entered those data into a subgroup of the overall analysis. We also presented the overall effect from all data pooled.
6.) 'Summary of findings' table (see Data extraction and management) The way the outcomes included in the 'Summary of findings' table were listed and presented were slightly rearranged, but not substantially modified. We have reported the protocol version below. Besides, we decided not to apply the low and high control risk calculation as stated in the protocol, and reported below.
Summary of findings table We anticipate including the following long term main outcomes in a summary of findings table.
1. Global state
1.1 Hospitalisation: mean number of days per month in hospital 1.2 Relapse 1.3 Leaving the study early (lost to follow up)
2. Service use
2.1 Hospital admission across time
3. Adverse effect
3.1 Death ‐ suicide
4. Social functioning
4.1 Employment ‐ unemployed at end of study
5. Mental state: general symptoms
5.1. Not improved to a clinically meaningful extent (as defined in trial) Within the Summary of findings table we assumed for calculation of the low risk groups that the lowest control risk applied to all data. We did the same for the assumption of the highest risk groups.
7.) Assessment of risk of bias in included studies (see Assessment of risk of bias in included studies) We further clarified this section in the review. We have reported the protocol version below.
Again working independently, MD and CBI assessed risk of bias using the tool described in the Cochrane Collaboration Handbook (Higgins 2011). This tool encourages consideration of how the sequence was generated, how allocation was concealed, the integrity of blinding at outcome, the completeness of outcome data, selective reporting and other biases. We would have excluded studies where allocation was clearly not concealed.
8.) Binary (see Dealing with missing data, 2.)
We have further clarified this paragraph in the review. We have reported the protocol version below.
In the case where attrition for a binary outcome is between 0 and 50% and where these data were not clearly described, data were presented on a 'once‐randomised‐always‐analyse' basis (an intention to treat analysis). Those leaving the study early were all assumed to have the same rates of negative outcome as those who completed, with the exception of the outcome of death. A sensitivity analysis was undertaken testing how prone the primary outcomes were to change when data from only those who completed the study were compared with intention to treat data using the assumption outlined above.
9.) Standard deviation mean number of days per month in hospital (see Dealing with missing data, 3.2.2) Substantially amended. For original protocol version, please see Appendix 5.
10.) Incomplete data for meta‐regression (see Dealing with missing data, 3.4) Substantially amended. For original protocol version, please see Appendix 6.
11.) Statistical heterogeneity (see Assessment of heterogeneity, 3.2) We further clarified the last paragraph in the review. We have reported the protocol version below.
3.2 Employing the I2statistic
Heterogeneity between studies was investigated by considering the I2 method alongside the Chi2 'p' value. The I2 provides an estimate of the percentage of inconsistency thought to be due to chance (Higgins 2003). The importance of the observed value of I2 depends on i. magnitude and direction of effects and ii. strength of evidence for heterogeneity (e.g. 'p' value from Chi2 test, or a confidence interval for I2). I2 estimate greater than or equal to 50% accompanied by a statistically significant Chi2 statistic, was interpreted as evidence of substantial levels of heterogeneity (Section 9.5.2 ‐ Higgins 2011) and reasons for heterogeneity were explored. If the inconsistency was high and the clear reasons were found, data were presented separately.
12.) Subgroup analyses (see Subgroup analysis and investigation of heterogeneity, 1.) No subgroup analyses had been anticipated in the protocol.
13. Subgroup analyses (see Subgroup analysis and investigation of heterogeneity, 2.) We further clarified this section in the review. We have reported the protocol version below.
2. Investigation of heterogeneity
2.1 Unanticipated heterogeneity Should unanticipated clinical or methodological heterogeneity be obvious we will simply state hypotheses regarding these for future reviews or versions of this review. We do not anticipate undertaking analyses relating to these.
14.) Sensitivity analysis (see Sensitivity analysis, 4.) Substantially amended. We have reported the protocol version below.
4. Assumptions for incomplete data for meta‐regression Where assumptions had to be made regarding missing trial data for meta‐regression (see Dealing with missing data) we compared the findings of the meta‐regression on primary outcome when we used our assumption compared with completer data only. A sensitivity analysis was undertaken testing how prone result from meta‐regression were to change when 'completed' data only were compared to the imputed data using the above assumption. If there was a substantial difference, then only completed data were employed.
Contributions of authors
Marina Dieterich: developed and wrote protocol, participated in literature searches, selected studies and extracted data, wrote report for both versions. Claire Irving: developed and wrote protocol, participated in studies selection and data extraction for original version. Hanna Bergman: carried out trial selection and data extraction for 2015 update. Mariam Khokhar: carried out trial selection and data extraction for 2015 update. Bert Park: carried out meta‐regression analysis, helped in writing the report for original version. Max Marshall: developed and wrote protocol, helped in studies selection, final draft for original version.
Sources of support
Internal sources
-
University of Verona, Italy.
Department of Medicine and Public Health, Section of Psychiatry and Clinical Psychology
External sources
-
NIHR, UK.
Cochrane Incentive Award 15/81/30 ‐ Intensive case management for severe mental illness
Declarations of interest
Marina Dieterich: none known. Claire Irving: none known. Hanna Bergman: none known. Mariam Khokhar: none known. Bert Park: none known. Max Marshall: was involved in one included study and has written extensively in this area.
New search for studies and content updated (no change to conclusions)
References
References to studies included in this review
Aberg‐Wistedt‐Sweden 1995 {published data only}
- Aberg‐Wistedt A, Cressell T, Lidberg Y, Liljenberg B, Osby U. Two‐year outcome of team‐based Intensive Case Management for patients with schizophrenia. Psychiatric Services 1995;46:1263‐6. [DOI] [PubMed] [Google Scholar]
Audini‐UK 1994 {published data only}
- Audini B, Marks IM, Lawrence RE, Connolly J, Watts V. Home‐based versus out‐patient‐in‐patient care for people with serious mental illness. Phase II of a controlled study. British Journal of Psychiatry 1994;165(August):204‐10. [DOI] [PubMed] [Google Scholar]
- Knapp MRJ, Marks IM, Wolstenholme J, Beecham JK, Astin J, Audini B, et al. Home‐based versus hospital‐based care for serious mental illness: controlled cost‐effectiveness study over four years. British Journal of Psychiatry 1998;172(6):506‐12. [DOI] [PubMed] [Google Scholar]
Bjorkman‐Sweden 2002 {published and unpublished data}
- Bjorkman T. Further information on case management study [personal communication]. Email to: M Dieterich 22 April 2009.
- Bjorkman T, Hansson L, Sandlund M. Outcome of case management based on the strengths model compared to standard care. A randomised controlled trial. Social Psychiatry and Psychiatric Epidemiology 2002;37(4):147‐52. [DOI] [PubMed] [Google Scholar]
Bond‐Chicago1 1990 {published data only}
- Bond GR, Witheridge TF, Dincin J, Wasmer D, Webb J, Graaf‐Kaser R. Assertive community treatment for frequent users of psychiatric hospitals in a large city: a controlled study. American Journal of Community Psychology 1990;18(6):865‐91. [DOI] [PubMed] [Google Scholar]
Bond‐Indiana1 (A) {published data only}
- Bond GR, Miller LD, Krumwied RD, Ward RS. Assertive case management in three CMHCs: a controlled study. Hospital and Community Psychiatry 1988;39(4):411‐8. [PUBMED: 2836295] [DOI] [PubMed] [Google Scholar]
Bond‐Indiana1 (B) {published data only}
- See above Bond‐Indiana1.
Bond‐Indiana1 (C) {published data only}
- See above Bond‐Indiana1.
Bond‐Indiana1 1988 {published data only}
- Bond GR, Miller LD, Krumwied RD, Ward RS. Assertive case management in three CMHCs: a controlled study. Hospital and Community Psychiatry 1988;39(4):411‐8. [PUBMED: 2836295] [DOI] [PubMed] [Google Scholar]
Bush‐Georgia 1990 {published data only}
- Bush CT, Langford MW, Rosen P, Gott W. Operation outreach: Intensive Case Management for severely psychiatrically disabled adults. Hospital and Community Psychiatry 1990;41(6):647‐9. [PUBMED: 2361668] [DOI] [PubMed] [Google Scholar]
Chandler‐California1 (A) {published data only}
- See Chandler‐California 1991.
Chandler‐California1 (B) {published data only}
- See Chandler‐California 1991.
Chandler‐California1 1991 {published data only}
- Chandler D, Hu WT, Meisel J, McGowen M, Madison K. Mental health costs, other public costs, and family burden among mental health clients in capitated integrated service agencies. Journal of Mental Health Administration 1997;24(2):178‐88. [DOI] [PubMed] [Google Scholar]
- Chandler D, Meisel J, Hu T, McGowen M, Madison K. A capitated model for a cross‐section of severely mentally ill clients: employment outcomes. Community Mental Health Journal 1997;33(6):501‐16. [PUBMED: 9435997] [DOI] [PubMed] [Google Scholar]
- Chandler D, Meisel J, Hu TW, McGowen M, Madison K. Administrative update. A capitated model for a cross‐section of severely mentally ill clients: hospitalization. Community Mental Health Journal 1998;34(1):13‐26. [PUBMED: 9559237] [DOI] [PubMed] [Google Scholar]
- Chandler D, Meisel J, Hu TW, McGowen M, Madison K. Client outcomes in a three year controlled study of an integrated service agency model. Psychiatric Services 1996;47(12):1337‐43. [DOI] [PubMed] [Google Scholar]
- Chandler D, Meisel J, McGowen M, Mintz J, Madison K. Client outcomes in two model capitated integrated service agencies. Psychiatric Services 1996;47(2):175‐80. [PUBMED: 8825255] [DOI] [PubMed] [Google Scholar]
- Hargreaves WA. A capitation model for providing mental health services in California. Hospital and Community Psychiatry 1992;43:275‐7. [DOI] [PubMed] [Google Scholar]
- Hu T, Jerrell J. Cost‐effectiveness of alternative approaches in treating severely mentally ill in California. Schizophrenia Bulletin 1991;17(3):461‐8. [PUBMED: 1947870] [DOI] [PubMed] [Google Scholar]
- Meisel J, Chandler D. The Integrated Service Agency Model. California: Lewin‐VHI, 1995. [Google Scholar]
Chan‐Hong Kong 2000 {published data only}
- Chan S, Mackenzie A, Jacobs P. Cost‐effectiveness analysis of case management versus a routine community care organization for patients with chronic schizophrenia. Archives of Psychiatric Nursing 2000;14(2):98‐104. [MEDLINE: ] [DOI] [PubMed] [Google Scholar]
Curtis‐New York 1992 {published data only}
- Curtis JL, Millman EJ, Struening E, D'Ercole A. Deaths among former psychiatric inpatients in an outreach case management programme. Psychiatric Services 1996;47(4):398‐402. [DOI] [PubMed] [Google Scholar]
- Curtis JL, Millman EJ, Struening E, D'Ercole A. Effect of case management on rehospitalization and utilization of ambulatory care services. Hospital and Community Psychiatry 1992;43(9):895‐9. [DOI] [PubMed] [Google Scholar]
- Curtis JL, Millman EJ, Struening EL, D'Ercole A. Does outreach case management improve patients' quality of life?. Psychiatric Services 1998;49(3):351‐4. [DOI] [PubMed] [Google Scholar]
- D'Ercole A, Struening E, Curtis JL, Millman EJ, Morris A. Effects of diagnosis, demographic characteristics, and case management on rehospitalization. Psychiatric Services 1997;48(5):682‐8. [DOI] [PubMed] [Google Scholar]
Cusack‐North Carolina {published data only}
- Cusack KJ, Morrissey JP, Cuddeback GS, Prins A, Williams DM. Criminal justice involvement, behavioral health service use, and costs of forensic assertive community treatment: a randomized trial. Community Mental Health Journal 2010;46(4):356‐63. [MEDLINE: ] [DOI] [PMC free article] [PubMed] [Google Scholar]
Drake‐NHamp (A) {published data only}
- See above Drake‐NHamp.
Drake‐NHamp (B) {published data only}
- See above Drake‐NHamp.
Drake‐NHamp (C) {published data only}
- See above Drake‐NHamp.
Drake‐NHamp (D) {published data only}
- See above Drake‐NHamp.
Drake‐NHamp (E) {published data only}
- See above Drake‐NHamp.
Drake‐NHamp (F) {published data only}
- See above Drake‐NHamp.
Drake‐NHamp (G) {published data only}
- See above Drake‐NHamp.
Drake‐NHamp 1998 {published and unpublished data}
- Clark RE, Teague GB, Ricketts SK, Bush PW, Xie H, McGuire TG, et al. Cost‐effectiveness of assertive community treatment versus standard case management for persons with co‐occurring severe mental illness and substance use disorders. Health Services Research 1998;33(5):1285‐308. [PMC free article] [PubMed] [Google Scholar]
- Cleary M, Hunt G, Matheson S, Siegfried N, Walter G. Psychosocial interventions for people with both severe mental illness and substance misuse. Cochrane Database of Systematic Reviews 2008, Issue 1. [DOI: 10.1002/14651858.CD001088.pub2] [DOI] [PubMed] [Google Scholar]
- Drake RE, McHugo GJ, Clark RE, Teague GB, Xie H, Miles K, et al. Assertive community treatment for patients with co‐occurring severe mental illness and substance use disorder: a clinical trial. American Journal of Orthopsychiatry 1998;68(2):201‐15. [DOI] [PubMed] [Google Scholar]
- McHugo GJ, Drake RE, Teague GB, Xie H. Fidelity to assertive community treatment and client outcomes in the New Hampshire dual disorders study. Psychiatric Services 1999;50(6):818‐24. [DOI] [PubMed] [Google Scholar]
- Xie H, McHugo GJ, Helmstetter BS, Drake RE. Three‐year recovery outcomes for long term patients with co‐occurring schizophrenic and substance use disorders. Schizophrenia Research 2005;75(2‐3):337‐48. [PUBMED: 15885525] [DOI] [PubMed] [Google Scholar]
Essock‐Connecticut1 1995 {published and unpublished data}
- Essock S. Further information about a trial [personal communication]. Email to: M Dieterich 13 May 2009.
- Essock SM. Act versus standard case management clients use different services. 153rd Annual Meeting of the American Psychiatric Association; 2000 May 13‐18, Chicago (IL). 2000.
- Essock SM, Frisman LK, Kontos NJ. Cost‐effectiveness of assertive community treatment teams. American Journal of Orthopsychiatry 1998;68(2):179‐90. [DOI] [PubMed] [Google Scholar]
- Essock SM, Kontos N. Implementing assertive community treatment teams. Psychiatric Services 1995;46(7):679‐83. [DOI] [PubMed] [Google Scholar]
Essock‐Connecticut2 2006 {published and unpublished data}
- Essock S. Further information about a trial [personal communication]. Email to: M Dieterich 13 May 2009.
- Essock SM. Assertive community treatment for the dually diagnosed. CRISP Database (www‐commons.cit.nih.gov/crisp/index.html) (accessed 19 February 2001).
- Essock SM, Mueser KT, Drake RE, Covell NH, McHugo GJ, Frisman LK, et al. Comparison of ACT and standard case management for delivering integrated treatment for co‐occurring disorders. Psychiatric Services 2006;57(2):185‐96. [PUBMED: 16452695] [DOI] [PubMed] [Google Scholar]
- Manuel JI, Covell NH, Jackson CT, Essock SM. Does assertive community treatment increase medication adherence for people with co‐occurring psychotic and substance use disorders?. Journal of the American Psychiatric Nurses Association 2011;17(1):51‐6. [DOI] [PMC free article] [PubMed] [Google Scholar]
Ford‐UK 1995 {published data only}
- Ford R, Barnes A, Davies R, Chalmers C, Hardy P, Muijen M. Maintaining contact with people with severe mental illness: 5‐year follow‐up of assertive outreach. Psychiatric Epidemiology 2001;36(9):444‐7. [DOI] [PubMed] [Google Scholar]
- Ford R, Beadsmoore A, Ryan P, Repper J, Craig T, Muijen M. Providing the safety net: case management for people with a serious mental illness. Journal of Mental Health 1995;4(1):91‐7. [Google Scholar]
- Ford R, Raftery J, Ryan P, Beadsmoore A, Craig T, Muijen M. Intensive case management for people with serious mental illness ‐ Site 2: cost‐effectiveness. Journal of Mental Health 1997;6(2):191‐9. [Google Scholar]
- Ford R, Ryan P, Beadsmore A, Craig T, Muijen M. Intensive care management for people with serious mental illness ‐ site 2: clinical and social outcome. Journal of Mental Health 1997;6(2):181‐90. [Google Scholar]
- Ryan P, Ford R, Beadsmoore A, Muijen M. The enduring relevance of case management. British Journal of Social Work 1999;29(1):97‐125. [Google Scholar]
Hampton‐Illinois (A) {published data only}
- See above Hampton‐Illinois.
Hampton‐Illinois (B) {published data only}
- See above Hampton‐Illinois.
Hampton‐Illinois 1992 {published data only}
- Hampton B, Korr W, Bond G, Mayes J, Havis P. Integration services system approach to avert homelessness; CSP homeless prevention project for HMI adults. Final report to State of Illinois NIMH Demonstration Grant Project 1992.
- Korr WS, Joseph A. Housing the homeless mentally ill: findings from Chicago. Journal of Social Service Research 1996;21(1):53‐68. [Google Scholar]
Harrison‐Read‐UK 2000 {published data only}
- Harrison‐Read P. A randomised controlled trial of short term intensive community case management of severe mental illness: an assessment of its benefit to 'heavy users' of hospital services and cost effectiveness. National Research Register 2000.
- Harrison‐Read P. A randomised controlled trial of short term intensive community case management of severe mental illness: an assessment of its benefit to 'heavy users' of hospital services and cost effectiveness. www.isrctn.com/ISRCTN56473864 (accessed: 31 January 2004). [ISRCTN: 56473864]
- Harrison‐Read P, Lucas B, Tyrer P, Ray J, Shipley K, Simmonds S, et al. Heavy users of acute psychiatric beds: randomized controlled trial of enhanced community management in an outer London borough. Psychological Medicine 2002;32(3):403‐16. [DOI] [PubMed] [Google Scholar]
Herinckx‐Oregon 1996 {published data only}
- Clarke GN, Herinckx HA, Kinney RF, Paulson RI, Cutler DL, Lewis K, et al. Psychiatric hospitalizations, arrests, emergency room visits, and homelessness of clients with serious and persistent mental illness: findings from a randomized trial of two ACT programmes vs. usual care. Mental Health Services Research 2000;2(3):155‐64. [PUBMED: 11256724] [DOI] [PubMed] [Google Scholar]
- Herinckx HA, Kinney RF, Clarke GN, Paulson RI. Assertive community treatment versus usual care in engaging and retaining clients with severe mental illness. Psychiatric Services 1997;48(10):1297‐306. [PUBMED: 9323749] [DOI] [PubMed] [Google Scholar]
- Paulson R, Herinckx H, Demmler J, Clarke G, Cutler D, Birecree E. Comparing practice patterns of consumer and non‐consumer mental health service providers. Community Mental Health Journal 1999;35(3):251‐69. [DOI] [PubMed] [Google Scholar]
- Paulson RI, Clarke G, Herinckx H, Kinney R, Lewis K, Oxman E. First year outcomes from a randomised trial comparing consumer and non‐consumer assertive community treatment teams with usual care. Fourth International Conference on Schizophrenia ‐ 1996: Breaking Down the Barriers; 1996 Oct 6‐9; Vancouver, Canada. 1996.
Holloway‐UK 1996 {published and unpublished data}
- Cullen D, Waite A, Oliver N, Carson J, Holloway F. Case management for the mentally ill: a comparative evaluation of client satisfaction. Health and Social Care in the Community 1997;5:106‐15. [Google Scholar]
- Holloway F. Further information on ICM study [personal communication]. Email to: M Dieterich 15 April 2009.
- Holloway F, Carson J. Intensive case management for the severely mentally ill. Controlled trial. British Journal of Psychiatry 1998;172:19‐22. [PUBMED: 9534826] [DOI] [PubMed] [Google Scholar]
- Holloway F, Carson J. Intensive case management: does it work?. Eighth Congress of the Association of European Psychiatrists; 1996 Jul 7‐12; London, UK. 1996.
- Holloway F, Carson J. Subjective quality of life, psychopathology, satisfaction with care and insight: an exploratory study. International Journal of Social Psychiatry 1999;45(4):259‐67. [PUBMED: 10689609] [DOI] [PubMed] [Google Scholar]
- Holloway F, Murray M, Squire C, Carson J. Intensive case management: putting it into practice. Psychiatric Bulletin 1996;20:395‐7. [Google Scholar]
Jerrell‐SCarolina1 1991 {published data only}
- Hu T, Jerrell J. Cost‐effectiveness of alternative approaches in treating severely mentally ill in California. Schizophrenia Bulletin 1991;17(3):461‐8. [PUBMED: 1947870] [DOI] [PubMed] [Google Scholar]
- Hu TW, Jerrell JM. Estimating the cost impact of three case management programmes for treating people with severe mental illness. British Journal of Psychiatry 1998;173(36):26‐32. [PUBMED: 9829008] [PubMed] [Google Scholar]
- Jerrell JM. Toward managed care for persons with severe mental illness: implications from a cost‐effectiveness study. Health Affairs 1995;14:197‐207. [PUBMED: 7498892] [DOI] [PubMed] [Google Scholar]
- Schmidt‐Posner J, Jerrell JM. Qualitative analysis of three case management programmes. Community Mental Health Journal 1998;34(4):381‐92. [DOI] [PubMed] [Google Scholar]
Johnston‐Australia 1998 {published data only}
- Issakidis C, Sanderson K, Teesson M, Johnston S, Buhrich N. Intensive case management in Australia: a randomized controlled trial. Acta Psychiatrica Scandinavica 1999;99:360‐7. [PUBMED: 10353452] [DOI] [PubMed] [Google Scholar]
- Johnston S, Salkeld G, Sanderson K, Issakidis C, Teesson M, Buhrich N. Intensive case management: a cost effectiveness analysis. Australian and New Zealand Journal of Psychiatry 1998;32(4):551‐9. [PUBMED: 9711370] [DOI] [PubMed] [Google Scholar]
Lehman‐Maryland1 1994 {published and unpublished data}
- Dixon L, Bruce D, Eimer K, Anthony F. Outcomes of homeless persons with mental illness and substance use disorders. 149th Annual Meeting of the American Psychiatric Association; 1996 May 4‐9, New York (NY). 1996.
- Dixon L, Kernan E, Krauss N, Lehman A, Deforge BR. Assertive community treatment for homeless adults with severe mental illness in Baltimore. In: Breakey WR, Thompson JW editor(s). Mentally Ill and Homeless: Special Programs for Special Needs. Chronic Mental Illness. Harwood Academic, 1997. [Google Scholar]
- Dixon L, Krauss N, Myers P, Lehman A. Clinical and treatment correlates of access to section 8 certificates for homeless mentally ill persons. Hospital and Community Psychiatry 1994;45(12):1196‐200. [DOI] [PubMed] [Google Scholar]
- Dixon L, Weiden P, Torres M, Lehman A. Assertive community treatment and medication compliance in the homeless mentally ill. American Journal of Psychiatry 1997;154(9):1302‐4. [DOI] [PubMed] [Google Scholar]
- Hackman AL. Assertive community treatment with homeless individuals. 156th Annual Meeting of the American Psychiatric Association; 2003 May 17‐22; San Francisco. 2003.
- Hackman AL, Dixon LB, Postrado LT, Delahanty JC. Somatic issues in persons with severe psychiatric illness and homelessness. 151st Annual Meeting of the American Psychiatric Association; 1998 May 30 ‐ Jun 4; Toronto. 1998.
- Lehman AF, Dixon L, Hoch JS, DeForge B, Kernan E, Frank R. Cost‐effectiveness of assertive community treatment for homeless persons with severe mental illness. British Journal of Psychiatry 1999;174:346‐52. [PUBMED: 10533554] [DOI] [PubMed] [Google Scholar]
- Lehman AF, Dixon LB, DeForge BR, Kernan E. Assertive community treatment for homeless persons with schizophrenia and other chronic mental disorders. Schizophrenia Research 1995;15(1, 2):128. [Google Scholar]
- Lehman AF, Dixon LB, Kernan E, DeForge BR, Postrado LT. A randomized trial of assertive community treatment for homeless persons with severe mental illness. Archives of General Psychiatry 1997;54(11):1038‐43. [PUBMED: 9366661] [DOI] [PubMed] [Google Scholar]
- Lehman AF, Dixon LB, Kernan E, Deforge B. Assertive treatment for the homeless mentally ill. 148th Annual Meeting of the American Psychiatric Association; 1995 May 20‐25; Miami. 1995.
- Marshall M, Lockwood A. Assertive community treatment for people with severe mental disorders. Cochrane Database of Systematic Reviews 2000, Issue 2. [DOI: 10.1002/14651858.CD001089] [DOI] [PubMed] [Google Scholar]
Macias‐Utah 1994 {published data only}
- Macias C, Kinney R, Farley OW, Jackson R, Vos B. The role of case management within a community support system: partnership with psychosocial rehabilitation. Community Mental Health Journal 1994;30(4):323‐39. [PUBMED: 7956109] [DOI] [PubMed] [Google Scholar]
Marshall‐UK 1995 {published and unpublished data}
- Gray AM, Marshall M, Lockwood A, Morris J. Problems in conducting economic evaluations alongside clinical trials. Lessons from a study of case management for people with mental disorders. British Journal of Psychiatry 1997;170:47‐52. [PUBMED: 9068775] [DOI] [PubMed] [Google Scholar]
- Marshall M, Gray A, Lockwood A, Green R. Case management for people with severe mental disorders . Cochrane Database of Systematic Reviews 2000, Issue 2. [DOI: 10.1002/14651858.CD000050] [DOI] [PubMed] [Google Scholar]
- Marshall M, Lockwood A, Gath D. Social services case‐management for long term mental disorders: a randomised controlled trial. Lancet 1995;345(8947):409‐12. [PUBMED: 7853949] [DOI] [PubMed] [Google Scholar]
McDonel‐Indiana (A) {published data only}
- See above McDonel‐Indiana.
McDonel‐Indiana (B) {published data only}
- See above McDonel‐Indiana.
McDonel‐Indiana 1997 {published data only}
- Fekete DM, Bond GR, McDonel EC, Salyers M, Chen A, Miller L. Rural assertive community treatment: a field experiment. Psychiatric Rehabilitation Journal 1998;21(4):371‐9. [Google Scholar]
- McDonel EC, Bond GR, Salyers M, Fekete D, Chen A, McGrew JH, et al. Implementing assertive community treatment programmes in rural settings. Administration and Policy in Mental Health 1997;25(2):153‐73. [DOI] [PubMed] [Google Scholar]
Morse‐Missouri1 1992 {published data only}
- Morse GA, Calsyn RJ, Allen G, Tempelhoff B, Smith R. Experimental comparison of the effects of three treatment programmes for homeless mentally ill people. Hospital and Community Psychiatry 1992;43(10):1005‐9. [DOI] [PubMed] [Google Scholar]
Morse‐Missouri3 2005 {published data only}
- Calsyn RJ, Yonker RD, Lemming MR, Morse GA, Klinkenberg WD. Impact of assertive community treatment and client characteristics on criminal justice outcomes in dual disorder homeless individuals. Criminal Behaviour and Mental Health 2005;15(4):236‐48. [PUBMED: 16575844] [DOI] [PubMed] [Google Scholar]
- Fletcher TD, Cunningham JL, Calsyn RJ, Morse GA, Klinkenberg WD. Evaluation of treatment programmes for dual disorder individuals: modelling longitudinal and mediation effects. Administration and Policy in Mental Health 2008;35(4):319‐36. [PUBMED: 18506618] [DOI] [PubMed] [Google Scholar]
- Morse GA, Calsyn RJ, Dean Klinkenberg W, Helminiak TW, Wolff N, Drake RE, et al. Treating homeless clients with severe mental illness and substance use disorders: costs and outcomes. Community Mental Health Journal 2006;42(4):377‐404. [PUBMED: 16897413] [DOI] [PubMed] [Google Scholar]
- Morse GA, Calsyn RJ, Klinkenberg WD, Cunningham J, Lemming MR. Integrated treatment for homeless clients with dual disorders: a quasi‐experimental evaluation. Journal of Dual Diagnosis 2008;4(3):219‐37. [Google Scholar]
Muijen‐UK2 1994 {published data only}
- McCrone P, Beecham J, Knapp M. Community psychiatric nurse teams: cost‐effectiveness of intensive support versus generic care. British Journal of Psychiatry 1994;164(2):218‐21. [DOI] [PubMed] [Google Scholar]
- Muijen M, Cooney M, Strathdee G, Bell R, Hudson A. Community psychiatric nurse teams: intensive support versus generic care. British Journal of Psychiatry 1994;165:211‐7. [DOI] [PubMed] [Google Scholar]
Muller‐Clemm‐Canada 1996 {published data only}
- Muller‐Clemm WJ. Halting the 'Revolving Door' of Serious Mental Illness: Evaluating an assertive case management programme (deinstitutionalization, community mental health). University of Victoria, Canada, 1996. [Google Scholar]
Okpaku‐Tennessee 1997 {published data only}
- Okpaku SO, Anderson KH, Sibulkin AE, Butler JS, Bickman L. The effectiveness of a multidisciplinary case management intervention on the employment of SSDI applicants and beneficiaries. Psychiatric Rehabilitation Journal 1997;20:34‐41. [Google Scholar]
OPUS‐Denmark 1999 {published data only}
- Austin S, Seche R, Hagen R, Mors O, Nordentoft M. Remission, metacognitive processes and quality of life‐outcomes from opus trial. A 10 year follow‐up of a randomized multi‐center trial of intensive early intervention vs. standard treatment for patients with first episode schizophrenia spectrum disorder. Schizophrenia Bulletin 2011;1:258. [Google Scholar]
- Bertelsen M. Randomized controlled trial of two‐years integrated treatment versus standard treatment of patients with first‐episode of schizophrenia or psychosis, five years follow‐up. The opus trial. Schizophrenia Bulletin 2005;31:519‐20. [Google Scholar]
- Bertelsen M, Jeppesen P, Petersen L, Thorup A, Ohlenschlaeger J, Quach P, et al. Course of illness in a sample of 265 patients with first‐episode psychosis ‐ five‐year follow‐up of the Danish OPUS trial. Schizophrenia Research 2009;107(2‐3):173‐8. [MEDLINE: ] [DOI] [PubMed] [Google Scholar]
- Bertelsen M, Jeppesen P, Petersen L, Thorup A, Ohlenschlaeger J, Quach P, et al. First episode of psychosis intensive early intervention programme versus standard treatment ‐ secondary publication. Ugeskrift for Laeger 2009;171(41):2992‐5. [MEDLINE: ] [PubMed] [Google Scholar]
- Bertelsen M, Jeppesen P, Petersen L, Thorup A, Ohlenschlaeger J, Quach P, et al. Five‐year follow‐up of a randomized multi‐centre trial of intensive early intervention vs standard treatment for patients with a first episode of psychotic illness: the OPUS trial. Archives of General Psychiatry 2008;65(7):762‐71. [PUBMED: 18606949] [DOI] [PubMed] [Google Scholar]
- Bertelsen M, Jeppesen P, Petersen L, Thorup A, Ohlenschlaeger J, Quach P, et al. The OPUS‐trial; a randomised multicentre single‐blinded trial of integrated versus standard treatment for patients with a first episode of psychotic illness ‐ five‐years follow‐up. Early Intervention in Psychiatry 2008;2(Suppl 1):A6. [Google Scholar]
- Bertelsen M, Quach P, Jeppesen P, Petersen L, Thorup A, Ohlenschlaeger J, et al. The OPUS trial: a randomised multi‐centre trial of intensive early‐intervention programme versus standard treatment for 547 first‐episode psychotic patients ‐ a five‐year follow up. The International Congress on Schizophrenia Research; 2009 Mar 28 ‐ Apr 1; San Diego (CA). 2009.
- Bertelsen M, Nordentoft M, Jeppesen P, Petersen L, Thorup A, Quach P. The opus trial: results from the five‐years follow‐up. Schizophrenia Bulletin 2007;33(2):421. [Google Scholar]
- Bertelsen M, Thorup A, Petersen L, Jeppesen P, Oehlenschlager J, Joergensen P, et al. The OPUS trial: results from the five‐year follow‐up. Schizophrenia Research 2006;86(Suppl 1):S43. [Google Scholar]
- Bertelsen MB. RCT of integrated treatment versus standard treatment of patients with first‐episode of schizophrenia ‐ 5 years follow up. Schizophrenia Research 2004;70(1):32. [Google Scholar]
- Hastrup LH, Kronborg C, Bertelsen M, Jeppesen P, Jorgensen P, Petersen L, et al. Cost‐effectiveness of early intervention in first‐episode psychosis: Economic evaluation of a randomised controlled trial (the opus study). British Journal of Psychiatry 2013;202(1):35‐41. [DOI] [PubMed] [Google Scholar]
- Hastrup LH, Kronborg C, Bertelsen M, Jeppesen P, Jorgensen P, Petersen L, et al. Cost‐effectiveness of early intervention in first‐episode psychosis: economic evaluation of a randomised controlled trial (the OPUS study). British Journal of Psychiatry 2013;202(1):35‐41. [DOI: 10.1192/bjp.bp.112.112300; PUBMED: 23174515] [DOI] [PubMed] [Google Scholar]
- Hastrup LH, Kronborg C, Nordentoft M, Simonsen E. Cost‐effectiveness of a randomized multicenter trial in first‐episode psychosis (OPUS) in Denmark. Journal of Mental Health Policy and Economics 2011:10.
- Jeppesen P, Abel MB, Krarup G, Jorgensen P, Nordentoft M. Family burden and expressed emotion in first episode psychosis. The OPUS‐trial. Third International Conference on Early Psychosis; 2002 Sep 25‐28; Copenhagen. 2002.
- Jeppesen P, Hemmingsen R, Jírgensen P, Reisby N, Abel MB, Nordentoft M. Opus project: impact of mental disorder on caregivers. 11th World Congress of Psychiatry; 1999 Aug 6‐11; Hamburg. 1999; Vol. 2.
- Jeppesen P, Hemmingsen R, Reisby N, Jørgensen P, Nordentoft M, Abel MB. The impact of mental disorder on caregivers. 11th World Congress of Psychiatry; 1999 Aug 6‐11; Hamburg. 1999; Vol. 2.
- Jeppesen P, Nordentoft M, Abel M, Hemmingsen RP, Joergensen, Kassow P. Opus‐project: a RCT of integrated psychiatric treatment for recent onset psychotic patients. Schizophrenia Research 2001;49(1, 2):262. [Google Scholar]
- Jeppesen P, Nordentoft M, Jorgensen P, Abel MB, Reisby N, Hemmingsen R, et al. Opus‐project: better compliance? A randomised‐controlled trial of integrated care of first‐episode psychotic patients. Conference abstract. Schizophrenia Research 1999;36(1‐3):327. [Google Scholar]
- Jeppesen P, Petersen L, Thorup A, Abel MB, Oehlenschlaeger J, Christensen TO, et al. Integrated treatment of first‐episode psychosis: effect of treatment on family burden: OPUS trial. British Journal of Psychiatry 2005;48(Suppl):s85‐90. [PUBMED: 16055815] [DOI] [PubMed] [Google Scholar]
- Jørgensen P, Jeppesen P, Abel MB, Kassow P, Krarup G, Hemmingsen R, et al. Early intervention in schizophrenia. Nordic Journal of Psychiatry 2002;56(2):8. [Google Scholar]
- Jørgensen P, Nordentoft M, Abel MB, Gouliaev G, Jeppesen P, Kassow P. Early detection and assertive community treatment of young psychotics: the Opus study rationale and design of the trial. Social Psychiatry and Psychiatric Epidemiology 2000;35(7):283‐7. [PUBMED: 11016522] [DOI] [PubMed] [Google Scholar]
- Melau M. Treatment response, working alliance and patients' perspective: results from opus i and opus ii. Early Intervention in Psychiatry 2010;4(Suppl 1):152. [Google Scholar]
- Melau M, Bertelsen M, Jeppesen P, Krarup G, Nordentoft M, Thorup A, et al. A randomised clinical trial of the effect of five‐years versus two‐years specialised assertive intervention for first episode psychosis ‐ the opus‐II trial. Schizophrenia Research 2010;117(2‐3):526. [DOI] [PMC free article] [PubMed] [Google Scholar]
- Melau M, Jeppesen P, Thorup A, Bertelsen M, Petersen L, Gluud C, et al. The effect of five years versus two years of specialised assertive intervention for first episode psychosis ‐ opus ii: study protocol for a randomized controlled trial. Trials 2011;12:72. [DOI] [PMC free article] [PubMed] [Google Scholar]
- Melau M, Thorup A, Bertelsen M, Jeppesen P, Krarup G, Nordentoft M. Does extended specialized intervention for patients with first episode psychosis improve outcome in the critical period? The opus ii trial. Schizophrenia Bulletin 2011;1:315. [Google Scholar]
- NCT00914238. Extended specialized assertive intervention for first episode psychosis. clinicaltrials.gov/ct2/show/NCT00914238 (first received 28 May 2009).
- Nordentoft M. Randomised clinical trial of integrated treatment versus standard treatment in first episode psychosis. www.clinicaltrials.gov (first received 2005).
- Nordentoft M, Bertelsen M, Jeppesen P, Thorup A, Petersen L, Ohlenschlaeger J, et al. OPUS trial: a randomised multicentre trial of integrated versus standard treatment for patients with a first episode of psychotic illness. Nordic Journal of Psychiatry 2007;61(6):488. [Google Scholar]
- Nordentoft M, Bertelsen M, Thorup A, Jeppesen P, Petersen L. The opus‐trial; a randomised multi‐centre trial of integrated versus standard treatment for patients with a first episode of psychotic illness ‐ five‐years follow‐up. 12th International Congress on Schizophrenia Research; 2009 Mar 28 ‐ Apr 1; San Diego (CA). 2009:370.
- Nordentoft M, Bertelsen M, Thorup A, Petersen L. Two versus 5 years of early intensive intervention in first episode psychosis. Early Intervention in Psychiatry 2008;2(Suppl 1):A7. [Google Scholar]
- Nordentoft M, Jeppesen P, Abel M, Kassow P, Petersen L, Thorup A, et al. OPUS study: suicidal behaviour, suicidal ideation and hopelessness among patients with first‐episode psychosis. One‐year follow‐up of a randomised controlled trial. British Journal of Psychiatry 2002;181(Suppl 43):S98‐106. [PUBMED: 12271808] [DOI] [PubMed] [Google Scholar]
- Nordentoft M, Jeppesen P, Abel M, Petersen L, Thorup A, Christensen T, et al. Opus‐project: a randomised controlled trial of integrated psychiatric treatment in first‐episode psychosis ‐ clinical outcome improved. Third International Conference on Early Psychosis; 2002 Sep 25‐28; Copenhagen. 2002.
- Nordentoft M, Jeppesen P, Jorgensen P, Abel MB, Kassow P, Reisby N, et al. OPUS‐project: a randomised controlled trial of first episode psychotic patients: better compliance. Nordic Journal of Psychiatry 2000;54:16. [Google Scholar]
- Nordentoft M, Jeppesen P, Jørgensen P, Abel MB, Kassow P, Reisby N, et al. Opus ‐ project: a randomised controlled trial of first episode psychotic patients: better compliance. Second International Conference on Early Psychosis; 2000 Mar 31 ‐ Apr 2, New York (NY). 2000.
- Nordentoft M, Jeppesen P, Kassow P, Abel M, Petersen L, Thorup A, et al. Opus‐project: a randomised controlled trial of integrated psychiatric treatment in first‐episode psychosis ‐ clinical outcome improved. Schizophrenia Research 2002;53(3 Suppl 1):51. [Google Scholar]
- Nordentoft M, Jeppesen P, Petersen L, Thorup A, Abel M. OPUS project: a randomised controlled trial of integrated psychiatric treatment in first episode psychosis. Ninth International Congress on Schizophrenia Research; 2003 Mar 29 ‐ Apr 2, Colorado Springs (CO). 2003.
- Nordentoft M, Jeppesen P, Petersen L, Thorup A, Abel M, Ohlenschlaeger JK, et al. OPUS project: a randomised controlled trial of integrated psychiatric treatment in first episode psychosis. Schizophrenia Research 2003;60(1):297. [Google Scholar]
- Nordentoft M, Jeppesen P, Petersen L, Thorup A, Jorgensen P. Duration of untreated psychosis predicts psychotic symptoms but not negative symptoms. Schizophrenia Bulletin 2005;31:234. [Google Scholar]
- Nordentoft M, Jeppesen P, Petersen L, Thorup A, Krarup G, Abel M, et al. The Danish opus‐trial: a randomised controlled trial of integrated treatment among 547 first‐episode psychotic patients. One and two years follow‐up. Schizophrenia Research 2004;67(1):35‐6. [Google Scholar]
- Nordentoft M, Jeppesen P, Petersen L, Thorup A, Ohlenschlaeger J, Christensen T, et al. The OPUS trial: a randomised multi‐centre trial of integrated versus standard treatment for 547 first‐episode psychotic patients. 12th Biennial Winter Workshop on Schizophrenia; 2004 Feb 7‐13, Davos, Switzerland. 2004.
- Nordentoft M, Jeppesen P, Petersen L, Thorup A, Ohlenschlaeger J, Christensen T, et al. Transition rates from schizotypal disorder to psychotic disorder for first‐contact patients included in the opus trial. A randomized clinical trial of integrated treatment and standard treatment. European Psychiatry 2007;22:S129. [DOI] [PubMed] [Google Scholar]
- Nordentoft M, Jeppesen P, Ventegodt AT, Joergensen P, Abel M, Petersen L, et al. Opus‐project: a randomised controlled trial of first episode psychotic patients: patient satisfaction, depression and suicidal behaviour. Schizophrenia Research 2001;49(1, 2):265. [Google Scholar]
- Nordentoft M, Jorgensen P, Jeppesen P, Kassow P, Abel MB, Resiby N, et al. Opus‐project: differences in clinical and social outcome of a randomized controlled trial of integrated care of first‐episode psychotic patients. Schizophrenia Research 1999;36(1‐3):330. [Google Scholar]
- Nordentoft M, Reisby N, Jeppesen P, Abel M‐B, Kassow P, Jírgensen P. Opus‐project: differences in treatment outcome of a randomised controlled trial of integrated psychiatric treatment of first‐episode psychotic patients. 11th World Congress of Psychiatry; 1999 Aug 6‐11; Hamburg. 1999.
- Nordentoft M, Thorup A, Petersen L, Jeppesen P, Krarup G, Christensen T, et al. The opus trial: A randomised multi‐centre trial of integrated versus standard treatment for 547 first‐episode psychotic patients. 13th Biennial Winter Workshop on Schizophrenia Research; 2006 Feb 4‐10; Davos, Switzerland. 2006.
- Nordentoft M, Thorup A, Petersen L, Ohlenschlaeger J, Melau M, Christensen TO, et al. Transition rates from schizotypal disorder to psychotic disorder for first‐contact patients included in the OPUS trial. A randomized clinical trial of integrated treatment and standard treatment. Schizophrenia Research 2006;83(1):29‐40. [PUBMED: 16504481] [DOI] [PubMed] [Google Scholar]
- Nordentoft M, Thorup A, Petersen L, Ohlenschlaeger J, Melau M, Christensen TO, et al. Transition rates from schizotypal disorder to psychotic disorder for first‐contact patients included in the opus trial. A randomized clinical trial of integrated treatment and standard treatment. Schizophrenia Research 2006;86(Suppl 1):S44. [DOI] [PubMed] [Google Scholar]
- Ohlenschlaeger J, Nordentoft M, Thorup A, Jeppesen P, Petersen L, Christensen TO, et al. Effect of integrated treatment on the use of coercive measures in first‐episode schizophrenia‐spectrum disorder. A randomized clinical trial. International Journal of Law and Psychiatry 2008;31(1):72‐6. [PUBMED: 18191455] [DOI] [PubMed] [Google Scholar]
- Ohlenschlaeger J, Thorup A, Petersen L, Jeppesen P, Koster A, Munkner R, et al. Intensive treatment models and coercion. Nordic Journal of Psychiatry 2007;61(5):369‐78. [PUBMED: 17990199] [DOI] [PubMed] [Google Scholar]
- Petersen L, Jeppesen P, Thorup A, Abel MB, Ohlenschlaeger J, Christensen TO, et al. A randomised multi‐centre trial of integrated versus standard treatment for patients with a first episode of psychotic illness. BMJ 2005;331(7517):602‐8. [PUBMED: 16141449] [DOI] [PMC free article] [PubMed] [Google Scholar]
- Petersen L, Jeppesen P, Thorup A, Ohlenschlaeger J, Christensen T, Krarup G, et al. Substance abuse in first‐episode schizophrenia‐spectrum disorders. Schizophrenia Research 2006;86(Suppl 1):S44. [Google Scholar]
- Petersen L, Jeppesen P, Thorup A, Ohlenschlaeger J, Krarup G, Østergård T, et al. Substance abuse and first‐episode schizophrenia‐spectrum disorders. The Danish OPUS trial. Early Intervention in Psychiatry 2007;1(1):88‐96. [DOI] [PubMed] [Google Scholar]
- Petersen L, Jeppesen P, Ventegodt AT, Abel M, Nordentoft M, Kassow P, et al. Opus‐project: a randomised controlled trial of first episode psychotic patients: predictors of outcome. Schizophrenia Research 2001;49(1, 2):266. [Google Scholar]
- Petersen L, Nordentoft M, Jeppesen P, Ohlenschaeger J, Thorup A, Christensen TO, et al. Improving 1‐year outcome in first‐episode psychosis: OPUS trial. British Journal of Psychiatry 2005;48(Suppl):s98‐103. [PUBMED: 16055817] [DOI] [PubMed] [Google Scholar]
- Petersen L, Nordentoft M, Thorup A, Oehlenschlaeger J, Jeppesen P, Christensen T, et al. The OPUS trial: a randomised multi‐centre trial of integrated versus standard treatment for 547 first‐episode psychotic patients. Schizophrenia Bulletin 2005;31:531. [Google Scholar]
- Secher RG, Hjorthoj CR, Austin SF, Thorup A, Jeppesen P, Mors O, et al. Ten‐year follow‐up of the OPUS Specialized Early Intervention Trial for Patients With a First Episode of Psychosis. Schizophrenia Bulletin 2015;41(3):617‐26. [DOI] [PMC free article] [PubMed] [Google Scholar]
- Secher RG, Hjorthoj CR, Austin SF, Thorup A, Jeppesen P, Mors O, et al. Ten‐year follow‐up of the OPUS Specialized Early Intervention Trial for Patients With a First Episode of Psychosis. Schizophrenia Bulletin 2015;41:617‐26. [DOI] [PMC free article] [PubMed] [Google Scholar]
- Secher RG, Nordentoft M, Austin S, Mors O. The opus trial: intensive, early, psychosocial intervention versus treatment as usual for people with a first episode within the schizophrenic spectrum. Results from the 10‐year follow‐up. Early Intervention in Psychiatry 2012;6:21. [Google Scholar]
- Secher RG, Nordentoft M, Austin S, Mors O. The opus trial: intensive, early, psychosocial intervention versus treatment as usual for people with a first episode within the schizophrenic spectrum. Results from the 10‐year follow‐up. Early Intervention in Psychiatry 2012;6:21. [Google Scholar]
- Stevens H, Agerbo E, Dean K, Mortensen PB, Nordentoft M. Reduction of crime in first‐onset psychosis: a secondary analysis of the OPUS randomized trial. Journal of Clinical Psychiatry 2013;74(5):e439‐44. [DOI] [PubMed] [Google Scholar]
- Thorup A, Nordentoft M, Petersen L, Oehlensschlaeger J, Abel M, Jeppesen P, et al. The Danish OPUS‐project: psychopathology and gender differences in first episode psychotic patients. Third International Conference on Early Psychosis; 2002 Sep 25‐28; Copenhagen. 2002.
- Thorup A, Petersen L, Jeppesen P, Nordentoft M. The quality of life among first‐episode psychotic patients in the opus trial. Schizophrenia Research 2010;116(1):27‐34. [DOI] [PubMed] [Google Scholar]
- Thorup A, Petersen L, Jeppesen P, Ohlenschlaeger J, Christensen T, Krarup G, et al. Integrated treatment ameliorates negative symptoms in first episode psychosis ‐ results from the Danish OPUS trial. Schizophrenia Research 2005;79(1):95‐105. [DOI] [PubMed] [Google Scholar]
- Thorup A, Petersen L, Jeppesen P, Ohlenschlaeger J, Christensen T, Krarup G, et al. Social network among young adults with first‐episode schizophrenia spectrum disorders: results from the Danish OPUS trial. Social Psychiatry and Psychiatric Epidemiology 2006;41(10):761‐70. [PUBMED: 16900304] [DOI] [PubMed] [Google Scholar]
- Ventegodt AT, Jeppesen P, Petersen L, Abel M, Nordentoft M, Kassow P, et al. Opus‐project: a randomised controlled trial of first episode psychotic patients: gender differences, social network and negative symptoms. Schizophrenia Research 2001;49(1, 2):267. [Google Scholar]
Pique‐California 1999 {published data only}
- Pique T. Cost‐Effectiveness of an African‐American Focus Assertive Community Treatment Programme. Alameda: California School of Professional Psychology, 1999. [Google Scholar]
Quinlivan‐California 1995 {published data only}
- Quinlivan R, Hough R, Crowell A, Beach C, Hofstetter R, Kenworthy K. Service utilization and costs of care for severely mentally ill clients in an Intensive Case Management programme. Psychiatric Services 1995;46:365‐71. [DOI] [PubMed] [Google Scholar]
REACT‐UK 2002 {published and unpublished data}
- Killaspy H. Further information on REACT study for Cochrane Systematic Review [personal communication]. Email to: M Dieterich 8 June 2009.
- Killaspy H, Bebbington P, Blizard R, Johnson S, Nolan F, Pilling S, et al. The REACT study: randomised evaluation of assertive community treatment in north London. BMJ 2006;332(7545):815‐8. [DOI] [PMC free article] [PubMed] [Google Scholar]
- Killaspy H, Kingett S, Bebbington P, Blizard R, Johnson S, Nolan F, et al. Randomised evaluation of assertive community treatment: 3‐year outcomes. British Journal of Psychiatry 2009;195(1):81‐2. [DOI] [PubMed] [Google Scholar]
- Killaspy H, Mas‐Exposito L, Marston L, King M. Ten year outcomes of participants in the REACT (Randomised Evaluation of Assertive Community Treatment in North London) study. BMC Psychiatry 2014;14:296. [PUBMED: 25342641] [DOI] [PMC free article] [PubMed] [Google Scholar]
- King M. Effectiveness of assertive outreach ‐ a randomised controlled trial. National Research Register 2002; Vol. 1.
- McCrone P, Killaspy H, Bebbington P, Johnson S, Nolan F, Pilling S, et al. The REACT study: cost‐effectiveness analysis of assertive community treatment in north London. Psychiatric Services 2009;60(7):908‐13. [DOI] [PubMed] [Google Scholar]
Rosenheck‐USA 1993 {published data only}
- Rosenheck R. Intersite variation in the impact of intensive psychiatric community care on hospital use: a research network to evaluate assertive community treatment. American Journal of Orthopsychiatry 1998;68(2):191‐200. [DOI] [PubMed] [Google Scholar]
- Rosenheck R, Neale M, Gallup P. Community‐oriented mental health care: assessing diversity in clinical practice. Psychosocial Rehabilitation Journal 1993;16:39‐50. [Google Scholar]
- Rosenheck R, Neale M, Leaf P, Milstein R, Frisman L. Multisite experimental cost study of intensive psychiatric community care. Schizophrenia Bulletin 1995;21:129‐40. [DOI] [PubMed] [Google Scholar]
- Rosenheck RA, Neale MS. Cost‐effectiveness of intensive psychiatric community care for high users of in‐patient services. Archives of General Psychiatry 1998;55(5):459‐66. [DOI] [PubMed] [Google Scholar]
Rosenheck‐USA‐GMS {published data only}
- See above Rosenheck‐USA.
Rosenheck‐USA‐GMS (A) {published data only}
- See above Rosenheck‐USA.
Rosenheck‐USA‐GMS (B) {published data only}
- See above Rosenheck‐USA.
Rosenheck‐USA‐GMS (D) {published data only}
- See above Rosenheck‐USA.
Rosenheck‐USA‐GMS (F) {published data only}
- See above Rosenheck‐USA.
Rosenheck‐USA‐GMS (I) {published data only}
- See above Rosenheck‐USA.
Rosenheck‐USA‐NP {published data only}
- See above Rosenheck‐USA.
Rosenheck‐USA‐NP (C) {published data only}
- See above Rosenheck‐USA.
Rosenheck‐USA‐NP (E) {published data only}
- See above Rosenheck‐USA.
Rosenheck‐USA‐NP (G) {published data only}
- See above Rosenheck‐USA.
Rosenheck‐USA‐NP (H) {published data only}
- See above Rosenheck‐USA.
Salkever‐SCarolina 1999 {published data only}
- Salkever D, Domino ME, Burns BJ, Santos AB, Deci PA, Dias J, et al. Assertive community treatment for people with severe mental illness: the effect on hospital use and costs. Health Services Research 1999;34(2):577‐601. [PUBMED: 10357291] [PMC free article] [PubMed] [Google Scholar]
Shern‐USA1 2000 {published data only}
- Shern DL, Tsemberis S, Anthony W, Lovell AM, Richmond L, Felton CJ, et al. Serving street‐dwelling individuals with psychiatric disabilities: Outcomes of a psychiatric rehabilitation clinical trial. American Journal of Public Health 2000;90(12):1873‐8. [PUBMED: 11111259] [DOI] [PMC free article] [PubMed] [Google Scholar]
- Tsemberis SJ, Moran L, Shinn M, Asmussen SM, Shern DL. Consumer preference programmes for individuals who are homeless and have psychiatric disabilities: a drop‐in center and a supported housing programme. American Journal of Community Psychology 2003;32(3‐4):305‐17. [PUBMED: 14703266] [DOI] [PubMed] [Google Scholar]
Solomon‐Pennsylvania 1994 {published data only}
- Draine JN. Case Management for Homeless Mentally Ill Adult Offenders: a Re‐Examination of Random Field Trial Data. Philadelphia: University of Pennsylvania, 1995. [Google Scholar]
- Solomon P, Draine J. Issues in serving the forensic client. Social Work 1995;40(1):25‐33. [PubMed] [Google Scholar]
- Solomon P, Draine J. Jail recidivism in a forensic case management programme. Health and Social Work 1995;20(3):167‐73. [DOI] [PubMed] [Google Scholar]
- Solomon P, Draine J. One‐year outcomes of a randomized trial of case management with seriously mentally ill clients leaving jail. Evaluation Review 1995;19(3):256‐73. [Google Scholar]
- Solomon P, Draine J, Meyerson A. Jail recidivism and receipt of community mental health services. Hospital and Community Psychiatry 1994;45(8):793‐7. [PUBMED: 7982695] [DOI] [PubMed] [Google Scholar]
Sytema‐Netherlands 1999 {published data only}
- Burns T. The UK700 study: impact of case load size in case management. Current Opinion in Psychiatry 1999;12:302. [Google Scholar]
- Byford S, Fiander M, Torgerson DJ, Burns T, Horn E, Gilvarry C, et al. Cost‐effectiveness of intensive v. standard case management for severe psychotic illness ‐ UK700 case management trial. British Journal of Psychiatry 2000;176:537‐43. [DOI] [PubMed] [Google Scholar]
- ISRCTN11281756. Effectiveness of assertive community treatment versus care‐as‐usual for patients with severe and persistent psychiatric disorders. www.isrctn.com/ISRCTN11281756 (first received 20 December 2005).
- Samele C, Gilvarry C, Walsh E, Manley C, Os J, Murray R. Patients' perceptions of intensive case management. Psychiatric Services 2002;53(11):1432‐7. [DOI] [PubMed] [Google Scholar]
- Samele C, Walsh E, Gilvarry C, Manley C, Tattan T, Fahy T, et al. Non‐alcohol substance misuse, outcome and intensive case management. European Psychiatry 2002;17(Suppl 1):216s. [Google Scholar]
- Sytema S, Wunderink L, Bloemers W, Roorda L, Wiersma D. Assertive community treatment in the Netherlands: a randomized controlled trial. Acta Psychiatrica Scandinavica 2007;116(2):105‐12. [PUBMED: 17650271] [DOI] [PubMed] [Google Scholar]
Test‐Wisconsin 1985 {published data only}
- Angell B, Test MA. The relationship of clinical factors and environmental opportunities to social functioning in young adults with schizophrenia. Schizophrenia Bulletin 2002;28(2):259‐71. [DOI] [PubMed] [Google Scholar]
- Cohen LJ, Test MA, Brown RL. Suicide and schizophrenia: data from a prospective community treatment study. American Journal of Psychiatry 1990;147:602‐7. [PUBMED: 2327487] [DOI] [PubMed] [Google Scholar]
- Test MA, Knoedler W, Allness D, Burke S, Brown R, Wallisch L. Community care of schizophrenia: two year findings. 142nd Annual Meeting of the American Psychiatric Association; 1989 May 6‐11; San Francisco. 1989.
- Test MA, Knoedler WH, Allness DJ, Burke SS. Characteristics of young adults with schizophrenic disorders treated in the community. Hospital and Community Psychiatry 1985;36(8):853‐8. [PUBMED: 4029910] [DOI] [PubMed] [Google Scholar]
- Test MA, Knoedler WH, Allness DJ, Burke SS, Brown RL, Wallisch LS. Long‐term community care through an assertive continuous treatment team. Advances in Neuropsychiatry and Psychopharmacology 1991;1:239‐46. [Google Scholar]
UK700‐UK (A) {published data only}
- See above UK700‐UK.
UK700‐UK (B) {published data only}
- See below UK700‐UK.
UK700‐UK (C) {published data only}
- See below UK700‐UK.
UK700‐UK (D) {published data only}
- See below UK700‐UK.
UK700‐UK 1999 {published data only}
- Austwick C. The design and analysis of randomised trials in health services research, with particular reference to the UK case management trial of psychotic patients. National Research Register 2003.
- Burns T. Erratum: Intensive versus standard case management for severe psychotic illness: a randomised trial. Lancet 1999;354(9184):1128. [DOI] [PubMed] [Google Scholar]
- Burns T. Predictors of outcome at 4 years of psychotic patients treated in two forms of case management. National Research Register 2000.
- Burns T. Random controlled trial of Intensive Case Management for people with severe mental illness. National Research Register 2001; Vol. 1.
- Burns T, Creed F, Fahy T, Thompson S, Tyrer P, White I. Intensive versus standard case management for severe psychotic illness: a randomised trial. UK 700 Group. Lancet 1999;353(9171):2185‐9. [PUBMED: 10392982] [DOI] [PubMed] [Google Scholar]
- Burns T, Fiander M, Kent A, Ukoumunne OC, Byford S, Fahy T, et al. Effects of caseload size on the process of care of patients with severe psychotic illness. Report from the UK700 trial. British Journal of Psychiatry 2000; Vol. 177:427‐33. [PUBMED: 11059996] [DOI] [PubMed]
- Burns T, White I, Byford S, Fiander M, Creed F, Fahy T. Exposure to case management: relationships to patient characteristics and outcome. Report from the UK700 trial. British Journal of Psychiatry 2002;181:236‐41. [PUBMED: 12204929] [DOI] [PubMed] [Google Scholar]
- Byford S, Barber JA, Fiander M, Marshall S, Green J. Factors that influence the cost of caring for patients with severe psychotic illness: report from the UK 700 trial. British Journal of Psychiatry 2001;178:441‐7. [MEDLINE: ] [DOI] [PubMed] [Google Scholar]
- Creed F. Comparison of intensive and standard case management programmes for psychotic patients. www.isrctn.com/ISRCTN15904286 (first received 23 January 2004).
- Creed F, Burns T, Butler T, Byford S, Murray R, Thompson S, et al. Comparison of intensive and standard case management for patients with psychosis: rationale of the trial. British Journal of Psychiatry 1999;174:74‐8. [PUBMED: 10211155] [DOI] [PubMed] [Google Scholar]
- Creed F, Butler T, Fraser J, Gater R, Huxley P, Tarrier N, et al. Comparison of intensive and standard case management programmes for psychotic patients (UK 700 study). Data on file 1999.
- Fahy TA, Burns T, Creed F, Tyrer P, White I. The outcome of intensive versus standard case management for severe psychotic illness: the UK 700‐case management trial conference abstract. Schizophrenia Research 1999;36(1‐3):324‐5. [Google Scholar]
- Fiander M, Burns T, Ukoumunne OC, Fahy T, Creed F, Tyrer P, et al. Do care patterns change over time in a newly established mental health service? A report from the UK700 trial. European Psychiatry 2006;21(5):300‐6. [PUBMED: 16824736] [DOI] [PubMed] [Google Scholar]
- Harvey K. The effect of Intensive Case Management on relatives' appraisal of caregiving and psychological distress. National Research Register 2001; Vol. 1.
- Harvey K, Burns T, Fiander M, Huxley P, Manley C, Fahy T. The effect of Intensive Case Management on the relatives of patients with severe mental illness. Psychiatric Services 2002;53(12):1580‐5. [PUBMED: 12461219] [DOI] [PubMed] [Google Scholar]
- Hassiotis A, Ukoumunne O, Tyrer P, Piachaud J, Gilvarry C, Harvey K, et al. Prevalence and characteristics of patients with severe mental illness and borderline intellectual functioning: report from the UK700 randomised controlled trial of case management. British Journal of Psychiatry 1999;175:135‐40. [PUBMED: 10627795] [DOI] [PubMed] [Google Scholar]
- Hassiotis A, Ukoumunne OC, Byford S, Tyrer P, Harvey K, Piachaud J, et al. Intellectual functioning and outcome of patients with severe psychotic illness randomised to Intensive Case Management: report from the UK700 trial. British Journal of Psychiatry 2001;178:166‐71. [PUBMED: 11157431] [DOI] [PubMed] [Google Scholar]
- Huxley P, Evans S, Burns T, Fahy T, Green J. Quality of life outcome in a randomized controlled trial of case management. Social Psychiatry and Psychiatric Epidemiology 2001;36(5):249‐55. [PUBMED: 11515703] [DOI] [PubMed] [Google Scholar]
- Jabben N, Os J, Burns T, Creed F, Tattan T, Green J, et al. Is processing speed predictive of functional outcome in psychosis?. Social Psychiatry and Psychiatric Epidemiology 2008;6:437‐44. [DOI: 10.1007/s00127-008-0328-y] [DOI] [PubMed] [Google Scholar]
- McKenzie K, Samele C, Horn E, Tattan T, Os J, Murray R. Comparison of the outcome and treatment of psychosis in people of Caribbean origin living in the UK and British Whites. Report from the UK700 trial. British Journal of Psychiatry 2001;178:160‐5. [PUBMED: 11157430] [DOI] [PubMed] [Google Scholar]
- Moran P, Walsh E, Tyrer P, Burns T, Creed F, Fahy T, et al. Impact of comorbid personality disorder on violence in psychosis. British Journal of Psychiatry 2003;182:129‐34. [DOI] [PubMed] [Google Scholar]
- Theresa T. The effect of Intensive Case Management on compliance with medication and psychiatric services. National Research Register 2000.
- Tyrer P, Hassiotis A, Ukoumunne O, Piachaud J, Harvey K. Intensive case management for psychotic patients with borderline intelligence. Lancet 1999;354(9183):999‐1000. [MEDLINE: ] [DOI] [PubMed] [Google Scholar]
- Tyrer P, Manley C, Horn E, Leddy D, Ukoumunne OC. Personality abnormality in severe mental illness and its influence on outcome of intensive and standard case management: a randomised controlled trial. European Psychiatry 2000;15(Suppl 1):7‐10. [PUBMED: 11520467] [DOI] [PubMed] [Google Scholar]
- UK700 Group. Cost‐effectiveness of intensive v. standard case management for severe psychotic illness: UK700 case management trial. British Journal of Psychiatry 2000;176:537‐43. [PUBMED: 10974959] [DOI] [PubMed] [Google Scholar]
- Walsh E, Gilvarry C, Samele C, Harvey K, Manley C, Tyrer P, et al. Reducing violence in severe mental illness: randomised controlled trial of Intensive Case Management compared with standard care. BMJ 2001;323(7321):1093‐6. [PUBMED: 11701572] [DOI] [PMC free article] [PubMed] [Google Scholar]
- Walsh E, Harvey K, White I, Higgitt A, Fraser J, Murray R. Suicidal behaviour in psychosis: prevalence and predictors from a randomised controlled trial of case management: report from the UK700 trial. British Journal of Psychiatry 2001;178:255‐60. [PUBMED: 11230037] [DOI] [PubMed] [Google Scholar]
- Walsh E, Harvey K, White I, Manley C, Fraser J, Stanbridge S, et al. Prevalence and predictors of parasuicide in chronic psychosis. UK700 group. Acta Psychiatrica Scandinavica 1999;100(5):375‐82. [PUBMED: 10563455] [DOI] [PubMed] [Google Scholar]
- Walsh E, Leese M, Byford S, Gilvarry C, Samele C, Tyrer P, et al. Do violent patients benefit from Intensive Case Management?. Schizophrenia Research 2002;53(3 Suppl 1):234. [Google Scholar]
- Walsh E, Leese M, Byford S, Gilvarry K, Samele C, Tatten T, et al. The impact of Intensive Case Management on violent patients with psychosis. European Psychiatry 2002;17(Suppl 1):S142. [Google Scholar]
- Walsh E, Moran P, Scott C, Burns T, Tyrer P, Creed F. Reducing violent victimization in severe mental illness. Schizophrenia Research 2004;67(1):11. [Google Scholar]
- Walsh EM. Community risk in psychosis: predictors and management. 158th Annual Meeting of the American Psychiatric Association; 2005 May 21‐26; Atlanta (GA). 2005.
- Walsh EM, Gilvarry CM, Samele C, Creed F, Tyrer P, Fahy TJ, et al. Reducing violence in psychosis: the effect of Intensive Case Management. 154th Annual Meeting of the American Psychiatric Association; 2001 May 5‐10; New Orleans. 2001.
- Walsh EM, Gilvarry CM, Samele C, Creed F, Tyrer P, Fahy TJ, et al. Reducing violence in psychosis: the effect of Intensive Case Management. 155th Annual Meeting of the American Psychiatric Association; 2002 May 18‐23; Philadelphia. 2002.
References to studies excluded from this review
Agius‐Croatia 2007 {published data only}
- Agius M, Shah S, Ramkisson R, Murphy S, Zaman R. Three year outcomes of an early intervention for psychosis service as compared with treatment as usual for first psychotic episodes in a standard community mental health team ‐ final results. Psychiatria Danubina 2007;19(3):130‐8. [PUBMED: 17914313] [PubMed] [Google Scholar]
- Agius M, Shah S, Ramkisson R, Murphy S, Zaman R. Three year outcomes of an early intervention for psychosis service as compared with treatment as usual for first psychotic episodes in a standard community mental health team. Preliminary results [see comment]. Psychiatria Danubina 2007;19(1‐2):10‐9. [PUBMED: 17603411] [PubMed] [Google Scholar]
An 2013 {published data only}
- An XD, Li SC 安晓东, 李守春. Effects of different interventions on quality of life and rehabilitation outcomes in patients with chronic schizophrenia [不同干预方式对慢性精神分裂症患者生活质量和康复影响的研究]. Journal of Psychiatry [精神医学杂志] 2013, issue 01:25‐7.
An Qi 2013 {published data only}
- An Q, Wang HG, Meng XJ 安琦, 王宏刚, 孟祥军. The effects of family intervention on the rehabilitation of patients with newly diagnosed schizophrenia [家庭干预对首诊精神分裂症患者康复的影响]. Heilongjiang Medicine and Pharmacy [黑龙江医药科学] 2013, issue 03:59‐60.
Bao 2012 {published data only}
- Bao LP, Shen X, Zhang SF, Cui XQ, Cheng WL 鲍丽萍, 沈曦, 张世芳, 崔晓青, 程万良. Comparative study of the effects of family intervention for patients with schizophrenia [精神分裂症家庭干预效果的对照研究]. Sichuan Mental Health [四川精神卫生] 2012, issue 01:50‐1.
Bao‐China 2005 {published data only}
- Bao WQ, Sun XJ, Wang ML. Research on home intervention to community schizophreniform by applying PDCA. Journal of Practical Nursing 2005;21(3A):9‐11. [Google Scholar]
Barbic 2009 {published data only}
- Barbic S, Krupa T, Armstrong I. A randomized controlled trial of the effectiveness of a modified recovery workbook program: preliminary findings. Psychiatric Services 2009;60(4):491‐7. [DOI] [PubMed] [Google Scholar]
Barekatain‐Iran 2014 {published data only}
- Barekatain M, Maracy MR, Rajabi F, Baratian H. Aftercare services for patients with severe mental disorder: a randomized controlled trial. Journal of Research in Medical Sciences 2014;19:240‐5. [PMC free article] [PubMed] [Google Scholar]
Bigelow‐Oregon 1991 {published data only}
- Bigelow DA, Young DJ. Effectiveness of a case management programme. Community Mental Health Journal 1991;27:115‐23. [DOI] [PubMed] [Google Scholar]
Bond‐Chicago2 1989 {published data only}
- Bond GR, Witheridge TF, Wasmer D, Dincin J, McRae SA, Mayes J, et al. A comparison of two crisis housing alternatives to psychiatric hospitalization. Hospital and Community Psychiatry 1989;40(2):177‐83. [PUBMED: 2914671] [DOI] [PubMed] [Google Scholar]
Bond‐Indiana2 1991 {published data only}
- Bond GR, McDonel EC, Miller LD, Pensec M. Assertive community treatment and reference groups ‐ an evaluation of their effectiveness for young adults with serious mental illness and substance abuse problems. Special Issue ‐ Serving persons with dual disorders of mental illness and substance use. Psychosocial Rehabilitation Journal 1991;15(2):31‐43. [Google Scholar]
Borland‐Washington 1989 {published data only}
- Borland A, McRae J, Lycan C. Outcomes of five years of continuous Intensive Case Management. Hospital and Community Psychiatry 1989;40:369‐76. [DOI] [PubMed] [Google Scholar]
Borras 2009 {published data only}
- Borras L, Boucherie M, Mohr S, Lecomte T, Perroud N, Huguelet P. Increasing self‐esteem: efficacy of a group intervention for individuals with severe mental disorders. European Psychiatry 2009;24(5):307‐16. [MEDLINE: ] [DOI] [PubMed] [Google Scholar]
Botha 2014 {published data only}
- Botha UA, Koen L, Galal U, Jordaan E, Niehaus DJ. The rise of assertive community interventions in South Africa: a randomized control trial assessing the impact of a modified assertive intervention on readmission rates; a three year follow‐up. BMC Psychiatry 2014;14:56. [DOI] [PMC free article] [PubMed] [Google Scholar]
- Botha UA, Koen L, Joska JA, Hering LM, Oosthuizen PP. Assessing the efficacy of a modified assertive community‐based treatment programme in a developing country. BMC Psychiatry 2010;10:73. [MEDLINE: ] [DOI] [PMC free article] [PubMed] [Google Scholar]
Burns 2013 {published data only}
- Burns T, Rugkasa J, Molodynski A, Dawson K, Yeeles K, Vazquez‐Montes M, et al. Community treatment orders for patients with psychosis (OCTET): a randomised controlled trial. Lancet 2013;381:1627‐33. [DOI] [PubMed] [Google Scholar]
Burns‐UK 1993 {published data only}
- Burns T, Beadsmoore A, Bhat AV, Oliver A, Mathers C. A controlled trial of home‐based acute psychiatric services. I: Clinical and social outcome. British Journal of Psychiatry 1993;163:49‐54. [PUBMED: 8353699] [DOI] [PubMed] [Google Scholar]
- Burns T, Raftery J. Cost of schizophrenia in a randomized trial of home based treatment. Schizophrenia Bulletin 1991;17(3):407‐10. [PUBMED: 1947865] [DOI] [PubMed] [Google Scholar]
- Burns T, Raftery J, Beadsmoore A, McGuigan S, Dickson M. A controlled trial of home‐based acute psychiatric services. II: Treatment patterns and costs. British Journal of Psychiatry 1993;163:55‐61. [PUBMED: 8353700] [DOI] [PubMed] [Google Scholar]
Champney‐Ohio 1992 {published data only}
- Champney TF, Dzurec LC. Involvement in productive activities and satisfaction with living situation among severely mentally disabled adults. Hospital and Community Psychiatry 1992;43:899‐903. [DOI] [PubMed] [Google Scholar]
Chandler 1999 {published data only}
- Chandler D, Spicer G, Wagner M, Hargreaves W. Cost‐effectiveness of a capitated assertive community treatment program. Psychiatric Rehabilitation Journal 1999;22:327‐36. [Google Scholar]
Chandler 2000 {published data only}
- Chandler D, Quinlivan R. Social skills training modules in an intensive community support program. Administration and Policy in Mental Health 2000;27(4):211‐20. [DOI] [PubMed] [Google Scholar]
Chandler‐California2 2006 {published data only}
- Chandler DW, Spicer G. Integrated treatment for jail recidivists with co‐occurring psychiatric and substance use disorders. Community Mental Health Journal 2006;42(4):405‐25. [PUBMED: 16933087] [DOI] [PubMed] [Google Scholar]
Chang 2013 {published data only}
- Chang WC, Chan GH, Jim OT, Lau ES, Hui CL, Chan SK, et al. Optimal duration of an early intervention programme for first‐episode psychosis: randomised controlled trial. British Journal of Psychiatry 2015;206(6):492‐500. [DOI] [PubMed] [Google Scholar]
- Chang WC, Chan HK, Jim TT, Wong HY, Hui LM, Chan KW, et al. Randomized controlled trial evaluating 1‐year extended case management for first‐episode psychosis patients discharged from EASY program in Hong Kong. 14th International Congress on Schizophrenia Research (ICOSR); 2013 April 21‐25; Orlando (FL). 2013:324‐5.
- Chen EYH, Chang WC, Chan SKW, Lam MML, Hung SF, Chung DWS, et al. Community case management for early psychosis: is two years an optimal duration? A randomized controlled study. Hong Kong Medical Journal 2015;21:23‐6. [PubMed] [Google Scholar]
Chatterjee 2014 {published data only}
- Chatterjee S, Naik S, John S, Dabholkar H, Balaji M, Koschorke M, et al. Effectiveness of a community‐based intervention for people with schizophrenia and their caregivers in India (COPSI): a randomised controlled trial. Lancet 2014;383:1385‐94. [DOI] [PMC free article] [PubMed] [Google Scholar]
Chen‐China 2007 {published data only}
- Chen LS, Li ZG, Chen YF, Xiao CL, Huang JJ, Bao GL, et al. Comparative study of relapse prevention in schizophrenia by network. Linchuang Jingshen Yixue Zazhi 2007;17(4):234‐6. [Google Scholar]
Chen XZ 2012 {published data only}
- Chen XZ, Huang XF, Deng XM, Hong HZ 陈秀珍, 黄秀芳, 邓晓明, 洪华珍. The effect of home care intervention on long‐term prognosis of patients with schizophrenia [居家护理干预对精神分裂症患者长期预后的影响]. Sichuan Mental Health [四川精神卫生] 2012, issue 02:112‐4.
COAST‐UK 2004 {published data only}
- Kuipers E, Holloway F, Rabe‐Hesketh S, Tennakoon L. An RCT of early intervention in psychosis: Croydon Outreach and Assertive Support Team (COAST). Social Psychiatry and Psychiatric Epidemiology 2004;39(5):358‐63. [PUBMED: 15133591] [DOI] [PubMed] [Google Scholar]
COMO‐UK 2003 {published data only}
- Hughes E, Wanigaratne S, Gournay K, Johnson S, Thornicroft G, Finch E, et al. Training in dual diagnosis interventions (the COMO Study): randomised controlled trial. BMC Psychiatry 2008;8:12. [PUBMED: 18304310] [DOI] [PMC free article] [PubMed] [Google Scholar]
- Johnson S, Thornicroft G, Afuwape S, Leese M, White IR, Hughes E, et al. Effects of training community staff in interventions for substance misuse in dual diagnosis patients with psychosis (COMO study): cluster randomised trial. British Journal of Psychiatry 2007;191:451‐2. [PUBMED: 17978327] [DOI] [PubMed] [Google Scholar]
- Miles H, Johnson S, Amponsah‐Afuwape S, Finch E, Leese M, Thornicroft G. Characteristics of sub‐groups of individuals with psychotic illness and a comorbid substance use disorder. Psychiatric Services 2003;54(4):554‐61. [PUBMED: 12663845] [DOI] [PubMed] [Google Scholar]
- Thornicroft G. Prevention of admission to psychiatric hospital. A randomised controlled trial of service use, health and social care outcomes of a community mental health team intervention specific to dual diagnosis (psychosis and substance misuse) patients. www.isrctn.com/ISRCTN98891022 (first received 14 March 2007).
Cook 2013 {published data only}
- Cook JA, Jonikas JA, Hamilton MM, Goldrick V, Steigman PJ, Grey DD, et al. Impact of Wellness Recovery Action Planning on service utilization and need in a randomized controlled trial. Psychiatric Rehabilitation Journal 2013;36:250‐7. [DOI] [PubMed] [Google Scholar]
CORE 2014 {published data only}
- University of Melbourne. The CORE Study: a stepped wedge cluster randomised controlled trial to test a co‐design technique to optimise psychosocial recovery outcomes for people affected by mental illness in the community mental health setting. www.apps.who.int/trialsearch/Trial2.aspx?TrialID=ACTRN12614000457640 (first received 1 May 2014). [DOI] [PMC free article] [PubMed]
Cosden‐California 2005 {published data only}
- Cosden M, Ellens J, Schnell J, Yamini‐Diouf Y. Efficacy of a mental health treatment court with assertive community treatment. Behavioral Sciences and the Law 2005;23(2):199‐214. [PUBMED: 15818609] [DOI] [PubMed] [Google Scholar]
CRIMSON‐UK 2008 {published data only}
- Thornicroft G. CRIMSON study: randomised controlled trial (RCT) of joint crisis plans to reduce compulsory treatment of people with psychosis. www.isrctn.com/ISRCTN11501328 (first received 13 March 2008).
Cui 2012 {published data only}
- Cui H, Shao H, He XJ, Ding HQ 崔虹, 邵华, 何夏君, 丁寒琴. The effect of case management on social function in patients with schizophrenia in community [个案管理在改善社区精神分裂症患者社会功能中的作用]. Modern Clinical Nursing [现代临床护理] 2012, issue 11:38‐40.
Dean‐UK1 1990 {published data only}
- Dean C, Gadd EM. Home treatment for acute psychiatric illness. BMJ 1990;301:1021‐3. [DOI] [PMC free article] [PubMed] [Google Scholar]
Dean‐UK2 1993 {published data only}
- Dean C, Phillips J, Gadd EM, Joseph M, England S. Comparison of community based services with hospital based service for people with acute, severe psychiatric illness. BMJ 1993;307:473‐6. [DOI] [PMC free article] [PubMed] [Google Scholar]
De Cangas‐Canada 1994 {published data only}
- Cangas JPC. Assertive case management: a comprehensive evaluation of a hospital based case management programme [Le "case management" affirmatif: une évaluation complète d'un programme du genre en milieu hospitalier]. Santé Mentale au Québec 1994;19(1):75‐91. [PubMed] [Google Scholar]
- Cangas JPC. Psychiatric nursing assertive case management: a comprehensive evaluation of the effectiveness and outcomes of hospital based treatment versus a nurse directed assertive case management programme. International Journal of Psychiatric Nursing Research 1995;1(3):72‐81. [Google Scholar]
Dekker‐Netherlands 2002 {published data only}
- Dekker J, Wijdenes W, Koning YA, Gardien R, Hermandes‐Willenborg L, Nusselder H. Assertive community treatment in Amsterdam. Community Mental Health Journal 2002;38(5):425‐34. [PUBMED: 12236412] [DOI] [PubMed] [Google Scholar]
Deng‐China 2006 {published data only}
- Deng QY, Huang ZL, Xie ZY. Research the effect of early intervention of first episode schizophrenia. Medical Journal of Chinese Civil Administration 2006;18(9):794‐6. [Google Scholar]
Dharwadkar‐Victoria 1994 {published data only}
- Dharwadkar N. Effectiveness of an assertive outreach community treatment programme. Australian and New Zealand Journal of Psychiatry 1994;28:244‐9. [DOI] [PubMed] [Google Scholar]
Dinitz 1965 {published data only}
- Dinitz S, Scarpitti FR, Albini JL, Lefton M, Pasamanick B. An experimental study in the prevention of hospitalization of schizophrenics; thirty months of experience. American Journal of Orthopsychiatry 1965;35:1‐9. [DOI] [PubMed] [Google Scholar]
Er 2013 {published data only}
- E ED 额尔敦. The role of regular family visit to prevent recurrence of patients with chronic schizophrenia [定期家访对慢性精神分裂症预防复发的作用]. Inner Mongol Journal of Traditional Chinese Medicine [内蒙古中医药] 2013, issue 07:42‐4.
Fenton‐Canada 1978 {published data only}
- Fenton FR, Tessier L, Contandriopoulos AP, Nguyen H, Struening EL. A comparative trial of home and hospital psychiatric treatment: financial costs. Canadian Journal of Psychiatry 1982;27(3):177‐87. [PUBMED: 6807524] [DOI] [PubMed] [Google Scholar]
- Fenton FR, Tessier L, Struening EL. A comparative trial of home and hospital psychiatric care. One‐year follow‐up. Archives of General Psychiatry 1979;36(10):1073‐9. [PUBMED: 475542] [DOI] [PubMed] [Google Scholar]
- Fenton FR, Tessier L, Struening EL, Smith FA, Benoit C, Contandriopoulos A, et al. A two‐year follow‐up of a comparative trial of the cost‐effectiveness of home and hospital psychiatric treatment. Canadian Journal of Psychiatry 1984;29(3):205‐11. [DOI] [PubMed] [Google Scholar]
- Smith FA, Fenton FR, Benoit C, Barzell E, Tessier L. Home care treatment of acutely ill psychiatric patients. A one year follow up. Canadian Psychiatric Association Journal 1978;23(2):73‐6. [PUBMED: 647604] [DOI] [PubMed] [Google Scholar]
Franklin‐Texas 1987 {published data only}
- Dozier M, Lee SW, Keir SS, Toprac M, Mason M. A case management programme in Texas revisited. Psychosocial Rehabilitation Journal 1993;17(2):183‐9. [Google Scholar]
- Franklin JL, Solovitz B, Mason M, Clemons JR, Miller GE. An evaluation of case management. American Journal of Public Health 1987;77(6):674‐8. [PUBMED: 3578614] [DOI] [PMC free article] [PubMed] [Google Scholar]
Gao 2013 {published data only}
- Gao HR, Liang JM, Wang Y, Bai CM, Guo XW, Su ZZ 高红锐, 梁金梅, 王艳, 白翠梅, 郭雄伟, 苏焯焯. The effect of Family‐Community‐Hospital integrated management for patients with schizophrenia [家庭‐社区‐医院一体化管理对精神分裂症治疗效果的影响]. Medical Journal of Chinese People's Health [中国民康医学] 2013, issue 12:15‐16+87.
Gaughran 2013 {published data only}
- Gaughran F, Stahl D, Ismail K, Atakan Z, Lally Gardner‐Sood JP, Patel A, et al. Improving physical health and reducing substance use in psychosis ‐ randomised control trial (IMPACT RCT): study protocol for a cluster randomised controlled trial. BMC Psychiatry 2013;13:263. [DOI] [PMC free article] [PubMed] [Google Scholar]
Glick‐New York 1986 {published data only}
- Glick ID, Fleming L, DeChillo N, Meyerkopf N, Jackson C, Muscara D, et al. A controlled study of transitional day care for non‐chronically ill patients. American Journal of Psychiatry 1986;143:1551‐6. [DOI] [PubMed] [Google Scholar]
Godley‐Illinois 1994 {published data only}
- Godley SH. The Illinois MI/SA Project: A treatment system united for persons with mental illness and substance abuse. Bloomington (IL): Chestnut Health Systems, Inc., 1995. [Google Scholar]
- Harrington‐Godley S, Hoewing‐Roberson R, Godley MD. Final MISA report. Technical report submitted to the Illinois Department of Mental Health and Developmental Disabilities and the Illinois Department of Alcoholism and Substance Abuse. Bloomington (IL): Chestnut Health Systems, Inc. 1994.
Goering‐Canada 1988 {published data only}
- Goering PN, Wasylenki DA, Farkas M, Lancee WJ, Ballantyne R. What difference does case management make?. Hospital and Community Psychiatry 1988;39:272‐6. [DOI] [PubMed] [Google Scholar]
Gold‐SCarolina 2006 {published data only}
- Gold PB, Meisler N, Santos AB, Carnemolla MA, Williams OH, Keleher J. Randomized trial of supported employment integrated with assertive community treatment for rural adults with severe mental illness. Schizophrenia Bulletin 2006;32(2):378‐95. [PUBMED: 16177278] [DOI] [PMC free article] [PubMed] [Google Scholar]
Gong 2014 {published data only}
- Gong W, Xu D, Zhou L, Shelton Brown H 3rd, Smith KL, Xiao S. Village doctor‐assisted case management for patients with schizophrenia in rural communities: a randomized control study. Implementation Science 2014;9:13. [DOI] [PMC free article] [PubMed] [Google Scholar]
Grawe‐Norway 2005 {published data only}
- Gotestam KG. Continued early intervention for recent‐onset schizophrenia. A randomized controlled study. clinicaltrials.gov/ct2/show/NCT00184509 (first received 15 September 2005).
- Grawe RW, Falloon IRH, Widen JH, Skogvoll E. Two years of continued early treatment for recent‐onset schizophrenia: a randomised controlled study. Acta Psychiatrica Scandinavica 2006;114(5):328‐36. [PUBMED: 17022792] [DOI] [PubMed] [Google Scholar]
- Morken G, Grawe RW, Widen JH. A randomized controlled trial in recent‐onset schizophrenia. Effects on compliance of two years of continued intervention. European Neuropsychopharmacology 2005;15(Suppl 3):S521. [Google Scholar]
- Morken G, Grawe RW, Widen JH. Effects of integrated treatment on antipsychotic medication adherence in a randomized trial in recent‐onset schizophrenia. Journal of Clinical Psychiatry 2007;68(4):566‐71. [PUBMED: 17474812] [DOI] [PubMed] [Google Scholar]
Gu‐China 2010 {published data only}
- Gu XH 顾秀华. Effects of program training on the social function in community patients with schizophrenia [程式训练对社区慢性精神分裂症患者社会功能的影响]. Nursing Practice and Research [护理实践与研究] 2010;7(1):10‐2. [Google Scholar]
Han SH 2012 {published data only}
- Han SH 韩树华. The effects of family intervention on the rehabilitation of patients with schizophrenia [家庭护理干预对精神分裂症患者康复影响的研究]. Medical Journal of Chinese People's Health [中国民康医学] 2012, issue 07:867‐71.
Hargreaves‐California {published and unpublished data}
- Hargreaves WA. Further information on your study [personal communication]. Email to: M Dieterich 26 May 2009.
- Hargreaves WA, Ja DY, Gee M. Assertive community treatment can be cost‐effective for schizophrenia. 39th Annual Meeting of the American College of Neuropsychopharmacology; 2000 Dec 10‐14; San Juan, Puerto Rico. 2000.
Havassy‐California 2000 {published data only}
- Havassy BE, Shopshire MS. Implications of substance dependence for severe and persistent mental illness. NIDA Research Monograph 2000;180:119. [Google Scholar]
- Havassy BE, Shopshire MS, Quigley LA. Effects of substance dependence on outcomes of patients in a randomized trial of two case management models. Psychiatric Services 2000;51(5):639‐44. [PUBMED: 10783183] [DOI] [PubMed] [Google Scholar]
He‐China 2004 {published data only}
- He JY, Jiang YH, Liang CS. Effects of synthetical intervention on prognosis in rural schizophrenia. Chinese Journal of Psychiatry 2004;37(2):96‐8. [Google Scholar]
Hornstra‐Kansas 1993 {published data only}
- Hornstra RK, Bruce‐Wolfe V, Sagduyu K, Riffle DW. The effect of Intensive Case Management on hospitalization of patients with schizophrenia. Hospital and Community Psychiatry 1993;44:844‐7. [DOI] [PubMed] [Google Scholar]
Hoult‐Australia 1981 {published data only}
- Hoult J. Community care of the acutely mentally ill. British Journal of Psychiatry 1986;149:137‐44. [PUBMED: 3779274] [DOI] [PubMed] [Google Scholar]
- Hoult J, Reynolds I. Schizophrenia. A comparative trial of community orientated and hospital orientated psychiatric care. Acta Psychiatrica Scandinavica 1984;69(5):359‐72. [PUBMED: 6730991] [DOI] [PubMed] [Google Scholar]
- Hoult J, Reynolds I, Charbonneau Powis M, Coles P, Briggs J. A controlled study of psychiatric hospital versus community treatment ‐ the effect on relatives. Australian and New Zealand Journal of Psychiatry 1981;15(4):323‐8. [PUBMED: 6951573] [DOI] [PubMed] [Google Scholar]
- Hoult J, Reynolds I, Charbonneau Powis M, Weekes P, Briggs J. Psychiatric hospital versus community treatment: the results of a randomised trial. Australian and New Zealand Journal of Psychiatry 1983;17(2):160‐7. [PUBMED: 6578788] [DOI] [PubMed] [Google Scholar]
- Hoult J, Rosen A, Reynolds I. Community orientated treatment compared to psychiatric hospital orientated treatment. Social Science and Medicine 1984;18(11):1005‐10. [PUBMED: 6740335] [DOI] [PubMed] [Google Scholar]
- Reynolds I, Hoult JE. The relatives of the mentally ill. A comparative trial of community‐oriented and hospital‐oriented psychiatric care. Journal of Nervous and Mental Disease 1984;172(8):480‐9. [PUBMED: 6086834] [PubMed] [Google Scholar]
Huang 2012 {published data only}
- Huang LH 黄丽宏. The effect of family intervention on the rehabilitation of inpatients with schizophrenia [家庭护理模式在住院精神分裂症患者康复期的应用]. Chinese Community Doctors [中国社区医师(医学专业)] 2012, issue 35:270‐1.
Huang 2013 {published data only}
- Huang CY 黄春艳. The clinical treatment effects of community nursing care for the convalescent schizophrenics: a comparative study [社区护理干预对康复期精神分裂症患者的临床治疗影响的对照研究]. Today Nurse [当代护士(专科版)] 2013, issue 07:133‐5.
Hui 2014 {published data only}
- Chang WC, Hui CLM, Lai DC, Tam WWY, Tang JYM, Wong GHY, et al. Clinical and social determinants of duration of untreated psychosis: a 4‐year randomized controlled trial of specialized early intervention service for adult‐onset first‐episode. Early Intervention in Psychiatry 2012;6:77. [Google Scholar]
- Hui CL, Chang WC, Chan SK, Lee EH, Tam WW, Lai DC, et al. Early intervention and evaluation for adult‐onset psychosis: the JCEP study rationale and design. Early Intervention in Psychiatry 2014;8:261–8. [DOI] [PubMed] [Google Scholar]
- NCT00919620. Stage‐specific case management for early psychosis. clinicaltrials.gov/ct2/show/NCT00919620 (first received 10 June 2009).
Hurlburt‐California 1996 {published data only}
- Hurlburt MS, Hough RL, Wood PA. Effects of substance abuse on housing stability of homeless mentally ill persons in supported housing. Psychiatric Services 1996;47(7):731‐6. [PUBMED: 8807687] [DOI] [PubMed] [Google Scholar]
- Wood PA, Hurlburt MS, Hough RL, Hofstetter CR. Longitudinal assessment of family support among homeless mentally ill participants in a supported housing programme. Journal of Community Psychology 1998;26(4):327‐44. [Google Scholar]
ISRCTN73683215 {published data only}
- ISRCTN73683215. Effectiveness of the psychiatric rehabilitation approach in the Netherlands. www.isrctn.com/ISRCTN73683215 (first received 20 December 2005).
Jerrell‐California 1989 {published data only}
- Jerrell J, Hu T. Cost‐effectiveness of intensive clinical and case management compared with an existing system of care. Inquiry 1989;26:224‐34. [PubMed] [Google Scholar]
Jerrell‐SCarolina2 1994 {published data only}
- Jerrell JM. Cost‐effective treatment for persons with dual disorders. New Directions for Mental Health Services 1996;70:79‐91. [PUBMED: 8754232] [DOI] [PubMed] [Google Scholar]
- Jerrell JM. Toward cost‐effective care for persons with dual diagnoses. Journal of Mental Health Administration 1996;23:329‐37. [PUBMED: 10172689] [DOI] [PubMed] [Google Scholar]
- Jerrell JM, Hu T, Ridgely MS. Cost‐effectiveness of substance disorder interventions for people with severe mental illness. Journal of Mental Health Administration 1994;21(3):283‐97. [DOI] [PubMed] [Google Scholar]
- Jerrell JM, Ridgely MS. Comparative effectiveness of three approaches to serving people with severe mental illness and substance abuse disorders. Journal of Nervous and Mental Disease 1995;183(9):566‐76. [PUBMED: 7561818] [DOI] [PubMed] [Google Scholar]
- Jerrell JM, Ridgely MS. Evaluating changes in symptoms and functioning of dually diagnosed clients in specialized treatment. Psychiatric Services 1995;46(3):233‐8. [PUBMED: 7796208] [DOI] [PubMed] [Google Scholar]
- Jerrell JM, Ridgely MS. Impact of robustness of programme implementation on outcomes of clients in dual diagnosis programmes. Psychiatric Services 1999;50:109‐12. [PUBMED: 9890592] [DOI] [PubMed] [Google Scholar]
- Jerrell JM, Wilson JL. The utility of dual diagnosis services for consumers from nonwhite ethnic groups. Psychiatric Services 1996;47(11):1256‐8. [PUBMED: 8916247] [DOI] [PubMed] [Google Scholar]
Jiang 2012 {published data only}
- Jiang XF, Zhang C, Wu ZG, Xiong XY, Zhang J, Zhu XQ 江学锋, 张晨, 吴志国, 熊祥玉, 张洁, 朱学勤. A follow‐up study of family intervention as adjuvant therapy for first‐episode schizophrenica [家庭干预对首发精神分裂症患者辅助治疗的随访研究]. Journal of Clinical Psychiatry [临床精神医学杂志] 2012, issue 01:1‐4.
Jiang 2013 {published data only}
- Jiang MX, Ji YW, Zhou LJ, Xu WW, Dai LQ, Tang WZ, et al 姜明霞, 季一薇, 周路佳, 徐婉婉, 戴丽琴, 唐文忠, et al. Social support for patients with chronic schizophrenia [慢性精神分裂症患者的社会支持]. China Journal of Health Psychology [中国健康心理学杂志] 2013, issue 08:1139‐41.
Jorgensen 2012 {published data only}
- Jorgensen R, Munk‐Jorgensen P, Hansson L, Zoffmann V. Meaningful change with the method guided self‐determination ‐ a randomised controlled study for outpatients diagnosed with schizophrenia. 14th International Congress on Schizophrenia Research; 2013 April 21‐25; Grande Lakes (FL). 2013.
Kane‐Virginia 2004 {published data only}
- Kane CF, Blank MB. NPACT: enhancing programmes of assertive community treatment for the seriously mentally ill. Community Mental Health Journal 2004;40(6):549‐59. [PUBMED: 15672693] [DOI] [PubMed] [Google Scholar]
Kilbourne 2014 {published data only}
- Kilbourne AM, Almirall D, Goodrich DE, Lai Z, Abraham KM, Nord KM, et al. Enhancing outreach for persons with serious mental illness: 12‐month results from a cluster randomized trial of an adaptive implementation strategy. Implementation Science 2014;9:163. [DOI] [PMC free article] [PubMed] [Google Scholar]
Klotz‐California 2001 {published data only}
- Klotz TA, Summers BH, Richardson L, Gomberg DI, Maloney M. Community reintegration for severely mentally ill patients leaving jail. 154th Annual Meeting of the American Psychiatric Association; 2001 May 5‐10; New Orleans. 2001.
- Maloney M. MIOCRG Grant Application ‐ FORward MOMentum study. Data on file 2001.
Knight‐California 1990 {published data only}
- Knight RG, Carter PM. Reduction of psychiatric inpatient stay for older adults by Intensive Case Management. Gerontologist 1990;30:510‐5. [DOI] [PubMed] [Google Scholar]
Kuldau‐California 1977 {published data only}
- Kuldau JM, Dirks SJ. Controlled evaluation of a hospital‐originated community transitional system. Archives of General Psychiatry 1977;34:1331‐40. [DOI] [PubMed] [Google Scholar]
Lafave‐Canada 1996 {published data only}
- Lafave HG, Souza HR, Gerber GJ. Assertive community treatment of severe mental illness ‐ a Canadian experience. Psychiatric Services 1996;47(7):757‐9. [DOI] [PubMed] [Google Scholar]
Langley 2009 {published data only}
- Langley J, Gehrs M, Wasylenki D, Dewa C, Rueda S, Rourke S. Suicidality in seriously mentally ill clients of two intensive community mental health programs. Canadian Journal of Community Mental Health 2009;28(1):151‐64. [Google Scholar]
Langsley‐Colorado 1968 {published data only}
- Langsley DG, Machotka P, Flomenhaft K. Follow up evaluation of family crisis therapy. American Journal of Orthopsychiatry 1969;39:753‐9. [DOI] [PubMed] [Google Scholar]
- Langsley DG, Machotka P, Flomenshaft K. Avoiding mental hospital admissions: a follow up study. American Journal of Psychiatry 1971;127:1391‐4. [DOI] [PubMed] [Google Scholar]
- Langsley DG, Pittman FS, Machotka P, Flomenhaft K. Family crisis therapy ‐ results and implications. Family Process 1968;7:145‐58. [Google Scholar]
Lehman‐Maryland2 1993 {published data only}
- Lehman AF, Herron JD, Schwartz RP, Myers CP. Rehabilitation for adults with severe mental illness and substance use disorders. A clinical trial. Journal of Nervous and Mental Disease 1993;181:86‐90. [DOI] [PubMed] [Google Scholar]
LEO‐UK 1994 {published and unpublished data}
- Craig T. Brixton early psychosis project. National Research Register 2001; Vol. 3.
- Craig T. Brixton early psychosis project. www.isrctn.com/ISRCTN73679874 (first received 23 January 2004).
- Craig T. Further information on Brixton Early Psychosis Project [personal communication]. Email to: M Dieterich 22 May 2009.
- Craig TKJ. Brixton early psychosis project. National Research Register 2000.
- Craig TKJ, Garety P, Power P, Rahaman N, Colbert S, Fornells‐Ambrojo M, et al. The Lambeth Early Onset (LEO) Team: randomised controlled trial of the effectiveness of specialised care for early psychosis. BMJ 2004;329(7474):1067‐70. [PUBMED: 15485934] [DOI] [PMC free article] [PubMed] [Google Scholar]
- Garety P. Randomised controlled trial of early psychosis in Lambeth. National Research Register 2000.
- Garety P. Randomised controlled trial of early psychosis in Lambeth. National Research Register 2001; Vol. 1.
- Garety PA, Craig TKJ, Dunn G, Fornells‐Ambrojo M, Colbert S, Rahaman N, et al. Specialised care for early psychosis: symptoms, social functioning and patient satisfaction: randomised controlled trial. British Journal of Psychiatry 2006;188:37‐45. [PUBMED: 16388068] [DOI] [PubMed] [Google Scholar]
- Knapp M. Brixton early psychosis study project #432. National Research Register 2004; Vol. 1.
- Power P, Craig T, Garety P, Rahaman N, Colbert S, Fornells‐Ambrojo M. Lambeth Early Onset (LEO) trial: a randomised controlled trial of assertive community follow‐up in early psychosis: initial 6 month data. Data on file 1994.
- Power P, Craig T, Garety P, Rahaman N, Fornells‐Ambrojo M, Colbert S. A randomised controlled trial of assertive community follow‐up in early psychosis: preliminary results. Schizophrenia Research 2002;53(3 Suppl 1):42. [Google Scholar]
Li 2011 {published data only}
- Li SC, Chen CY 李守春, 陈常云. Effects of comprehensive intervention on mental health status of first‐degree relatives of inpatients with first‐episode schizophrenia [综合干预对首发住院精神分裂症患者一级亲属心理健康状况的影响]. Journal of Psychiatry [精神医学杂志] 2011;24(03):218‐20. [Google Scholar]
Li 2012 {published data only}
- Li ZC 李振超. The effect of community comprehensive intervention on cognitive function of first‐episode schizophrenia [社区防治综合措施对首发精神分裂症认知功能的影响]. China Modern Medicine [中国当代医药] 2012, issue 33:164‐5.
Li 2013 {published data only}
- Li SC, Lu ZS, An XD 李守春, 卢振胜, 安晓东. A follow‐up study of the effects of family health education and individualized management on quality of life of patients with chronic schizophrenia [家庭健康教育和个体化管理对慢性精神分裂症患者生活质量的随访研究]. Medical Journal of Chinese People's Health [中国民康医学] 2013, issue 13:91‐2.
Liang 2009 {published data only}
- Liang GY, Zhang YL, He YT, Fu LM 梁国英, 张艳莉, 何育涛, 傅兰梅. The effect of community nursing care for the rehabilitation in patients with schizophrenia [社区护理对精神分裂症患者复发的影响]. Chinese Journal of Misdiagnostics [中国误诊学杂志] 2009;9(35):8591‐2. [Google Scholar]
Liang 2012 {published data only}
- Liang JM 梁金梅. The effect of integrated family intervention for schizophrenia patients in rehabilitation period [家庭干预综合护理措施对康复期精神分裂症患者作用的研究]. Medical Journal of Chinese People's Health [中国民康医学] 2012, issue 07:863‐4.
Liao 2010 {published data only}
- Liao GS 廖更生. Effects of comprehensive intervention for rehabilitation of first‐episode schizophrenia [综合干预对首发精神分裂症康复的影响]. Chinese Journal of Health Psychology [中国健康心理学杂志] 2010;18(9):1038‐40. [Google Scholar]
Li‐China 2004 {published data only}
- Li TY, Li YY, Wu TC, Yan WY, Chen YH, An Y, et al. Effect of early intervention on quality of life in patients with first episode schizophrenia. Chinese Journal of Clinical Rehabilitation 2004;8(18):3464‐5. [Google Scholar]
Lichtenberg‐Israel 2008 {published data only}
- Lichtenberg P, Levinson D, Sharshevsky Y, Feldman D, Lachman M. Clinical case management of revolving door patients ‐ a semi‐randomized study. Acta Psychiatrica Scandinavica 2008;117(6):449‐54. [PUBMED: 18331577] [DOI] [PubMed] [Google Scholar]
Li JX 2013 {published data only}
- Li JH, Wang YZ 李金惠, 王颖昭. The hospital and home rehabilitation training for patients with first‐episode schizophrenia [医院‐居家康复训练对首发分裂症患者康复的影响]. Hainan Medical Journal [海南医学] 2013, issue 20:3108‐10.
Li MD 2013 {published data only}
- Li MD, Zhao LQ, Zhang YS 李明德, 赵丽琼, 张跃坤. The effects of family intervention on social support in patients with schizophrenia in rural areas [家庭干预对农村精神分裂症患者社会支持度影响的对照研究]. Medical Journal of Chinese People's Health [中国民康医学] 2013, issue 08:22‐3.
Lin‐China 1998 {published data only}
- Lin Y, Zhang, Zhen S. Community based rehabilitation programme for schizophrenia in Shantou: a three year follow up. Journal of Clinical Psychological Medicine 1998;8(5):280‐2. [Google Scholar]
- Lin YQ, Zheng SX, Hong XH. An assessment of community based rehabilitation management for psychiatric patients in Shantou. Chinese Journal of Behavioral Medical Science 2002;11(02):149, 150‐1. [Google Scholar]
Li Ning 2013 {published data only}
- Li N, Han Y, Yan HL, Du JJ, Zheng H, Gao YQ 李宁, 韩嫣, 严宏力, 杜建军, 郑宏, 高运庆. Comparative study on the effects of community‐based comprehensive intervention on relapse frequency in patients with chronic schizophrenia [社区综合干预对慢性精神分裂症患者复发次数影响的对照研究]. Journal of Xinxiang Medical College [新乡医学院学报] 2013, issue 09:749‐51.
Liu 2010 {published data only}
- Liu H, Qin W, Hu SY, Qian ZP 刘华, 秦伟, 胡姝颖, 钱志萍. Effect of systematic rehabilitation intervention on the treatment compliance in patients with schizophrenia [系统康复干预对精神分裂症康复期患者治疗依从性的影响]. Nursing Practice and Research [护理实践与研究] 2010;7(2):17‐9. [Google Scholar]
Li WX 2013 {published data only}
- Li WX 李文秀. The effect of community rehabilitation intervention versus long‐term hospitalisation for patients with schizophrenia [精神分裂症社区康复与长期住院治疗模式对照分析]. Hebei Medicine [河北医学] 2013, issue 08:1173‐5.
Lloyd 2000 {published data only}
- Lloyd KR, Cleary M, Pearson C, Brooks R. A controlled clinical trial of intensive home treatment for persons with severe mental illness. European Psychiatry 2000;15:291S‐2S. [Google Scholar]
Lu 2013 {published data only}
- Lu GF 鲁国芬. Effects of integrated hospital and community management for patients with schizophrenia [医院社区一体化管理模式对精神分裂症患者的管理效果研究]. Chinese General Practice [中国全科医学] 2013, issue 05:453‐5.
Malm‐Sweden 2003 {published and unpublished data}
- Malm U. Further information about your trial [personal communication]. Email to: M Dieterich 25 May 2009.
- Malm U, Ivarsson B, Allebeck P, Falloon IR. Integrated care in schizophrenia: a 2‐year randomized controlled study of two community‐based treatment programmes. Acta Psychiatrica Scandinavica 2003;107(6):415‐23. [PUBMED: 12752017] [DOI] [PubMed] [Google Scholar]
Martin‐Delaware 1993 {published data only}
- Martin SM, Scarpitti FR. An Intensive Case Management approach for paroled IV drug users. Journal of Drug Issues 1993;23:43‐59. [Google Scholar]
Martin‐UK 2005 {published data only}
- Martin G, Costello H, Leese M, Slade M, Bouras N, Higgins S, et al. An exploratory study of assertive community treatment for people with intellectual disability and psychiatric disorders: conceptual, clinical, and service issues. Journal of Intellectual Disability Research 2005;49(Pt 7):516‐24. [PUBMED: 15966959] [DOI] [PubMed] [Google Scholar]
Marx‐Wisconsin 1973 {published data only}
- Marx AJ, Test MA, Stein LI. Extrohospital management of severe mental illness. Feasibility and effects of social functioning. Archives of General Psychiatry 1973;29(4):505‐11. [PUBMED: 4748311] [DOI] [PubMed] [Google Scholar]
McDonell 2013 {published data only}
- McDonell MG, Srebnik D, Angelo F, McPherson S, Lowe JM, Sugar A, et al. Randomized controlled trial of contingency management for stimulant use in community mental health patients with serious mental illness. American Journal of Psychiatry 2013;170:94–101. [DOI] [PMC free article] [PubMed] [Google Scholar]
McFarlane‐New York 1992 {published data only}
- McFarlane WR, Dushay R, Lukens E, Stastny P, Deakins S, Link B. Work outcomes in family‐aided assertive community treatment: vocational rehabilitation for persons with psychotic disorders. Epidemiologia e Psichiatria Sociale 1999;8(3):174‐82. [DOI] [PubMed] [Google Scholar]
- McFarlane WR, Dushay RA, Deakins SM, Stastny P, Lukens EP, Toran J, et al. Employment outcomes in family‐aided assertive community treatment. American Journal of Orthopsychiatry 1999;70(2):203‐14. [DOI] [PubMed] [Google Scholar]
- McFarlane WR, Dushay RA, Stastny P, Deakins SM, Link B. A comparison of two levels of family‐aided assertive community treatment. Psychiatric Services 1996;47(7):744‐50. [DOI] [PubMed] [Google Scholar]
- McFarlane WR, Stastny P, Deakins S. Family‐aided assertive community treatment: a comprehensive rehabilitation and Intensive Case Management approach for persons with schizophrenic disorders. New Directions for Mental Health Services 1992;53:43‐54. [DOI] [PubMed] [Google Scholar]
McGowan‐California 1995 {published data only}
- McGowan M, Madison K, Meisel J, Chandler D. AB3777 Final Report: The Integrated Service Agencies. Report to California Department of Mental Health. Sacramento: Lewin‐VHI, Inc. , 1995. [Google Scholar]
McGrew‐Indiana 1994 {published data only}
- McGrew JH, Bond GR, Dietzen L, Salyers M. Measuring the fidelity of implementation of a mental health programme model. Journal of Consulting and Clinical Psychology 1994;62:670‐8. [DOI] [PubMed] [Google Scholar]
McHugo‐Washington DC 2004 {published data only}
- McHugo GJ, Bebout RR, Harris M, Cleghorn S, Herring G, Xie H, et al. A randomized controlled trial of integrated versus parallel housing services for homeless adults with severe mental illness. Schizophrenia Bulletin 2004;30(4):969‐82. [PUBMED: 15957201] [DOI] [PubMed] [Google Scholar]
MECCA‐Europe 2002 {published data only}
- Mecca protocol. www.mecca.eu.org/index.htm (accessed 10 December 2008).
- McCabe R. Towards more effective community care for people with severe psychosis ‐ MECCA ‐ a randomised controlled trial on outcome management in six European countries. National Research Register 2004; Vol. 3.
- McCabe R, Priebe S, the MECCA group. Aims and methods of the MECCA study in six European countries. Fifth ENMESH (European Network for Mental Health Service Evaluation) International Conference; 2002 May 31 ‐ June 2; Sofia. 2002.
- Priebe S. Outcome management in community mental health care in six European countries: the MECCA study. The Mental Health Research in East London Second Annual Presentation; 2002 Oct 30; London. East London & City Mental Health Trust, 2002.
- Priebe S. Towards more effective European community care for patients with severe psychosis. www.isrctn.com/ISRCTN75571732 (first received 3 September 2005).
- Priebe S. Towards more effective European community care for patients with severe psychosis (MECCA). National Research Register 2003; Vol. 1.
- Priebe S. Towards more effective community care for patients with severe psychosis ‐ a randomised controlled trial on outcome management in six European countries. National Research Register 2001; Vol. 1.
- Priebe S. Towards more effective community care for patients with severe psychosis ‐ a randomised controlled trial on outcome management in six European countries. National Research Register 2003.
- Priebe S, Bullenkamp J, Hansson L, McCabe R, Roessler W, Torres‐Gonzales F, et al. Outcome management in community mental health care in six European countries: the MECCA study. 10th Annual Meeting of the European Public Health Association (EUPHA); 2002 Nov 28‐30; Dresden. 2002.
- Priebe S, Bullenkamp J, McCabe R, Hansson L, Roessler W, Torres‐Gonzalez F, et al. Impact of regular outcome assessment on treatment ‐ the MECCA Study. European Psychiatry 2002;17(Suppl 1):7s. [Google Scholar]
- Priebe S, Bullenkamp J, McCabe R, Hansson L, Rossler W, Torres‐Gonzales F, et al. The impact of routine outcome measurement on treatment processes in community mental health care: approach and methods of the MECCA study. Epidemiologia e Psichiatria Sociale 2002;11(3):198‐205. [DOI] [PubMed] [Google Scholar]
- Wright D, McCabe R, Priebe S, the MECCA group. MECCA: How to improve community mental health care. First London Mental Health Research and Development Virtual Institute (LoMHR&D) Conference; 2003 Jan 28; London. 2003.
Meneghelli‐Italy 2000 {published data only}
- Cocchi A, Meneghelli A, Preti A. Programmema 2000: Celebrating 10 years of activity of an Italian pilot programme on early intervention in psychosis. Australian and New Zealand Journal of Psychiatry 2008;42(12):1003‐12. [PUBMED: 19016088] [DOI] [PubMed] [Google Scholar]
- Meneghelli A. An early intervention programme in a community mental health center in Italy. Second International Conference on Early Psychosis; 2000 Mar 31 ‐ Apr 2; New York (NY). 2000.
Merson‐UK 1992 {published data only}
- Merson S, Tyrer P, Carlen D, Johnson T. The cost of treatment of psychiatric emergencies: a comparison of hospital and community services. Psychological Medicine 1996;26(4):727‐34. [PUBMED: 8817707] [DOI] [PubMed] [Google Scholar]
- Merson S, Tyrer P, Onyett S, Lack S, Birkett P, Lynch S, et al. Early intervention in psychiatric emergencies: a controlled clinical trial. Lancet 1992;339(8805):1311‐4. [PUBMED: 1349990] [DOI] [PubMed] [Google Scholar]
- Tyrer P, Merson S, Onyett S, Johnson T. The effect of personality disorder on clinical outcome, social networks and adjustment: a controlled clinical trial of psychiatric emergencies. Psychological Medicine 1994;24(3):731‐40. [PUBMED: 7991755] [DOI] [PubMed] [Google Scholar]
Modcrin‐Kansas 1988 {published data only}
- Modcrin M, Rapp C, Poertner J. The evaluation of case management services with the chronically mentally ill. Evaluation and Programme Planning 1988;11:307‐14. [DOI] [PubMed] [Google Scholar]
Morse‐Missouri2 1997 {published data only}
- Burger GK, Calsyn RJ, Morse GA, Klinkenberg WD. Prototypical profiles of the Brief Psychiatric Rating Scale. Journal of Personality Assessment 2000;75(3):373‐86. [PUBMED: 11117152] [DOI] [PubMed] [Google Scholar]
- Calsyn RJ. A modified ESID approach to studying mental illness and homelessness. American Journal of Community Psychology 2003;32(3‐4):319‐31. [PUBMED: 14703267] [DOI] [PubMed] [Google Scholar]
- Calsyn RJ, Morse GA, Klinkenberg WD, Trusty ML, Allen G. The impact of assertive community treatment on the social relationships of people who are homeless and mentally ill. Community Mental Health Journal 1998;34(6):579‐93. [PUBMED: 9833199] [DOI] [PubMed] [Google Scholar]
- Calsyn RJ, Morse GA, Klinkenberg WD, Yonker RD, Trusty ML. Moderators and mediators of client satisfaction in case management programmes for clients with severe mental illness. Mental Health Services Research 2002;4(4):267‐75. [PUBMED: 12558015] [DOI] [PubMed] [Google Scholar]
- Kenny DA, Calsyn RJ, Morse GA, Klinkenberg WD, Winter JP, Trusty ML. Evaluation of treatment programmes for persons with severe mental illness: moderator and mediator effects. Evaluation Review 2004;28(4):294‐324. [DOI] [PubMed] [Google Scholar]
- Klinkenberg WD, Calsyn RJ, Morse GA. The helping alliance in case management for homeless persons with severe mental illness. Community Mental Health Journal 1998;34(6):569‐78. [PUBMED: 9833198] [DOI] [PubMed] [Google Scholar]
- Morse GA, Calsyn RJ, Klinkenber W, Trusty ML, Gerber F, Smith R, et al. An experimental comparison of three types of case management for homeless mentally ill persons. Psychiatric Services 1997;48(4):497‐503. [PUBMED: 9090733] [DOI] [PubMed] [Google Scholar]
- Wolff N, Helminiak TW, Morse GA, Calsyn RJ, Klinkenberg WD, Trusty ML. Cost‐effectiveness evaluation of three approaches to case management for homeless mentally ill clients. American Journal of Psychiatry 1997;154(3):341‐8. [PUBMED: 9054781] [DOI] [PubMed] [Google Scholar]
Morthorst 2012 {published data only}
- Morthorst B, Krogh J, Erlangsen A, Alberdi F, Nordentoft M. Effect of assertive outreach after suicide attempt in the AID (assertive intervention for deliberate self harm) trial: randomised controlled trial. BMJ 2012;345:e4972. [DOI: 10.1136/bmj.e4972] [DOI] [PMC free article] [PubMed] [Google Scholar]
Mosher‐California 1975 {published data only}
- Bola JR, Mosher LR. Treatment of acute psychosis without neuroleptics: two‐year outcomes from the Soteria project. Journal of Nervous and Mental Disease 2003;191(4):219‐29. [PUBMED: 12695732] [DOI] [PubMed] [Google Scholar]
- Matthews SM, Roper MT, Mosher LR, Menn AZ. A non neuroleptic treatment for schizophrenia: analysis of the two year postdischarge risk of relapse. Schizophrenia Bulletin 1979;5(2):322‐33. [PUBMED: 37598] [DOI] [PubMed] [Google Scholar]
- Mosher LR, Menn A, Matthew SM. Soteria: evaluation of a home‐based treatment for schizophrenia. American Journal of Orthopsychiatry 1975;45(3):455‐67. [PUBMED: 238399] [DOI] [PubMed] [Google Scholar]
- Mosher LR, Menn AZ. Community residential treatment for schizophrenia: two year follow up. Hospital and Community Psychiatry 1978;29(11):715‐23. [PUBMED: 700610] [DOI] [PubMed] [Google Scholar]
Muijen‐UK1 1992 {published data only}
- Knapp M, Beecham J, Koutsogeorgopoulou V, Hallam A, Fenyo A, Marks IM, et al. Service use and costs of home‐based versus hospital‐based care for people with serious mental illness. British Journal of Psychiatry 1994;165:195‐203. [PUBMED: 1571681] [DOI] [PubMed] [Google Scholar]
- Marks IM, Connolly J, Muijen M, Audini B, McNamee G, Lawrence RE. Home‐based versus hospital‐based care for people with serious mental illness. British Journal of Psychiatry 1994;165:179‐94. [DOI] [PubMed] [Google Scholar]
- Muijen M, Marks I, Connolly J, Audini B. Home based care and standard hospital care for patients with severe mental illness: a randomised controlled trial. BMJ 1992;304(6829):749‐54. [PUBMED: 1571681] [DOI] [PMC free article] [PubMed] [Google Scholar]
- Muijen M, Marks IM, Connolly J, Audini B, McNamee G. The daily living programme. Preliminary comparison of community versus hospital‐based treatment for the seriously mentally ill facing emergency admission. British Journal of Psychiatry 1992;160:379‐84. [PUBMED: 1562865] [DOI] [PubMed] [Google Scholar]
- Simpson CJ, Seager CP, Robertson JA. Home‐based care and standard hospital care for patients with severe mental illness: a randomised controlled trial. British Journal of Psychiatry 1993;162:239‐43. [PUBMED: 8435695] [DOI] [PubMed] [Google Scholar]
Mulder‐Missouri 1985 {published data only}
- Mowbray CT, Collins ME, Plum TB, Masterton T, Mulder R. Harbinger. I: The development and evaluation of the first PACT replication. Administration and Policy in Mental Health 1997;25(2):105‐23. [PUBMED: 9727211] [DOI] [PubMed] [Google Scholar]
- Mulder R. Evaluation of the Harbringer Programme. Data on file 1985.
NCT00781079 {published data only}
- NCT00781079. Do consumer providers enhance recovery? (PEER). clinicaltrials.gov/ct2/show/NCT00781079 (first received 27 October 2008).
NCT01597141 {published data only}
- NCT01597141. Psychosis: Early detection, intervention and prevention. clinicaltrials.gov/show/NCT01597141 (first received 9 May 2012).
Nieves 2002 {published data only}
- Nieves EJ. The effectiveness of the assertive community treatment model. Administration and Policy in Mental Health 2002;29(6):461‐80. [DOI] [PubMed] [Google Scholar]
Odom 2005 {published data only}
- Odom AE. A Randomized Study of Integrated Outpatient Treatment and Assertive Community Treatment for Patients With Comorbid Mental Illness and Substance Use Disorders: Comparing Treatment Outcome for Domiciled and Homeless Patients [PhD dissertation]. New School University, 2005. [Google Scholar]
Pai‐India 1982 {published data only}
- Pai S, Kapur RL. Evaluation of home care treatment for schizophrenic patients. Acta Psychiatrica Scandinavica 1983;67(2):80‐8. [PUBMED: 6846041] [DOI] [PubMed] [Google Scholar]
- Pai S, Kapur RL. Impact of treatment intervention on the relationship between dimensions of clinical psychopathology, social dysfunction and burden on the family of psychiatric patients. Psychological Medicine 1982;12(3):651‐8. [PUBMED: 7134321] [DOI] [PubMed] [Google Scholar]
- Pai S, Nagarajaiah. Treatment of schizophrenic patients in their homes through a visiting nurse ‐ some issues in the nurse's training. International Journal of Nursing Studies 1982;19(3):167‐72. [PUBMED: 6293993] [DOI] [PubMed] [Google Scholar]
- Pai S, Roberts EJ. Follow‐up study of schizophrenic patients initially treated with home care. British Journal of Psychiatry 1983;143:447‐50. [PUBMED: 6640212] [DOI] [PubMed] [Google Scholar]
Pioli 2006 {published data only}
- Pioli R, Vittorielli M, Gigantesco A, Rossi G, Basso L, Caprioli C, et al. Outcome assessment of the VADO approach in psychiatric rehabilitation: a partially randomised multicentric trial. Clinical Practice and Epidemiology in Mental Health 2006;2(5):1‐8. [DOI] [PMC free article] [PubMed] [Google Scholar]
Polak‐Colorado 1976 {published data only}
- Polak PR, Kirkby MW. A model to replace psychiatric hospitals. Journal of Nervous and Mental Disease 1976;162:13‐22. [DOI] [PubMed] [Google Scholar]
PRiSM‐UK 1998 {published data only}
- Becker T, Holloway F, McCrone P, Thornicroft G. Evolving service interventions in Nunhead and Norwood. PRiSM Psychosis Study 2. British Journal of Psychiatry 1998;173:371‐5. [PUBMED: 9926052] [DOI] [PubMed] [Google Scholar]
- Johnson S, Leese M, Brooks L, Clarkson P, Guite H, Thornicroft G, et al. Frequency and predictors of adverse events. PRiSM Psychosis Study 3. British Journal of Psychiatry 1998;173:376‐84. [PUBMED: 9926053] [DOI] [PubMed] [Google Scholar]
- Leese M, Johnson S, Slade M, Parkman S, Kelly F, Phelan M, et al. User perspective on needs and satisfaction with mental health services. PRiSM psychosis study 8. British Journal of Psychiatry 1998;173:409‐15. [PUBMED: 9926058] [DOI] [PubMed] [Google Scholar]
- McCrone P, Thornicroft G, Phelan M, Holloway F, Wykes T, Johnson S. Utilisation and costs of community mental health services. PRiSM Psychosis Study 5. British Journal of Psychiatry 1998;173:391‐8. [PUBMED: 9926055] [DOI] [PubMed] [Google Scholar]
- Szmukler GI, Wykes T, Parkman S. Care giving and the impact on carers of a community mental health service. PRiSM Psychosis Study 6. British Journal of Psychiatry 1998;173:399‐403. [PUBMED: 9926056] [DOI] [PubMed] [Google Scholar]
- Taylor RE, Leese M, Clarkson P, Holloway F, Thornicroft G. Quality of life outcomes for intensive versus standard community mental health services. PRiSM Psychosis Study 9. British Journal of Psychiatry 1998;173:416‐22. [PUBMED: 9926059] [DOI] [PubMed] [Google Scholar]
- Thornicroft G, Strathdee G, Phelan M, Holloway F, Wykes T, Dunn G, et al. Rationale and design. PRiSM Psychosis Study I. British Journal of Psychiatry 1998;173:363‐70. [PUBMED: 9926051] [DOI] [PubMed] [Google Scholar]
- Thornicroft G, Wykes T, Holloway F, Johnson S, Szmukler G. From efficacy to effectiveness in community mental health services. PRiSM Psychosis Study 10. British Journal of Psychiatry 1998;173:423‐7. [PUBMED: 9926060] [DOI] [PubMed] [Google Scholar]
- Wykes T, Leese M, Taylor R, Phelan M. Effects of community services on disability and symptoms. PRiSM Psychosis Study 4. British Journal of Psychiatry 1998;173:385‐90. [PUBMED: 9926054] [DOI] [PubMed] [Google Scholar]
Ren‐China 2004 {published data only}
- Ren E, Liang X, Yan H. The administration of openly comprehensive rehabilitation impacts on the self‐efficacy of chronic schizophrenics. Medical Journal of Chinese Peoples Health 2004;16(5):308‐9. [Google Scholar]
Roldan‐Merino 2012 {published data only}
- Roldan‐Merino J, Garcia IC, Ramos‐Pichardo JD, Foix‐Sanjuan A, Quilez‐Jover J, Montserrat‐Martinez M. Impact of personalized in‐home nursing care plans on dependence in ADLs/IADLs and on family burden among adults diagnosed with schizophrenia: a randomized controlled study. Perspectives in Psychiatric Care 2012;49:171‐8. [DOI] [PubMed] [Google Scholar]
Rossler‐Germany1 1992 {published data only}
- Rossler W, Loffler W, Fatkenheuer B, Reicher‐Rossler A. Does case management reduce the rehospitalization rate?. Acta Psychiatrica Scandinavica 1992;86(6):445‐9. [DOI] [PubMed] [Google Scholar]
Rossler‐Germany2 1995 {published data only}
- Rossler W, Loffler B, Fatkenheuer A, Riecher‐Rossler A. Case management for schizophrenic patients at risk of rehospitalization ‐ a case control study. European Archives of Psychiatry and Clinical Neuroscience 1995;246(1):29‐36. [DOI] [PubMed] [Google Scholar]
Rutter‐UK {published and unpublished data}
- Rutter D, Tyrer P, Emmanuel J, Weaver T, Byford S, Hallam A, et al. Internal vs. external care management in severe mental illness: randomized controlled trial and qualitative study. Journal of Mental Health 2004;13(5):453‐66. [Google Scholar]
- Tyrer P. Further information about your trial [personal communication]. Email to: M Dieterich 19 May 2009.
- Tyrer P. Integrated care management in the care of severe psychotic illness. National Research Register 2001; Vol. 1.
- Tyrer P. Integrated care management in the care of severe psychotic illness. (In the process of application). National Research Register 2000.
- Tyrer P. Randomised controlled trial (RCT) on qualitative analysis of internal and external care management in severe mental illness. www.isrctn.com/ISRCTN01712888 (first received 23 January 2004).
- Tyrer P. Randomised controlled trial on qualitative analysis of internal and external care management in severe mental illness. National Research Register 2001.
Salyers 2010 {published data only}
- Salyers MP, McGuire AB, Rollins AL, Bond GR, Mueser KT, Macy VR. Integrating assertive community treatment and illness management and recovery for consumers with severe mental illness. Community Mental Health Journal 2010;46(4):319‐29. [DOI] [PubMed] [Google Scholar]
Salyers 2014 {published data only}
- Salyers MP, McGuire AB, Kukla M, Fukui S, Lysaker PH, Mueser KT. A randomized controlled trial of illness management and recovery with an active control group. Psychiatric Services 2014;65:1005‐11. [DOI] [PubMed] [Google Scholar]
Santiago‐Arizona 1985 {published data only}
- Santiago JM, McCall‐Perez F, Bachrach LJ. Integrated services for chronic mental patients: theoretical perspective and experimental results. General Hospital Psychiatry 1985;7:309‐15. [DOI] [PubMed] [Google Scholar]
Sato 2012 {published data only}
- Sato S, Ikebuchi E, Anzai N, Inoue S. Effects of psychosocial program for preparing long‐term hospitalized patients with schizophrenia for discharge from hospital: randomized controlled trial. Psychiatry and Clinical Neurosciences 2012;66:474‐81. [DOI] [PubMed] [Google Scholar]
Schmidt 2005 {published data only}
- Schmidt LT. Comparison of Service Outcomes of Case Management Teams With and Without a Consumer Provider. New York: University of Medicine and Dentistry of New York, 2005. [Google Scholar]
Segal 2010 {published data only}
- Segal SP, Silverman CJ, Temkin TL. Self‐help and community mental health agency outcomes: a recovery‐focused randomized controlled trial. Psychiatric Services 2010;61(9):905‐10. [DOI] [PMC free article] [PubMed] [Google Scholar]
Segal 2011 {published data only}
- Segal SP, Silverman CJ, Temkin TL. Outcomes from consumer‐operated and community mental health services: a randomized controlled trial. Psychiatric Services 2011;62:915‐21. [DOI] [PMC free article] [PubMed] [Google Scholar]
Sha 2010 {published data only}
- Sha R, Cai J, Zhu WM, Fu PX, Bo ZS, Song YH, et al 沙蓉, 蔡军, 朱卫明, 付培鑫, 柏忠生, 宋月红, et al. The effect of skill training on returning to community for chronic schizophrenia [⟪重返社区技能训练程式⟫对慢性精神分裂症康复效果的分析]. Journal of Psychiatry [精神医学杂志] 2010;23(05):340‐2. [Google Scholar]
Shen WW 2013 {published data only}
- Shen WW, Zhang ZQ, Chen J, Huang X, Gong S, Deng H 申文武, 张倬秋, 陈娟, 黄霞, 龚姝, 邓红. The effect of Hospital‐Community‐Family rehabilitation intervention on quality of life of schizophrenia patients [“医院‐社区‐家庭”一体化精神康复模式对精神分裂症患者生存质量的影响]. Chinese Journal of Evidence‐Based Medicine [中国循证医学杂志] 2013, issue 10:1176‐9.
Shern‐USA2 {published and unpublished data}
- Greenwood RM, Schaefer‐McDaniel N, Winkel G, Tsemberis S. Decreasing psychiatric symptoms by increasing choice in services for adults with histories of homelessness. American Journal of Community Psychology 2005;36(3/4):223‐38. [DOI] [PubMed] [Google Scholar]
- Gulcur L, Stefancic A, Shinn M, Tsemberis S, Fischer S. Housing, hospitalization, and cost outcomes for homeless individuals with psychiatric disabilities participating in continuum of care and Housing First programmes. Journal of Community and Applied Social Psychology 2003;13:171‐86. [Google Scholar]
- Gulcur L, Tsemberis S, Stefancic A, Greenwood RM. Community integration of adults with psychiatric disabilities and histories of homelessness. Community Mental Health Journal 2007;43(3):211‐28. [DOI] [PubMed] [Google Scholar]
- Hul L. Further information on pathways to housing [personal communication]. Email to: M Dieterich 10 June 2009.
- Padgett DK, Gulcur L, Tsemberis S. Housing First services for people who are homeless with co‐occurring serious mental illness and substance abuse. Research on Social Work Practice 2006;16(1):74‐83. [Google Scholar]
- Tsemberis S, Gulcur L, Nakae M. Housing First, consumer choice, and harm reduction for homeless individuals with a dual diagnosis. American Journal of Public Health 2004;94(4):651‐6. [PUBMED: 15054020] [DOI] [PMC free article] [PubMed] [Google Scholar]
- Tsemberis SJ, Moran L, Shinn M, Asmussen SM, Shern DL. Consumer preference programmes for individuals who are homeless and have psychiatric disabilities: a drop‐in center and a supported housing programme. American Journal of Community Psychology 2003;32(3‐4):305‐17. [PUBMED: 14703266] [DOI] [PubMed] [Google Scholar]
Shern‐USA3 {published data only}
- Stefancic A, Tsemberis S. Housing First for long term shelter dwellers with psychiatric disabilities in a suburban county: a four‐year study of housing access and retention. Journal of Primary Prevention 2007;28:265‐79. [DOI] [PubMed] [Google Scholar]
Shern‐USA4 {published data only}
- Tsemberis S, Eisenberg RF. Pathways to housing: supported housing for street‐dwelling homeless individuals with psychiatric disabilities. Psychiatric Services 2000;51(4):487‐93. [DOI] [PubMed] [Google Scholar]
Solomon 2014 {published data only}
- Hanrahan NP, Solomon P, Hurford MO. A pilot randomized control trial testing a transitional care model for acute psychiatric conditions. Journal of the American Psychiatric Nurses Association 2014;20:315‐27. [DOI] [PubMed] [Google Scholar]
- Solomon P, Hanrahan NP, Hurford M, DeCesaris M, Josey L. Lessons learned from implementing a pilot RCT of transitional care model for individuals with serious mental illness. Archives of Psychiatric Nursing 2014;28(4):250‐5. [DOI: 10.1016/j.apnu.2014.03.005] [DOI] [PubMed] [Google Scholar]
Solomon‐Pennsylvania1 {published data only}
- Solomon P, Draine J. Consumer case management and attitudes concerning family relations among persons with mental illness. Psychiatric Quarterly 1995;66(3):249‐61. [PUBMED: 7568532] [DOI] [PubMed] [Google Scholar]
- Solomon P, Draine J. Family perceptions of consumers as case managers. Community Mental Health Journal 1994;30(2):165‐76. [PUBMED: 8013213] [DOI] [PubMed] [Google Scholar]
- Solomon P, Draine J. One‐year outcomes of a randomized trial of consumer case management. Evaluation and Programme Planning 1995;18:117‐27. [Google Scholar]
- Solomon P, Draine J. Perspectives concerning consumers as case managers. Community Mental Health Journal 1996;32(1):41‐6. [PUBMED: 8635316] [DOI] [PubMed] [Google Scholar]
- Solomon P, Draine J. Satisfaction with mental health treatment in a randomized trial of consumer case management. Journal of Nervous and Mental Disease 1994;182(3):179‐84. [DOI] [PubMed] [Google Scholar]
- Solomon P, Draine J. The efficacy of a consumer case management team: 2‐year outcomes of a randomized trial. Journal of Mental Health Administration 1995;22(2):135‐46. [PUBMED: 10142127] [DOI] [PubMed] [Google Scholar]
Somers 2013 {published data only}
- Somers JM, Patterson ML, Moniruzzaman A, Currie L, Rezansoff SN, Palepu A, et al. Vancouver At Home: Pragmatic randomized trials investigating Housing First for homeless and mentally ill adults. Trials 2013;14:365. [PUBMED: 24176253] [DOI] [PMC free article] [PubMed] [Google Scholar]
Song 2013 {published data only}
- Song PJ, Pei SY, Sun SH 宋珀槿, 裴双义, 孙淑红. The effect of family psychological intervention combined with social skill training on rehabilitation in patients with schizophrenia [家庭心理干预联合社会技能训练治疗康复期精神分裂症患者的疗效]. Chinese Journal of Gerontology [Zhongguo lao nian xue za zhi; 中国老年学杂志] 2013, issue 20:5019‐20.
Stein 1974 {published data only}
- The 1974 APA achievement award winners. Gold award: a community treatment program. Mendota Mental Health Institute, Madison, Wisconsin. Hospital and Community Psychiatry 1974; Vol. 25, issue 10:669‐72. [PUBMED: 4416614] [PubMed]
Stein‐Wisconsin {published data only}
- Stein LI, Test MA. Alternative to mental hospital treatment: I. Conceptual model, treatment programme, and clinical evaluation. Archives of General Psychiatry 1980;37(4):392‐7. [PUBMED: 7362425] [DOI] [PubMed] [Google Scholar]
- Stein LI, Test MA, Marx AJ. Alternative to the hospital: a controlled study. American Journal of Psychiatry 1975;132:517‐22. [PUBMED: 164129] [DOI] [PubMed] [Google Scholar]
- Test MA, Stein LI. Alternative to mental hospital treatment. III. Social cost. Archives of General Psychiatry 1980;37(4):409‐12. [PUBMED: 7362426] [DOI] [PubMed] [Google Scholar]
- Test MA, Stein LI. Training in community living: a follow‐up look at a Gold‐Award programme. Hospital and Community Psychiatry 1976;27(3):193‐4. [PUBMED: 819348] [DOI] [PubMed] [Google Scholar]
- Test MA, Stein LI. Training in community living: research design and results. In: Stein LI, Test MA editor(s). Alternatives to Mental Hospital Treatment. New York: Plenum Publishing Corporation, 1978:57‐74. [Google Scholar]
- Weisbrod BA, Test MA, Stein LI. Alternative to mental hospital treatment: II. Economic benefit cost analysis. Archives of General Psychiatry 1980;37(4):400‐5. [PUBMED: 6767462] [DOI] [PubMed] [Google Scholar]
Stultz 2014 {published data only}
- Stultz N. Home treatment for acute psychiatric care. clinicaltrials.gov/ct2/show/NCT02322437 (first received 11 December 2014).
Sungur 2011 {published data only}
- Sungur M, Soygur H, Guner P, Ustun B, Cetin I, Falloon IR. Identifying an optimal treatment for schizophrenia: a 2‐year randomized controlled trial comparing integrated care to a high‐quality routine treatment. International Journal of Psychiatry in Clinical Practice 2011;15:118‐27. [DOI] [PubMed] [Google Scholar]
Supereden 2012 {published data only}
- ISRCTN61621571. Sustaining positive engagement and recovery (SUPEREDEN) ‐ the next step after early intervention for psychosis. Study 3: Improving social recovery in young people with emerging severe social disability: a proof of principle randomised controlled trial. www.isrctn.com/ISRCTN61621571 (first received 26 June 2012).
Susser‐New York 1997 {published data only}
- Jones K, Colson PW, Holter MC, Lin S, Valencia E, Susser E, et al. Cost‐effectiveness of critical time intervention to reduce homelessness among persons with mental illness. Psychiatric Services 2003;54(6):884‐90. [PUBMED: 12773605] [DOI] [PubMed] [Google Scholar]
- Susser E, Valencia E, Conover S, Felix A, Tsai WY, Wyatt RJ. Preventing recurrent homelessness among mentally ill men: a "critical time" intervention after discharge from a shelter. American Journal of Public Health 1997;87(2):256‐62. [DOI] [PMC free article] [PubMed] [Google Scholar]
Tang 2013 {published data only}
- Tang J, Wu KM, Liu DA, Zhou XL, Li JJ, Zhou Q 唐兢, 吴克明, 刘德安, 周晓林, 李建军, 周卿. The effect of the community‐family rehabilitation intervention for patients with chronic schizophrenia [社区‐家庭康复对慢性精神分裂症患者的干预分析]. Shanghai Medical and Pharmaceutical Journal [上海医药] 2013, issue 08:60‐2.
Tao‐China 2004 {published data only}
- Tao YL, Yong YL, Tian CW, Wei YY, Yu HC, Yuan A, et al. Effect of early intervention on quality of life in patients with first episode schizophrenia. Chinese Journal of Clinical Rehabilitation 2004;8(18):3464‐5. [Google Scholar]
Teague‐New Hampshire 1995 {published data only}
- Teague GB, Drake RE, Ackerson TH. Evaluating the use of continuous treatment teams for persons with mental illness and substance abuse. Psychiatric Services 1995;46:689‐95. [DOI] [PubMed] [Google Scholar]
Thornicroft‐Maryland 1991 {published data only}
- Thornicroft G, Breakey WR. The COSTAR programme 1: Improving social networks of the long term mentally ill. British Journal of Psychiatry 1991;159:245‐9. [DOI] [PubMed] [Google Scholar]
Tomita 2011 {published data only}
- Tomita A, Herman DB. The impact of critical time intervention in reducing psychiatric rehospitalization after hospital discharge. Psychiatric Services 2012;63(9):935‐7. [DOI: 10.1176/appi.ps.201100468] [DOI] [PMC free article] [PubMed] [Google Scholar]
- Tomita MA. Examining the Impact and Theoretical Pathway of Critical Time Intervention on Psychiatric Re‐Hospitalization Outcomes Among Formerly Homeless Individuals With Severe Mental Illness [Dissertation]. Columbia University, 2012. [Google Scholar]
Toro‐New York 1997 {published data only}
- Toro PA, Bellavia CW, Wall DD, Passero‐Rabideau JM, Daeschler CV, Thomas DM. Evaluating an intervention for homeless persons: results of a field experiment. Journal of Consulting and Clinical Psychology 1997;65:476‐84. [DOI] [PubMed] [Google Scholar]
Tyrer‐UK 1995 {published and unpublished data}
- Tyrer P, Morgan J, Horn E, Jayakody M, Evans K, Brummell R, et al. A randomised controlled study of close monitoring of vulnerable psychiatric patients. Lancet 1995;345(8952):756‐9. [MEDLINE: ] [DOI] [PubMed] [Google Scholar]
van Meijel 2003 {published data only}
- Meijel B. Relapse Prevention in Patients With Schizophrenia: a Nursing Intervention Study [Dissertation]. Utrecht: Universiteit Utrecht, 2003. [Google Scholar]
Vesterager 2011 {published data only}
- Vesterager L, Christensen TT, Olsen BB, Krarup G, Forchhammer HB, Melau M, et al. Cognitive training plus a comprehensive psychosocial programme (opus) versus the comprehensive psychosocial programme alone for patients with first‐episode schizophrenia (the NEUROCOM trial): a study protocol for a centrally randomised, observer‐blinded multi‐centre clinical trial. Trials 2011;12:35. [DOI] [PMC free article] [PubMed] [Google Scholar]
Vincent‐Ohio 1977 {published data only}
- Vincent P, Price JR. Evaluation of a VNA Mental Health Project. Nursing Research 1977;26:361‐7. [DOI] [PubMed] [Google Scholar]
Wang 2008a {published data only}
- Wang YH. Effect of community nursing on schizophrenic patients in convalescence [社区护理对康复期精神分裂症患者的影响]. Journal of Clinical Nursing 2008;7(3):16‐7. [Google Scholar]
Wang F 2012 {published data only}
- Wang F, Li HL 王飞, 李红丽. The short‐term efficacy of family rehabilitation for patients with chronic schizophrenia [家庭式康复治疗对慢性精神分裂症患者的近期疗效观察]. Chinese Magazine of Drug Abuse Prevention and Treatment [中国药物滥用防治杂志] 2012, issue 05:269‐72.
Wang FY 2013 {published data only}
- Wang FY 王凤英. Family rehabilitation for discharged patients with schizophrenia [家庭康复在精神分裂症出院患者中的应用]. Journal of Qilu Nursing [齐鲁护理杂志] 2013, issue 13:99‐100.
Wang YL 2012 {published data only}
- Wang YL 王玉玲. The effect of family intervention on the rehabilitation of patients with schizophrenia [家庭护理干预对精神分裂症患者康复的影响]. Psychiatric Nursing Risk Management Training Class and Academic Communication [精神科护理风险管理培训班及学术交流会] 2012:1.
Wang YQ 2010a {published data only}
- Wang YQ 王英群. Effects of psychological intervention on social functions of schizophrenics in rehabilitation period [心理干预对康复期精神分裂症患者社会功能的影响]. Journal of Shandong Medical College [山东医学高等专科学校学报] 2010;32(07):545‐7. [Google Scholar]
Wang Z 2012 {published data only}
- Wang Z, Liu XW, Tan YY 王志, 刘晓伟, 谈幼玉. Family intervention effect on social dysfunction in rehabilitation period of schizophrenia [家庭干预在精神分裂症患者社会功能障碍康复中的效果分析]. Journal of Military Surgeon in Southwest China [西南军医] 2012, issue 02:208‐10.
Wen 2010 {published data only}
- Wen L, Liu DJ 文丽, 刘杜鹃. Influence of PDCA home care intervention for patients with schizophrenia [家庭护理干预对精神分裂症患者的影响]. Chinese Journal of Misdiagnostics [中国误诊学杂志] 2010;10(11):2529‐30. [Google Scholar]
Wirshing 2006 {published data only}
- Wirshing DA, Guzik LH, Zorick TS, Pierre JM, Resnick SA, Goldstein D, et al. Community re‐entry program training module for schizophrenic inpatients improves treatment outcomes. Schizophrenia Research 2006;1‐3:338‐9. [DOI] [PubMed] [Google Scholar]
Wood‐New Zealand 1994 {published data only}
- Wood K, Anderson J. The effect on hospital admissions of psychiatric case management involving general practitioners: preliminary results. Australian and New Zealand Journal of Psychiatry 1994;28:223‐9. [DOI] [PubMed] [Google Scholar]
Wu 2013 {published data only}
- Wu J, Zhang SB, Tang YL, Tan Y 吴菁, 章三斌, 唐义莲, 谭悦. The effects of group‐psychotherapy and family therapy for the schizophrenics in rehabilitation period [团体心理治疗和家庭治疗对康复期精神分裂症患者疗效的对照研究]. China Journal of Health Psychology [中国健康心理学杂志] 2013;21(12):1780‐2. [Google Scholar]
Wunderink 2015 {published data only}
- Wunderink L. A trial comparing the effectiveness of Assertive Community Treatment enhanced with evidence based interventions with standard Assertive Community Treatment. www.isrctn.com/ISRCTN37364372 (first received 15 March 2013). [DOI: 10.1186/ISRCTN37364372] [DOI]
Xing 2013 {published data only}
- Xing F, Lu QF 邢锋, 鲁青芳. Effects of community comprehensive rehabilitation training for patients with chronic schizophrenia [社区综合康复训练对慢性精神分裂症患者效果观察]. China Medicine and Pharmacy [中国医药科学] 2013, issue 17:79‐80,130.
Yang 2013 {published data only}
- Yang X, Guo LR 杨新, 郭丽蓉. Effects of community rehabilitation for patients with schizophrenia [精神分裂症患者社区康复训练的疗效观察]. China Journal of Pharmaceutical Economics [中国药物经济学] 2013, issue 04:412‐3.
Yao 2013 {published data only}
- Yao FJ, Wang ZM, Qin ZH 姚丰菊, 王志敏, 秦志华. The effect of case management on community rehabilitation of female patients with schizophrenia [个案管理对社区女性精神分裂症患者康复的影响]. China Medicine and Pharmacy [中国医药科学] 2013, issue 15:13‐5.
Yao 2014 {published data only}
- Yao ZZ, Xu Q, Wu LF, Fu WZ, Lu Y, Zhao AP. Effects of day nursing care in community on social function of patients with chronic schizophrenia. Journal of Shanghai Jiaotong University (Medical Science) 2014;34:830‐5. [Google Scholar]
Yu 2011 {published data only}
- Yu X, Jia JD, Guo P, Zhang YH 余学, 贾金鼎, 郭平, 张艳华. Effects of community‐based comprehensive intervention on medicine consumption and social function in patients with schizophrenia [社区综合干预对分裂症患者药物消耗量和社会功能的影响]. Chinese Journal of Health Psychology [中国健康心理学杂志] 2011;19(07):772‐4. [Google Scholar]
Yuan 2013 {published data only}
- Yuan YF, Yu ZY, Shen JB 袁月芳, 俞智勇, 沈建斌. The impact of community case management on the rehabilitation quality for patients with schizophrenia [社区个案管理对精神分裂症患者康复质量的影响]. Nursing Journal of Chinese People's Liberation Army [解放军护理杂志] 2013, issue 09:35‐7.
- Zheng H, Chen SL, Tang AD, Zhou LJ, Ji WD 郑宏, 陈思路, 汤爱娣, 周路佳, 季卫东. The effects of comprehensive community service team for schizophrenia in community [综合服务团队对社区精神分裂症患者综合干预的研究]. China Journal of Health Psychology [中国健康心理学杂志] 2012, issue 11:1615‐7.
- Zheng H, Chen XL, Niu X, Huang JJ, Zhou LJ, Tang AD 郑宏, 陈思路, 牛昕, 黄嘉俊, 周路佳, 汤爱娣. Effects of comprehensive community interventions for families of schizophrenia patients [社区综合服务团队对精神分裂症患者家庭的干预效果分析]. Chinese General Practice [中国全科医学] 2013, issue 01:90‐2.
Zhang SY 2013 {published data only}
- Zhang SY, Zhang ZX, Dong CL 张淑云, 张仲霞, 董春玲. Effects of intensive family care for patients with chronic schizophrenia [对慢性精神分裂症患者加强家庭护理干预的效果分析]. Chinese Journal of Trauma and Disability Medicine [中国伤残医学] 2013, issue 02:170‐1.
Zhang YF 2012 {published data only}
- Zhang YF 张燕锋. The effect of active interview on the rehabilitation of schizopheria in community of Luoding City [罗定市社区主动访视对精神分裂症的康复研究]. Medical Innovation of China [中国医学创新] 2012, issue 12:138‐9.
Zhang YM 2013 {published data only}
- Zhang YM, Zhang ZW, Jiang LP, Zhao GX 张玉敏, 张振文, 蒋令朋, 赵桂霞. Effects of community comprehensive intervention on medication compliance and quality of life in patients with schizophrenia [社区综合干预对精神分裂症患者服药依从性和生活质量的影响]. China Medicine and Pharmacy [中国医药科学] 2013, issue 18:63‐64,84.
Zhao HM 2013 {published data only}
- Zhao HM, Li WX, He R 赵红梅, 李文秀, 何锐. The effect of community‐based rehabilitation for patients with schizophrenia [社区康复措施在康复期精神分裂症患者中的应用效果观察]. Hainan Medical Journal [海南医学] 2013, issue 06:836‐8.
Zhu 2009 {published data only}
- Zhu YX, Liu Y, Sun QX, Wang HS 朱玉星, 刘勇, 孙群星, 王宏升. Effects of psychologcial nursing care on cognition function of patients with schizophrenia [心理护理对慢性精神分裂症患者认知功能的影响]. China Practical Medical [中国实用医药] 2009;4(22):190‐2. [Google Scholar]
Zhu DP 2012 {published data only}
- Zhu DP 竹道平. Influence of family psychological interventions on the rehabilitation of schizophrenia patients [家庭心理干预对精神分裂症患者社区康复的影响]. China Practical Medical [中国实用医药] 2012, issue 15:240‐1.
References to studies awaiting assessment
Bonsack‐Switzerland {published data only}
- Bonsack C. Efficacy of Transitional Case Management Following Psychiatric Hospital Discharge. clinicaltrials.gov/ct2/show/record/NCT02258737 (first received 29 September 2014).
ChiCTR‐TRC‐13003407 {published data only}
- ChiCTR‐TRC‐13003407. Adaptation and assessment of the Family‐Based Assertive Community Treatment model for the treatment of schizophrenia in China: a randomized controlled trial. apps.who.int/trialsearch/Trial2.aspx?TrialID=ChiCTR‐TRC‐13003407 (first received 25 March 2013).
Dick‐UK 2000 {published data only}
- Dick P. Randomised controlled trial of a community rehab programme in the treatment of chronic functional psychosis. National Research Register 2000.
- Dick P. Randomised controlled trials of a community rehabilitation programme in the treatment of chronic functional psychosis. National Research Register 2001; Vol. 1.
Guo‐China 2003 {published data only}
- Guo H, Deng J, Li Z. The influence of the effect of community intervention with schizophrenics’ family background and relevant factors. Chinese Journal of Clinical Medicine Practice 2003;2(9):779‐84. [Google Scholar]
Kawanishi‐Japan 2014 {published data only}
- Kawanishi C, Aruga T, Ishizuka N, Yonemoto N, Otsuka K, Kamijo Y, et al. Assertive case management versus enhanced usual care for people with mental health problems who had attempted suicide and were admitted to hospital emergency departments in Japan (ACTION‐J): a multicentre, randomised controlled trial. Lancet Psychiatry 2014;1:193‐201. [DOI] [PubMed] [Google Scholar]
Kossobudzka‐Poland 2001 {published data only}
- Slupczynska‐Kossobudzka E, Boguszewska L, Wojtowitz S. Effectiveness of mobile community teams in four centers – a two‐year follow up study. Postępy Psychiatrii i Neurologii 2001;10:289‐99. [Google Scholar]
Li 2010 {published data only}
- Li SC, Lu ZS, Hu YW, Yang RX, Qin D, Ge XW, et al 李守春, 卢振胜, 胡雅伟, 杨瑞香, 秦东, 葛欣伟, et al. Influence of community comprehensive intervention on the quality of life in patients with chronic schizophrenia [社区综合干预对慢性精神分裂症患者生活质量的影响]. Journal of Clinical Psychiatry [临床精神医学杂志] 2010;20(1):46‐8. [Google Scholar]
Linszen‐Netherlands 2002 {published data only}
- Linszen D. Early and critical period intervention in first episode schizophrenia: relapse, chronicity, early stabilisation, predictors over 4 years and new research. Schizophrenia Research 2004;70(1):66. [Google Scholar]
- Linszen D, Wouters L, Dingemans P, Haan L, Nieman D. Early and 3‐year sustained intervention in first episode schizophrenia: relapse, stabilization and its predictors. Schizophrenia Research 2004;67(1):18. [Google Scholar]
- Linszen DH, Haan L, Dingemans P, Bruggen M, Hofstra N, Engelsdorp H, et al. Treatment reluctance in first episode schizophrenia: Lack of insight, non‐compliance and cannabis abuse predict bad outcome after eighteen months intervention. Schizophrenia Research 2003;60(1):325. [Google Scholar]
- Linszen DH, Dingemans PM. Sustained intervention in recent onset schizophrenia: three year results of a controlled clinical trial. Schizophrenia Research 2002;53(3 Suppl 1):14. [Google Scholar]
Manuel 2009 {published data only}
- Manuel JI. A longitudinal analysis of psychiatric medication adherence and provider continuity among individuals with co‐occurring disorders. Dissertation Abstracts International Section A: Humanities and Social Sciences 2009;69(10A):4126. [Google Scholar]
O'Donnell‐Australia 1999 {published data only}
- O'Donnell M, Parker G, Proberts M, Matthews R, Fisher D, Johnson B, et al. A study of client focused case management and consumer advocacy: the community and consumer service project. Australian and New Zealand Journal of Psychiatry 1999;33(5):684‐93. [PUBMED: 10544992] [DOI] [PubMed] [Google Scholar]
Rivera‐New York 2007 {published data only}
- Rivera JJ, Sullivan AM, Valenti SS. Adding consumer‐providers to Intensive Case Management: does it improve outcome?. Psychiatric Services 2007;58(6):802‐9. [PUBMED: 17535940] [DOI] [PubMed] [Google Scholar]
Ruggeri‐Italy {published data only}
- Ruggeri M, Bonetto C, Lasalvia A, Girolamo G, Fioritti A, Rucci P, et al. A multi‐element psychosocial intervention for early psychosis (get up piano trial) conducted in a catchment area of 10 million inhabitants: study protocol for a pragmatic cluster randomized controlled trial. Trials 2012;13:73. [DOI: 10.1186/1745-6215-13-73; PUBMED: 22647399] [DOI] [PMC free article] [PubMed] [Google Scholar]
Sells‐Connecticut 2006 {published data only}
- Sells D, Black R, Davidson L, Rowe M. Beyond generic support: incidence and impact of invalidation in peer services for clients with severe mental illness. Psychiatric Services 2008;59(11):1322‐7. [DOI] [PubMed] [Google Scholar]
- Sells D, Davidson L, Jewell C, Falzer P, Rowe M. The treatment relationship in peer‐based and regular case management for clients with severe mental illness. Psychiatric Services 2006;57(8):1179‐84. [PUBMED: 16870970] [DOI] [PubMed] [Google Scholar]
Sharifi‐Iran 2009 {published data only}
- Sharifi V, Amini H, Tehranidoost M, Yunesian M, Jalali‐Roudsari M, Sobhebidari P, et al. A randomized trial of a home aftercare service for patients with severe mental disorders in Iran. World Psychiatry 2009;8(Suppl 1):P03.175. [Google Scholar]
Su‐China 2008 {published data only}
- Su M, Wang CQ, Lin LX [苏勉, 王彩琴, 凌礼雄]. The effect of community intervention on the quality of life in patients with schizophrenia [社区干预对精神分裂症患者生活质量的影响]. Journal of Tropical Medicine [热带医学杂志] 2008;8(2):138, 147‐9. [Google Scholar]
Tan‐China 2005 {published data only}
- Tan B, He YF, Xiang EP. The observation of cure effects and medical expenses of community rehabilitation on schizophrenia. Journal of Hubei Institute for Nationalities Medical Edition 2005;22(2):31‐3. [Google Scholar]
- Tan B, Xiang EP, He YF. Effect of community prevention and treatment in patients with schizophrenia and their family economic burden. Chinese Journal of Clinical Rehabilitation 2005;9(28):24‐6. [Google Scholar]
Verhaegh‐Netherlands 2006 {published data only}
- Verhaegh MJ, Bongers IM, Kroon H, Garretsen HF. Assertive Community Treatment for patients with a first episode psychosis. Model fidelity and specific adaptations for particular target groups [Assertive Community Treatment bij patienten met een eerste psychose. Modelgetrouwheid en doelgroepspecifieke aanpassingen]. Tijdschrift voor Psychiatrie 2007;49(11):789‐98. [PUBMED: 17994498] [PubMed] [Google Scholar]
- Verhaegh MJ, Bongers IM, Kroon H, Garretsen HF. Model fidelity of assertive community treatment for clients with first‐episode psychosis: a target group‐specific application. Community Mental Health Journal 2009;45(1):12‐8. [PUBMED: 18925435] [DOI] [PubMed] [Google Scholar]
- Verhaegh MJM. Researching the effect of Assertive Community Treatment (ACT) for first episode psychosis: the use of peer‐interviewers in a quasi‐experimental study. Schizophrenia Research 2006;86(Suppl 1):S170. [Google Scholar]
Wang 2009 {published data only}
- Wang YH, Tang JS, Chai XS, Zheng CQ, Zhang JX, Weng Z 王延祜, 唐济生, 柴新生, 郑崇泉, 张敬悬, 翁正. The effects of comprehensive intervention on social rehabilitation in patients with schizophrenia [社区综合干预对精神分裂症患者社会康复效果的对照研究]. Shandong Archives of Psychiatry [山东精神医学] 2009; Vol. 22, issue 4:244‐6.
Zhang 2009 {published data only}
- Zhang HZ, Jin XX 张海杰, 靳新霞. Effects of community intervention on social function and quality of life in patients with schizophrenia [社区干预对精神分裂症患者社会功能及生存质量的影响]. Shandong Archives of Psychiatry [山东精神医学] 2009;22(5):368‐70. [Google Scholar]
Zoeteman‐Netherlands {published data only}
- Zoeteman JB. Assertive community treatment (ACT) versus case management in treating homeless patients with severe mental illness; a randomized controlled trial. apps.who.int/trialsearch/Trial2.aspx?TrialID=NTR896 (first received 10 November 2006).
References to ongoing studies
Koike‐Japan {published data only}
- Nishida A, Koike S, Yamasaki S, Ando S, Nakamura T, Harima H, et al. Comprehensive early intervention for patients with first‐episode psychosis in Japan (J‐CAP): study protocol for a randomised controlled trial. apps.who.int/trialsearch/Trial2.aspx?TrialID=JPRN‐UMIN000005092 (first received 15 February 2011). [DOI] [PMC free article] [PubMed]
Lutgens 2015 {published data only}
- Lutgens D, Iyer S, Joober R, Brown TG, Norman R, Latimer E, et al. A five‐year randomized parallel and blinded clinical trial of an extended specialized early intervention vs. regular care in the early phase of psychotic disorders: study protocol. BMC Psychiatry 2015 Feb 14;15:22. [DOI] [PMC free article] [PubMed] [Google Scholar]
Malla‐Canada {published data only}
- Malla A, Norman R, Iyer S, Joober R, Brown T, Schmitz N, et al. Extending specialized early intervention service from 2 to 5 years: a randomized controlled trial. Eighth International Conference on Early Psychosis; 2012 Oct 11–13; San Francisco. 2012.
- Rondeau MC, Rho A, Iyer S, Joober R, Schmitz N, Latimer E, et al. A randomized controlled evaluation of 'extended specialized early intervention service' vs. 'regular care' for long‐term management of early psychosis. Early Intervention in Psychiatry 2012;6:72. [Google Scholar]
NCT01313052 {published data only}
- NCT01313052. Forensic assertive community treatment: an emerging model of service delivery. clinicaltrials.gov/ct2/show/NCT01313052 (first received 8 March 2011).
RISE ‐ Ethiopia {published data only}
- NCT02160249. RISE (Rehabilitation Intervention for People With Schizophrenia in Ethiopia): a cluster‐randomised trial. clinicaltrials.gov/ct2/show/NCT02160249 (first received 3 June 2014).
Walsh‐Connecticut {published data only}
- Walsh B, Srihari VH, Woods S. Randomized trial of usual care versus specialized, phase‐specific care in the public sector for first episode psychosis. clinicaltrials.gov/ct2/show/NCT00309452 (first received 29 March 2006).
Additional references
Altman 1996
- Altman DG, Bland JM. Detecting skewness from summary information. BMJ 1996;313(7066):1200. [PUBMED: 8916759] [DOI] [PMC free article] [PubMed] [Google Scholar]
Andreasen 1982
- Andreasen NC. Negative symptoms in schizophrenia. Archives of General Psychiatry 1982;39:784‐8. [DOI] [PubMed] [Google Scholar]
Andreasen 1984
- Andreasen NC. Scale for the Assessment of Positive Symptoms (SAPS). Iowa City: University of Iowa, 1984. [Google Scholar]
Andreasen 1989
- Andreasen N. Scale for the Assessment of Negative Symptoms (SANS). British Journal of Psychiatry 1989;7:53‐8. [PubMed] [Google Scholar]
APA 1987
- American Psychiatric Association. Diagnostic and Statistical Manual of Mental Disorders. 3rd Edition. Washington, DC: American Psychiatric Association, 1987. [Google Scholar]
APA 1994
- American Psychiatric Association. Diagnostic and Statistical Manual of Mental Disorders. 4th Edition. Washington, DC: American Psychiatric Association, 1994. [Google Scholar]
Asberg 1978
- Asberg M, Montgomery SA, Perris C, Schalling D, Sedvall G. A comprehensive psychopathological rating scale. Acta Psychiatrica Scandinavica 1978;271:5‐27. [DOI] [PubMed] [Google Scholar]
Baker 1983
- Baker R, Hall J. REHAB: A new assessment instrument for chronic psychiatric patients. Schizophrenia Bulletin 1988;14(1):97‐111. [DOI] [PubMed] [Google Scholar]
Beck 1979
- Beck A, Rush A, Shaw B, Emery G. Cognitive Therapy of Depression. New York: Guilford Press, 1979. [Google Scholar]
Bland 1997
- Bland JM. Statistics notes. Trials randomised in clusters. BMJ 1997;315:600. [DOI] [PMC free article] [PubMed] [Google Scholar]
Boissel 1999
- Boissel JP, Cucherat M, Li W, Chatellier G, Gueyffier F, Buyse M, et al. The problem of therapeutic efficacy indices. 3. Comparison of the indices and their use [Apercu sur la problematique des indices d'efficacite therapeutique, 3: comparaison des indices et utilisation. Groupe d'Etude des Indices D'efficacite.]. Therapie 1999;54(4):405‐11. [PUBMED: 10667106] [PubMed] [Google Scholar]
Bond 2015
- Bond GR, Drake RE. The critical ingredients of assertive community treatment. World Psychiatry: Official Journal of the World Psychiatric Association (WPA) 2015;14(2):240‐2. [PUBMED: 26043344] [DOI] [PMC free article] [PubMed] [Google Scholar]
Brewer 2015
- Brewer WJ, Lambert TJ, Witt K, Dileo J, Duff C, Crlenjak C, et al. Intensive case management for high‐risk patients with first‐episode psychosis: service model and outcomes. Lancet Psychiatry 2015;2(1):29‐37. [PUBMED: 26359610] [DOI] [PubMed] [Google Scholar]
Burns 2001
- Burns T, Knapp M, Catty J, Healey A, Henderson J, Watt H, et al. Home treatment for mental health problems: a systematic review. Health Technology Assessment 2001;5(15):1‐139. [PUBMED: 11532236] [DOI] [PubMed] [Google Scholar]
Burns 2008
Burns 2009
- Burns T. End of the road for treatment‐as‐usual studies?. British Journal of Psychiatry 2009;195(1):5‐6. [PUBMED: 19567887] [DOI] [PubMed] [Google Scholar]
Burns 2010
- Burns T. The rise and fall of assertive community treatment?. International Review of Psychiatry (Abingdon, England) 2010;22(2):130‐7. [PUBMED: 20504053] [DOI] [PubMed] [Google Scholar]
Burns 2012
- Burns T. Newer is not automatically better. Psychiatrist 2012;36:477. [Google Scholar]
Catty 2002
- Catty J, Burns T, Knapp M, Watt H, Wright C, Henderson J, et al. Home treatment for mental health problems: a systematic review. Psychological Medicine 2002;32(3):383‐401. [PUBMED: 11989985] [DOI] [PubMed] [Google Scholar]
Coldwell 2007
- Coldwell CM, Bender WS. The effectiveness of assertive community treatment for homeless populations with severe mental illness: a meta‐analysis. American Journal of Psychiatry 2007;164(3):393‐9. [PUBMED: 17329462] [DOI] [PubMed] [Google Scholar]
Deeks 2000
- Deeks J. Issues in the selection for meta‐analyses of binary data. Eighth International Cochrane Colloquium; 2000 Oct 25‐28; Cape Town. Cape Town: The Cochrane Collaboration, 2000.
Department of Health 1990
- Department of Health. Community Care in the Next Decade and Beyond. London: HMSO, 1990. [Google Scholar]
Department of Health 1999
- Department of Health. National Service Framework for Mental Health. London: DH, 1999. [Google Scholar]
Derogatis 1974
- Derogatis LR, Lipman RS, Rickels K, Uhlenhuth EH, Covi L. The Hopkins Symptom Checklist (HSCL): a self‐report symptom inventory. Behavioral Science 1974;19(1):1‐15. [DOI] [PubMed] [Google Scholar]
Derogatis 1983
- Derogatis LR, Melisaratos N. The Brief Symptom Inventory: an introductory report. Psychological Medicine 1983;13:595‐605. [PubMed] [Google Scholar]
Divine 1992
- Divine GW, Brown JT, Frazier LM. The unit of analysis error in studies about physicians' patient care behavior. Journal of General Internal Medicine 1992;7(6):623‐9. [DOI] [PubMed] [Google Scholar]
Donner 2002
- Donner A, Klar N. Issues in the meta‐analysis of cluster randomized trials. Statistics in Medicine 2002;21:2971‐80. [DOI] [PubMed] [Google Scholar]
Drake 1996
- Drake RE, Mueser KT, McHugo GJ. Clinician rating scales: Alcohol Use Scale (AUS), Drug Use Scale (DUS), and Substance Abuse Treatment Scale (SATS). In: Sederer LI, Dickey B editor(s). Outcomes Assessment in Clinical Practice. Baltimore: Williams and Wilkins, 1996. [Google Scholar]
Drukker 2008
- Drukker M, Maarschalkerweerd M, Bak M, Driessen G, a Campo J, Bie A, et al. A real‐life observational study of the effectiveness of FACT in a Dutch mental health region. BMC Psychiatry 2008;8:93. [PUBMED: 19055813] [DOI] [PMC free article] [PubMed] [Google Scholar]
Egger 1997
- Egger M, Davey‐Smith G, Schneider M, Minder CSO. Bias in meta‐analysis detected by a simple, graphical test. BMJ 1997;13:629‐34. [DOI] [PMC free article] [PubMed] [Google Scholar]
Elbourne 2002
- Elbourne D, Altman DG, Higgins JPT, Curtina F, Worthingtond HV, Vaile A. Meta‐analyses involving cross‐over trials: methodological issues. International Journal of Epidemiology 2002;31(1):140‐9. [DOI] [PubMed] [Google Scholar]
Endicott 1976
- Endicott J, Spitzer RL, Fleiss JL, Cohen J. The global assessment scale. A procedure for measuring overall severity of psychiatric disturbance. Archives of General Psychiatry 1976;33(6):766‐71. [PUBMED: 938196] [DOI] [PubMed] [Google Scholar]
Endicott 1978
- Endicott J, Spitzer RL. A diagnostic interview: the schedule for affective disorders and schizophrenia. Archives of General Psychiatry 1978;35(7):837‐44. [PUBMED: 678037] [DOI] [PubMed] [Google Scholar]
Fekete 1998
- Fekete DM, Bond GR, McDonel EC, Salyers MP, Chen A, Miller L. Rural assertive community treatment: a field experiment. Psychiatric Rehabilitation Journal 1998;21(4):371. [Google Scholar]
Finnerty 2015
- Finnerty MT, Manuel JI, Tochterman AZ, Stellato C, Fraser LH, Reber CA, et al. Clinicians' perceptions of challenges and strategies of transition from assertive community treatment to less intensive services. Community Mental Health Journal 2015;51(1):85‐95. [PUBMED: 24526472] [DOI] [PMC free article] [PubMed] [Google Scholar]
First 1997
- First MB, Spitzer RL, Gibbon M, Williams JBW. Structured Clinical Interview for DSM‐IV Axis I Disorders (SCID). Washington, DC: American Psychiatric Press, 1997. [Google Scholar]
Gerber 1999
- Gerber GJ, Prince PN. Measuring client satisfaction with assertive community treatment. Psychiatric Services 1999;50(4):546‐50. [PUBMED: 10211738] [DOI] [PubMed] [Google Scholar]
Gilburt 2012
- Gilburt H, Burns T, Copello A, Coulton S, Crawford M, Day E, et al. Assertive Community Treatment for alcohol dependence (ACTAD): study protocol for a randomised controlled trial. Trials 2012;13:19. [PUBMED: 22348423] [DOI] [PMC free article] [PubMed] [Google Scholar]
Glover 2006
- Glover G, Arts G, Babu KS. Crisis resolution/home treatment teams and psychiatric admission rates in England. British Journal of Psychiatry 2006;189:441‐5. [PUBMED: 17077435] [DOI] [PubMed] [Google Scholar]
Green 1987
- Green RS, Gracely EJ. Selecting a rating scale for evaluating services to the chronically mentally ill. Community Mental Health Journal 1987;23(2):91‐102. [PUBMED: 3652669] [DOI] [PubMed] [Google Scholar]
Gulliford 1999
- Gulliford MC. Components of variance and intraclass correlations for the design of community‐based surveys and intervention studies: data from the Health Survey for England 1994. American Journal of Epidemiology 1999;149:876‐83. [DOI] [PubMed] [Google Scholar]
Henderson 1980
- Henderson S, Duncan‐Jones P, Byrne DG, Scott R. Measuring social relationships. The Interview Schedule for Social Interaction. Psychological Medicine 1980;10(4):723‐34. [PUBMED: 7208730] [DOI] [PubMed] [Google Scholar]
Higgins 2003
- Higgins JP, Thompson SG, Deeks JJ, Altman DG. Measuring inconsistency in meta‐analyses. BMJ 2003;327:557‐60. [DOI] [PMC free article] [PubMed] [Google Scholar]
Higgins 2011
- Higgins JP, Green S, editor(s). Cochrane Handbook for Systematic Reviews of Interventions Version 5.1.0 (updated March 2011). The Cochrane Collaboration, 2011. Available from handbook.cochrane.org.
Holloway 1991
- Holloway F. Case management for the mentally ill: looking at the evidence. International Journal of Social Psychiatry 1991;37:2‐13. [DOI] [PubMed] [Google Scholar]
Holloway 1995
- Holloway F. Home treatment as an alternative to hospital admission. In: Tyrer P, Creed F editor(s). Community Psychiatry in Action. Cambridge: Cambridge University Press, 1995. [Google Scholar]
Intagliata 1982
- Intagliata J. Improving the quality of community care for the chronically mentally disabled: the role of case management. Schizophrenia Bulletin 1982;8:655‐74. [DOI] [PubMed] [Google Scholar]
Johnson 2008
- Johnson S. So what shall we do about assertive community treatment?. Epidemiologia e Psichiatria Sociale 2008; Vol. 17, issue 2:110‐4. [PUBMED: 18589625] [PubMed]
Kay 1986
- Kay SR, Opler LA, Fiszbein A. Positive and Negative Syndrome Scale (PANSS) Manual. North Tonawanda, NY: Multi‐Health Systems, 1986. [Google Scholar]
Killaspy 2008
- Killaspy H, Johnson S, King M, Bebbington P. Developing mental health services in response to research evidence. Epidemiologia e Psichiatria Sociale 2008;17(1):47‐56. [PUBMED: 18444458] [PubMed] [Google Scholar]
Killaspy 2012
- Killaspy H. Importance of specialisation in psychiatric services (commentary on): How did we let it come to this?. Psychiatrist 2012;36:364–5. [Google Scholar]
Kirk 2013
- Kirk TA, Leo P, Rehmer P, Moy S, Davidson L. A case and care management program to reduce use of acute care by clients with substance use disorders. Psychiatric Services (Washington, DC) 2013;64(5):491‐3. [PUBMED: 23632578] [DOI] [PubMed] [Google Scholar]
Krawiecka 1977
- Krawiecka M, Goldberg D, Vaughan M. A standardized psychiatric assessment scale for rating chronic psychotic patients. Acta Psychiatrica Scandinavica 1977;55(4):299‐308. [PUBMED: 855676] [DOI] [PubMed] [Google Scholar]
Larsen 1979
- Larsen DL, Attkisson CC, Hargreaves WA, Nguyen TD. Assessment of client/patient satisfaction: development of a general scale. Evaluation and Programme Planning 1979;2(3):197‐207. [PUBMED: 10245370] [DOI] [PubMed] [Google Scholar]
Lehman 1983
- Lehman A. The well being of chronic mental patients: assessing their quality of life. Archives of General Psychiatry 1983;40:369‐73. [DOI] [PubMed] [Google Scholar]
Lehman 1988
- Lehman AF. A quality of life interview for the chronically mentally ill. Evaluation and Programme Planning 1988;11:51‐62. [Google Scholar]
Lehman 1993
- Lehman AF, Postrado LT, Rachuba LT. Convergent validation of quality of life assessments for persons with severe mental illnesses. Quality of Life Research 1993;2(5):327‐33. [PUBMED: 8136797] [DOI] [PubMed] [Google Scholar]
Leucht 2005a
- Leucht S, Kane JM, Kissling W, Hamann J, Etschel E, Engel RR. What does the PANSS mean?. Schizophrenia Research 2005;79(2‐3):231‐8. [PUBMED: 15982856] [DOI] [PubMed] [Google Scholar]
Leucht 2005b
- Leucht S, Kane JM, Kissling W, Hamann J, Etschel E, Engel R. Clinical implications of Brief Psychiatric Rating Scale scores. British Journal of Psychiatry 2005;187:366‐71. [PUBMED: 16199797] [DOI] [PubMed] [Google Scholar]
Low 2013
- Low L, Tan YY, Lim BL, Poon WC, Lee C. Effectiveness of assertive community management in Singapore. Annals of the Academy of Medicine, Singapore 2013;42(3):125‐32. [PUBMED: 23604501] [PubMed] [Google Scholar]
Malone 2007
- Malone D, Newron‐Howes G, Simmonds S, Marriot S, Tyrer P. Community mental health teams (CMHTs) for people with severe mental illnesses and disordered personality. Cochrane Database of Systematic Reviews 2007, Issue 3. [DOI: 10.1002/14651858.CD000270.pub2] [DOI] [PMC free article] [PubMed] [Google Scholar]
Marshall 2000
- Marshall M, Lockwood A, Bradley C, Adams C, Joy C, Fenton M. Unpublished rating scales: a major source of bias in randomised controlled trials of treatments for schizophrenia. British Journal of Psychiatry 2000;176:249‐52. [DOI] [PubMed] [Google Scholar]
Marshall 2008
- Marshall M. What have we learnt from 40 years of research on Intensive Case Management?. Epidemiologia e Psichiatria Sociale 2008; Vol. 17, issue 2:106‐9. [PUBMED: 18589624] [PubMed]
McGrew 1994
- McGrew JH, Bond GR, Dietzen L, Salyers M. Measuring the fidelity of implementation of a mental health programme model. Journal of Consulting and Clinical Psychology 1994;62(4):670‐8. [PUBMED: 7962870] [DOI] [PubMed] [Google Scholar]
McGrew 1995
- McGrew JH, Bond GR. Critical ingredients of assertive community treatment: judgements of the experts. Journal of Mental Health Administration 1995;22:113‐25. [DOI] [PubMed] [Google Scholar]
McGuffin 1991
- McGuffin P, Farmer A, Harvey I. A polydiagnostic application of operational criteria in studies of psychotic illness: development and reliability of the OPCRIT system. Archives General Psychiatry 1991;48:764–70. [DOI] [PubMed] [Google Scholar]
McHugo 1995
- McHugo GJ, Drake RE, Burton HL, Ackerson TH. A scale for assessing the stage of substance abuse treatment in persons with severe mental illness. Journal of Nervous and Mental Disease 1995;183(12):762‐7. [PUBMED: 8522938] [DOI] [PubMed] [Google Scholar]
Mueser 1995
- Mueser KT, Drake RE, Clark RE, McHugo GJ, Mercer‐McFadden C, Ackerson TH. Evaluating Substance Abuse in Persons with Severe Mental Illness. Cambridge: MA: Human Services Research Institute, 1995. [Google Scholar]
Murray 1996
- Murray CL, Lopez AD. The Global Burden of Disease. Cambridge: Harvard University Press, 1996. [Google Scholar]
National Institute of Mental Health 1987
- National Institute of Mental Health. Towards a Model for a Comprehensive, Community‐Based Mental Health System. Washington, DC: NIMH, 1987. [Google Scholar]
Nishio 2014
- Nishio M, Sono T, Ishiguro T, Horiuchi K, Ambo H. How many Assertive Community Treatment Teams are needed in Japan? Estimate from Need Survey in Sendai City. Clinical Practice and Epidemiology in Mental Health 2014;10:184‐90. [DOI] [PMC free article] [PubMed] [Google Scholar]
Olfson 1990
- Olfson M. Assertive community treatment: an evaluation of the experimental evidence. Hospital and Community Psychiatry 1990;41:634‐41. [DOI] [PubMed] [Google Scholar]
Oliver 1996
- Oliver J, Huxley P, Bridges K, Mohammed H. Quality of Life and Mental Health Services. London: Routledge, 1996. [Google Scholar]
Oliver 1997
- Oliver JP, Huxley PJ, Priebe S, Kaiser W. Measuring the quality of life of severely mentally ill people using the Lancashire quality of life profile. Social Psychiatry and Psychiatric Epidemiology 1997;32(2):76‐83. [PUBMED: 9050348] [DOI] [PubMed] [Google Scholar]
Overall 1962
- Overall JE, Gorham DR. The brief psychiatric rating scale. Psychological Reports 1962;10:799‐812. [Google Scholar]
Parker 1992
- Parker G, Rosen A, Emdur N, Hadzi‐Pavlovic D. The life skills profile: psychometric properties of a measure assessing function and disability in schizophrenia. Acta Psychiatrica Scandinavica 1992;83:145‐52. [DOI] [PubMed] [Google Scholar]
Pettersen 2014
- Pettersen H, Ruud T, Ravndal E, Havnes I, Landheim A. Engagement in assertive community treatment as experienced by recovering clients with severe mental illness and concurrent substance use. International Journal of Mental Health Systems 2014;8(1):40. [PUBMED: 25389446] [DOI] [PMC free article] [PubMed] [Google Scholar]
Phelan 1993
- Phelan M, Slade M, Dunn G, Holloway G, Strathdee G, Thornicroft G, et al. Camberwell Assessment of Need. London: London Institute of Psychiatry, 1993. [Google Scholar]
Phelan 1995
- Phelan M, Slade M, Thornicroft G, Dunn G, Holloway F, Wykes T, et al. The Camberwell Assessment of Need: the validity and reliability of an instrument to assess the needs of people with severe mental illness. British Journal of Psychiatry 1995;167(5):589‐95. [PUBMED: 8564313] [DOI] [PubMed] [Google Scholar]
Priebe 1999
- Priebe S, Huxley P, Knight S, Evans S. Application and results of the Manchester Short Assessment of Quality of Life (MANSA). International Journal of Social Psychiatry 1999;45(1):7‐12. [PUBMED: 10443245] [DOI] [PubMed] [Google Scholar]
R 2008 [Computer program]
- R Development Core Team, R Foundation for Statistical Computing. R: A language and environment for statistical computing. Available from www.R‐project.org. Vienna: R Development Core Team, R Foundation for Statistical Computing, 2008.
Risser 1975
- Risser NL. Development of an instrument to measure patient satisfaction with nurses and nursing care in primary care settings. Nursing Research 1975;24(1):45‐52. [PUBMED: 1038021] [PubMed] [Google Scholar]
Rosen 1989
- Rosen A, Hadzi‐Pavlovic D, Parker G. The life skills profile: a measure assessing function and disability in schizophrenia. Schizophrenia Bulletin 1989;15(2):325‐37. [PUBMED: 2749191] [DOI] [PubMed] [Google Scholar]
Rosen 2013
- Rosen A, Stein L, McGorry P, Harvey C, Birchwood M, Diamond R. Specialist community teams backed by years of quality research. Psychiatrist 2013;37:38. [Google Scholar]
Rosenberg 1998
- Rosenberg SD, Drake RE, Wolford GL, Mueser KT, Oxman TE, Vidaver RM, et al. Dartmouth Assessment of Lifestyle Instrument (DALI): a substance use disorder screen for people with severe mental illness. American Journal of Psychiatry 1998;155:232–8. [DOI] [PubMed] [Google Scholar]
Rubin 1992
- Rubin A. Is case management effective for people with serious mental illness? A research review. Health and Social Work 1992;17:138‐50. [DOI] [PubMed] [Google Scholar]
Ruggeri 2000
- Ruggeri M, Leese M, Thornicroft G, Bisoffi G, Tansella M. Definition and prevalence of severe and persistent mental illness. British Journal of Psychiatry 2000;177:149‐55. [PUBMED: 11026955] [DOI] [PubMed] [Google Scholar]
Ruggeri 2008
- Ruggeri M, Tansella M. Case management or assertive community treatment: are they really alternative approaches?. Epidemiologia e Psichiatria Sociale 2008; Vol. 17, issue 2:93‐8. [PUBMED: 18589622] [PubMed]
Schinnar 1990
- Schinnar AP, Rothbard AB, Kanter R, Jung YS. An empirical literature review of definitions of severe and persistent mental illness. American Journal of Psychiatry 1990;147(12):1602‐8. [PUBMED: 2244636] [DOI] [PubMed] [Google Scholar]
Schneider 1983
- Schneider, Leonard C, Struening EL. SLOF: a behavioral rating scale for assessing the mentally ill. Social Work Research and Abstracts 1983;19(3):9‐21. [DOI] [PubMed] [Google Scholar]
Schooler 1979
- Schooler N, Weissman M, Hogarty G. Social adjustment scale for schizophrenics. In: Hargreaves W editor(s). Resource Material for Community Mental Health Program Evaluators. Rockville, MD: National Institute of Mental Health, 1979. [Google Scholar]
Scott 1995
- Scott JE, Dixon LB. Assertive community treatment and case management for schizophrenia. Schizophrenia Bulletin 1995;21:657‐67. [DOI] [PubMed] [Google Scholar]
Shern 1994
- Shern DL, Wilson NZ, Coen AS, Patrick DC, Foster M, Bartsch DA. Client outcomes II: longitudinal client data from the Colorado treatment outcome study. Milbank Quarterly 1994;72:123‐48. [PubMed] [Google Scholar]
Slade 1997
- Slade M, Powell R, Strathdee G. Current approaches to identifying the severely mentally ill. Social Psychiatry and Psychiatric Epidemiology 1997;32(4):177‐84. [PUBMED: 9184462] [DOI] [PubMed] [Google Scholar]
Slade 1999
- Slade M, Thornicroft G, Loftus L, Phelan M, Wykes T. The Camberwell Assessment of Need (CAN). London: Gaskell, 1999. [Google Scholar]
Sobell 1980
- Sobell MB, Maisto SA, Sobell LC, Cooper AM, Cooper T, Sanders B. Developing a prototype for evaluating alcohol treatment effectiveness. Evaluating Alcohol and Drug Abuse Treatment Effectiveness. New York: Pergamon, 1980:129‐50. [Google Scholar]
Solomon 1992
- Solomon P. The efficacy of case management services for severely mentally disabled clients. Community Mental Health Journal 1992;28:163‐80. [DOI] [PubMed] [Google Scholar]
Spitzer 1978
- Spitzer RL, Endicott J, Robins E. Research diagnostic criteria: rationale and reliability. Archives of General Psychiatry 1978;35(6):773‐82. [PUBMED: 655775] [DOI] [PubMed] [Google Scholar]
Stein 1980
- Stein LI, Test MA. Alternative to mental hospital treatment. I. Conceptual model, treatment programme, and clinical evaluation. Archives of General Psychiatry 1980;37(4):392‐7. [PUBMED: 7362425] [DOI] [PubMed] [Google Scholar]
Stein 1999
- Stein GS. Usefulness of the health of the nation outcome scales. British Journal of Psychiatry 1999;174:375‐7. [PUBMED: 10616599] [DOI] [PubMed] [Google Scholar]
Strauss 1972
- Strauss JS, Carpenter WT Jr. The prediction of outcome in schizophrenia. I. Characteristics of outcome. Archives of General Psychiatry 1972;27(6):739‐46. [PUBMED: 4637891] [DOI] [PubMed] [Google Scholar]
Strauss 1974
- Strauss JS, Carpenter WT Jr. The prediction of outcome in schizophrenia. II. Relationships between predictor and outcome variables: a report from the WHO international pilot study of schizophrenia. Archives of General Psychiatry 1974;31(1):37‐42. [PUBMED: 4835985] [DOI] [PubMed] [Google Scholar]
Thompson 1990
- Thompson KS, Griffity EEH, Leaf PJ. A historical review of the Madison Model of community care. Hospital and Community Psychiatry 1990;41:625‐34. [DOI] [PubMed] [Google Scholar]
Tyrer 1979
- Tyrer PJ, Remington M. Controlled comparison of day‐hospital and outpatient treatment for neurotic disorders. Lancet 1979;1(8124):1014‐6. [PUBMED: 86727] [DOI] [PubMed] [Google Scholar]
Tyrer 1990
- Tyrer P. Personality disorder and social functioning. In: Peck DF, Shapiro CM editor(s). Measuring Human Problems: A Practical Guide. Chichester: John Wiley, 1990:119‐42. [Google Scholar]
Tyrer 2005
- Tyrer P, Nur U, Crawford M, Karlsen S, McLean C, Rao B, et al. The social functioning questionnaire: a rapid and robust measure of perceived functioning. International Journal of Social Psychiatry 2005;51(3):265‐75. [PUBMED: 16252794] [PubMed] [Google Scholar]
Ukoumunne 1999
- Ukoumunne OC, Gulliford MC, Chinn S, Sterne JAC, Burney PGJ. Methods for evaluating area‐wide and organisation‐based intervention in health and health care: a systematic review. Health Technology Assessment 1999;3(5):1‐75. [PubMed] [Google Scholar]
Unden 1989
- Unden AL, Orth‐Gomer K. Development of a social support instrument for use in population surveys. Social Science & Medicine 1989;29(12):1387‐92. [PUBMED: 2629121] [DOI] [PubMed] [Google Scholar]
Velligan 2005
- Velligan D, Prihoda T, Dennehy E, Biggs M, Shores‐Wilson K, Crismon L, et al. Brief psychiatric rating scale expanded version: how do new items affect factor structure?. Psychiatry Research 2005;135:217–28. [DOI] [PubMed] [Google Scholar]
Warner 1995
- Warner R, Girolamo G. Epidemiology of Mental Disorders and Psychosocial Problems. Schizophrenia. Geneva: World Health Organization, 1995. [Google Scholar]
Weiden 1994
- Weiden P, Rapkin B, Mott T, Zygmunt A, Goldman D, Horvitz‐Lennon M, et al. Rating of medication influences (ROMI) scale in schizophrenia. Schizophrenia Bulletin 1994;20(2):297‐310. [PUBMED: 7916162] [DOI] [PubMed] [Google Scholar]
Weissman 1971
- Weissman MM, Paykel ES, Siegel R, Klerman GL. The social role performance of depressed women: comparisons with a normal group. American Journal of Orthopsychiatry 1971;41:390‐405. [DOI] [PubMed] [Google Scholar]
Weissman 1974
- Weissman MM, Klerman GL, Paykel ES, Prusoff B, Hanson B. Treatment effects on the social adjustment of depressed patients. Archives of General Psychiatry 1974;30(6):771‐8. [PUBMED: 4832185] [DOI] [PubMed] [Google Scholar]
WHO 1992
- World Health Organization. International Statistical Classification of Diseases and Related Health Problems (ICD‐10). Geneva: WHO, 1992. [Google Scholar]
WHO 1998
- World Health Organization, Division of Mental Health. Schedule for Clinical Assessment in Neuropsychiatry, Version 2.1. Present State Examination. Geneva: WHO, 1998. [Google Scholar]
WHO 2001
- World Health Organization. Mental Health: New Understanding, New Hope. Geneva: WHO, 2001. [Google Scholar]
WHO 2001a
- World Health Organization. Disability Assessment Schedule. Geneva: WHO, 2001. [Google Scholar]
Wing 1974
- Wing J, Cooper JE, Sartorius N. The Description and Classification of Psychiatric Symptoms: An Instruction Manual for the PSE and Catego System. Cambridge: Cambridge University Press, 1974. [Google Scholar]
Wing 1998
- Wing JK, Beevor AS, Curtis RH, Park SB, Hadden S, Burns A. Health of the Nation Outcome Scales (HoNOS). Research and development. British Journal of Psychiatry 1998;172:11‐8. [PUBMED: 9534825] [DOI] [PubMed] [Google Scholar]
Witheridge 1982
- Witheridge TF, Dincin J, Appleby L. Working with the most frequent recidivists: a total team approach to assertive resource management. Psychosocial Rehabilitation Journal 1982;5:9‐11. [Google Scholar]
Witheridge 1991
- Witheridge TF. The "active ingredients" of assertive outreach. In: Cohen NL editor(s). Psychiatric Outreach to the Mentally Ill (New Directions for Mental Health Services, No. 52). San Francisco: Jossey‐Bass, 1991:47‐64. [PubMed] [Google Scholar]
Wykes 1986
- Wykes T, Sturt E. The measurement of social behaviour in psychiatric patients: an assessment of the reliability and validity of the SBS schedule. British Journal of Psychiatry 1986;148:1‐11. [PUBMED: 3082403] [DOI] [PubMed] [Google Scholar]
Xia 2007
- Xia J, Adams CE, Bhagat N, Bhagat V, Bhoopathi P, El‐Sayeh H, et al. The Leeds Outcomes Stakeholders Survey (LOSS) Study. 15th Cochrane Colloquium; 2007 Oct 23‐27; Sao Paulo. The Cochrane Collaboration, 2007.
Xia 2009
- Xia J, Adams CE, Bhagat N, Bhagat V, Bhoopathi P, El‐Sayeh H, et al. Loss to outcomes stakeholder survey: the LOSS study. Psychiatric Bulletin 2009;33(7):254‐7. [Google Scholar]
Zigmond 1983
- Zigmond AS, Snaith RP. The hospital anxiety and depression scale. Acta Psychiatrica Scandinavica 1983;67(6):361‐70. [PUBMED: 6880820] [DOI] [PubMed] [Google Scholar]
References to other published versions of this review
Burns 2007
- Burns T, Catty J, Dash M, Roberts C, Lockwood A, Marshall M. Use of Intensive Case Management to reduce time in hospital in people with severe mental illness: systematic review and meta‐regression. BMJ 2007;335:336‐40. [DOI] [PMC free article] [PubMed] [Google Scholar]
Marshall 2000a
- Marshall M, Gray A, Lockwood A, Green R. Case management for people with severe mental disorders. Cochrane Database of Systematic Reviews 2000, Issue 2. [DOI: 10.1002/14651858.CD000050] [DOI] [PubMed] [Google Scholar]
Marshall 2000b
- Marshall M, Lockwood A. Assertive community treatment for people with severe mental disorders. Cochrane Database of Systematic Reviews 2000, Issue 2. [DOI: 10.1002/14651858.CD001089] [DOI] [PubMed] [Google Scholar]