

Abstract
Isotopically labeling a metabolite and tracing its metabolic fate has provided invaluable insights about the role of metabolism in human diseases in addition to a variety of other issues. 13C-labeled metabolite tracers or unlabeled 1H-based NMR experiments are currently the most common application of NMR to metabolomics studies. Unfortunately, the coverage of the metabolome has been consequently limited to the most abundant carbon-containing metabolites. To expand the coverage of the metabolome and enhance the impact of metabolomics studies, we present a protocol for 15N-labeled metabolite tracer experiments that may also be combined with routine 13C-tracer experiments to simultaneously detect both 15N- and 13C-labeled metabolites in metabolic samples. A database consisting of 2D 1H-15N HSQC natural abundance spectra of 50 nitrogen-containing metabolites are also presented to facilitate the assignment of 15N-labeled metabolites. The methodology is demonstrated by labeling Escherichia coli and Staphylococcus aureus metabolomes with 15N1-ammonium chloride, 15N4-arginine, and 13C2-acetate. Efficient 15N and 13C metabolite labeling and identification were achieved utilizing standard cell culture and sample preparation protocols.
Keywords: Nuclear Magnetic Resonance, Metabolomics, Nitrogen, Bacterial metabolomes
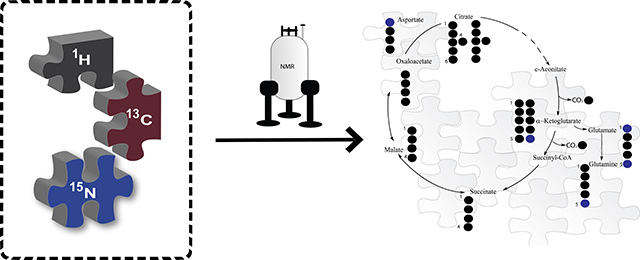
Graphical Abstract:
INTRODUCTION
Over the last half century, a variety of OMICS techniques have become an integral component of most biological research projects. Accordingly, metabolomics, the newest member of the OMICS field, has evolved to becoming a fundamental contributor to systems biology.1 In this regards, metabolomics has been applied to a wide-range of research areas including drug discovery, disease diagnosis, biomarker discovery, plant biology, environmental issues, and nutrition.2–8 Metabolome profiling techniques have undergone tremendous advancements from its early historical application of smell and taste tests to utilizing modern state-of-the-art analytical instrumentation.9 To date, the majority of metabolomics studies rely on mass spectrometry (MS), nuclear magnetic resonance spectroscopy (NMR), or Fourier-transform infrared spectroscopy (FTIR) to characterize a metabolome.10 While the application of metabolomics has grown exponentially over the last decade,11 like all new technologies metabolomics is still undergoing an iterative series of optimization and methodology development steps that are necessary to improve the technology. In essence, metabolomics is still maturing as a technology; and while it is becoming widely adopted by the scientific community, it is essential that metabolomics provides highly reliable and reproducible results.
Metabolomics currently faces a number of significant challenges such as the rapid and reliable assignment of known metabolites; the identification of unknown metabolites, and the establishment of protocols to detect the “dark metabolome”.12–14 Metabolomics relies heavily on the availability of electronic databases that provide standard spectral information for individual metabolites in order to identify metabolites in biological samples. In fact, there is a growing proliferation of databases [Biological Magnetic Resonance Data Bank (BMRB), Birmingham Metabolite Library – NMR (BML-NMR), Complex Mixture Analysis by NMR and TOCSY customized Carbon Trace Archive (COLMAR – TOCCATA), Golm Database (GMD), Human Metabolome Database (HMDB), Madison Metabolomics Consortium Database (MMCD), NMR shift Database (NMRShiftDB), Mass Bank, and MetLin] that contain reference NMR and mass spectral data routinely used to assist in the assignment of metabolites.15–25 A more recent development has been the emergence of specialized databases such as the Cerebrospinal Fluid (CSF) and Serum Metabolome Databases, the Escherichia coli Metabolome Database (ECMDB), and the ReSpect database for phytochemicals.5,6,19,26–28 Not surprisingly, a significant amount of redundancy occurs across these databases, while some data are unique to a specific database. Consequently, the distribution of reference data across multiple databases presents a practical daily-challenge to the routine identification of known metabolites. Simply, an investigator needs to interrogate multiple databases to make sure a proper metabolite assignment is made. Therefore, there is a clear need to establish a concerted and coordinated effort to eliminate this unnecessary redundancy, consolidate databases and, more importantly, to expand the unique information within databases. Focusing effort on increasing the number of reference spectra is essential to expanding the coverage of the metabolome.
For example, the human metabolome database currently lists only 1,551 compounds with an associated NMR spectrum, but the lower limit estimate for the number of endogenous and exogenous human metabolites is around 150,000.29 The situation is significantly improved for mass spectral data where there are over 325,000 compounds with an MS spectrum. Nevertheless, the number of metabolites routinely detected in targeted or untargeted metabolomics studies is typically less than 200 or occasionally upwards of 1,500 metabolites.29 So, especially in the case of NMR, additional reference spectra are needed to facilitate metabolite assignments. But, as evident by the abundance of mass spectral data, additional reference information is not sufficient to improve the coverage of the metabolome. Additional detection methods are also needed.
Both NMR and MS routinely utilize stable isotope-resolved metabolomics (SIRM) techniques10 to expand the coverage of the metabolome and facilitate metabolite assignments. The SIRM approach typically uses a readily available 13C-labeled nutrient source (e.g., 13C6-glucose) to incorporate an isotope label into the metabolome. SIRM are also routinely used to monitor metabolic fluxes. In this manner, NMR and MS are able to readily detect the 13C-labeled metabolites derived from the nutrient source. SIRM effectively highlights a specific subset of the metabolome, which may improve the detection of metabolites not typically observed without the isotope label. Again, this is especially true for NMR since the incorporation of the 13C-isotope label greatly enhances NMR sensitivity. 12C-nuclei are not NMR active, and consequently, not observable in an NMR spectrum. Since the natural abundance of the NMR-active 13C-nuclei is only 1.1%, the incorporation of “100%” 13C-label may easily lead to a 100-fold increase in sensitivity. Similarly, the incorporation of the 13C-label is evident in a MS spectrum by a proportional change in the intensity of the monoisotopic peak profile. Accordingly, an MS spectrum can identify the number of 13C-carbons incorporated into the metabolite. Conversely, NMR can effectively trace the exact atom position for each 13C-carbon incorporated into the metabolite from the labeled nutrient. Thus, NMR and MS allows for a simple and elegant ability to trace each 13C atom across multiple metabolic pathways and to identify enriched and upregulated metabolic pathways. Again, the SIRM method allows for the detection of metabolites that may not be readily observable without the incorporation of an isotope-label. Importantly, alternative regions of the metabolome can be emphasized by simply using a different 13C-labeled nutrient such as alanine, acetate, glutamine, lactate, ketone body, palmitic acid, etc. in order to follow the flow of 13C atoms through a specific set of metabolic pathways. To date, the vast majority of SIRM studies have relied on 13C-labeled metabolites, which of course, significantly limits the coverage of the metabolome to only carbon-containing metabolites. There are other nuclei of biological importance (e.g., 15N, 31P, and 33S) that are NMR active, but with variable natural abundance. Specifically, while 15N-isotope labeling has been extensively used in NMR protein structure determination, it has been rarely applied to metabolomics experiments. A major road block for such experiments is a lack of established and standardized protocols and the lack of available 15N NMR reference spectra to assign 15N-containing metabolites.
Cellular metabolism is rich in nitrogen containing metabolites (e.g., adenine, biotin, thiamine, etc.), which are key components of the building blocks of life, from genetic information to proteins. Nitrogen containing metabolites may also function as regulators of various biological processes. Accordingly, nitrogen containing metabolites and nitrogen metabolism is important across all organisms.30–34 For example, nitrogen metabolism in gram-positive bacteria (e.g., Bacillus subtilis, Staphylococcus aureus) is controlled through CodY, a highly conserved repressor that responds to changes in amino acid concentrations.35 As a result, CodY controls amino acid transport and, accordingly, regulates virulence factors. Similarly, for Mycobacterium tuberculosis, various amino acids, such as arginine, aspartate and tryptophan, have been identified to play a role in the development of resistance to hypoxic stress, acid stress, and immune system-driven starvation.36 Other examples of the importance of nitrogen metabolism to cellular processes include the recent observation that mTORC, a major metabolic regulator associated with cell division and cancer, is controlled through nutrient sensing of amino acids.37,38 Similarly, glutamine addiction in cancer cells has been linked to drug resistance (i.e., gemcitabine resistance in pancreatic cancers).39 Metabolic recycling of ammonia has been attributed to breast cancer proliferation, and reprogramming of branch chained amino acids to myeloid leukaemia progression.38,40,41 As these examples illustrate, nitrogen containing metabolites, nitrogen metabolism, and maintaining an overall nitrogen balance are all critical factors in human diseases and for preserving proper cellular processes. Consequently, nitrogen containing metabolites comprise a significant component of the cellular metabolome. The overall contribution of nitrogen containing metabolites to some common metabolome databases is highlighted in Figure 1. On average, ~40% of the metabolites (15 to 73%) within these databases are a nitrogen-containing metabolite and comprise chemically diverse classes of compounds. Therefore, being able to expand the coverage of the metabolome by detecting these nitrogen-containing metabolites and being able to follow nitrogen-flow through the metabolome is critical to an accurate and thorough analysis of a metabolome.
Figure 1:

(A) Bubble plot showing the contribution of nitrogen-containing metabolites to each of the metabolome databases: (1) BMDB, (2) BMRB, (3) ECMDB, (4) foodDB, (5) HMDB, (6) MMCD, (7) plantcyc and (8) RikenPRIME. Each database was searched for compounds containing at least one nitrogen atom. The number of nitrogen-containing metabolites listed in each database is as of May 15th 2017. (B) Examples of common nitrogen-containing metabolites illustrating the chemical diversity of the metabolome.
In addition to the lack of 15N NMR reference spectra, nitrogen-based metabolomics has seen limited usage because of the low natural abundance of 15N (0.365%), the intrinsically low sensitivity of the 15N nuclei (0.104% vs. 1H), and a further decrease in sensitivity due to exchange broadening. NH, NH2 and NH3 protons tend to be very labile and exchange readily with solvent, especially at biologically relevant pH values of 6.8 to 7.4. As a result, nitrogen protons may not be detectable by NMR under typical experimental conditions for metabolomics studies. To resolve this issue, we have developed experimental protocols and assembled reference NMR spectra to facilitate the detection of nitrogen-containing metabolites. Herein, we describe our protocol to expand NMR metabolomics databases to include two-dimensional (2D) 1H-15N heteronuclear single quantum coherence (HSQC) spectra for a range of common nitrogen-containing metabolites. We demonstrate the utility of our methodology by characterizing 15N-labeled and 13C,15N-labeled metabolomics samples obtained from E. coli and S. aureus cell lysates.
METHODS
Preparation of standard NMR samples of nitrogen-containing metabolites.
An initial standard NMR sample consisting of a small mixture of nitrogen-containing compounds was prepared to optimize sample conditions and experimental protocols. Please see supplemental information for the list of chemicals used in this study. The metabolites were selected based on a relative importance for central nitrogen metabolism and/or as a routine target of metabolomics studies, and consisted of: glutamine, glutamate, arginine and urea. Uniformly 15N-labeled samples for the four compounds were combined to prepare a single standard NMR sample. 1 mM of each compound was dissolved in 500 μL of 25 mM phosphate buffer at pH 7, pH 4 or pH 2 (uncorrected) in NANOPure water (Barnstead, Dubuque, IA) with the addition of 50 μL of D2O (Cambridge Isotope Laboratories, Inc., Tewksbury, MA) and 500 μM of TMSP. The samples were transferred to a 5 mm NMR tube and used to collect 2D 1H −15N HSQC spectra.
Singleton NMR samples were prepared for 46 other nitrogen-containing metabolites listed in Table S1. Specifically, an unlabeled sample of each metabolite was dissolved to saturation in 500 μL of 25 mM phosphate buffer at pH 2 (uncorrected) in NANOPure water with the addition of 50 μL of D2O. The samples were transferred to a 5 mm NMR tube and used to collect 2D 1H −15N HSQC spectra.42,43
Preparation of 13C,15N-labeled metabolomic samples from cell lysates.
E. coli (strain MG1655) was cultured in M9 minimal media containing 15NH4Cl as the sole nitrogen source and 13C2 acetate (Isotec, Sigma Aldrich, Miamisburg, OH) as the only source of carbon. Triplicate 25 mL cell cultures were grown aerobically until a final O.D600 of 36. Cells were harvested at the 12 hour time-point upon reaching stationary phase. Each cell culture was centrifuged at 5000 rpm for 20 minutes at 4oC to pellet the cell suspension. Pellets were re-suspended in 1.5 ml of 1:1 water:methanol solution. Cells were mechanically lysed by sonication using five 30 sec intervals. The lysed cells were then centrifuged at 13000 rpm for 20 minutes at 4oC and 1 ml of the supernatant was transferred to a microcentrifuge tube. The metabolome cell extraction protocol was repeated and the two supernatants were combined. The samples were kept on ice during the entire extraction process. Methanol was removed using a SpeedVac® Plus SC110A system (Savant, Thermo Scientific, Asheville, NC) and the samples were then lyophilized using a FreeZone™ freeze dryer (Labconco, Kansas City, MO).
S. aureus (strain JE2) were cultured in a chemically defined medium (CDM) comprised of 18 amino acids, where 14N4-arginine was replaced with 0.1 g/L of 15N4-arginine (Isotec, Sigma Aldrich, Miamisburg, OH).44 Five replicates of 50 mL cultures of S. aureus were grown aerobically to an optical density (O.D.600) of 1.9. Cultures were normalized to an O.D.600 of 40 and pelleted by centrifugation (4,000 rpm at 4°C for 5 min). The resulting cell pellets were kept on ice throughout the entire metabolome extraction process. Cell pellets were washed twice with 10 mL of sterile ice-cold double distilled water (ddH2O), and then centrifuged at 4000 rpm for 5 minutes at 4oC. Each pellet was then resuspended in 1 mL of sterile ice-cold ddH2O, transferred to a 2 mL FastPrep Lysing Matrix B tube, and then mechanically lysed twice at speed 6 for 40 seconds with a 5-minute interval. The cell lysates were then centrifuged at 13,200 rpm for 15 min at 4oC and 800 uL of the supernatant was transferred to a 2-mL tube. The cell pellets were resuspended with 1 mL of ice-cold sterile ddH2O and centrifuged at 13,200 rpm for 15 min at 4oC. 1 mL of the supernatant was pooled together with the previous 800 uL cell extract and centrifuged at 13,200 rpm for 10 min at 4oC. The metabolome extracts were snap frozen in liquid nitrogen and lyophilized using FreeZone™ freeze dryer.
The E. coli and S. aureus metabolome extracts were dissolved in 500 μL of 25 mM phosphate buffer at pH 2 (uncorrected) in NanoPure water with the addition of 50 μL of D2O and 500 μM of TMSP. The samples were transferred to a 5 mm NMR tube and used to collect 2D 1H −15N HSQC and 2D 1H −13C HSQC spectra.42,43
NMR data collection and processing.
All NMR experiments were conducted at 277.15 K using a Bruker AVANCE III-HD 700 MHz spectrometer equipped with 5 mm quadruple resonance QCI-P cryoprobe (1H, 13C, 15N and 31P) with Z-axis gradients. A SampleJet automated sample changer system with Bruker ICON-NMR software was used to automate the NMR data collection. Please see supplemental information for further details on the routine protocols used for NMR data collection and processing. A natural abundance 2D 1H-15N HSQC reference spectrum was collected for each of the standard nitrogen-containing metabolites listed in Table S1. The 2D 1H-15N HSQC were collected with non-uniform sampling (25% sampling sparsity)45 and were Fourier transformed, phased and reconstructed using Topspin 3.5. The 2D 1H-15N HSQC reference spectra were used to annotate the NMR spectra obtained for the E. coli and S. aureus metabolome extracts.
Results and Discussions:
Optimization of sample conditions.
Nitrogen protons tend to be labile and to exchange rapidly with solvent as a function of pH, and correspondingly, are difficult to observe by NMR in aqueous solvents. Simply, the NMR resonance is severely line-broadened into the baseline due to the solvent exchange. Direct detection of 15N NMR resonance is equally challenging because of the low natural abundance (0.365%) and low sensitivity (0.104% vs. 1H) of the 15N-nuclei. Thus, direct detection of a 1D 15N spectrum, even with enrichment of the 15N-signal with 15N-labeling, is not practical for a metabolomics study because of the long acquisition times (hours) and large datasets. As a result, nitrogen-based NMR experiments and the detection of nitrogen-containing metabolites have seen limited applications in metabolomics. To circumvent these issues, a variety of experimental conditions were investigated to optimize the routine and reliable observation of nitrogen-containing metabolites by NMR. The two key aspects of the optimization process were sample preparation and NMR data collection, which was accomplished using a standard metabolomics sample containing four nitrogen-containing metabolites.
2D 1H-15N HSQC NMR spectra were collected for the standard metabolite sample at pH 7, 4 and 2. Not surprisingly, lowering the pH of the sample lead to a significant improvement in signal-to-noise and in the overall quality of the NMR spectrum. At pH 7, only one metabolite, urea, was detectable. Lowering the pH to 4 resulted in observing three of the four metabolites, with only glutamate being undetected. At pH 2, all of the metabolites were observable and the overall quality of the spectrum was acceptable, but significant line-broadening was still apparent. Simply, observing a nitrogen proton by NMR is dictated by its pKa and the pH of the solution. Consequently, a low pH was deemed necessary for observing the majority of nitrogen metabolites. Again, most N-H bonds are easily exchangeable with a deuterium labeled solvent such as D2O, but, in addition to pH, the exchange rate can also be reduced by lowering the sample temperature. Accordingly, 2D 1H-15N HSQC NMR spectrum was also collected for the standard metabolite sample at 298K, 283K and 277.15K. The impact of lowering the temperature on the quality of the NMR spectra was significantly less dramatic then the impact of pH. Overall, lowering the temperature to 277.15K resulted in only 1.6 fold increase in signal-to-noise. More importantly, combining a low pH (pH 2) with a low sample temperature (277.15K) allowed for the detection of all of the nitrogen-containing metabolites tested (Table S1). Collecting the 2D 1H-15N HSQC experiment at pH 2 and 277.15K resulted in a significant improvement in the quality of the spectrum compared to spectra collected at higher pH or temperatures (Figure 2). The high pH dependency of NH, NH2 and NH3 NMR resonances raises a legitimate concern regarding the reliability of metabolite quantification. Accordingly, great care is required to minimize pH variance between NMR metabolomics samples, which is achievable by optimizing buffer concentration, using an internal pH standard,46 or manually verifying sample pH values.
Figure 2:

Plot of the sum of intensities for all peaks observed in the 2D 1H-15N HSQC spectra that were collected at different conditions of pH and temperature.
2D 1H-15N HSQC spectral database for nitrogen-containing metabolites.
A set of nitrogen containing metabolites were identified to compile a 2D 1H-15N HSQC spectral database. The set of reference spectra and chemical shifts will enable the routine identification of nitrogen-containing metabolites as part of any metabolomics study. Metabolites included in the database were first identified by general chemical classes, for example amino acids, urea-cycle related metabolites, amino-sugars, and nucleotides. We then used our existing FAST-NMR chemical library47 to identify additional metabolites (e.g., co-factors and vitamins) to also include in the NMR reference database. The remaining metabolites populating the database were identified based on general knowledge of metabolic processes and/or corresponded to compounds routinely encountered in cell extracts. In total, an initial set of 65 metabolites were identified.
A natural abundance 2D 1H-15N HSQC spectrum was collected for each individual compound at pH 2 and 277.15K. We had to rely on natural abundance HSQC spectra because of the limited availability of 15N labeled compounds from chemical vendors. Accordingly, a concentrated stock solution was required in order to obtain a high-quality 2D 1H-15N HSQC spectrum of a natural abundant metabolite. To achieve this, NMR samples were prepared at concentrations in the range of 100–300 mM. In most cases, sample concentrations were close to saturation. Due to low solubility issues, a 2D 1H-15N HSQC spectrum was not obtainable for 15 of the selected compounds (Table S2). Non-uniform sampling (NUS) was used to reduce the total experimental time and maximize the signal averaging to further improve the overall quality of the natural abundance HSQC spectra. The HSQC spectra were collected at 25% sparsity using a deterministic gap sampling method45 and reconstructed with the compressed sensing algorithm. The final protocol used to obtain the reference database of 2D 1H-15N HSQC spectra is summarized in Figure 3A. In total, 2D 1H-15N HSQC spectra and 1H, 15N chemical shift assignments were obtained for 50 common metabolites, which are summarized in Table S1. Representative examples of a number of the experimental 2D 1H-15N HSQC spectra obtained for nitrogen-containing metabolites are shown in Figure 4A.
Figure 3:

(A) Flowchart of protocol for collecting natural abundance 2D 1H-15N HSQC reference spectra for nitrogen-containing metabolites. (B) Flowchart illustrating the process of simultaneously analyzing 13C-carbon and 15N-nitrogen labeled metabolites by NMR. The figure was created with ChemDraw Professional 15.0 (PerkinElmer Informatics, Waltham, MA).
Figure 4:

(A) Representative examples of 2D 1H-15N HSQC spectra obtained for natural abundance nitrogen-containing metabolites. [L-alanine (Ala), ornithine (Orn), uracil (Ura), creatine phosphate (CrP), L-leucine (Leu), thymine (Thy)]. (B) 2D 1H-15N HSQC spectra obtained for E. coli cell lysate. E. coli was cultured in minimal M9 media with the addition of 15NH4Cl. Cells were harvested during stationary phase. 1: Arginine, 2: Glutamine 3: Asparagine, 4: NAD, 5: Ornithine 6: 5-azacytidine. (C) 2D 1H-15N HSQC spectra obtained for S. aureus cell lysate. S. aureus was cultured in chemically defined media with the addition of 15N4 L-arginine. Cells were harvested during stationary phase. 1: arginine, 2: glutamine 3: asparagine, 4: NAD, 6: aminobutyrate, 7: glutamate.
15N-labeled and 13C and15N-labeled metabolomics in bacterial systems.
The utility of our protocol for obtaining 2D 1H-15N HSQC spectra of nitrogen-containing metabolites was demonstrated on metabolomics samples extracted from E. coli and S. aureus cell lysates (Figure 3B). Furthermore, two different nitrogen sources (e.g.,15NH4Cl, 15N4-arginine) were used to incorporate 15N-labels into the metabolomes. Additionally, 15N1 ammonium chloride was combined with 13C2-acetate to demonstrate the simultaneous incorporation of both 15N and 13C-lables into the metabolomics pool (Figure 3B). This illustrates the overall versatility of the approach and the inherent flexibility of utilizing a variety of nitrogen and carbon sources. The 2D 1H-15N HSQC spectrum of the E. coli cell lysate following 15N-labeling with 15NH4Cl is shown in Figure 4B. A total of five 15N-labeled metabolites were identified. Since the E. coli cells were stressed due to nutrient limitation, these five metabolites likely represent the major E. coli nitrogen pool necessary for cell survival during stationary phase. Presumably, the remainder of the 15N-nitrogens is distributed to other metabolites and biomolecules at concentrations levels below detection by NMR. Similarly, the 2D 1H-15N HSQC spectrum of the S. aureus cell lysate following 15N-labeling with 15N4-arginine is shown in Figure 4C. A total of seven 15N-labeled metabolites were identified. Since 15N4-arginine was added to a standard culture medium, it represents only about 2% of the total nitrogen pool. Accordingly, the seven detected metabolites correspond to metabolites that were only derived from arginine metabolism. Thus, the 15N-labeled metabolomes from E. coli and S. aureus are highlighting distinctly different cellular and metabolic processes. It is important to note that only the E. coli and S. aureus cell lysates were analyzed, additional 15N-labeled metabolites may have been excreted into the culture media. Significantly, both HSQC spectra were completely assigned using our reference 2D 1H-15N HSQC spectral database and chemical shift assignments (Table S1). Furthermore, these results demonstrate that it is readily achievable to 15N-label metabolites with either 15N-labeled salts or 15N-labeled amino acids. In effect, the metabolome can be globally or specifically targeted based on the choice of nitrogen source.
The E. coli metabolomics pool was also successfully labeled with both 15N and 13C. The 15N and 13C labeled metabolites were identified by collecting a 2D 1H-15N HSQC spectrum and a 2D 1H-13C HSQC spectrum on the same metabolomics sample (Figure 5). The 2D 1H-15NHSQC spectrum was collected first using a sample pH of 2 and a sample temperature of 277.15K. The sample pH was then adjusted to pH 7 to collect the 2D 1H-13C HSQC spectrum at room temperature. This was necessary since most metabolomics databases contain reference 2D 1H-13C HSQC spectra that have been collected at pH 7 and 25oC. Again, both HSQC spectra were completely assigned using the combination of our 2D 1H-15N HSQC spectral database and the BMRB/HMDB databases. In this example, all of the 15N-labeled metabolites (five in total) were also observed as 13C-labeled metabolites (34 in total). Nevertheless, even though no new metabolites were identified, the differently labeled metabolites monitor distinctly different metabolic pathways. In essence, the specific isotopic label within the metabolite conveys the expanded coverage of the metabolome. Consider the fact that the incorporation of 13C-carbons from 13C2-acetate is monitoring carbon-flow through the tricarboxylic acid (among other pathways); whereas, the incorporation of 15N-nitrogen from 15NH4Cl occurs through nitrogen metabolism (including arginine biosynthesis, glutamate metabolism, etc.). Thus, the same 15N- or 13C-labeled metabolite provides fundamentally distinct information regarding changes in cellular processes that may be missed if only one label was used. For example, a study interested in amino acid metabolism may benefit from obtaining reliable Glu/Gln or Asp/Asn ratios, which would be an obvious use of 15N-labels. These results clearly demonstrate that the simultaneous incorporation of 15N and 13C-labels is a viable option for NMR metabolomics. Furthermore, being able to expand the coverage of the metabolome by enabling the routine detection and identification of nitrogen-containing metabolites will be a valuable addition to any metabolomics study.
Figure 5:

(A) 2D 1H-15N HSQC spectrum and (B) 2D 1H-13C HSQC spectrum obtained for E. coli cell lysate. E. coli was cultured in minimal M9 media with the addition of 15NH4Cl and13C2 acetate. Cells were harvested during stationary phase. Assignments for peaks in 2D 1H-15N HSQC spectra can be found in Figure 4. Assignments for peaks in the 2D 1H-13C HSQC spectrum are: 1: Internal standard TMSP, 2: Butyrate, 3: Uridine diphosphate glucose, 4: 2-methyl glutarate,5: 2-methyl glutarate, 6: 3-hydroxybutyrate, 7: valerate, 8: alanine, 9: butanone, 10: acetate,11: 2-aminobutyric acid,12: ornithine,13 acetyl carnithine, 14:glutamate,15: cystathionine,16: methionine, 17: pyruvate, 18: glutamyl-folate, 19: serine, 20: malate, 21: N-acetylmannosamine, 24: glucose, 25: ascorbate, 26: glycerol, 27: ribose, 28: celliobiose, 29: glucuronic acid, 30: fumarate, 31: Uracil, 32: N-acetyl Lysine, 33: N-acetyl glucosamine,34: glutamine, 35: malonic acid.
CONCLUSIONS
A standard protocol for the collection of 2D 1H-15N HSQC spectra for the detection of nitrogen-containing metabolites has been presented. Furthermore, a reference database of 2D 1H-15N HSQC spectra and the associated chemical shift assignments for 50 commonly-encountered nitrogen-containing metabolites has been assembled to facilitate the rapid and easy identification of these metabolites. Taken together, these results expand the coverage of the metabolome, especially since this tool gives a way to probe nitrogen metabolism with an atom-specific understanding of the metabolome. As nitrogen-containing metabolites comprise more than 30% of the known metabolome, it is likely that 15N incorporation can highlight distinct metabolic pathways. Additionally, we also demonstrate that the simultaneous incorporation of both 15N and 13C-labels into a metabolomics sample should be a routine choice for most metabolomics studies. Accordingly, the 15N and 13C-labeled metabolites are readily assigned by the sequential collection of 2D 1H-15N/13C HSQC spectra. It is worth noting that 13C- and 15N-labeling of metabolites in prokaryotic35,36 and mammalian37–40 cell cultures is routinely achievable. As recently demonstrated,41 2D 15N heteronuclear multi-bond correlation (HMBC) experiments was able to monitor cancer processes involving 15N-labeled metabolites, which further highlights the overall versatility of NMR and the viability of nitrogen-based metabolomics studies. An outstanding challenge in SIRM techniques is obtaining similar results in animal models or human clinical studies. An alternative approach would be to collect natural-abundance HSQC spectra by combining NUS with fast data acquisition techniques,48 and by maximizing the sample size and the number of scans within practical limits.
Supplementary Material
ACKNOWLEDGEMENTS
We thank Dr. Martha Morton, the Director of the Research Instrumentation Facility in the Department of Chemistry at the University of Nebraska-Lincoln for her assistance with the NMR experiments. This material is based upon work supported by the National Science Foundation under Grant Number (1660921). This work was supported in part by funding from the Redox Biology Center (P30 GM103335, NIGMS); the Nebraska Center for Integrated Biomolecular Communication (P20 GM113126, NIGMS), and the National Institutes of Health grant (P01 AI083211, NIAID) to PDF and RP. The research was performed in facilities renovated with support from the National Institutes of Health (RR015468–01). Any opinions, findings, and conclusions or recommendations expressed in this material are those of the author(s) and do not necessarily reflect the views of the National Science Foundation.
ABBREVIATIONS
- NMR
Nuclear Magnetic Resonance
- E.coli
Escherichia coli
- S. aureus
Staphylococcus aureus
- HSQC
Heteronuclear Single Quantum Coherence
REFERENCES
- (1).Patti GJ; Yanes O; Siuzdak G Nat Rev Mol Cell Biol 2012, 13, 263–269. [DOI] [PMC free article] [PubMed] [Google Scholar]
- (2).Monteiro MS; Carvalho M; de Lourdes Bastos M; de Pinho PG Metabolomics 2014, 10, 1210–1222. [Google Scholar]
- (3).Vermeersch KA; Styczynski MP Journal of carcinogenesis 2013, 12, 9. [DOI] [PMC free article] [PubMed] [Google Scholar]
- (4).Wishart DS Drugs in R & D 2008, 9, 307–322. [DOI] [PubMed] [Google Scholar]
- (5).Sawada Y; Nakabayashi R; Yamada Y; Suzuki M; Sato M; Sakata A; Akiyama K; Sakurai T; Matsuda F; Aoki T; Hirai MY; Saito K Phytochemistry 2012, 82, 38–45. [DOI] [PubMed] [Google Scholar]
- (6).Sumner LW; Mendes P; Dixon RA Phytochemistry 2003, 62, 817–836. [DOI] [PubMed] [Google Scholar]
- (7).Bundy JG; Davey MP; Viant MR Metabolomics 2008, 5, 3. [Google Scholar]
- (8).Cappello T; Brandao F; Guilherme S; Santos MA; Maisano M; Mauceri A; Canario J; Pacheco M; Pereira P Science of the Total Environment 2016, 548, 13–24. [DOI] [PubMed] [Google Scholar]
- (9).Nicholson JK; Lindon JC Nature 2008, 455, 1054. [DOI] [PubMed] [Google Scholar]
- (10).Marshall DD; Lei S; Worley B; Huang Y; Aracely b.; @bullet G-G; Franco R; Dodds ED; Powers R
- (11).Powers R Journal of Medicinal Chemistry 2014, 57, 5860–5870. [DOI] [PMC free article] [PubMed] [Google Scholar]
- (12).Markley JL; Bruschweiler R; Edison AS; Eghbalnia HR; Powers R; Raftery D; Wishart DS Current Opinion in Biotechnology 2017, 43, 34–40. [DOI] [PMC free article] [PubMed] [Google Scholar]
- (13).Bingol K; Bruschweiler-Li L; Li DW; Zhang B; Xie MZ; Bruschweiler R Bioanalysis 2016, 8, 557–573. [DOI] [PMC free article] [PubMed] [Google Scholar]
- (14).Nagana Gowda GA; Raftery D Anal Chem 2017, 89, 490–510. [DOI] [PMC free article] [PubMed] [Google Scholar]
- (15).Bingol K; Zhang F; Bruschweiler-Li L; Bruschweiler R Anal Chem 2012, 84, 9395–9401. [DOI] [PMC free article] [PubMed] [Google Scholar]
- (16).Cui Q; Lewis IA; Hegeman AD; Anderson ME; Li J; Schulte CF; Westler WM; Eghbalnia HR; Sussman MR; Markley JL Nat. Biotechnol. 2008, 26, 162–164. [DOI] [PubMed] [Google Scholar]
- (17).Kopka J; Schauer N; Krueger S; Birkemeyer C; Usadel B; Bergmüller E; Dörmann P; Weckwerth W; Gibon Y; Stitt M; Willmitzer L; Fernie AR; Steinhauser D Bioinformatics 2005, 21, 1635–1638. [DOI] [PubMed] [Google Scholar]
- (18).Ludwig C; Easton JM; Lodi A; Tiziani S; Manzoor SE; Southam AD; Byrne JJ; Bishop LM; He S; Arvanitis TN; Günther UL; Viant MR Metabolomics 2012, 8, 8–18. [Google Scholar]
- (19).Psychogios N; Hau DD; Peng J; Guo AC; Mandal R; Bouatra S; Sinelnikov I; Krishnamurthy R; Eisner R; Gautam B; Young N; Xia J; Knox C; Dong E; Huang P; Hollander Z; Pedersen TL; Smith SR; Bamforth F; Greiner R, et al. PLoS One 2011, 6, e16957. [DOI] [PMC free article] [PubMed] [Google Scholar]
- (20).Steinbeck C; Kuhn S Phytochemistry 2004, 65, 2711–2717. [DOI] [PubMed] [Google Scholar]
- (21).Sud M; Fahy E; Cotter D; Azam K; Vadivelu I; Burant C; Edison A; Fiehn O; Higashi R; Nair KS; Sumner S; Subramaniam S Nucleic Acids Research 2016, 44, D463–D470. [DOI] [PMC free article] [PubMed] [Google Scholar]
- (22).Tautenhahn R; Cho K; Uritboonthai W; Zhu Z; Patti GJ; Siuzdak G Nat Biotechnol 2012, 30, 826–828. [DOI] [PMC free article] [PubMed] [Google Scholar]
- (23).Ulrich EL; Akutsu H; Doreleijers JF; Harano Y; Ioannidis YE; Lin J; Livny M; Mading S; Maziuk D; Miller Z; Nakatani E; Schulte CF; Tolmie DE; Kent Wenger R; Yao H; Markley JL Nucleic Acids Research 2008, 36. [DOI] [PMC free article] [PubMed] [Google Scholar]
- (24).Wishart DS; Jewison T; Guo AC; Wilson M; Knox C; Liu YF; Djoumbou Y; Mandal R; Aziat F; Dong E; Bouatra S; Sinelnikov I; Arndt D; Xia JG; Liu P; Yallou F; Bjorndahl T; Perez-Pineiro R; Eisner R; Allen F, et al. Nucleic Acids Research 2013, 41, D801–D807. [DOI] [PMC free article] [PubMed] [Google Scholar]
- (25).Markley JL; Ulrich EL; Berman HM; Henrick K; Nakamura H; Akutsu H Journal of Biomolecular NMR 2008, 40, 153–155. [DOI] [PMC free article] [PubMed] [Google Scholar]
- (26).Guo AC; Jewison T; Wilson M; Liu Y; Knox C; Djoumbou Y; Lo P; Mandal R; Krishnamurthy R; Wishart DS Nucleic Acids Res 2013, 41, D625–630. [DOI] [PMC free article] [PubMed] [Google Scholar]
- (27).Sajed T; Marcu A; Ramirez M; Pon A; Guo AC; Knox C; Wilson M; Grant JR; Djoumbou Y; Wishart DS Nucleic Acids Res 2016, 44, D495–501. [DOI] [PMC free article] [PubMed] [Google Scholar]
- (28).Wishart DS; Lewis MJ; Morrissey JA; Flegel MD; Jeroncic K; Xiong Y; Cheng D; Eisner R; Gautam B; Tzur D; Sawhney S; Bamforth F; Greiner R; Li L Journal of chromatography. B, Analytical technologies in the biomedical and life sciences 2008, 871, 164–173. [DOI] [PubMed] [Google Scholar]
- (29).Markley JL; Brüschweiler R; Edison AS; Eghbalnia HR; Powers R; Raftery D; Wishart DS Current Opinion in Biotechnology 2017, 43, 34–40. [DOI] [PMC free article] [PubMed] [Google Scholar]
- (30).Marzluf GA Microbiol. Mol. Biol. Rev. 1997, 61, 17–32. [DOI] [PMC free article] [PubMed] [Google Scholar]
- (31).Merrick MJ; Edwards RA Microbiological Reviews 1995, 59, 604–622. [DOI] [PMC free article] [PubMed] [Google Scholar]
- (32).Reitzer L Annual Review of Microbiology 2003, 57, 155–176. [DOI] [PubMed] [Google Scholar]
- (33).van Heeswijk WC; Westerhoff HV; Boogerd FC Microbiology and Molecular Biology Reviews : MMBR 2013, 77, 628–695. [DOI] [PMC free article] [PubMed] [Google Scholar]
- (34).Huppe HC; Turpin DH Annu. Rev. Plant Physiol. Plant Mol. Biol 1994, 45, 577–607. [Google Scholar]
- (35).Somerville GA; Proctor RA Microbiol. Mol. Biol. Rev 2009, 73, 233–248. [DOI] [PMC free article] [PubMed] [Google Scholar]
- (36).Gouzy A; Poquet Y; Neyrolles O Nature Reviews Microbiology 2014, 12, 729–737. [DOI] [PubMed] [Google Scholar]
- (37).Efeyan A; Zoncu R; Sabatini DM Trends Mol Med 2012, 18, 524–533. [DOI] [PMC free article] [PubMed] [Google Scholar]
- (38).Wyant GA; Abu-Remaileh M; Wolfson RL; Chen WW; Freinkman E; Danai LV; Vander Heiden MG; Sabatini DM Cell 2017, 171, 642–654.e612. [DOI] [PMC free article] [PubMed] [Google Scholar]
- (39).Gebregiworgis T; Purohit V; Shukla SK; Tadros S; Chaika NV; Abrego J; Mulder SE; Gunda V; Singh PK; Powers RJ Proteome Res. 2017, 16, 3536–3546.. [DOI] [PMC free article] [PubMed] [Google Scholar]
- (40).Spinelli JB; Yoon H; Ringel AE; Jeanfavre S; Clish CB; Haigis MC Science 2017, 358, 941. [DOI] [PMC free article] [PubMed] [Google Scholar]
- (41).Hattori A; Tsunoda M; Konuma T; Kobayashi M; Nagy T; Glushka J; Tayyari F; McSkimming D; Kannan N; Tojo A; Edison AS; Ito T Nature 2017, 545, 500. [DOI] [PMC free article] [PubMed] [Google Scholar]
- (42).Palmer AG; Cavanagh J; Wright PE; Rance M Journal of Magnetic Resonance (1969) 1991, 93, 151–170. [Google Scholar]
- (43).Kay L; Keifer P; Saarinen T Journal of the American Chemical Society 1992, 114, 10663–10665. [Google Scholar]
- (44).Halsey CR; Lei S; Wax JK; Lehman MK; Nuxoll AS; Steinke L; Sadykov M; Powers R; Fey PD mBio 2017, 8, e01434–01416. [DOI] [PMC free article] [PubMed] [Google Scholar]
- (45).Worley B; Powers R Journal of Magnetic Resonance 2015, 261, 19–26. [DOI] [PMC free article] [PubMed] [Google Scholar]
- (46).Baryshnikova OK; Williams TC; Sykes BD J. Biomol. NMR 2008, 41, 5–7. [DOI] [PubMed] [Google Scholar]
- (47).Robert P; Katherine G; Kelly AM Combinatorial Chemistry & High Throughput Screening 2006, 9, 515–534. [DOI] [PubMed] [Google Scholar]
- (48).Brutscher B; Marion D; Frydman L In NMR of Biomolecules: Towards Mechanistic Systems Biology; Bertini I, McGreevy KS, Parigi G, Eds.; Wiley-Blackwell, 2012; pp 445–465. [Google Scholar]
Associated Data
This section collects any data citations, data availability statements, or supplementary materials included in this article.