

SUMMARY
N-acetyl-aspartyl-glutamate (NAAG) is a peptide-based neurotransmitter that has been extensively studied in many neurological diseases. In this study, we show a specific role of NAAG in cancer. We found that NAAG is more abundant in higher grade cancers and is a source of glutamate in cancers expressing glutamate carboxypeptidase II (GCPII), the enzyme that hydrolyzes NAAG to glutamate and N-acetyl-aspartate (NAA). Knocking down GCPII expression through genetic alteration or pharmacological inhibition of GCPII results in a reduction of both glutamate concentrations and cancer growth. Moreover, targeting GCPII in combination with glutaminase inhibition accentuates these effects. These findings suggest that NAAG serves as an important reservoir to provide glutamate to cancer cells through GCPII when glutamate production from other sources is limited. Thus, GCPII is a viable target for cancer therapy, either alone or in combination with glutaminase inhibition.
In Brief
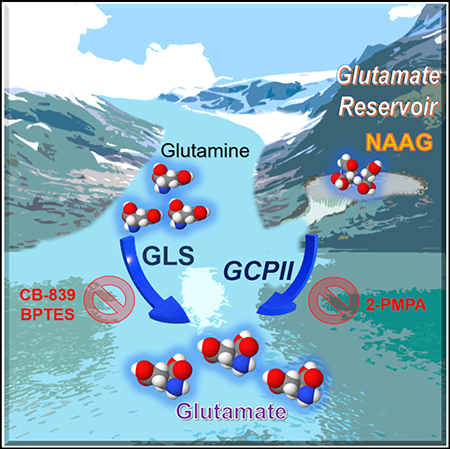
Nguyen et al. show that NAAG is more abundant in higher grade cancers and a source of glutamate in cancers expressing GCPII, the enzyme that hydrolyzes NAAG to glutamate and NAA. The results suggest that GCPII is a viable target for cancer therapy, either alone or in combination with glutaminase inhibition.
Graphical Abstract
INTRODUCTION
Adaptations in the metabolism of cancers contribute to tumor survival and growth and present opportunities to develop novel therapeutic strategies (Kelloff et al., 2005; Som et al., 1980). In particular, glutamine metabolism plays such an important role in cancer growth that a phenomenon known as “glutamine addiction” is recognized in many cancers (Dranoff et al., 1985; Elgogary et al., 2016; Fogal et al., 2015; Le et al., 2012; Lyssiotis et al., 2013; Ru et al., 2013; Son et al., 2013; Tanaka et al., 2015). Blocking the conversion of glutamine to glutamate via pharmacological inhibition of glutaminase is currently being tested for treatment of cancer in clinical trials (Harding et al., 2015). Although these trials have shown that glutaminase inhibition can slow tumor growth, it has become clear that a more robust effect on tumor growth is needed for clinical efficacy. Targeting this metabolic pathway might be improved by understanding how cancer cells compensate for loss of glutaminase activity. Although a recent study has provided a broad metabolic profile of potential upregulated pathways upon glutaminase inhibition, the exact compensatory mechanism and causes of the resistance are still unknown (Biancur et al., 2017).
In this study, we sought to expand our knowledge of glutamine metabolism beyond glutaminolysis and seek additional metabolic pathways that cancers may utilize to resist current treatments. To achieve these goals, we employed mass-spectroscopy-based stable isotope-resolved metabolomics (SIRM) with 13C5 15N2-labeled-glutamine, which allowed us to precisely identify the metabolites produced from glutamine both in vitro and in vivo. Interestingly, we observed significantly more production of the neurotransmitter metabolite, N-acetyl-aspartyl-glutamate (NAAG) from glutamine, in P493–6 MYC-transformed human B cells (MYC-ON) compared to MYC-OFF cells and also in human high-grade ovarian serous adenocarcinoma OVCAR4 tumors compared to low-grade primary OVCA tumors. Because NAAG is known as one of the most concentrated neurotransmitters found in the mammalian brain (Neale et al., 2000), we analyzed this metabolite in different grades of glioma and meningioma from patients and uncovered that NAAG concentrations in glioma grade IV (glioblastoma [GBM]) are significantly higher than in gliomas grade II or III and meningioma. The observation that NAAG concentrations are consistently elevated in higher grade cancers as compared to their lower-grade counterparts led us to investigate the mechanism behind NAAG’s influence on higher grade cancers. We unveiled NAAG as a glutamate reservoir in cancers expressing GCPII, the enzyme that hydrolyzes NAAG to glutamate and NAA, to store glutamate for later use when glutamate production from other sources is limited, such as upon glutaminase inhibition. This crucial role of NAAG has greatly reshaped our understanding of its significance in cancer.
RESULTS
NAAG Production from Glutamine Is Elevated in MYC-Transformed Human Lymphoma B Cells In vitro and in Human High-Grade Ovarian Serous Adenocarcinoma In vivo
We used mass-spectroscopy-based stable isotope-resolved metabolomics (SIRM) with 13C515N2-glutamine (m+7 or mass of the parent ions 13C515N2-glutamine equal to the mass [m] of 12C514N2-glutamine plus 7 more mass units due to 13C515N2-glutamine) to trace pathways beyond glutaminolysis that incorporate labeled glutamine in P493–6 MYC-transformed human Burkitt lymphoma B cells (MYC-ON). Consistent with our previous findings (Le et al., 2012), we found that 13C515N1-glutamate (m+6), the immediate product of fully labeled 13C515N2-glutamine (m+7), is more abundant in MYC-ON cells as compared to MYC-OFF cells (Figure S1A), with the same pattern and relative magnitude of isotopologues as we reported previously (Le et al., 2012). Most notably, we observed a marked increase in production of a wide range of isotopologues of the neurotransmitter metabolite NAAG and its precursor, NAA, in MYC-ON cells as compared to MYC-OFF cells (Figures 1A, 1B, S1B, and S1C). To identify and quantify precisely how NAAG isotopologues were produced from 13C515N2-glutamine, we tracked all the 13C and 15N isotopologues of NAAG (Figure S2). After 24 h of growing cells in fully labeled 13C515N2-glutamine in culture medium, the concentrations of (m+5) and (m+6) NAAG isotopologues were found to be the highest among all the labeled isotopologues (Figure 1A). Our labeling experiments indicate that the (m+5) NAAG isotopologue is produced from (m+5) glutamate reacting with (m+0) NAA isotopologue or (m+0) glutamate reacting with (m+5) NAA isotopologue. The (m+5) NAA isotopologue is formed by the reaction between (m+0) acetyl-coenzyme A (CoA) and (m+5) aspartate (Figures S1D and S2) that was previously produced by (m+6) glutamate through transaminase reactions. The (m+6) NAAG isotopologue could be generated either from fully labeled (m+6) glutamate reacting with (m+0) NAA or (m+6) NAA reacting with non-labeled (m+0) glutamate, but the latter possibility is less likely because a high concentration of fully labeled (m+6) glutamate was observed (Figures S1A and S2). As noted above, the (m+6) glutamate isotopologue is evidently formed through the glutaminolysis of fully labeled (m+7) glutamine, whereas (m+6) NAA is formed by (m+2) acetyl-CoA and (m+4) aspartate. We also discovered heavier (m+7 to m+11) NAAG isotopologues post-13C515N2-glutamine labeling, which were produced as a result of (m+6) glutamate (Figure S1A), reacting with (m+1, 2, 3, 4, and 5) NAA accumulating over time (Figure S1B). Also, the total concentrations of all isotopologues for NAAG and NAA (nmol/g cell weight) of MYC-ON cells were significantly higher than that of MYC-OFF cells (Figures 1B and S1C).
Figure 1. NAAG Concentration Is Consistently Higher in Higher Grade Cancers.

(A) Incorporation of 13C and 15N in NAAG from 13C515N2-glutamine in MYC-transformed human lymphoma B cells (MYC-ON and MYC-OFF P493). Cells were grown at 37°C in a 5% CO2 and 95% (vol/vol) air incubator in RPMI containing 10% fetal bovine serum (FBS) and 2 mM 13C515N2-glutamine instead of 12C514N2-glutamine. After 24 h, the cells were harvested and subjected to metabolic extraction for metabolomics analysis. NAAG intensities were converted into concentrations as described in the STAR Methods. NAAG isotopologue concentrations for MYC-ON are presented in red bars and MYC-OFF in blue bars.
(B) Total NAAG concentration for all isotopologues (NAAG labeled from glutamine labeled). The total NAAG concentrations of MYC-ON are presented as red bars and MYC-OFF as blue bars; n = 4 per group. The experiment was repeated three times with similar results.
(C) Total NAAG concentration for all isotopologues (NAAG labeled from glutamine labeled) in primary ovarian cancer and OVCAR4 tumors. Mice bearing the tumors were injected with 100 μL of 100 mM sterile-filtered 13C515N2-glutamine in PBS at three time points, 15 min apart via intraperitoneal administration. The tumors were then harvested at 1.5 h after the last injection. The total concentration of NAAG labeled for OVCAR4 is presented as red bars and primary OVCA as blue bars; n = 4 for primary OVCA and n = 5 for OVCAR4. The experiment was repeated twice with similar results.
(D) NAAG concentrations in brain tumors. Tumors of patients with meningioma (n = 53), grade II, III (n = 21), and IV (GBM; n = 51) gliomas were analyzed. NAAG concentrations of meningioma are shown as blue bars, grade II-III as light blue bars, and GBM as red bars.
Data are shown as mean ± SEM. *p < 0.05, **p < 0.01, and ***p < 0.001 (Student’s t test) where indicated. See also Figures S1, S2, S3A–S3C, and S4A.
Our finding of increased levels of NAAG and NAA in MYC-ON cells corroborates previous reports showing high expression of N-acetyl-aspartate L-glutamate ligase or N-acetyl-aspartylglutamate synthetase B (enzyme that produces NAAG) in Burkitt lymphoma (Barretina et al., 2012). The MYC-transformed P493 model has been extensively used to compare cancer growth between MYC-ON and MYC-OFF models (Gao et al., 2007; Le et al., 2010; Schuhmacher et al., 1999). Indeed, we observed an increase in cell number in P493–6 MYC-ON cells compared to the MYC-OFF cells (Figure S1E). Of note, we chose to present the concentrations as nmol/g cell weight for direct comparison of glutamate and aspartate labels originating from 13C515N2-glutamine with those of our previously published work (Le et al., 2012). Although these in vitro studies of MYC-ON and MYC-OFF cells provided an important observation of increased levels of NAAG in aggressive lymphoma, the transition of this model into in vivo studies is unfeasible because MYC-OFF cells cannot form tumors (Gao et al., 2007; Le et al., 2010; Schuhmacher et al., 1999). To explore the relevance of NAAG on tumor growth in vivo, we injected 13C515N2-glutamine into mice bearing tumors of the human high-grade ovarian serous adenocarcinoma OVCAR4 and low-grade primary OVCA tumors in vivo. Of note, OVCAR4 tumors grow significantly faster than primary OVCA tumors in vivo (Figure S3A), and we once again observed that the total concentration of NAAG labeled from 13C515N2-glutamine was significantly higher in OVCAR4 than in primary OVCA tumors (Figure 1C).
NAAG Concentrations Are Consistently Higher in Higher Grade Brain Cancers
Given that NAAG is one of the neurotransmitters found at highest concentrations in the mammalian brain (Neale et al., 2000), we then analyzed this metabolite in patient samples of malignant glioma and in meningioma, a slow-growing tumor of meningothelial cell origin. Using samples from both the University of São Paulo and the Johns Hopkins Hospital, our metabolomics analysis found that NAAG concentrations were significantly higher in the 51 samples of GBM (or glioma grade IV) than in the 21 samples of glioma grade II or III or the 53 meningioma tumor samples (Figure 1D). Moreover, the NAAG concentrations in these glioma tumor samples were inversely and significantly correlated with patient survival time (Figure S3B).
Collectively, our findings show a consistent pattern of higher NAAG concentrations in higher grade tumors. Specifically, higher levels of NAAG were observed in MYC-ON lymphoma, OVCAR4, and glioma grade IV than in MYC-OFF lymphoma, primary OVCA, and less-aggressive low-grade gliomas and meningiomas.
NAAG Concentrations in Plasma Mirror Tumor Growth In vivo
We next questioned whether systemic NAAG levels in human patients correlate with tumor grades in those patients. Measuring concentrations of NAAG in plasma samples of brain tumor patients showed that NAAG plasma levels in GBM patients were significantly higher than those of glioma II or III and meningioma patients (Figure S3C). Further exploring a possible role for NAAG levels to monitor tumor growth in vivo, we measured NAAG in MYC-inducible human P493–6 cells, where MYC is abundantly expressed in rapidly growing tumors in the absence of doxycycline but suppressed during doxycycline treatment, leading to dramatically decreased tumor growth (Gao et al., 2007; Le et al., 2010; Schuhmacher et al., 1999). We found that NAAG concentrations in plasma of mice bearing MYC-transformed P493–6 tumors strongly reflected tumor growth affected by doxycycline treatment (Figures S3D and S3E). Notably, there was a prompt rise in NAAG concentrations in blood plasma when MYC was activated, followed by a spike in the size of tumors (Figure S3E). When mice bearing tumors were exposed to doxycycline to suppress MYC, we observed rapid decreases in NAAG levels followed by decreases in tumor sizes. Then, when doxycycline was removed from these mice, levels of NAAG in plasma increased once again. Consistently, we found that changes in plasma NAAG concentrations could be measured before corresponding changes in tumor sizes could be detected. In compliance with the Johns Hopkins University Animal Care and Use Committee guidelines, the experiment was terminated after 7 weeks to prevent tail vein damage due to blood draws. These findings strongly link plasma concentrations with tumor growth rates and suggest that measurements of NAAG in peripheral blood should be further explored for timely monitoring of tumor growth during cancer treatment. This result is not considered to be a finding of a diagnostic biomarker but rather a valuable foundation to pave the way for non-invasive assessments for tumor progression.
NAAG Increases Tumor Weights and Glutamate Concentrations In vivo
Our studies across three different cancer types show that NAAG concentrations are consistently elevated in higher grade cancers. To explore possible mechanisms for NAAG contributing to this metabolic alteration in cancer, we focused on our models for ovarian cancer, which include both the OVCAR4 cell line and orthotopic xenograft tumors from patient-derived recurrent ovarian cancer. Patient-derived recurrent OVCA orthotopic tumors, which were implanted in mouse ovaries to generate orthotopic tumors, have been shown to closely simulate the clinical, pathologic, genetic, and molecular aspects of OVCA (Shaw et al., 2004). We first sought to determine whether NAAG itself directly promotes cancer growth using intraperitoneal (i.p.) inoculations of NAAG at a dose used previously in neuropathology investigations (50 mg/kg via i.p. injection; Guo et al., 2015). We found that, after 12 days of daily i.p. injection, NAAG supplementation resulted in increased tumor weights of these recurrent OVCA orthotopic tumors compared to the vehicle control group (Figure 2A).
Figure 2. Effect of NAAG Supplementation on Tumor Weights and Glutamate Concentrations of Patient-Derived, Recurrent OVCA Orthotopic Tumors In vivo.

(A and B) The tumors were implanted in the right ovaries of the mice. 2 weeks post-implantation, the mice received 50 mg/kg NAAG every day via intraperitoneal (i.p.) injections for 12 days. The tumors were then harvested and weighed (A); n = 10 mice for each group; control presented as blue bars and NAAG supplemented as green bars. The glutamate concentrations (B) of the NAAG-supplemented group were compared to those of the vehicle control to determine the relative concentration difference.
(C and D) Enrichment of labeled (m+2) NAAG (C) and (m+1) glutamate (D) relative to endogenous (m+0) NAAG and (m+0) glutamate in vehicle control and 15N2-NAAG-supplentented tumors. Mice bearing tumors were supplemented with 15N2-NAAG or vehicle control via i.p. injections. Tumor metabolites were extracted at 2 h post-injection and analyzed using Q-TOF LC-MS. Data are shown as mean ± SEM (n = 4 per group). *p < 0.05 and **p < 0.01 (Student’s t test) where indicated.
(E) Illustration of 15N2-NAAG hydrolysis to 15N1-NAA and 15N1-glutamate via GCPII.
(F) Western blot on protein extracted from lymph node carcinoma of the prostate (LNCaP) cells (positive control) and patient-derived rec-OVCA for expression level of GCPII. Tubulin served as a loading control.
Next, we investigated the specific mechanism of NAAG’s activity in promoting tumor growth. We hypothesized that the mechanism by which NAAG promotes tumor growth could be due to its hydrolysis to provide glutamate. Thus, we assessed glutamate concentrations in tumor tissues and compared concentrations of glutamate in tumors across treatment groups. We found that glutamate concentrations of the NAAG-supplemented tumors were significantly higher in NAAG-supplemented animals than in vehicle-treated animals (Figure 2B), suggesting that NAAG promotes tumor growth by providing glutamate.
Note that, due to the location of the tumors in ovaries of the mice (orthotopic model), we were only able to assess tumor weights at the end of the experiment after extracting tumors from the ovaries.
NAAG Generates Glutamate in Tumors In vivo
In order to conclude that glutamate is truly originating from NAAG, we injected 15N2-labeled-NAAG (m+2, or mass of the parent ions 15N2-NAAG equal to the mass (m) of 14N2-NAAG plus 2 more mass units due to 15N2) at the same dose as the efficacy study (50 mg/kg) via i.p. administration and followed the labeled glutamate, which is (m+1) glutamate, because glutamate contains 15N1 from 15N2-NAAG. Orthotopic tumor metabolites were extracted 2 h post-injection and analyzed using quadrupole time-of-flight liquid chromatography-tandem mass spectrometry (LC-MS/MS). We first confirmed that 15N2-NAAG was indeed present in the tumors (Figure 2C) and directly hydrolyzed to 15N1-glutamate in vivo (Figures 2D and 2E) in the 15N2-NAAG-supplemented group. We also confirmed the presence of GCPII in this tumor via western blot analysis (Figure 2F). The presence of labeled (m+1) glutamate in 15N2-NAAG-supplemented tumors, which is undetectable in the vehicle control tumors, convincingly demonstrates the presence of glutamate originating from NAAG in these tumors.
NAAG Increases Tumor Weights and Glutamate Concentrations through a GCPII-Dependent Pathway
Knowing that NAAG supplementation results in an increase in tumor weights and glutamate concentrations, we examined whether NAAG promotes tumor growth via GCPII. To this end, we knocked down the expression of GCPII using lentivirus carrying shGCPII vector on OVCAR4 cells and established xenograft tumors by inoculating 5 × 10⁶ GCPII-knockdown (KD) OVCAR4 cells (Figures 3A and 3B) into the back of mice. In the absence of treatment, each 100 mm3 OVCAR4 tumor contains approximately 400–1,000 μM NAAG (Figure S4A), and to compare NAAG metabolism in NAAG-supplemented tumors to that in non-supplemented tumors with normal NAAG levels, we supplemented NAAG via direct intra-tumoral (IT) injection. To achieve a physiologically relevant level of NAAG in these tumors, we injected approximately 100 mm3 OVCAR4 xenograft tumors (both shControl and shGCPII-KD) with 500 μM NAAG via direct IT injections, and we compared tumor weights to those of control injected with saline. Although we once again observed that NAAG supplementation caused an increase in tumor weights from the wild-type clone infected by shControl lentivirus, this effect of NAAG supplementation was abolished in shGCPII-KD tumors (Figure 3C). These results strongly support our conclusion that NAAG promotes tumor growth in vivo through a GCPII-dependent pathway. Moreover, the knockdown of GCPII significantly decreased tumor weights as compared to those of the wild-type control tumors (Figure 3C). NAAG supplementation also increased glutamate concentrations in tumors formed from the wild-type clone infected by the shControl lentivirus (Figure 3D). In addition to changes in levels of glutamate, levels of NAA (another product of NAAG hydrolysis; Figure S2), aspartate (which was from NAA hydrolysis; Figure S2), and NAAG also increased in NAAG-supplemented shControl tumors over the 12 days of treatment (Figures 3E–3G).
Figure 3. Effect of NAAG Supplementation on Tumor Weights and Glutamate Concentrations of shControl and shGCPII-OVCAR4 Xenograft Tumors.

(A) Western blot on protein extracted from prostate cancer LNCaP cells (positive control) and parental-OVCAR4, primary OVCA.
(B) shGCPII-OVCAR4, prostate cancer LNCaP cells (positive control), and shControl-OVCAR4 clones for expression level of GCPII. Tubulin served as a loading control.
(C) Effect of NAAG supplementation on tumor weights and glutamate concentrations of shControl and shGCPII-OVCAR4 xenograft tumors. 5 × 10⁶ OVCAR4 cells were subcutaneously injected in the flank of the mice to generate xenograft tumors. Once tumors reached an approximate volume of 100 mm3 (2 weeks post-injection), each tumor received either 100 μL of 500 μM NAAG or saline every other day for 12 days. At the end of the treatment, the tumors were harvested and weighed (n = 4 for shControl saline, n = 3 for shControl NAAG, n = 9 for shGCPII saline, and n = 12 for shGCPII NAAG). The experiment was repeated twice with similar results.
(D–G) Comparison of glutamate (D), NAA (E), aspartate (F), and NAAG (G) concentrations between shControl OVCAR4 xenograft tumors supplemented with NAAG or with saline. The tumors were harvested and subjected to metabolic extraction and analysis. The intensities of glutamate and NAA were converted into concentration as described in the STAR Methods. The tumor concentrations of glutamate (D), NAA (E), aspartate (F), and NAAG (G) in the shControl-NAAG were compared to those of shControl-saline to determine the relative concentration difference. The data are presented for vehicle control as blue bars and the NAAG supplemented as green bars.
Data are shown as mean ± SEM (n = 9 for each group). *p < 0.05, **p < 0.01, and ***p < 0.001 (Student’s t test) where indicated. See also Figure S4A.
Of note, the supplementations of exogenous NAAG were proof-of-concept experiments to determine whether NAAG had direct effects on cancer growth and were not meant to link to therapeutic potential. Supplementing NAAG via i.p. in an orthotopic model (section above) and via IT in a xenograft model (this section) led to similar results in terms of tumor weights.
Inhibition of GCPII Reduces Tumor Weights and Glutamate Concentrations
Our findings that NAAG directly promotes ovarian tumor weight and glutamate production in vivo through a GCPII-dependent pathway led us to investigate the therapeutic potential of this target. We chose 2-phosphonomethyl-pentandioic acid (2-PMPA), which is a potent and selective GCPII inhibitor in vivo (Jackson et al., 1996) and has been found to effectively diminish the amount of glutamate released from NAAG in vivo during ischemic injury (Slusher et al., 1999). Using a previously reported dosing regimen for 2-PMPA (50 mg/kg; Guo et al., 2015), we treated patient-derived, recurrent OVCA orthotopic tumors that express GCPII (Figure 2F), as it is a clinically relevant model (Shaw et al., 2004). 4 weeks of 2-PMPA treatment resulted in a decrease in tumor weights (Figure 4A) and glutamate concentrations (Figure 4B) in the treated group compared to the vehicle control. We confirmed the presence of 2-PMPA in the treated tumors by mass spectrometry (Figure 4C). Notably, mice treated with 2-PMPA did not lose weight, and hematology and blood chemistry assessment did not show signs of toxicity in blood cell counts or liver and kidney function (Figure S5).
Figure 4. Effect of Inhibition of GCPII by 2-PMPA on Tumor Weights and Glutamate Concentrations of Patient-Derived, Recurrent OVCA Orthotopic Tumors.

(A and B) Mice bearing the tumors were treated daily with 50 mg/kg 2-PMPA by i.p. administration for 28 days. The tumors were then harvested, weighed (A), and subjected to metabolic extraction and analysis. The glutamate concentrations (B) of the 2-PMPA-treated group were compared to those of the control group to determine the relative concentration difference; n = 9 per group. The experiment was repeated three times with similar results.
(C) 2-PMPA concentration of control and 2-PMPA-treated groups.
(D) Effect of glutaminase inhibition by BPTES on cell numbers of shControl and shGCPII OVCAR4 cells in vitro. Cells were grown at 37°C in a 5% CO2 and 95% (vol/vol) air incubator in RPMI containing 10% FBS and 0.5 μg/mL puromycin. After 24 h, cells were treated with vehicle control (DMSO) or 10 μM BPTES. Cell numbers were assessed the following day using a hemocytometer for a period of 4 days; n = 4 per group.
(E) Comparison of glutamate concentrations between shControl and shGCPII OVCAR4 cells with and without glutaminase inhibitor, BPTES, in vitro. Cells were grown in 10-cm dishes at 37°C in a 5% CO2 and 95% (vol/vol) air incubator in RPMI containing 10% FBS and 0.5 μg/mL puromycin. After 24 h, cells were treated with vehicle control (DMSO) or 10 μM BPTES. Cells were harvested and subjected to metabolic extraction and analysis. The glutamate concentrations of shGCPII cells treated with DMSO or BPTES and shControl treated with BPTES were compared to those of the shControl-DMSO group to determine the relative concentration difference. The data are shown as mean ± SEM (n = 8 per group). **p < 0.01 and ***p < 0.001 (Student’s t test) where indicated. See also Figures S4B, S4C, S5, and S6A–S6D.
Targeting GCPII and Glutaminase Inhibition Accentuates Reduction of Both Glutamate Concentrations and Cancer Growth
Because recent clinical trials of inhibition of glutaminase (the enzyme that converts glutamine to glutamate) did not reduce tumor growth to the extent desired (Harding et al., 2015), we sought to determine whether pharmacologically reducing glutamate production from both sources (glutamine and NAAG; Figure S4B) would lead to a more substantial tumor reduction. Using our previously reported dose of BPTES (bis-2-(5-phenylacetamido-1,3,4-thiadiazol-2-yl)ethyl sulfide), a specific glutaminase inhibitor that inhibits the conversion of glutamine to glutamate in vitro (Elgogary et al., 2016), we found the greatest decreases in OVCAR4 cell numbers were shGCPII-KD cells treated with BPTES (Figure 4D). We also observed that numbers of shGCPII-KD cells were much lower than those of their respective wild-types (WTs) transfected with lentivirus control plasmid (Figure 4D). We obtained essentially the same result after knocking down the GCPII gene in this cell line using CRISPR technology (Figures S6A–S6C). Cellular metabolic analysis correspondingly showed the lowest level of glutamate in the BPTES-treated shGCPII-OVCAR4 group compared to any other groups (Figure 4E). Glutamate concentrations of the shGCPII-KD cells treated with DMSO were found to be lower than those of shControl cells treated with DMSO (Figure 4E).
In our previous study, glutamate supplementation rescued cell growth inhibition by BPTES (Elgogary et al., 2016). In this study, the same supplementation of glutamate was able to restore cell numbers in treated cultures of the GCPII-KD clone (Figure S6D), providing further evidence that GCPII supports OVCAR4 cell growth by supplying glutamate. Lower cell numbers and glutamate concentrations in the shGCPII-KD cells treated with BPTES compared to those in shControl treated with BPTES demonstrate a growth advantage when cells have GCPII to partially compensate for the decrease in glutamate caused by glutaminase inhibition.
Previously, we demonstrated that pancreatic cancer cells were also sensitive to BPTES in vitro (Elgogary et al., 2016). In our current study, we assessed the expression of GCPII in all eight pancreatic cancer cell lines (A32, E3, P198, A6L, P8, P10, P215, and JD13D) and found that P198 cells express high levels of GCPII protein (Figure S6E). We knocked down the GCPII gene in the pancreatic cancer P198 cells, using both short hairpin RNA (shRNA) lentivirus and CRISPR technology. The shGCPII-KD and CrisprGCPII-KD cells treated with BPTES both displayed significantly decreased cell proliferation when compared to their corresponding untreated control cells (Figures 5A and S7A–S7E). Metabolic assessment showed that CrisprGCPII-KD cells treated with BPTES had the lowest intracellular glutamate concentration as compared to any other groups (Figure 5B). In addition, glutamate concentrations in the CrisprGCPII cells treated with DMSO were lower than those of the CrisprControl cells treated with DMSO (Figure 5B).
Figure 5. Effect of Targeting GCPII and Glutaminase Inhibition Accentuates the Reductions of Cancer Growth and Glutamate Concentrations.

(A) The CrisprControl and CrisprGCPII-P198 cells (D8) were grown at 37°C in a 5% CO2 and 95% (vol/vol) air incubator in DMEM containing 10% FBS. After 24 h, cells were treated with vehicle control (DMSO) or 10 μM BPTES as shown. Cell numbers were assessed daily using a hemocytometer for a period of 4 days; n = 4 per group.
(B) Comparison of glutamate concentrations between CrisprControl and CrisprGCPII-P198 pancreatic cancer cells with and without glutaminase inhibitor, BPTES, in vitro. Cells were grown in 10-cm dishes at 37°C in a 5% CO2 and 95% (vol/vol) air incubator in DMEM containing 10% FBS. After 24 h, cells were treated with vehicle control (DMSO) or 10 μM BPTES. Cells were harvested and subjected to metabolic extraction and analysis. The glutamate concentrations of CrisprGCPII cells treated with DMSO or BPTES and CrisprControl cells treated with BPTES were compared to that of the CrisprControl DMSO group to determine the relative concentration difference; n = 8 per group.
(C) Western blot on protein extracted from patient-derived pancreatic tumors (JHU094) for expression level of GCPII and of glutaminase (GLS). Protein extracted from prostate cancer cells (LNCaP) and pancreatic cancer cells (P198) were used as positive controls for GCPII and glutaminase, respectively. Tubulin served as a loading control.
(D and E) Effect of 2-PMPA and CB-839 on tumor weights (D) and glutamate concentrations (E) of the patient-derived pancreatic cancer (JHU094) orthotopic tumors. Mice bearing the tumors were divided into four groups: vehicle control; 50 mg/kg 2-PMPA via i.p. injection; 200 mg/kg CB-839 via oral gavage twice daily (BID); and 2-PMPA plus CB-839 (combo group) for a period of 28 days. Each group’s tumors were harvested, weighed, and subjected to metabolic extraction and analysis. The glutamate concentrations of 2-PMPA-treated, CB-839-treated, and combo groups were compared to those of the control to determine the relative glutamate concentration difference. Data are shown as mean ± SEM (n = 10 for each group). The experiment was repeated three times with similar results. (F) Assessment of 2-PMPA levels in the tumors. The data are shown as mean ± SEM (n = 10 for each group).
NS, no significant difference; *p < 0.05, **p < 0.01, and ***p < 0.001 (Student’s t test) where indicated. See also Figures S4B, S6E, S7, S8, and S9.
The positive outcome of our combined targeting of both glutaminase and GCPII in vitro led us to translate our results into an in vivo model. Because the recurrent OVCA tumors express a very low level of glutaminase (Figure S4C), inhibiting glutamate production from both sources (glutamine and NAAG; Figure S4B) by glutaminase and GCPII inhibition was not achievable. Therefore, we chose patient-derived pancreatic orthotopic tumors (JHU094), which express both glutaminase and GCPII (Figure 5C), to treat with both glutaminase and GCPII inhibitors. Specifically, we treated mice with JHU094 orthotopic tumors with oral 200 mg/kg CB-839 (a glutaminase inhibitor currently in clinical trials; Harding et al., 2015) twice daily and 50 mg/kg 2-PMPA daily via i.p. injection. With this dosing regimen, we found a significant decrease in tumor weights with 2-PMPA or CB-839 treatment alone, compared to vehicle control (Figure 5D), and an even greater decrease in tumor weights in 2-PMPA and CB-839 combination treatment when compared to either treatment alone (Figure 5D). Aligning with the tumor reduction effect of the GCPII (2-PMPA) and glutaminase (CB-839) inhibitors, metabolic analysis of tumors in this experiment showed the lowest level of glutamate in tumors from animals treated with the combination of agents compared to either 2-PMPA or CB-839 alone or control animals (Figure 5E). We also confirmed the presence of 2-PMPA in the treated tumors using metabolomics analysis (Figure 5F). These results confirmed the role of GCPII in compensating for the depletion of glutamate caused by glutaminase inhibition. Moreover, mice treated with 2-PMPA alone (Figure S8) or in combination with CB-839 (Figure S9) did not lose weight or show signs of toxicity in blood cell counts or liver and kidney function.
Because the patient-derived, recurrent OVCA and pancreatic orthotopic tumors often exceed 2,000 mm3 before causing death (the size limit allowed by our Animal Care and Use Committee), we were unable to confirm that the lifespan of animals with tumors was extended by the treatment. However, because 2-PMPA showed a robust effect on reducing the tumor weights in patient-derived orthotopic models of both recurrent ovarian cancer and pancreatic cancer, this strongly suggests that GCPII is a viable target for cancer therapy, particularly in combination with glutaminase inhibition.
DISCUSSION
NAAG has been widely studied in many different neurological disorders, traumatic brain injuries, inflammatory pain, diabetic neuropathy, and amyotrophic lateral sclerosis, due to its high abundance in the mammalian CNS (Carpenter et al., 2003; Yamamoto et al., 2008; Zhong et al., 2005, 2006; Zhou et al., 2005). These studies found that inhibition of NAAG hydrolysis via a GCPII inhibitor subsequently suppresses glutamate release, which, if excessive, has been shown to cause neurological disorders (Whelan, 2000; Zhou et al., 2005). However, its role in cancer has been generally overlooked thus far. Only a few studies have hinted at a possible role for NAAG in cancer, showing that NAA and NAAG inhibit differentiation of glioma stem-like cells (Long et al., 2013) and a metabolomics profiling study showing NAA and NAAG intensities were higher in metastatic OVCA as compared to primary OVCA or normal ovary (Fong et al., 2011). Although the study in OVCA observed elevated intensities of NAA and NAAG in metastatic OVCA by global metabolomics profiling (Fong et al., 2011), the exact role of these metabolites has yet to be determined.
In this study, with the use of 13C515N2-labeled glutamine, we observed that 13C515N2-labeled glutamine produces a wide range of NAAG isotopologues and its precursors: NAA and glutamate. The NAAG production from glutamine is consistently more elevated in MYC-ON lymphoma and OVCAR4 compared to MYC-OFF lymphoma and primary OVCA. We analyzed this metabolite in different grades of glioma and meningioma from patients and uncovered that NAAG concentrations in glioma grade IV (GBM) are significantly higher than in gliomas grade II or III and meningioma. These findings corroborate previous reports showing that high expression of N-acetyl-aspartate L-glutamate ligase or N-acetyl-aspartyl-glutamate synthetase A and B (enzyme to produce NAAG) is associated with a shorter survival time of cancer patients (Gyorffy et al., 2012). Furthermore, we uncovered a prognostic potential of NAAG due to its consistently elevated concentrations in both tumors and plasma of patients with higher grade brain tumor. Interestingly, NAAG concentration was also found to strongly reflect tumor size in vivo, and the increase in NAAG concentration occurred before the increased tumor sizes were detected. These findings suggest that a non-invasive assessment of NAAG in plasma has the potential for use as a metabolite monitor for cancer progression, whereby NAAG concentration spikes can be detected in advance of any surges in tumor growth.
Our next question was why higher grade or more aggressive cancer cells produced more NAAG, which prompted us to investigate the mechanistic action of NAAG. In order to grow substantially, higher grade cancer cells must be able to supply additional metabolites for bioenergy and synthesize the necessary biosynthetic precursors of proteins, nucleic acids, and membrane lipids. Previous studies by us and others have found that glycogen production is increased in many tumor cells, providing these cells with the ability to store glucose and thus resist metabolic deprivation in the harsh tumor microenvironment (Elgogary et al., 2016; Pelletier et al., 2012). In this study, we revealed that, similarly, NAAG production is consistently elevated in higher grade cancers to store glutamate for later use when glutamate production from other sources is limited. Specifically, in the context of adding exogenous NAAG, we found that NAAG increased tumor weights and tumor glutamate concentrations in vivo. Importantly, using 15N2-labeled NAAG via i.p. injection, we confirmed that 15N2-NAAG indeed was present in the tumors and directly hydrolyzed to 15N1-glutamate in vivo in the 15N2-NAAG-supplemented group. In the context of endogenous NAAG degradation, we showed evidence that NAAG production serves to store glutamate for later use when glutamate production from other sources is limited. Using BPTES, a specific glutaminase inhibitor that inhibits the conversion of glutamine to glutamate in vitro (Elgogary et al., 2016) as a way to reduce glutamate production, we found the greatest decreases in cell numbers were shGCPII-KD cells treated with BPTES. Lower cell numbers and glutamate concentrations in shGCPII-KD cells treated with BPTES compared to those in shControl treated with BPTES suggests a growth advantage when cells have GCPII to partially compensate for the decrease in glutamate caused by glutaminase inhibition. Similarly, we found a greater decrease in tumor weights and glutamate concentrations in 2-PMPA (GCPII inhibitor) and CB-839 (glutaminase inhibitor in vivo) treatment compared to either treatment alone in vivo. Moreover, we were able to restore cell numbers in the GCPII-KD group by glutamate, providing further evidence that GCPII supports OVCAR4 cell growth by supplying glutamate. Glutamate, in turn, provides nitrogen for nucleobase synthesis and carbon for TCA cycle processing, lipid synthesis, and nucleotide synthesis necessary for cell growth (Hensley et al., 2013). Moreover, as mentioned above, the excessive availability of glutamate would intoxicate cells (Whelan, 2000), explaining the need to store glutamate in NAAG, which can later be broken down, when needed, to satisfy the high energy demand of higher grade cancers. In light of these findings, we revealed that NAAG can provide glutamate to a subgroup of cancers that express GCPII, supporting tumor growth. We recognized that the hydrolysis of NAAG also provides NAA, which in turn generates aspartate and acetyl-CoA. These also play important roles in cancer growth but were not the focus of our current study.
We also demonstrated that inhibition of NAAG hydrolysis to suppress glutamate production through a GCPII inhibitor is a viable target for cancer therapy. GCPII is also known as N-acetyl-L-aspartyl-L-glutamate peptidase I (NAALADase I) or NAAG peptidase (Pinto et al., 1996), and its increased expression was found in poorly differentiated, metastatic, and hormone-refractory prostate cancers (Bouchelouche et al., 2010; Ross et al., 2003) or associated with higher tumor grading (G3/G4) of non-small-cell lung cancer (Schmidt et al., 2017). 2-PMPA, a potent and selective inhibitor of GCPII (Jackson et al., 1996), has been found to effectively diminish extracellular glutamate directly by reducing the amount of glutamate released from the NAAG hydrolysis reaction in in vitro and in vivo models of stroke (Slusher et al., 1999; Tsukamoto et al., 2005). Although there now exist numerous inhibitors with various forms and efficacies, 2-PMPA is the first selective GCPII inhibitor, as well as the one with the greatest binding affinity (Zhou et al., 2005). Hence, we selected 2-PMPA for this study, not only because it has the greatest binding affinity but also because it is the most extensively used inhibitor and has been shown to be effective in several in vivo models (Baslow et al., 2005; Harada et al., 2000; Zhou et al., 2005). Taking advantage of the availability of 2-PMPA, our study demonstrated the efficacy of this inhibitor in diminishing tumor growth of patient-derived, recurrent OVCA and pancreatic cancer orthotopic tumors. Importantly, in the pancreatic cancer model expressing both GCPII and glutaminase, the combination of 2-PMPA and CB-839, a glutaminase inhibitor currently undergoing clinical trials (Harding et al., 2015), results in a significant decrease in tumor weights as compared to either treatment alone. Thus, these findings suggest that the GCPII inhibitor could be valuable in developing anticancer agents.
However, not all cancer cells express GCPII (even within the same cancer type). Our findings of the role of NAAG as a glutamate provider are only applicable to GCPII-positive cancers. For the GCPII-negative cancers, we suspect that NAAG could be taking on another role to promote cell growth through an alternative pathway in these GCPII-negative cells, thereby precluding the role of NAAG as a glutamate provider. NAAG is known to activate the metabotropic glutamate receptor (mGlu3) (Fricker et al., 2009; Wroblewska et al., 1997, 1998), and previous studies have shown that mGlu3 expression is associated with glioma growth and poor GBM survival rates (Arcella et al., 2005; Aronica et al., 2003; Brocke et al., 2010; Ciceroni et al., 2008, 2013; D’Onofrio et al., 2003; Stepulak et al., 2009; Zhou et al., 2014). The alternative pathway could be achieved through NAAG acting as an agonist to mGlu3 receptors. We have not deeply explored exactly how NAAG promotes cancer cell growth through this pathway, which will be the focus of our future work.
In conclusion, the neurotransmitter NAAG was found to be elevated in higher grade cancers and strongly mirrored tumor sizes in vivo, making NAAG a potential metabolite monitor for cancer progression, whereby NAAG concentration spikes can be detected in advance of any surges in tumor growth. Importantly, we uncovered that NAAG serves as an important reservoir to provide glutamate to cancer cells through GCPII when glutamate production from other sources is limited. GCPII was thus identified as a viable target for cancer therapy, either alone or in combination with glutaminase inhibition. Together, these results exhibit the multi-faceted roles of NAAG in cancer, which can be exploited to improve patients’ clinical outcomes.
STAR★METHODS
CONTACT FOR REAGENT AND RESOURCE SHARING
Further information and requests for resources and reagents should be directed to and will be fulfilled by the Lead Contact, Anne Le (annele@jhmi.edu).
EXPERIMENTAL MODEL AND SUBJECT DETAILS
Cell Lines and Patient-Derived Tumors
Prostate cancer (LNCaP) cell line, which was used as a GCPII-positive control for Western Blot was purchased from ATCC. MYC-transformed human lymphoma B cells (P493) were given by Dr. Chi Dang’s laboratory (Ludwig Institute for Cancer Research in New York). All pancreatic cancer cells (A32, E3, P198, A6L, P8, P10, P215, and JD13D) and patient-derived pancreatic cancer JHU094 tumors were obtained from PancXenoBank of Division of Gastrointestinal and Liver Pathology, Department of Pathology, Johns Hopkins School of Medicine, IRB number NA_00001584. Dr. Tian-Li Wang (Johns Hopkins School of Medicine) provided all the ovarian cancer cell lines (primary OVCA, OVCAR4), and patient recurrent-OVCA. Cell line authentication was performed by Dr. Tian-Li Wang’s laboratory (Yu et al., 2015). P493–6 authentication was characterized by Dr. Chi Dang’s laboratory (Gao et al., 2007). Pancreatic cancer cell line authentication was done by PancXenoBank of Division of Gastrointestinal and Liver Pathology. Mycoplasma contamination was done by Fragment Analysis Facility (Johns Hopkins University School of Medicine) and other bacteria using Molecular Probes Cell Culture Contamination Detection Kit (from ThermoFisher). None of the cell lines used are classified as commonly misidentified lines. Cells were grown in Roswell Park Memorial Institute medium (RPMI) (for LNCaP, P493, OVCA, and OVCAR4) or Dulbecco’s Modified Eagle medium (DMEM) (for A32, E3, P198, A6L, P8, P10, P215, and JD13D) supplemented with 10% (vol/vol) fetal bovine serum (FBS), 1% (vol/vol) penicillin-streptomycin at 37°C with 5% CO2.
Mice and Mice Housing
Johns Hopkins University Animal Care and Use Committee approved our animal study protocol, which is compliant with the Association for Assessment and Accreditation of Laboratory Animal Care guidelines. Female four-week-old Foxn1nu athymic nude mice (Envigo) weighing 22 g were used to generate OVCAR4 xenograft tumors and patient-derived recurrent ovarian cancer orthotopic tumors. Male or female four-week-old Foxn1nu athymic nude mice (Envigo) weighing 22 g were used to generate patient-derived pancreatic cancer JHU094 orthotopic tumors. These athymic nude mice also carry the following characteristics: albino coat, litter average of 7, the nu allele on chromosome 11 is an autosomal recessive mutation, dysfunctional rudimentary thymus, phenotypically hairless, T cell deficient, B cells function normal, no generation of cytotoxic effector cells, no graft versus host response, Foxn1nu heterozygotes do not show partial expression of the nu phenotype per manufacture’s information. Male four-week old SCID C.B-17/Icr mice (Envigo) weighing 22–24 g for Human Lymphoma B (P493) tumors were used. These SCID C.B-17/Icr mice also have the following characteristics: albino coat, auto-recessive, single-nucleotide polymorphism within Prkdc gene on chromosome 16, severe combined immunodeficiency affecting T- and B cell development, Natural Killer (NK) cell, macrophage, and granulocyte cell numbers and function are normal per manufacture’s information.
Clinical Samples
48 glioblastoma, 9 glioma grade II, 12 glioma grade III, and 48 meningioma patient tumor samples, and plasma samples of GBM (n = 30), AGII-III (n = 9), and meningioma (n = 46) were obtained from the Department of Neurology, School of Medicine, University of São Paulo, Brazil. In addition, 3 glioblastoma tumor samples, 5 meningioma tumor samples and 8 plasma samples of GBM patients, 5 plasma samples of meningioma were obtained from Dr. Kaisorn Chaichana at the Johns Hopkins School of Medicine, Baltimore, MD, immediately post-surgical removal and were then stored in liquid nitrogen until metabolomics assessment. These samples were obtained through an IRB number IRB00089468 approved by the Office of Human Subjects Research Institutional Review Boards at Johns Hopkins School of Medicine. This type of IRB means that our research does not constitute research involving human subjects as the specimens are not individually identifiable and are therefore exempt.
METHOD DETAILS
Metabolomics Analysis of P493 Cells in vitro
MYC-transformed human lymphoma B model, P493 cells (Altman et al., 2015; Le et al., 2010, 2012) were cultured in 10 cm dishes in RPMI 1640 supplemented with 10% (vol/vol) dialyzed FBS and 1% (vol/vol) penicillin-streptomycin (full RPMI). These cells had been transformed by a tetracycline-repressible MYC construct for which tetracycline treatment in vitro at 0.1 μg/mL concentration resulted in MYC suppression; lack of this treatment led to MYC expression. After initial seeding of 150,000 cells/mL, cells were grown with full RPMI as described above, but normal 12C514N2-glutamine was replaced by uniformly fully labeled-13C515N2-glutamine (m+7 glutamine). Cells were harvested at 24 hours for both the MYC-ON and MYC-OFF conditions (n = 4 per group). The collected cells were centrifuged and washed with phosphate buffered saline (PBS) to remove media. In order to maintain the integrity of biochemicals and maximize extraction efficiency, frozen cell pellets were subjected to metabolite extraction using 80% HPLC-grade methanol (Fisher Scientific) diluted with 20% mass-spec (MS)-grade water as previously described (Elgogary et al., 2016). The methanol-water mixture was evaporated using a speed vacuum and then a lyophilizer. The lyophilized metabolites were then resuspended in 50% (vol/vol) acetonitrile diluted with MS-grade water and analyzed via LC-MS. Metabolomics data from these samples were acquired using an Agilent 6545 Quadrupole–Time-of-Flight (Q-TOF) mass spectrometer with an Agilent 1260 HPLC at our own Metabolomics Facility at Johns Hopkins Medical Institutions.
The Agilent 1260 HPLC-autosampler system was used to uptake 2ul of samples. To keep compounds in a stable environment, sampler temperature was kept at 4°C. Reverse phase chromatography was used where mobile aqueous phase was 0.1% formic acid in MS-grade water, and mobile organic phase was 98% acetonitrile with 0.1% formic acid. The total runtime was 50 minutes. A Discovery® HS F5 HPLC Column (3μm particle size, L × I.D. 15 cm × 2.1 mm, Sigma) and a suitable guard column (Sigma) were used and maintained at 35°C. The flow rate gradient was as follows: 0.15 mL/min until 27 minutes, 0.15 to 0.3 mL/min after 27 minutes, 0.3 mL/min until 47 minutes, 0.3 to 0.15 mL/min after 47 minutes, 0.15 mL/min until 50 minutes. The mobile phase gradient was as follows: 100% aqueous phase for 6 minutes, 70% aqueous phase starting from 15 minutes, 50% aqueous phase starting from 19 minutes, 100% organic phase starting from 27 minutes until 35 minutes, back to 100% organic phase starting from 35 minutes until 50 minutes. Spectra were mass calibrated continuously with reference calibrant delivered via isocratic pump during data acquisition.
The Agilent 6545 Q-TOF mass spectrometer was equipped with a dual AJS ESI ion source with the following parameters: 10 L/min gas flow, 325°C gas temperature, 45 psig nebulizer pressure, 3500 V capillary voltage, 140 V fragmentor, 65 V skimmer, 750 V octo-pole RF peak, and 2μL injection volume. MS runs were operated with a scan rate of 1.5 spectra/s and 50–1700 m/z in both positive and negative modes. MS/MS runs were operated with an MS scan rate of 8 spectra/s, MS/MS scan rate of 4 spectra/s, 40–1700 m/z, and a fixed collision energy of 20V in both positive and negative modes.
In addition to Q-TOF which was primarily used for discovery and qualitative screening experiments, we also used a 6490 triple-quadrupole (QQQ) mass spectrometer to confirm the findings from discovery and qualitative screening experiments. The QQQ was equipped with an AJS ESI ion source with the following parameters: 17 L/min gas flow, 210°C gas temperature, 30 psi nebulizer pressure, 4000 V capillary voltage, 1500 VCharging, 380 V fragmentor, 3 V cell accelerator voltage, 350°C sheath gas heater, 12 L/min sheath gas flow, and 2μL injection volume. The QQQ was equipped with an ion funnel with the following parameters: 130 V positive high-pressure RF, 60 V positive low-pressure RF, 100 V negative high-pressure RF, and 40 V negative low-pressure RF.
Data were then analyzed using Agilent MassHunter, Agilent Mass Profiler Professional (MPP), and Agilent Qualitative and Quantitative Analysis Software packages to determine the metabolic profile of each sample. For 13C and 15N tracer analysis, metabolites were analyzed via Q-TOF and identified using in-house compound standards and MS/MS fragmentation data run under identical conditions. For quantification of unlabeled samples via QQQ, metabolites were identified by precursor/product ion transition at collision energy and ion polarity determined by in-house optimization. Peaks were integrated for raw intensities (ion counts). Along with the extracted metabolites, the purified standard of metabolites of interest were also assessed with the same instrument in the same run. The experiment was repeated three times with similar results.
Metabolomics Analysis of OVCA Tumors in vivo
We injected 13C515N2-labeled-glutamine into mice bearing primary-OVCA and OVCAR4 tumors to follow glutamine metabolism in vivo as previously described (Elgogary et al., 2016). Specifically, 100 μL of 100 mM sterile-filtered 13C515N2-glutamine in PBS was injected three times, 15 minutes apart, via intraperitoneal administration. Tumors (n = 4 for the OVCA group and n = 5 for the OVCAR4 group) were harvested 1.5 hours post-final injection and immediately snap frozen in liquid N2, homogenized at liquid N2 temperatures, and subjected to metabolite extraction (Elgogary et al., 2016). Metabolite data from these samples were acquired using the same technologies used for our MYC-transformed human B-lymphoma in vitro experiments. The experiment was repeated twice with similar results.
Assessing NAAG of Patient/Mouse Tumor/Plasma
Patient brain tumor samples and plasmas of Grade II-III (n = 9 for plasmas and n = 21 for tumors) and IV (GBM) (n = 38 for plasmas and n = 51 for tumors), meningioma (n = 51 for plasmas and n = 53 for tumors) patients were obtained as described above and subjected to metabolic extraction and analysis for the metabolite of interest, NAAG. Specifically, NAAG was identified and assessed for intensities using an Agilent 6490 QQQ mass spectrometer with an Agilent 1260 HPLC in the same manner as our B-lymphoma in vitro and OVCA in vivo experiments.
For the MYC-transformed human lymphoma B P493 mice, 10 days after tumor inoculation, mice (n = 10) were treated with doxycycline at 2 mg/mL concentration in drinking water for approximately 2 weeks. This study was divided into three periods: pre-doxycycline, doxycycline, and post-doxycycline. During the pre-doxycycline periods, and post doxycycline, the mice were placed on normal drinking water. Tumor sizes and NAAG level in plasma were tracked every week after cell injection and for another 2 weeks after doxycycline withdrawal. In compliance with the Johns Hopkins University Animal Care and Use Committee guidelines, the experiment was terminated after 7 weeks to prevent tail vein damage due to blood drawing. Along with the extracted metabolites, a NAAG standard was also assessed with the same instrument in the same run. Data were analyzed using Agilent Mass Hunter and Agilent Qualitative and Quantitative Analysis software in the same manner as the other experiments.
Conversion of Intensity to Concentration
Metabolites of interest were serially-diluted by a factor of 2 starting with 1 mM and ending with 0.00391 mM to make two sets of the standard metabolites of interest with desired concentrations. Then, one of the serial dilution sets was used to make standards containing 50% ACN: 50% of the metabolite. The other set of serial dilution was added into samples of interest, which were then were subjected to metabolic extraction. After that, both the extracted metabolites from the metabolite spiking into samples and the pure standard compound only were simultaneously submitted to Agilent 6490 triple-quadrupole (QQQ) mass spectrometer with the same parameters and methods as described in MYC-transformed human B-lymphoma in vitro experiments above. The data were then analyzed using Agilent MassHunter, and Agilent Qualitative and Quantitative Analysis Software packages to determine the metabolic profile of each sample. Next, the acquired intensities of a given compound were plotted against the known serial-diluted concentrations of that pure standard compound to establish the relationship between intensities and known concentrations. Similarly, the relationship between the intensities obtained from the compound of interest and the serially-diluted concentrations of the same compound spiked in the sample was determined. As previously reported by another study (Pigini et al., 2006), these relationships were found to be the same. Of note, we chose to present the concentration in nmol/g cells in order to directly compare with our previously published work (Le et al., 2012).
Animal Studies and Drug Treatment in vivo
For patient-derived orthotopic recurrent ovarian cancer and pancreatic cancer models, the tumors were initially resected from recurrent-OVCA and pancreatic cancer patients at times of surgery, and then implanted as xenografts in female/male Foxn1nu athymic nude mice (Envigo) to expand tumors while maintaining their in vivo properties. Once xenograft tumors were around 100 mm3, tumors were excised and cut into 2 mm3 pieces. Tumor pieces were then dipped in culture medium containing 50% matrigel (ThermoFisher Scientific) and implanted into ovaries or pancreas before being closed with an 8–0 nylon microfilament suture. Three weeks posttumor implantation, mice bearing patient-derived ovarian/ pancreatic cancer orthotopic tumors were randomly divided into 4 groups (n = 10 for each group). One group was treated with 200 mg/kg CB-839 twice per day every day by oral gavage administration for a period of 28 days. The second group was treated with 50 mg/kg 2-PMPA daily by intraperitoneal administration for 28 days. The control groups were treated with their respective vehicles. Tumors were excised and weighed at the end of each treatment. The experiment was repeated three times with similar results.
As for xenograft models, 5 × 10⁶ shControl or shGCPII OVCAR4 cells per tumor were suspended in 50% Matrigel and 50% serum-free RPMI and injected subcutaneously on female Foxn1nu athymic nude mice. In regard to the xenograft model using P493 human lymphoma B cells, 2 × 10⁷ P493 human lymphoma B cells were suspended in serum-free RPMI and injected subcutaneously on SCID mice (n = 10).
NAAG Supplement Experiment in vivo
For patient-derived recurrent-OVCA orthotopic tumors, the mice bearing tumors were injected with NAAG daily, via intraperitoneal injection (IP) at a similar dose (50 mg/kg) reported in previous studies in neuropathology (Guo et al., 2015) (for supplementing purpose), or 2 hours (for 15N2-NAAG for labeling assessment). Tumors (n = 10 mice for each group) were then harvested after a period of 12 days and weighed. Tumors were subjected to metabolic extraction and metabolite-assessed using Q-TOF LC-MS/MS.
For shControl and shGCPII-OVCAR4 xenograft tumors (n = 4 for shControl Saline, n = 3 for shControl NAAG, n = 9 for shGCPII Saline, n = 12 for shGCPII NAAG), mouse tumors with approximate volumes of 100 mm3 were injected with 100 μL of 500 μM 14N2-NAAG via intraperitoneal administration every other day for 12 days (for supplementing purpose). Tumor sizes were assessed after 12 days in order to compare the efficacy with those of orthotopic tumors. Tumors were subjected to metabolic extraction and metabolite-assessed using a 6490 triple-quadrupole (QQQ). The experiment was repeated twice with similar results.
Drug Treatment in in vitro
Pancreatic (Parental-P198, shControl-P198, shGCPII-P198, CrisprControl-P198, and CrisprGCPII-P198), ovarian (Parental-OVCAR4, shControl-OVCAR4, shGCPII-OVCAR4, CrisprControl-OVCAR4, and CrisprGCPII-OVCAR4) were treated with vehicle control (DMSO) or 10 μM BPTES (glutaminase inhibitor) (n = 4 per group). The cells were maintained at 37°C in a 5% CO2 and 95% air (vol/vol) incubator in 10% FBS, 1% (vol/vol) penicillin-streptomycin, 1 μg/mL of puromycin for shControl/GCPII-P198 or 0.5 μg/mL of puromycin for shControl/GCPII-OVCAR4 in either DMEM, RPMI 1640 based on the ATCC recommendation for each cell line. A phosphate-free variant of DMEM for P198 or RPMI 1640 for OVCAR4 was used due to potential inhibitory effects of phosphate on GCPII [66], the enzyme that hydrolyzes NAAG to NAA and glutamate. Cells were grown in multiple 24-well plates, seeded at approximately 30%–40% confluency. 24 hours after cells adhered, they were treated with either the vehicle control (DMSO) or 10μM BPTES was added. Viable cells were counted by a hemocytometer with the use of trypan blue to exclude dead cells for a period of 4 days.
Lentivirus Infection of OVCAR4 and P198 Cells
We purchased the MISSION Lentiviral transduction particles carrying either shGCPII with a tier unit of 200,000 or shControl vector from Sigma-Aldrich. We started the transduction process with plating at a density of 2×10⁴ cells per well for ovarian cancer cell (OVCAR4) and pancreatic cancer cells (P198). The following day, cells were infected with the lentivirus carrying the GCPII vector at a multiplicity of infection of 15 for OVCAR4 and 10 for P198 in the presence of 2 μg/mL of polybrene per well. After being incubated for 24 hours at 37°C in a 5% CO2 and 95% air (vol/vol) incubator in 10% FBS and 1% (vol/vol) penicillin-streptomycin in RPMI for OVCAR4 or DMEM for P198, the medium containing the lentivirus and polybrene was replaced with fresh and pre-warmed respective medium. The next day, cells were cultured in the presence of puromycin at a concentration of 0.5 μg/mL OVCAR4 and 1 μg/mL for P198 to select the transduced cells. The cells were replaced with RPMI or DMEM containing puromycin every 3 days. The puromycin-resistant clones were then used for the following experiments.
CrisprControl/GCPII in OVCAR4 and P198 Cells
The All-in-one CRISPR plasmid (U6gRNA-Cas9–2A-GFP) for GCPII was acquired from Sigma-Aldrich, which contains a codon-optimized Cas9 protein, a gRNA, unique CRISPR sites coding regions for GCPII, GFP coding sequences and kanamycin resistant genes. Using the published sequence of GCPII (also known as FOLH1), guide RNA sequences were determined such that they contained approximately 20 base-pairs, only specific to GCPII and located after the start codon. Additionally, a negative control vector was purchased from Sigma-Aldrich to generate the control clone.
Prior to transfection, for ovarian cancer cell (OVCAR4) or pancreatic cancer cells (P198), cells were plated in 6-well plates at a density of 6.25×10⁴ cells/ml. Once plates reached 80% confluency, cells were transfected with CrisprControl or CrisprGCPII vector using Lipofectamine® LTX with PLUS Reagent (ThermoFisher Scientific). Specifically, 250μL of the DNA-lipid complex (which include 8.4μL Lipofectamine® LTX Reagent, 2.5 μL PLUS Reagent, 35μL DNA (or 2.5 μg) and Opti-MEM reduced serum medium (ThermoFisher Scientific)) was added into each well of the 6-well plates. After three days, all cells were collected, and GFP-positive single cells were sorted by flow cytometry at the JHU SKCCC Flow Cytometry Core. The single cells were growing in 96-well plates for a week and expanded to 6-well plates and bigger format flasks. Finally, the single cells were checked for GCPII expression via western blotting and successful-GCPII-KD cells were used for the following experiments.
Western Blot Analysis
Cells were first washed with PBS and then harvested and lysed in lysis buffer containing M-Per® Mammalian protein extraction reagent (Thermo-Fisher) and a protease inhibitor cocktail (Sigma) with the dilution ratio of 50:1. The total protein concentration of each sample was determined based on a Bovine Serum Albumin (BSA) with known concentrations and the use of a FilterMax F5 microplate reader. An equal amount of protein was mixed with 25μL Laemmli buffer (Bio-Rad) containing 1/50th β-mercaptoethanol. Samples were then heated at 95°C for 5 minutes. Samples were electrophoresed and separated on 10% Mini-PROTEAN TGX Precast Protein Gels (Bio-Rad) in the running buffer containing 89% of water, 10% of 10X Tris-Glycine, and 1% of 10% SDS. The transfer was performed using the iBlot Blotting System (Thermo-Fisher), and PVDF transfer stacks (Thermo-Fisher). Blots were blocked for 1 hour using 5% milk in TBST. Blots were incubated overnight in 5% filtered nonfat milk containing GCPII or glutaminase mouse anti-human antibody (Abcam) with the dilution ratio of 1:1000, followed by washing the blots with TBST every 5 minutes a total of 3 times. The blots were incubated for 1 hour in 5% filtered milk containing goat anti-mouse HRP or goat anti-rabbit HRP Ab (Bio-Rad) with the dilution factor of 1:2000, followed by washing the blots with TBST every 5 minutes a total of 3 times. Protein bands were detected using ECL Western Blotting Detection Reagents (GE Healthcare) and ChemiDoc XRS+ Imaging System (Bio-Rad). Blots were stripped using Restore Western Blot Stripping Buffer (Thermo-Fisher). The loading control α-tubulin was probed and imaged in the same manner, but with the use of primary anti-alpha-tubulin antibody peroxidase conjugated (1:2000 dilution) (Rockland Immunochemicals). Protein extracted from prostate cancer (LNCaP) and pancreatic cancer cells (P8) were used as positive controls for GCPII (Pinto et al., 1996) and glutaminase (Elgogary et al., 2016), respectively.
QUANTIFICATION AND STATISTICAL ANALYSIS
All values were reported as the mean ± SEM as described in the figure legends. All the statistical details of experiments including the statistical tests used, exact value of n, what n represents can be found in the figure legends. Significance was determined as p ≤ 0.05 using Student’s t test.
Supplementary Material
KEY RESOURCES TABLE.
| REAGENT or RESOURCE | SOURCE | IDENTIFIER |
|---|---|---|
| Antibodies | ||
| GCPII Mouse Anti-Human | Abcam | Cat# ab19071; RRID:AB_444751 |
| Glutaminase Rabbit Anti-Human | Abcam | Cat# ab156876; RRID:AB_2721038 |
| Goat Anti-Rabbit HRP | Bio-Rad | Cat# 1706515; RRID:AB_2617112 |
| Goat Anti-Mouse HRP | Bio-Rad | Cat# 1721011; RRID:AB_2617113 |
| Primary Anti-Alpha Tubulin | Rockland Immunochemicals | Cat# 200–301-880; RRID:AB_10705001 |
| Biological Samples | ||
| Tumor samples of different grades of patient glioma (glioma grade II-III, and glioma grade IV (GBM)) and meningioma. | Department of Neurology, School of Medicine, University of São Paulo | N/A |
| Tumor samples of glioblastoma meningioma | Dr. Kaisorn Chaichana | N/A |
| Patient-derived pancreatic cancer tumor JHU094 | PancXenoBank of Division of Gastrointestinal and Liver Pathology, Department of Pathology, Johns Hopkins School of Medicine, IRB number NA_00001584 |
N/A |
| Patient-derived recurrent-OVCA | Dr. Tian-Li Wang | Yu et al., 2015 |
| Chemicals, Peptides, and Recombinant Proteins | ||
| BPTES | Millipore Sigma | SML0601 |
| NAAG | Millipore Sigma | A5930 |
| 15N2-NAAG | Millipore Sigma | 778176 |
| 13C515N2-glutamine | Millipore Sigma | 607983 |
| 2-(Phosphonomethyl)-pentandioic acid (2PMPA) | Millipore Sigma | SML1612 |
| CB-839 | Calithera | N/A |
| M-PER Mammalian Protein Extraction Reagent | Thermo-Fisher Scientific | 78501 |
| T-PER Tissue Protein Extraction Reagent | Thermo-Fisher Scientific | 78510 |
| Protease inhibitor cocktail | Millipore Sigma | P8340 |
| 10X Tris Glycine | Bio-Rad | 161–0734 |
| SDS (10%) | Invitrogen | AM9822 |
| Restore Western Blot Stripping Buffer | Thermo-Fisher Scientific | 21059 |
| ECL Western Blotting Detection Reagents | GE Healthcare | RPN2109 |
| Mini-PROTEAN TGX Precast Protein Gels | Bio-Rad | 456–1034 |
| iBlot Gel Transfer Stacks Nitrocellulose, Regular | Thermo-Fisher Scientific | IB301001 |
| Laemmli buffer | Bio-Rad | 161–0737 |
| Matrigel | Thermo-Fisher Scientific | CB 40234 |
| RPMI | Millipore Sigma | R8758 |
| DMEM | Thermo-Fisher Scientific | 11995–065 |
| Fetal Bovine Serum | Millipore Sigma | F6178 |
| Fetal Bovine Serum (Dialyzed) | Millipore Sigma | F0392 |
| Penicillin-Streptomycin | Millipore Sigma | P0781 |
| Trypsin-EDTA Solution | Millipore Sigma | T4049–100ML |
| Trypan Blue solution | Millipore Sigma | T8154–100ML |
| Lipofectamine® LTX & PLUS Reagent | Thermo-Fisher Scientific | 15338100 |
| Opti-MEM® Reduced Serum Medium | Thermo-Fisher Scientific | 31985–070 |
| Experimental Models: Cell Lines | ||
| MYC-transformed human lymphoma B cells (P493) | Dr. Chi Dang Laboratory | Le et al., 2012 |
| Pancreatic Cancer Cells A32; E3; P198; A6L; P8; P10; P215; and JD13D |
PancXenoBank of Division of Gastrointestinal and Liver Pathology, Department of Pathology, Johns Hopkins School of Medicine, IRB number NA_00001584 | Elgogary et al., 2016 |
| LNCaP | ATCC | CRL-1740 |
| OVCAR4 | Dr. Tian-Li Wang Laboratory | Yu et al., 2015 |
| Primary OVCA | Dr. Tian-Li Wang Laboratory | Yu et al., 2015 |
| Experimental Models: Organisms/Strains | ||
| Foxn1nu athymic nude mice | Envigo | Hsd: Athymic Nude-Foxn1nu |
| SCID C.B-17/Icr mice | Envigo | C.B-17/IcrHsd-Prkdcscid |
| Oligonucleotides | ||
| shGCPII | Millipore Sigma | TRCN0000006809 |
| shControl | Millipore Sigma | SHC001V |
| CrisprGCPII | Millipore Sigma | HS00004-FOLH1-CCG |
| CrisprControl | Millipore Sigma | CRISPR06 |
| Software and Algorithms | ||
| Agilent Mass Profiler Professional (MPP) | Agilent | G3835AA |
| Agilent Qualitative Analysis | Agilent | G3336–60099 |
| Agilent Quantitative Analysis | Agilent | G3336–60095 |
| Agilent MassHunter Data Acquisition QTOF | Agilent | G3849AA |
| Agilent MassHunter Data Acquisition QQQ | Agilent | G3335–90128 |
| Other | ||
| iBlot 7-Minute Blotting System | Thermo-Fisher Scientific | IB1001 |
| 1260 HPLC-Autosampler System | Agilent | G1311–90300 |
| Discovery® HS F5 HPLC Column | Millipore Sigma | 567503-U |
| 6490 triple-quadrupole (QQQ) mass spectrometer | Agilent | G6490A |
| 6545 Quadrupole–Time-of-Flight (Q-TOF) mass spectrometer | Agilent | G6520B |
Highlights.
N-acetyl-aspartyl-glutamate (NAAG) is more abundant in higher grade cancers
NAAG concentrations in plasma mirror tumor sizes in vivo
NAAG serves as a reservoir to provide glutamate to cancer cells through GCPII
Inhibition of GCPII and glutaminase hinders tumor growth
ACKNOWLEDGMENTS
This work was supported by the NIH grants R01-CA193895, R01-CA112314, 1S10OD025226–01, and UL1 TR 001079; Hopkins-Allegheny Health Network Cancer Research Fund; and the Doris M. Weinstein Pancreatic Cancer Research Fund (to A.L.). Special thanks to Michel Soudée for his helpful editing.
Footnotes
DECLARATION OF INTERESTS
The authors declare no competing interests.
SUPPLEMENTAL INFORMATION
Supplemental Information can be found online at https://doi.org/10.1016/j.celrep.2019.03.036.
REFERENCES
- Altman BJ, Hsieh AL, Sengupta A, Krishnanaiah SY, Stine ZE, Walton ZE, Gouw AM, Venkataraman A, Li B, Goraksha-Hicks P, et al. (2015). MYC Disrupts the Circadian Clock and Metabolism in Cancer Cells. Cell Metab. 22, 1009–1019. [DOI] [PMC free article] [PubMed] [Google Scholar]
- Arcella A, Carpinelli G, Battaglia G, D’Onofrio M, Santoro F, Ngomba RT, Bruno V, Casolini P, Giangaspero F, and Nicoletti F (2005). Pharmacological blockade of group II metabotropic glutamate receptors reduces the growth of glioma cells in vivo. Neuro-oncol. 7, 236–245. [DOI] [PMC free article] [PubMed] [Google Scholar]
- Aronica E, Gorter JA, Ijlst-Keizers H, Rozemuller AJ, Yankaya B, Leenstra S, and Troost D (2003). Expression and functional role of mGluR3 and mGluR5 in human astrocytes and glioma cells: opposite regulation of glutamate transporter proteins. Eur. J. Neurosci 17, 2106–2118. [DOI] [PubMed] [Google Scholar]
- Barretina J, Caponigro G, Stransky N, Venkatesan K, Margolin AA, Kim S, Wilson CJ, Lehár J, Kryukov GV, Sonkin D, et al. (2012). The Cancer Cell Line Encyclopedia enables predictive modelling of anticancer drug sensitivity. Nature 483, 603–607. [DOI] [PMC free article] [PubMed] [Google Scholar]
- Baslow MH, Dyakin VV, Nowak KL, Hungund BL, and Guilfoyle DN (2005). 2-PMPA, a NAAG peptidase inhibitor, attenuates magnetic resonance BOLD signals in brain of anesthetized mice: evidence of a link between neuron NAAG release and hyperemia. J. Mol. Neurosci 26, 1–15. [DOI] [PubMed] [Google Scholar]
- Biancur DE, Paulo JA, Ma1achowska B, Quiles Del Rey M, Sousa CM, Wang X, Sohn ASW, Chu GC, Gygi SP, Harper JW, et al. (2017). Compensatory metabolic networks in pancreatic cancers upon perturbation of glutamine metabolism. Nat. Commun 8, 15965. [DOI] [PMC free article] [PubMed] [Google Scholar]
- Bouchelouche K, Choyke PL, and Capala J (2010). Prostate specific membrane antigen- a target for imaging and therapy with radionuclides. Discov. Med 9, 55–61. [PMC free article] [PubMed] [Google Scholar]
- Brocke KS, Staufner C, Luksch H, Geiger KD, Stepulak A, Marzahn J, Schackert G, Temme A, and Ikonomidou C (2010). Glutamate receptors in pediatric tumors of the central nervous system. Cancer Biol. Ther 9, 455–468. [DOI] [PubMed] [Google Scholar]
- Carpenter KJ, Sen S, Matthews EA, Flatters SL, Wozniak KM, Slusher BS, and Dickenson AH (2003). Effects of GCP-II inhibition on responses of dorsal horn neurones after inflammation and neuropathy: an electrophysiological study in the rat. Neuropeptides 37, 298–306. [DOI] [PubMed] [Google Scholar]
- Ciceroni C, Arcella A, Mosillo P, Battaglia G, Mastrantoni E, Oliva MA, Carpinelli G, Santoro F, Sale P, Ricci-Vitiani L, et al. (2008). Type-3 metabotropic glutamate receptors negatively modulate bone morphogenetic protein receptor signaling and support the tumourigenic potential of gliomainitiating cells. Neuropharmacology 55, 568–576. [DOI] [PubMed] [Google Scholar]
- Ciceroni C, Bonelli M, Mastrantoni E, Niccolini C, Laurenza M, Larocca LM, Pallini R, Traficante A, Spinsanti P, Ricci-Vitiani L, et al. (2013). Type-3 metabotropic glutamate receptors regulate chemoresistance in glioma stem cells, and their levels are inversely related to survival in patients with malignant gliomas. Cell Death Differ. 20, 396–407. [DOI] [PMC free article] [PubMed] [Google Scholar]
- D’Onofrio M, Arcella A, Bruno V, Ngomba RT, Battaglia G, Lombari V, Ragona G, Calogero A, and Nicoletti F (2003). Pharmacological blockade of mGlu2/3 metabotropic glutamate receptors reduces cell proliferation in cultured human glioma cells. J. Neurochem 84, 1288–1295. [DOI] [PubMed] [Google Scholar]
- Dranoff G, Elion GB, Friedman HS, Campbell GL, and Bigner DD (1985). Influence of glutamine on the growth of human glioma and medulloblastoma in culture. Cancer Res. 45, 4077–4081. [PubMed] [Google Scholar]
- Elgogary A, Xu Q, Poore B, Alt J, Zimmermann SC, Zhao L, Fu J, Chen B, Xia S, Liu Y, et al. (2016). Combination therapy with BPTES nanoparticles and metformin targets the metabolic heterogeneity of pancreatic cancer. Proc. Natl. Acad. Sci. USA 113, E5328–E5336. [DOI] [PMC free article] [PubMed] [Google Scholar]
- Fogal V, Babic I, Chao Y, Pastorino S, Mukthavaram R, Jiang P, Cho YJ, Pingle SC, Crawford JR, Piccioni DE, and Kesari S (2015). Mitochondrial p32 is upregulated in Myc expressing brain cancers and mediates glutamine addiction. Oncotarget 6, 1157–1170. [DOI] [PMC free article] [PubMed] [Google Scholar]
- Fong MY, McDunn J, and Kakar SS (2011). Identification of metabolites in the normal ovary and their transformation in primary and metastatic ovarian cancer. PLoS ONE 6, e19963. [DOI] [PMC free article] [PubMed] [Google Scholar]
- Fricker AC, Mok MH, de la Flor R, Shah AJ, Woolley M, Dawson LA, and Kew JN (2009). Effects of N-acetylaspartylglutamate (NAAG) at group II mGluRs and NMDAR. Neuropharmacology 56, 1060–1067. [DOI] [PubMed] [Google Scholar]
- Gao P, Zhang H, Dinavahi R, Li F, Xiang Y, Raman V, Bhujwalla ZM, Felsher DW, Cheng L, Pevsner J, et al. (2007). HIF-dependent antitumori-genic effect of antioxidants in vivo. Cancer Cell 12, 230–238. [DOI] [PMC free article] [PubMed] [Google Scholar]
- Guo H, Liu J, Van Shura K, Chen H, Flora MN, Myers TM, McDonough JH, and McCabe JT (2015). N-acetyl-aspartyl-glutamate and inhibition of glutamate carboxypeptidases protects against soman-induced neuropathology. Neurotoxicology 48, 180–191. [DOI] [PubMed] [Google Scholar]
- Gyorffy B, Lánczky A, and Szállási Z (2012). Implementing an online tool for genome-wide validation of survival-associated biomarkers in ovarian-cancer using microarray data from 1287 patients. Endocr. Relat. Cancer 19, 197–208. [DOI] [PubMed] [Google Scholar]
- Harada C, Harada T, Slusher BS, Yoshida K, Matsuda H, and Wada K (2000). N-acetylated-alpha-linked-acidic dipeptidase inhibitor has a neuroprotective effect on mouse retinal ganglion cells after pressure-induced ischemia. Neurosci. Lett 292, 134–136. [DOI] [PubMed] [Google Scholar]
- Harding JJ, Telli ML, Munster PN, Le MH, Molineaux C, Bennett MK, Mittra E, Burris HA, Clark AS, Dunphy M, et al. (2015). Safety and tolerability of increasing doses of CB-839, a first-in-class, orally administered small molecule inhibitor of glutaminase, in solid tumors. J. Clin. Oncol 33, 2512. [Google Scholar]
- Hensley CT, Wasti AT, and DeBerardinis RJ (2013). Glutamine and cancer: cell biology, physiology, and clinical opportunities. J. Clin. Invest 123, 3678–3684. [DOI] [PMC free article] [PubMed] [Google Scholar]
- Jackson PF, Cole DC, Slusher BS, Stetz SL, Ross LE, Donzanti BA, and Trainor DA (1996). Design, synthesis, and biological activity of a potent inhibitor of the neuropeptidase N-acetylated alpha-linked acidic dipeptidase. J. Med. Chem 39, 619–622. [DOI] [PubMed] [Google Scholar]
- Kelloff GJ, Hoffman JM, Johnson B, Scher HI, Siegel BA, Cheng EY, Cheson BD, O’shaughnessy J, Guyton KZ, Mankoff DA, et al. (2005). Progress and promise of FDG-PET imaging for cancer patient management and oncologic drug development. Clin. Cancer Res. 11, 2785–2808. [DOI] [PubMed] [Google Scholar]
- Le A, Cooper CR, Gouw AM, Dinavahi R, Maitra A, Deck LM, Royer RE, Vander Jagt DL, Semenza GL, and Dang CV (2010). Inhibition of lactate dehydrogenase A induces oxidative stress and inhibits tumor progression. Proc. Natl. Acad. Sci. USA 107, 2037–2042. [DOI] [PMC free article] [PubMed] [Google Scholar]
- Le A, Lane AN, Hamaker M, Bose S, Gouw A, Barbi J, Tsukamoto T, Rojas CJ, Slusher BS, Zhang H, et al. (2012). Glucose-independent glutamine metabolism via TCA cycling for proliferation and survival in B cells. Cell Metab. 15, 110–121. [DOI] [PMC free article] [PubMed] [Google Scholar]
- Long PM, Moffett JR, Namboodiri AM, Viapiano MS, Lawler SE, and Jaworski DM (2013). N-acetylaspartate (NAA) and N-acetylaspartylglutamate (NAAG) promote growth and inhibit differentiation of glioma stem-like cells. J. Biol. Chem 288, 26188–26200. [DOI] [PMC free article] [PubMed] [Google Scholar]
- Lyssiotis CA, Son J, Cantley LC, and Kimmelman AC (2013). Pancreatic cancers rely on a novel glutamine metabolism pathway to maintain redox balance. Cell Cycle 12, 1987–1988. [DOI] [PMC free article] [PubMed] [Google Scholar]
- Neale JH, Bzdega T, and Wroblewska B (2000). N-acetylaspartylglutamate: the most abundant peptide neurotransmitter in the mammalian central nervous system. J. Neurochem 75, 443–452. [DOI] [PubMed] [Google Scholar]
- Pelletier J, Bellot G, Gounon P, Lacas-Gervais S, Pouysségur J, and Mazure NM (2012). Glycogen Synthesis is Induced in Hypoxia by the Hypoxia-Inducible Factor and Promotes Cancer Cell Survival. Front. Oncol 2, 18. [DOI] [PMC free article] [PubMed] [Google Scholar]
- Pigini D, Cialdella AM, Faranda P, and Tranfo G (2006). Comparison between external and internal standard calibration in the validation of an analytical method for 1-hydroxypyrene in human urine by high-performance liquid chromatography/tandem mass spectrometry. Rapid Commun. Mass Spectrom 20, 1013–1018. [DOI] [PubMed] [Google Scholar]
- Pinto JT, Suffoletto BP, Berzin TM, Qiao CH, Lin S, Tong WP, May F, Mukherjee B, and Heston WD (1996). Prostate-specific membrane antigen: a novel folate hydrolase in human prostatic carcinoma cells. Clin. Cancer Res 2, 1445–1451. [PubMed] [Google Scholar]
- Ross JS, Sheehan CE, Fisher HA, Kaufman RP Jr., Kaur P, Gray K, Webb I, Gray GS, Mosher R, and Kallakury BV (2003). Correlation of primary tumor prostate-specific membrane antigen expression with disease recurrence in prostate cancer. Clin. Cancer Res. 9, 6357–6362. [PubMed] [Google Scholar]
- Ru P, Williams TM, Chakravarti A, and Guo D (2013). Tumor metabolism of malignant gliomas. Cancers (Basel) 5, 1469–1484. [DOI] [PMC free article] [PubMed] [Google Scholar]
- Schmidt LH, Heitkötter B, Schulze AB, Schliemann C, Steinestel K, Trautmann M, Marra A, Hillejan L, Mohr M, Evers G, et al. (2017). Prostate specific membrane antigen (PSMA) expression in non-small cell lung cancer. PLoS ONE 12, e0186280. [DOI] [PMC free article] [PubMed] [Google Scholar]
- Schuhmacher M, Staege MS, Pajic A, Polack A, Weidle UH, Bornkamm GW, Eick D, and Kohlhuber F (1999). Control of cell growth by c-Myc in the absence of cell division. Curr. Biol 9, 1255–1258. [DOI] [PubMed] [Google Scholar]
- Shaw TJ, Senterman MK, Dawson K, Crane CA, and Vanderhyden BC (2004). Characterization of intraperitoneal, orthotopic, and metastatic xenograft models of human ovarian cancer. Mol. Ther 10, 1032–1042. [DOI] [PubMed] [Google Scholar]
- Slusher BS, Vornov JJ, Thomas AG, Hurn PD, Harukuni I, Bhardwaj A, Traystman RJ, Robinson MB, Britton P, Lu XC, et al. (1999). Selective inhibition of NAALADase, which converts NAAG to glutamate, reduces ischemic brain injury. Nat. Med 5, 1396–1402. [DOI] [PubMed] [Google Scholar]
- Som P, Atkins HL, Bandoypadhyay D, Fowler JS, MacGregor RR, Matsui K, Oster ZH, Sacker DF, Shiue CY, Turner H, et al. (1980). A fluorinated glucose analog, 2-fluoro-2-deoxy-D-glucose (F-18): nontoxic tracer for rapid tumor detection. J. Nucl. Med 21, 670–675. [PubMed] [Google Scholar]
- Son J, Lyssiotis CA, Ying H, Wang X, Hua S, Ligorio M, Perera RM, Ferrone CR, Mullarky E, Shyh-Chang N, et al. (2013). Glutamine supports pancreatic cancer growth through a KRAS-regulated metabolic pathway. Nature 496, 101–105. [DOI] [PMC free article] [PubMed] [Google Scholar]
- Stepulak A, Luksch H, Gebhardt C, Uckermann O, Marzahn J, Sifringer M, Rzeski W, Staufner C, Brocke KS, Turski L, and Ikonomidou C (2009). Expression of glutamate receptor subunits in human cancers. Histochem. Cell Biol 132, 435–445. [DOI] [PubMed] [Google Scholar]
- Tanaka K, Sasayama T, Irino Y, Takata K, Nagashima H, Satoh N, Kyotani K, Mizowaki T, Imahori T, Ejima Y, et al. (2015). Compensatory glutamine metabolism promotes glioblastoma resistance to mTOR inhibitor treatment. J. Clin. Invest 125, 1591–1602. [DOI] [PMC free article] [PubMed] [Google Scholar]
- Tsukamoto T, Majer P, Vitharana D, Ni C, Hin B, Lu XC, Thomas AG, Wozniak KM, Calvin DC, Wu Y, et al. (2005). Enantiospecificity of glutamate carboxypeptidase II inhibition. J. Med. Chem 48, 2319–2324. [DOI] [PubMed] [Google Scholar]
- Whelan J (2000). NAALADase inhibitors: a novel approach to glutamate regulation. Drug Discov. Today 5, 171–172. [DOI] [PubMed] [Google Scholar]
- Wroblewska B, Wroblewski JT, Pshenichkin S, Surin A, Sullivan SE, and Neale JH (1997). N-acetylaspartylglutamate selectively activates mGluR3 receptors in transfected cells. J. Neurochem 69, 174–181. [DOI] [PubMed] [Google Scholar]
- Wroblewska B, Santi MR, and Neale JH (1998). N-acetylaspartylglutamate activates cyclic AMP-coupled metabotropic glutamate receptors in cerebellar astrocytes. Glia 24, 172–179. [DOI] [PubMed] [Google Scholar]
- Yamamoto T, Kozikowski A, Zhou J, and Neale JH (2008). Intracerebroventricular administration of N-acetylaspartylglutamate (NAAG) peptidase inhibitors is analgesic in inflammatory pain. Mol. Pain 4, 31. [DOI] [PMC free article] [PubMed] [Google Scholar]
- Yu Y, Gaillard S, Phillip JM, Huang TC, Pinto SM, Tessarollo NG, Zhang Z, Pandey A, Wirtz D, Ayhan A, et al. (2015). Inhibition of Spleen Tyrosine Kinase Potentiates Paclitaxel-Induced Cytotoxicity in Ovarian Cancer Cells by Stabilizing Microtubules. Cancer Cell 28, 82–96. [DOI] [PMC free article] [PubMed] [Google Scholar]
- Zhong C, Zhao X, Sarva J, Kozikowski A, Neale JH, and Lyeth BG (2005). NAAG peptidase inhibitor reduces acute neuronal degeneration and astrocyte damage following lateral fluid percussion TBI in rats. J. Neurotrauma 22, 266–276. [DOI] [PubMed] [Google Scholar]
- Zhong C, Zhao X, Van KC, Bzdega T, Smyth A, Zhou J, Kozikowski AP, Jiang J, O’Connor WT, Berman RF, et al. (2006). NAAG peptidase inhibitor increases dialysate NAAG and reduces glutamate, aspartate and GABA levels in the dorsal hippocampus following fluid percussion injury in the rat. J. Neurochem 97, 1015–1025. [DOI] [PubMed] [Google Scholar]
- Zhou J, Neale JH, Pomper MG, and Kozikowski AP (2005). NAAG peptidase inhibitors and their potential for diagnosis and therapy. Nat. Rev. Drug Discov 4, 1015–1026. [DOI] [PubMed] [Google Scholar]
- Zhou K, Song Y, Zhou W, Zhang C, Shu H, Yang H, and Wang B (2014). mGlu3 receptor blockade inhibits proliferation and promotes astrocytic phenotype in glioma stem cells. Cell Biol. Int 38, 426–434. [DOI] [PubMed] [Google Scholar]
Associated Data
This section collects any data citations, data availability statements, or supplementary materials included in this article.