Abstract
Inflammatory cells, most especially neutrophils, can be a necessary component of the anti-tumor activity occurring after administration of photodynamic therapy. Generation of neutrophil responses has been suggested to be particularly important in instances when the delivered PDT dose is insufficient. In these cases, the release of neutrophil granules and engagement of anti-tumor immunity may play an important role in eliminating residual disease. Herein, we utilize in vivo imaging of luminol chemiluminescence to non-invasively monitor neutrophil activation after PDT administration. Studies were performed in the AB12 murine model of mesothelioma, treated with Photofrin-PDT. Luminol-generated chemiluminescence increased transiently 1h after PDT, followed by a subsequent decrease at 4h after PDT. The production of luminol signal was not associated with the influx of Ly6G+ cells, but was related to oxidative burst, as an indicator of neutrophil function. Most importantly, greater levels of luminol chemiluminescence 1h after PDT was prognostic of a complete response at 90 days after PDT. Taken together, this research supports an important role for early activity by Ly6G+ cells in the generation of long-term PDT responses in mesothelioma, and it points to luminol chemiluminescence as a potentially useful approach for preclinical monitoring of neutrophil activation by PDT.
Graphical Abstract
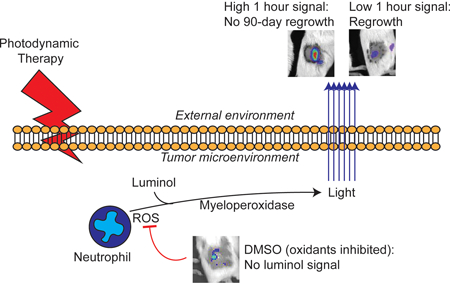
As neutrophils can be necessary for anti-tumor activity after photodynamic therapy, we utilized in vivo imaging of luminol chemiluminescence to non-invasively monitor neutrophil activation after its administration. In murine mesothelioma, chemiluminescence increased at one hour after PDT and subsequently decreased at four hours after PDT. Luminol signal was not representative of neutrophil influx, but instead with neutrophil function (oxidative burst). Importantly, greater luminol signal one hour after PDT predicted tumors with no regrowth after 90 days. This supports an important role for early neutrophil activity in optimal PDT response and highlights luminol chemiluminescence as a useful approach for preclinical studies.
Introduction
Photodynamic therapy (PDT) is well characterized to stimulate innate immunity, most obviously apparent through the generation of inflammation (1). This inflammation is associated with the release of cytokines, for example IL-6, IL-10, and TNF-α (2–4), and an accompanying increase in tumor levels of macrophages and granulocytes (3, 2). Induction of neutrophil influx to the tumor has been observed in mammary carcinomas (2, 3), squamous cell carcinomas (5), and colon carcinomas (6), as detected by Ly6G+ and other neutrophil-identifying antibodies (7). This is followed by neutrophil binding via adhesion markers, noting that PDT can damage the endothelial cells to which neutrophils would bind, thus it has been suggested that adhesion molecules are expressed on normal or minimally damaged tissue adjacent to PDT-treated tumor (8, 9). Neutrophils may play a multi-faceted role inside the PDT-treated tumor; for example, they may induce tumor cell cytotoxicity and engage the anti-tumor immune response. The former is driven by the release of potentially damaging enzymes from storage granules inside neutrophils upon their activation (10), while the latter results from the role of neutrophils in directing immune cells via secretion of chemokines (11) and antigen presentation via expression of MHC Class II molecules (5).
The contribution of PDT-generated innate immunity to treatment response has been specifically demonstrated in several studies. For example, the importance of PDT-induced myeloid cells (including neutrophils) in initiating adaptive immunity was investigated by depleting these cells using anti-Gr1 antibody. This work concluded that the inhibition of innate immune cells after PDT decreases the generation of tumor-specific cytotoxic T cells by PDT (12). It has also been shown that the extent of inflammation produced by PDT is affected by treatment fluence rate whereby lower fluence rates administered at lower fluence generated greater levels of chemokine secretion (e.g. MIP-1, MIP-2) and neutrophil influx (13). At a set, low fluence rate (14 mW/cm2), eradication of neutrophils using anti-Gr1 antibody diminished the PDT response of Colo26 tumors when mice were treated with a low fluence (48 J/cm2), but had no effect at higher fluence (128 J/cm2). These studies demonstrated that neutrophil activity is critical for tumor control under conditions in which direct tumor cell kill by PDT is not enough to provide for complete response. The clinical treatment of malignant pleural mesothelioma may represent one such scenario, as intraoperative PDT of mesothelioma generated an overall survival of 31.7 months despite a generally much earlier recurrence of disease (14, 15).
Previous studies of neutrophil induction by PDT have included mostly flow cytometry-based analyses of tissue levels of these cells. Yet, in vivo imaging of neutrophil activity is feasible, and, in fact, has been demonstrated in the context of PDT via a fluorescent reporter for neutrophil elastase, an enzyme that is released by activated neutrophils (16). In the current study, we sought to examine the in vivo induction of neutrophils by PDT using an alternative enzymatic pathway also associated with neutrophil stimulation. Upon their activation, neutrophils release the enzyme myeloperoxidase (MPO) from within azurophilic granules inside their cells. MPO catalyzes the production of hypochlorous acid. Once produced, the level of hypochlorous acid, as well as its preceding oxidants hydrogen peroxide (H2O2) and superoxide (O2−), can be detected in vivo via the chemiluminescent substrate luminol (5-Amino-2,3-dihydro-1,4-pthalazine-1,4-dione) (17–20). Luminol has been utilized in vivo to study inflammation occurring as a result of cancer (21–23), arthritis (24), and foreign biomaterials (25).
Herein this manuscript, we describe the use of luminol to detect PDT-generated inflammation and its value as a biomarker of anti-tumor activity. Luminol chemiluminescence was detected 1h after initiation of light administration for PDT. This occurred without an accompanying increase in the presence of Ly6G+ cells in the tumor environment at this timepoint. Instead, it appears the increased signal was due to an increased production of oxidants by activated neutrophils. The relevance of neutrophil activation to PDT response was considered in studies of therapeutic outcome from which we observed that tumors with high chemiluminescence signal at 1h after PDT exhibited a more durable response than tumors with low chemiluminescence signal at 1h after PDT. Moreover, it was noted that chemiluminescence signal decreased at 4h after PDT, leading to a rapidly changing inflammatory landscape in a short time (1–4 h after PDT) in tumors that were most responsive to PDT. These findings therefore point to the importance of the extent and timing of PDT-induced inflammation in the generation of favorable long term treatment outcome.
Materials and Methods
Animals and tumor model.
Animal studies were approved by the University of Pennsylvania Institutional Animal Care and Use Committee and animal facilities are accredited by the American Association for the Accreditation of Laboratory Animal Care (AAALAC). AB12 mouse mesothelioma cells were maintained in DMEM (Gibco, Gaithersburg, MD) supplemented with 10% fetal bovine serum, 2mm L-glutamine, 100 units/mL penicillin, and 100 μg/mL streptavidin (Gibco, Carlsbad, CA). Tumors were propagated by injecting 1 × 10⁶ cells intradermally over the right flank of BALB/c mice (Charles River Laboratories, Wilmington, MA). Tumor volume was calculated using the following formula: ∏/6 * (tumor length) * (tumor width)2. Mice were entered into studies when their tumor reached a diameter of 5–6 mm. To limit background signal, mice were maintained on alfalfa-free chow starting six days before imaging.
Photodynamic therapy.
One day prior to light delivery for PDT, mice were injected with 5 mg/kg Photofrin via tail vein. The next day, mice were anesthetized via inhalation of isoflurane in medical air (VetEquip anesthesia machine, Pleasanton, CA). Light (632 nm) from a Ceralas Biolitec laser was delivered through microlens-tipped fibers over a 1.1-cm spot. Light was measured via a Labmaster power meter (Coherent, Auburn, CA), adjusted to a fluence rate of 75 mW/cm2, and delivered to a total fluence of 135 J/cm2.
In vivo imaging.
Prior to light administration for PDT, as well as at indicated times after initiation of PDT, mice were anesthetized via inhalation of isoflurane and injected intraperitoneally with 300 mg/kg of luminol substrate (Sigma Aldrich, St. Louis, MD) resuspended to 30 mg/mL in 0.9% saline solution. Specifically, baseline scans were performed one day prior to PDT, while post-PDT scans were acquired 30 minutes and 3.5 hours after the completion of light delivery (1h and 4h after the initiation of PDT). After ten minutes of incubation, bioluminescent images were acquired on an IVIS Spectrum imager (Perkin Elmer, Waltham, MA) using a five-minute exposure. Regions of interest (ROIs) were drawn to encompass the treatment area (marked by black pen), as well as an equal-sized area in an untreated skin region. The difference in average flux between these regions was quantified.
Where indicated, mice were injected intravenously (via tail vein) with 1 nmol IRDye 800 CW PEG (Licor, Lincoln, NE) five minutes prior to luminol injection. Luminescent images and fluorescent images (745 excitation, 820 emission filter) were taken simultaneously. Fluorescence was quantified as the ratio of signal from the treatment field ROI to the signal from a ROI on untreated mouse skin.
Immunohistochemistry.
Tumors extracted from PDT-treated or untreated animals were frozen in optimal cutting temperature (OCT) media (Scigen, Gardena, CA). Sections were cut at 14 micron thickness at −15°C (Leica CM1950 cryostat, Wetzlar, Germany), then fixed on ice-cold acetone for 5 minutes and allowed to dry for 30 minutes. Overnight blocking was performed in PBStt (0.6% w/v Tween-20, 0.008% w/v thimerosal, 0.025% sodium azide) containing 20% v/v non-fat milk, 5% v/v mouse serum, and 1.5% v/v bovine albumin. Sections were stained at room temperature (1h) with rat anti-mouse Ly6G (clone 1A8, diluted 1:100 in PBStt containing 1.5% v/v bovine albumin) and rinsed three times in PBStt. Stained neutrophils were detected via Cy3-conjugated mouse anti-rat IgG, diluted 1:200 in PBStt containing 1.5% bovine albumin, and incubated for 1h at room temperature. Images were captured on a Zeiss AX10 microscope (Zeiss, Oberkochen, Germany) at 10X using a constant exposure. When indicated, studies were conducted using a SDS-PAGE protocol (17, 26) modified for use in frozen sections. Briefly, frozen sections were submerged in 400 μM luminol containing 20 μM hydrogen peroxide for five minutes, rinsed briefly in PBStt, and imaged on a fluorescent microscope using a filter cube for DAPI staining. After imaging for luminol, sections were fixed in acetone and then processed via immunohistochemistry and analyzed for Ly6G+ neutrophils.
Neutrophil depletion.
Mice were intraperitoneally administered 350 μg anti-Ly6G antibody (clone 1A8, BioXCell, West Lebanon, NH) at two and one day prior to PDT and luminol imaging. Depletion of Ly6G+ cells was confirmed by harvesting the spleens of a subset of mice and analyzing via flow cytometry.
Tissue sample processing.
Tumors were excised from euthanized animals and transferred to ice-cold R10 media (RPMI 1640 supplemented with 10% heat-inactivated fetal bovine serum (FBS), 100× Pen-Strep at 1:100, 1M HEPES at 1:100 dilution, and 55 mM 2-mercaptoethanol at 1:1000). Tumors were broken down by incubation in 600 U/mL collagenase at 37 degrees Celsius for 15 minutes (atmosphere of 5% carbon dioxide), mechanically sheared using the plunger of a 5 mL syringe, and then passed through a cell strainer. Spleens were submitted immediately to mechanicaly shearing using the plunger of a 5 mL syringe without collagenase pretreatment. The resulting cell pellet was resuspended in ACK buffer to lyse red blood cells, spun, and resuspended in MACS buffer (PBS containing 0.5% FBS and 2mM EDTA). Cell vitality was then tested using Aqua Live/Dead staining as per manufacturer’s instructions (Thermo Fisher, Waltham, MA). To stain surface markers, cells were incubated in the dark at 4° C for 1h with 1:50 dilutions of the following antibodies (all obtained from Thermo Fisher): eFluor 450-CD45 (clone 30-F11), PE-CD11b (clone M1/70), PE-Cy7-Ly6C (clone HK1.4), PerCP-eFluor710 (clone 1A8). Cells were washed twice prior to fixation and permeabilization with Cytofix/Cytoperm as per manufacturer instructions (BD, Franklin Lakes, NJ). MPO was labeled using FITC-MPO (clone 2D4, Abcam) for 30 min at 4° C.
Flow cytometric analysis.
Samples were resuspended in PBS and analyzed by a BD FacsAria flow cytometer. Thresholds on the forward scatter channel were set to exclude cellular debris from analysis. Gates were set manually based on control samples for discrimination of population data. Data analysis was performed using FlowJo software.
Statistics.
For longitudinal imaging timepoints, observations were made in the same animal and therefore statistical comparisons between two groups were performed using two-tailed, paired t-tests with p < 0.05 taken to be significant. For endpoint analysis, statistical comparisons between two groups were performed using two-tailed, non-parametric t-tests (Mann-Whitney test). In both cases, analysis was performed using GraphPad Prism 7 or Microsoft Excel. The time course of neutrophil influx was analyzed using the non-parametric Krustal-Wallis test with Dunn’s multiple comparisons performed post hoc on GraphPad Prism 7
Results
PDT promotes strong, but transient increases in tumor-localized luminol chemiluminescence
As neutrophil influx and activity have been linked to the overall response of mice treated with PDT, we sought to study a non-invasive means to measure their activity in vivo. To achieve this, we employed the chemiluminescent substrate luminol. In the presence of oxidative burst from myeloid cells, luminol induces chemiluminescence detectable by optical imaging systems.
Studies were conducted in a murine mesothelioma tumor, AB12, that is syngeneic to Balb/c mice. PDT was performed with the photosensitizer Photofrin, thus providing relevancy to ongoing clinical investigation of intraoperative Photofrin-PDT for the treatment of malignant pleural mesothelioma (27, 14). At each timepoint, mice were injected intraperitoneally with luminol (300 mg/kg), similar to that previously described for the study of large granular lymphocytic tumors (21). Ten minutes later, mice were imaged on an IVIS Spectrum system. AB12 flank tumors showed no detectable level of luminol chemiluminescence prior to treatment (median of 1 × 10⁴ p/s/cm2, Figure 1A). One hour after PDT, the level of luminol chemiluminescence significantly (p = 0.0011) increased to a median value of 2.69 × 10⁴ p/s/cm2, although the extent of the increases notably varied among mice within a range that encompassed 0.82 – 14.9 × 10⁴ p/s/cm2 (Figure 1B). At 4h post-PDT, the luminol signal decreased significantly (p = 0.008) to a median value of 7.23 × 10³ p/s/cm2. However, the decrease at 4h was incomplete in some animals in which signal remained strong albeit not as high as that found at 1 h, and as such the 4h post-PDT level remained significantly greater than baseline (p = 0.0008). Supporting Information Figure S1 demonstrates the trends in luminol signal at the level of the individual animals.
Figure 1. PDT induces tumor-localized luminol chemiluminescence.
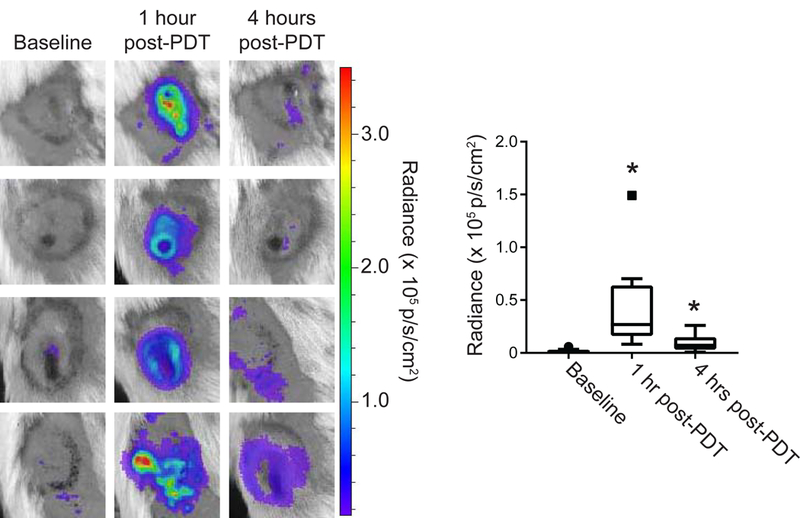
Murine mesothelioma flank tumors (AB12) were treated with PDT and imaged for inflammation via intraperitoneal injection of luminol (300 mg/kg). Images were captured prior to light delivery for PDT and at 1 and 4 hours after the initiation of light delivery for PDT. PDT-generated chemiluminescence increased transiently at 1h with a subsequent decrease at 4h (p = 0.008 for 1h vs 4 hr). Signal at both the 1h and 4h timepoints after PDT was significantly greater than baseline (*p = 0.0011 at 1h, 0.008 for 4h). Solid square symbol at 1h timepoint indicates outlier. N = 15
Luminol chemiluminescent signal is attributable to Ly6G+ cells
To confirm that PDT-generated luminol signal was due to the presence of neutrophils, typically identified as Ly6G+ cells, the co-localization of luminol signal with Ly6G+ cells was examined ex vivo. Luminol signal was well correlated with Ly6G+ cells (Figure 2A). To further relate in vivo luminol signal with the presence of neutrophils, mice were treated with antibodies targeted at Ly6G in order to deplete the neutrophil population prior to PDT and subsequent luminol imaging. Figure 2B demonstrates that Ly6G antibody successfully depleted neutrophils as detected by flow cytometric phenotyping of the neutrophil population via a Ly6C antibody (Ly6Cmid cells). Notably, Ly6C was used as the detection antibody in place of Ly6G so as to avoid the false detection of depletion that can occur if the same clone is utilized for depletion and detection. Importantly, these data demonstrate that depletion of Ly6G+ cells diminished luminol signal 1h after PDT administration (Figure 2C). These data show that increases in luminol activity as detected by in vivo imaging at times after PDT are associated with Ly6G positive cells.
Figure 2. Luminol signal after PDT associates with tumor-localized Ly6G+ cells.
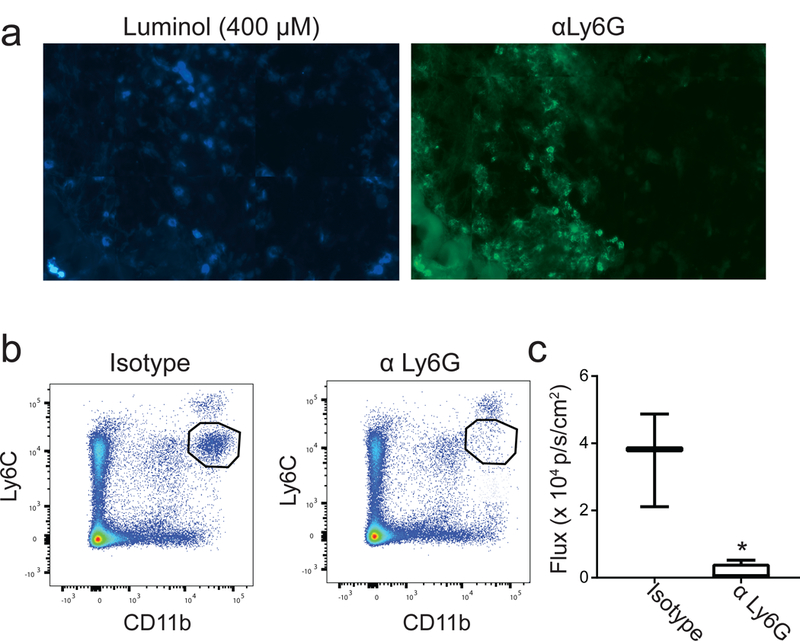
(a) Tumor sections were stained with luminol (400 μM) and hydrogen peroxide (20 μM) prior to immunofluorescent labeling using anti-Ly6G. Luminol signal co-localized with Ly6G+ cells in the tumor, supporting the role for neutrophil-derived MPO in generating chemiluminescence. To confirm this, neutrophils were depleted via administration of antibodies targeted at Ly6G (αLy6G). Depletion was confirmed via flow cytometry of spleens 24h after the second dose of antibody by interpreting the pool of Ly6Cmid cells (b). Chemiluminescence was significantly decreased (*p = 0.047) 1 hour after PDT in neutrophil-depleted mice compared to those treated with an isotype control antibody (c). N ≥ 3 for depletion studies.
Influx of Ly6G+ cells is limited at early timepoints after PDT
The above data provide evidence of the activation of Ly6G+ cells after PDT as detected by luminol imaging. PDT is known to promote neutrophil influx into phototherapy-exposed tissue, leading us to consider how PDT-induced changes in luminol signaling correlated with tumor neutrophil content at each timepoint. For quantification of neutrophils, the percentage of Ly6G+ cells among viable cells isolated from tumor was determined by flow cytometry (Figure 3A). Interestingly, the level of Ly6G+ cells in the tumor at 1h after PDT was equivalent to that found in untreated controls (Figure 3B). Trending lower levels were found at 4h after PDT. These results demonstrate that for the treatment conditions and tumor model studied, PDT did not promote large increases in the number of tumor-associated Ly6G+ cells at short timepoints after treatment. However, when flow cytometric analyses were extended to a 24h timepoint after PDT, it was apparent that an increase in number of Ly6G+ cells did occur at this later timepoint, as has been reported for Photofrin-PDT by others (3). Unfortunately, corresponding studies of luminol signal could not be evaluated at 24h post-PDT because at this late timepoint, the presence of erythema and scabbing in the treatment field prevented detection of the chemiluminescent signal; moreover, the development of tumor vascular shutdown at 24h after PDT may limit the delivery of luminol to the tumor.
Figure 3. Tumor content of Ly6G+ cells did not increase at 1h and 4h after PDT.
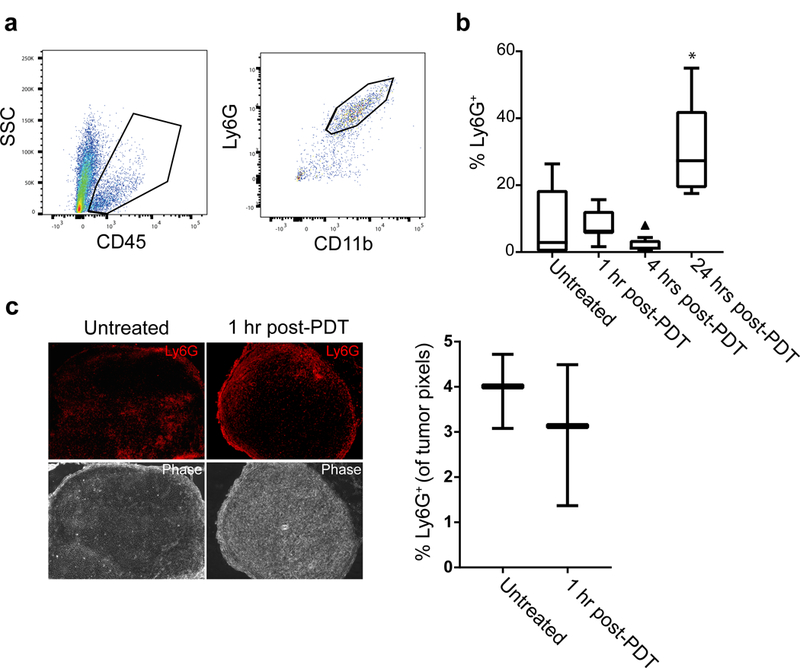
Neutrophils were measured as the number of live, singlet CD11b+Ly6G+ cells in the tumor setting. The vitality of events was determined using Aqua Live/Dead stain prior to gating the proportion of CD45+ cells and evaluating CD11b and Ly6G expression (a). The proportion of Ly6G+ cells showed no change 1h after PDT followed by a trending decrease at 4h post-PDT (triangle indicates outlier value) (b). Similar to previous reports in Photofrin-PDT, neutrophil influx occurred at 24 h after PDT administration. Minimal change in neutrophil content at 1h after PDT was confirmed via immunofluorescent staining of Ly6G+ cells in PDT-treated and untreated sections (c). N ≥ 5 per condition for flow studies and N = 3 per condition for immunofluorescent studies. *p = 0.023 for comparison to untreated condition in the flow studies.
To further confirm similarities in the neutrophil content of untreated versus PDT-treated tumors (1h after PDT), we studied Ly6G+ cell localization to tumors via immunohistochemistry. Similar levels of tumor infiltration by Ly6G+ cells (percentage of positive pixels in tumor tissue) were detected between the conditions (Figure 3C). These data establish that tumor content of Ly6G+ cells at 1 h after PDT remained unchanged compared to untreated controls. From these results, we conclude that increases in luminol signaling at 1h after PDT were not secondary to increases in the localization of Ly6G+ cells to tumors. Consequently, the increased luminol activity at 1h after PDT is attributable to activation of Ly6G+ cells independent of any increase in their numbers.
In contrast to that found at 1h post-PDT, at 4h post-PDT both flow cytometric quantification of Ly6G+ cell numbers and luminol detection of neutrophil activation trended toward lower values. Thus, the decrease in luminol signal at 4h post-PDT relative to 1h post-PDT may be affected by decreases in Ly6G+ cells numbers at this timepoint. Because PDT is known to promote progressive deterioration of tumor blood flow with time after treatment, we assayed tumor perfusion at 4h after PDT to exclude the possibility that significant ischemia may have limited the delivery of luminol or oxygen (also necessary for chemiluminescence) to the tumor. Resulting data show tumor perfusion at 4h after PDT was equivalent to control levels (Supporting Information, Figure S2). In fact, images of luminol signal versus perfusion at 4h reveal an interesting spatial pattern whereby perfusion-maintained and luminol-positive areas of the tumor can be mutually exclusive. These images therefore suggest that at 4 h post-PDT activated Ly6G+ cells are present from earlier times rather than accounted for among newly influxing cells, the latter of which would be expected to more closely colocalize with perfused areas.
PDT-induced luminol chemiluminescence is associated with neutrophil activation
Having confirmed that Ly6G+ cells serve as the source of the luminol chemiluminescent signal after PDT and that their presence was not increased by PDT, we next considered PDT effect on the MPO enzyme that produces luminol-reacting hypochlorous acid, possibility in cooperation with superoxide anion and H2O2 as oxidative species (19). It is neutrophil-produced oxidative species and hypochlorous acid that mediate the phagocytic and destructive effects of neutrophils (10). In unstressed neutrophils, MPO is stored in azurophilic granules, but upon neutrophil engagement the enzyme is released to phagosomes or the extracellular space (28). Using intracellular flow cytometry, MPO levels were assayed in Ly6G+ cells from untreated tumors, as well as tumors that had received PDT 1h or 4h earlier. After PDT, a larger fraction of Ly6G+ cells express MPO (Figure 4). However, the MPO signal does not exceed the highest level observed in untreated cells.
Figure 4. PDT increases the prevalence of high-MPO Ly6G+ cells, but not intracellular MPO expression.
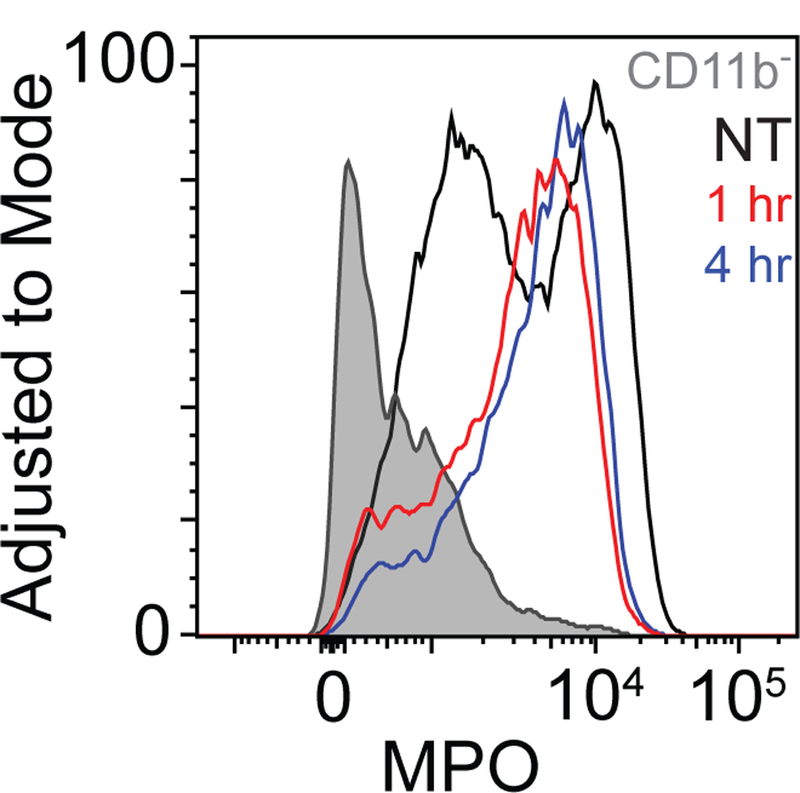
Intracellular levels of MPO were assessed for permeabilized, fixed CD11b+Ly6G+ cells and for CD45+CD11b− cells. CD11b+Ly6G+ cells showed a higher level of MPO than their CD11b-counterparts. PDT induced the expression of MPO in a larger fraction of Ly6G+ cells, though the maximum level achieved was not greater than that of untreated controls. Data represents one of two repetitions.
We further examined how chemiluminescent signal depended on the generation of oxidative species (e.g. H2O2 and HOCl) that would be released upon neutrophil activation. To achieve this, we administered dimethyl sulfoxide (DMSO), which is known to inhibit the oxidative functions that produce these species (29). Intratumoral administration of DMSO immediately prior to PDT significantly diminished luminol chemiluminescence at 1h post-PDT (p = 0.016, Figure 5). Therefore, it appears that luminol chemiluminescence represents the generation of these oxygen species by activated neutrophils in the post-PDT tumor.
Figure 5. Induction of luminol signal after PDT relies on oxidant production.
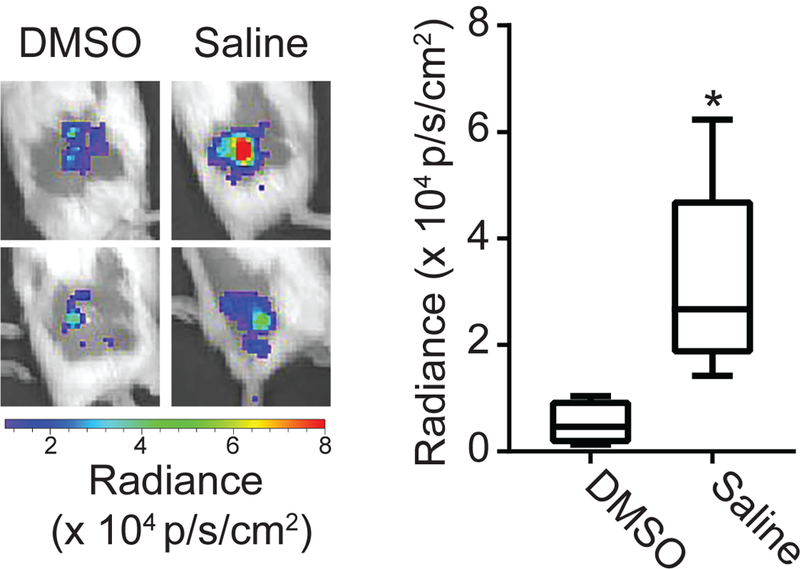
Tumors were injected with DMSO (an inhibitor of H2O2 and HOCl production) or saline intratumorally prior to administration of PDT and imaging with luminol. Luminol imaging was performed at 1h after initiation of PDT. DMSO-treated tumors showed a significant decrease in the level of chemiluminescence. N = 5 for saline and N = 4 for DMSO, * p=0.016
Luminol signal associates with long-term tumor response
The above data demonstrate strong PDT-induced activation of Ly6G+ cells at 1 h after PDT. Because of the known cytotoxic action and immune-associated functions of neutrophils that could contribute to treatment outcome, we evaluated the association between PDT-induced neutrophil activation and long-term therapeutic response. Mice bearing AB12 tumors were treated with Photofrin-PDT, imaged for neutrophil activation at 1h after PDT, and subsequently tracked for regrowth. Based on long-term tumor response, animals were divided into two groups as a function of whether or not they experienced tumor recurrence (over 90 days after PDT). Interestingly, those animals without evidence of tumor recurrence (“Complete Response”) had significantly higher levels of luminol flux at 1h after PDT compared to animals that experienced tumor recurrence (Figure 6). Tumor controls showed no long-term response (data not shown). Moreover, we note that activation of Ly6G+ cells in the treated tumors was very transient given large decreases in luminol chemiluminescence at 4h post-PDT (see Supporting Information, Figure S1). From these results, we posit that greater levels of neutrophil activity at 1h after PDT, followed by its rapid resolution, contributed to improved therapeutic outcome. This may be attributable to the neutrophil’s contribution to tumor eradication or engagement of anti-tumor immunity.
Figure 6. Luminol imaging associates with long-term tumor response.
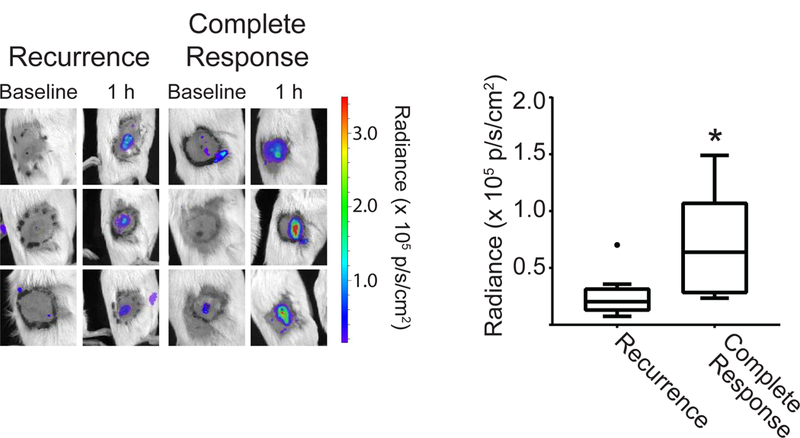
Mice without evidence of tumor recurrence 90 days after treatment (“Complete Response”) had significantly higher luminol signal, taken as the average flux within the 1.1 cm treatment field (black circle), at the 1h post-PDT timepoint. Filled circle in recurrence group indicates outlier. N = 5 for Complete Response and N = 15 for Recurrence. *p = 0.025 for the comparison between mice with a complete response versus recurrence.
Discussion
Previous studies have demonstrated the contribution of inflammation in the establishment of long-term responses to PDT of neoplastic disease (5, 13, 12). Motivated by this work, we sought to define a means by which PDT-induced inflammation could be monitored in vivo in preclinical models. For in vivo imaging, we utilized the substrate luminol, which targets intracellular and extracellular myeloperoxidase contributed by neutrophils. Although neutrophils are the primary source of myeloperoxidase, it is also expressed by macrophages (30, 31). We therefore demonstrated that luminol imaging was specific to the presence of Ly6G, which is a subunit of the Gr1 receptor, expressed on neutrophils and not macrophages or monocytes (Figure 2).
Interestingly, the chemiluminescent signal generated from PDT-treated tumors did not appear to be due to an influx of Ly6G+ cells, as the level in tumors at 1h after PDT was equivalent to that in untreated tumors. These results suggest two possible scenarios. In the first, pre-existing Ly6G+ cells were activated in response to PDT and therefore the Ly6G+ cells detected at the post-PDT timepoint are the same as those present prior to light administration. In the second scenario, Ly6G+ cells present in the tumor prior to PDT administration were eradicated at the time of light exposure and inflammatory signaling rapidly attracted new Ly6G+ cells into the tumor tissue in the post-PDT period. This scenario seems less likely at the 1h timepoint that we studied because the level of the integrin ligand CD11b would be assumed to be higher on these neutrophils in order to facilitate their extravasation from circulation. Indeed, previous study of neutrophils responding to the PDT-treated tumor found higher expression of CD11b in squamous cell carcinoma (5). We found no such increase in the mean fluorescence of CD11b in Ly6G+ cells isolated from tumors post-PDT (data not shown). Moreover, images of perfusion versus luminol activity at 4h after PDT (Figure S2) further suggest that activated neutrophils are not newly infiltrating. These images depict the localization of luminol positive Ly6G+ cells to tumor areas outside of those with the best maintained perfusion.
The observed time-frame of neutrophil influx is similar to that observed in Photofrin-PDT by Gollnick et al. in EMT6 mammary carcinoma tumors. In this published study, 100 J/cm2 applied to the tumors at 75 mW/cm2 led to increases in neutrophil population from 4% at 5 min after PDT to a staggering 37% of the cell population, at 24h post-PDT (3). Photofrin-PDT was more inflammatory than its porphyrin relative 2-[1-hexyloxyethyl]-2-devinyl pyropheophorbide-a (HPPH), as treatment of EMT-6 tumors with the latter resulted in a mean neutrophil population of 13.8% at 24h (2). Studies in squamous cell carcinoma (SCCVII) tumors demonstrated a shorter time-frame for neutrophil influx (albeit still longer than the 1–4h we evaluated), showing a maximum of 9 × 10⁶ neutrophils per 100 mg tumor at 8h post-PDT (5).
The increased luminol signal observed in the post-PDT tumor could be a result of increases in intracellular and/or extracellular MPO levels. Previous research on luminol imaging has suggested in some cases that luminol signal is due to both the extracellular and the intracellular activity of MPO (32–35), while other literature suggests that it is a consequence of intracellular MPO activity (36). Therefore, we investigated PDT-induced differences in MPO expression by intracellular flow cytometry and found that PDT was associated with the expression of MPO in a larger fraction of Ly6G+ cells as compared to untreated controls (Figure 4).In comparison, Sun et al. reported that the total concentration of MPO was greater than the pre-treatment level as early as 2h post-PDT, with the peak MPO concentration reached at 14h (5). In their study, the majority of the total MPO weight extracted from cells appeared to be from the fraction existent inside the neutrophils. In vivo increases in luminol signaling in our study also provide evidence of MPO activation after PDT. Yet, we also found that the fraction of cells expressing MPO increased after PDT, thus we suggest that increases in luminol activity may be due to the polarization of Ly6G+ cells towards a more MPO-expressive phenotype. Our data further confirm that inhibition of oxidative species associated with neutrophil activation reduces chemiluminescent signal (Figure 5), thus providing evidence that luminol signal is associated with neutrophil activation as reported for this assay (29).
In contrast to the results found at 1h after PDT, the numbers of tumor-associated Ly6G+ cells decreased at 4h after PDT. A previous study by Brackett et al. demonstrated that this timepoint corresponded with a significant increase in the number of neutrophils present in the tumor-draining lymph node in Colo26 tumors (37). Therefore, the decreased level of Ly6G+ cells in the tumor at 4h after PDT may represent a translocation of antigen-experienced neutrophils to the lymph node via high-endothelial venules (HEVs) in order to enhance the formation of anti-tumor immunity.
A caveat of neutrophil migration may be that MPO expression in the tumor-draining lymph node can be immunosuppressive in nature. Four hours after the injection of OVA antigen, neutrophils were observed in the lymph node and deposited MPO which interacted with dendritic cells (28, 38). Such a release of MPO can impair expression of the co-stimulatory molecule CD86 and production of the cytokines IL-12 and IL-23. If the timeframe of neutrophil activity in the tumor draining lymph node mimics that in the tumor (with reductions detected at the 4h timepoint), our observations may represent a situation optimal for establishing anti-tumor immunity.
Taken together, the present report demonstrates the importance of the inflammatory condition for Photofrin-PDT of mesothelioma tumors. Our work is in agreement with numerous studies that have diminished or modified inflammation in order to inhibit long-term effects (13, 12). Utilizing a longitudinal model, we have demonstrated herein that mouse-to-mouse differences in the activation of Ly6G+ cells associate with heterogeneity in treatment response. In our study, the quintessential timing of Ly6G+ cells is an initial burst of activation 1h post-PDT followed by a decrease in their presence 4h post-PDT. Increases in neutrophil activity at the 1h timepoint may positively impact outcome because MPO activity at early timepoints after PDT may serve as a mechanism of tumor eradication which complements the direct killing of tumor cells and the shutdown of tumor vasculature. Contrastingly, neutrophil presence at the 4h timepoint may be detrimental. In a previous study, Gr-1+ cells found beyond the 1h timepoint were associated with immunosuppressive functions (39). Referred to as Mregs by these researchers, the cell markers are comparable to that of the modern definition of myeloid-derived suppressor cells. These myeloid-derived suppressor cells are also detected as CD11b+ Ly6G+ cells, and are differentiated from classic neutrophils based on function (40). Notably, secretion of TGF-β in the AB12 model was found to polarize CD11b+ Ly6G+ cells towards an immunosuppressive phenotype characterized by greater expression of arginase-1 and lower expression of TNF-α and ICAM-1 (41). Additional study will therefore be required to determine the phenotype and function of these persistent Ly6G+ cells in mesothelioma.
The juxtaposition between neutrophils that generate immunosuppression and those that serve to contribute to long-term response to PDT may also depend on the tumor model and treatment condition. In fact, the contribution of inflammation to PDT outcome may vary significantly as a function of illumination condition (12). Therefore, it will be necessary to consider factors such as tumor model and PDT protocol when studying the role of innate immunity in generating long-term tumor control. Our study suggests that for the condition under investigation, administration of agents designed to modify the inflammatory profile may be valuable to maximize the potency of PDT. In the pursuit of these studies, luminol chemiluminescence can serve as a preclinical indicator of the inflammation achieved after combinatorial treatment as well as a predictor of PDT-generated response.
Supplementary Material
Acknowledgements.
This work was supported by NIH/NCI grants P01-CA087971 and R01-CA85831. We express thanks to the University of Pennsylvania Small Animal Imaging Facility.
Footnotes
This article is part of a Special Issue celebrating Photochemistry and Photobiology’s 55th Anniversary.
Conflict of Interest. The authors have stated explicitly that there are no conflicts of interest in connection with this article.
References
- 1.Brackett CM and Gollnick SO (2011) Photodynamic therapy enhancement of anti-tumor immunity. Photochem Photobiol Sci 10, 649–652. [DOI] [PMC free article] [PubMed] [Google Scholar]
- 2.Gollnick SO, Evans SS, Baumann H, Owczarczak B, Maier P, Vaughan L, Wang WC, Unger E and Henderson BW (2003) Role of cytokines in photodynamic therapy-induced local and systemic inflammation. Br J Cancer 88, 1772–1779. [DOI] [PMC free article] [PubMed] [Google Scholar]
- 3.Gollnick SO, Liu X, Owczarczak B, Musser DA and Henderson BW (1997) Altered expression of interleukin 6 and interleukin 10 as a result of photodynamic therapy in vivo. Cancer Res 57, 3904–3909. [PubMed] [Google Scholar]
- 4.Evans S, Matthews W, Perry R, Fraker D, Norton J and Pass HI (1990) Effect of photodynamic therapy on tumor necrosis factor production by murine macrophages. J Natl Cancer Inst 82, 34–39. [DOI] [PubMed] [Google Scholar]
- 5.Sun J, Cecic I, Parkins CS and Korbelik M (2002) Neutrophils as inflammatory and immune effectors in photodynamic therapy-treated mouse SCCVII tumours. Photochem Photobiol Sci 1, 690–695. [DOI] [PubMed] [Google Scholar]
- 6.Brackett CM, Owczarczak B, Ramsey K, Maier PG and Gollnick SO (2011) IL-6 potentiates tumor resistance to photodynamic therapy (PDT). Lasers Surg Med 43, 676–685. [DOI] [PMC free article] [PubMed] [Google Scholar]
- 7.Gollnick SO and Brackett CM (2010) Enhancement of anti-tumor immunity by photodynamic therapy. Immunol Res 46, 216–226. [DOI] [PMC free article] [PubMed] [Google Scholar]
- 8.Nowis D, Stoklosa T, Legat M, Issat T, Jakobisiak M and Golab J (2005) The influence of photodynamic therapy on the immune response. Photodiagnosis Photodyn Ther 2, 283–298. [DOI] [PubMed] [Google Scholar]
- 9.Dellian M, Abels C, Kuhnle GE and Goetz AE (1995) Effects of photodynamic therapy on leucocyte-endothelium interaction: differences between normal and tumour tissue. Br J Cancer 72, 1125–1130. [DOI] [PMC free article] [PubMed] [Google Scholar]
- 10.Uribe-Querol E and Rosales C (2015) Neutrophils in Cancer: Two Sides of the Same Coin. J Immunol Res 2015, 983698. [DOI] [PMC free article] [PubMed] [Google Scholar]
- 11.Kobayashi W, Liu Q, Matsumiya T, Nakagawa H, Yoshida H, Imaizumi T, Satoh K and Kimura H (2004) Photodynamic therapy upregulates expression of Mac-1 and generation of leukotriene B(4) by human polymorphonuclear leukocytes. Oral Oncol 40, 506–510. [DOI] [PubMed] [Google Scholar]
- 12.Kousis PC, Henderson BW, Maier PG and Gollnick SO (2007) Photodynamic therapy enhancement of antitumor immunity is regulated by neutrophils. Cancer Res 67, 10501–10510. [DOI] [PMC free article] [PubMed] [Google Scholar]
- 13.Henderson BW, Gollnick SO, Snyder JW, Busch TM, Kousis PC, Cheney RT and Morgan J (2004) Choice of oxygen-conserving treatment regimen determines the inflammatory response and outcome of photodynamic therapy of tumors. Cancer Res 64, 2120–2126. [DOI] [PubMed] [Google Scholar]
- 14.Friedberg JS, Simone CB 2nd Culligan MJ, Barsky AR, Doucette A, McNulty S, Hahn SM, Alley E, Sterman DH, Glatstein E and Cengel KA (2017) Extended Pleurectomy-Decortication-Based Treatment for Advanced Stage Epithelial Mesothelioma Yielding a Median Survival of Nearly Three Years. Ann Thorac Surg 103, 912–919. [DOI] [PMC free article] [PubMed] [Google Scholar]
- 15.Davis R. W. t., Papasavvas E, Klampatsa A, Putt M, Montaner LJ, Culligan MJ, McNulty S, Friedberg JS, Simone CB 2nd, Singhal S, Albelda SM, Cengel KA and Busch TM (2018) A preclinical model to investigate the role of surgically-induced inflammation in tumor responses to intraoperative photodynamic therapy. Lasers Surg Med 50, 440–450 [DOI] [PMC free article] [PubMed] [Google Scholar]
- 16.Mitra S, Modi KD and Foster TH (2013) Enzyme-activatable imaging probe reveals enhanced neutrophil elastase activity in tumors following photodynamic therapy. J Biomed Opt 18, 101314. [DOI] [PMC free article] [PubMed] [Google Scholar]
- 17.Huang J, Milton A, Arnold RD, Huang H, Smith F, Panizzi JR and Panizzi P (2016) Methods for measuring myeloperoxidase activity toward assessing inhibitor efficacy in living systems. J Leukoc Biol 99, 541–548. [DOI] [PMC free article] [PubMed] [Google Scholar]
- 18.Vilim V and Wilhelm J (1989) What do we measure by a luminol-dependent chemiluminescence of phagocytes? Free Radic Biol Med 6, 623–629. [DOI] [PubMed] [Google Scholar]
- 19.Bedouhene S, Moulti-Mati F, Hurtado-Nedelec M, Dang PM and El-Benna J (2017) Luminol-amplified chemiluminescence detects mainly superoxide anion produced by human neutrophils. Am J Blood Res 7, 41–48. [PMC free article] [PubMed] [Google Scholar]
- 20.Aitken RJ, Buckingham DW and West KM (1992) Reactive oxygen species and human spermatozoa: analysis of the cellular mechanisms involved in luminol- and lucigenin-dependent chemiluminescence. J Cell Physiol 151, 466–477. [DOI] [PubMed] [Google Scholar]
- 21.Gross S, Gammon ST, Moss BL, Rauch D, Harding J, Heinecke JW, Ratner L and Piwnica-Worms D (2009) Bioluminescence imaging of myeloperoxidase activity in vivo. Nat Med 15, 455–461. [DOI] [PMC free article] [PubMed] [Google Scholar]
- 22.Alshetaiwi HS, Balivada S, Shrestha TB, Pyle M, Basel MT, Bossmann SH and Troyer DL (2013) Luminol-based bioluminescence imaging of mouse mammary tumors. J Photochem Photobiol B 127, 223–228. [DOI] [PubMed] [Google Scholar]
- 23.Tseng JC and Kung AL (2012) In vivo imaging of inflammatory phagocytes. Chem Biol 19, 1199–1209. [DOI] [PubMed] [Google Scholar]
- 24.Chen WT, Tung CH and Weissleder R (2004) Imaging reactive oxygen species in arthritis. Mol Imaging 3, 159–162. [DOI] [PubMed] [Google Scholar]
- 25.Liu WF, Ma M, Bratlie KM, Dang TT, Langer R and Anderson DG (2011) Real-time in vivo detection of biomaterial-induced reactive oxygen species. Biomaterials 32, 1796–1801. [DOI] [PMC free article] [PubMed] [Google Scholar]
- 26.Huang J, Smith F, Panizzi JR, Goodwin DC and Panizzi P (2015) Inactivation of myeloperoxidase by benzoic acid hydrazide. Arch Biochem Biophys 570, 14–22. [DOI] [PMC free article] [PubMed] [Google Scholar]
- 27.Friedberg JS, Culligan MJ, Mick R, Stevenson J, Hahn SM, Sterman D, Punekar S, Glatstein E and Cengel K (2012) Radical pleurectomy and intraoperative photodynamic therapy for malignant pleural mesothelioma. Ann Thorac Surg 93, 1658–1665; discussion 1665–1657. [DOI] [PMC free article] [PubMed] [Google Scholar]
- 28.Odobasic D, Kitching AR and Holdsworth SR (2016) Neutrophil-Mediated Regulation of Innate and Adaptive Immunity: The Role of Myeloperoxidase. J Immunol Res 2016, 2349817. [DOI] [PMC free article] [PubMed] [Google Scholar]
- 29.Beilke MA, Collins-Lech C and Sohnle PG (1987) Effects of dimethyl sulfoxide on the oxidative function of human neutrophils. J Lab Clin Med 110, 91–96. [PubMed] [Google Scholar]
- 30.Rodrigues MR, Rodriguez D, Russo M and Campa A (2002) Macrophage activation includes high intracellular myeloperoxidase activity. Biochem Biophys Res Commun 292, 869–873. [DOI] [PubMed] [Google Scholar]
- 31.Sugiyama S, Kugiyama K, Aikawa M, Nakamura S, Ogawa H and Libby P (2004) Hypochlorous acid, a macrophage product, induces endothelial apoptosis and tissue factor expression: involvement of myeloperoxidase-mediated oxidant in plaque erosion and thrombogenesis. Arterioscler Thromb Vasc Biol 24, 1309–1314. [DOI] [PubMed] [Google Scholar]
- 32.Jancinova V, Drabikova K, Nosal R, Rackova L, Majekova M and Holomanova D (2006) The combined luminol/isoluminol chemiluminescence method for differentiating between extracellular and intracellular oxidant production by neutrophils. Redox Rep 11, 110–116. [DOI] [PubMed] [Google Scholar]
- 33.Rajecky M, Lojek A and Ciz M (2012) Differentiating between intra- and extracellular chemiluminescence in diluted whole-blood samples. Int J Lab Hematol 34, 136–142. [DOI] [PubMed] [Google Scholar]
- 34.Briheim G, Stendahl O and Dahlgren C (1984) Intra- and extracellular events in luminol-dependent chemiluminescence of polymorphonuclear leukocytes. Infect Immun 45, 1–5. [DOI] [PMC free article] [PubMed] [Google Scholar]
- 35.Nurcombe HL and Edwards SW (1989) Role of myeloperoxidase in intracellular and extracellular chemiluminescence of neutrophils. Ann Rheum Dis 48, 56–62. [DOI] [PMC free article] [PubMed] [Google Scholar]
- 36.Caldefie-Chezet F, Walrand S, Moinard C, Tridon A, Chassagne J and Vasson MP (2002) Is the neutrophil reactive oxygen species production measured by luminol and lucigenin chemiluminescence intra or extracellular? Comparison with DCFH-DA flow cytometry and cytochrome c reduction. Clin Chim Acta 319, 9–17. [DOI] [PubMed] [Google Scholar]
- 37.Brackett CM, Muhitch JB, Evans SS and Gollnick SO (2013) IL-17 promotes neutrophil entry into tumor-draining lymph nodes following induction of sterile inflammation. J Immunol 191, 4348–4357. [DOI] [PMC free article] [PubMed] [Google Scholar]
- 38.Odobasic D, Kitching AR, Yang Y, O’Sullivan KM, Muljadi RC, Edgtton KL, Tan DS, Summers SA, Morand EF and Holdsworth SR (2013) Neutrophil myeloperoxidase regulates T-cell-driven tissue inflammation in mice by inhibiting dendritic cell function. Blood 121, 4195–4204. [DOI] [PubMed] [Google Scholar]
- 39.Korbelik M, Banath J and Zhang W (2016) Mreg Activity in Tumor Response to Photodynamic Therapy and Photodynamic Therapy-Generated Cancer Vaccines. Cancers (Basel) 8. [DOI] [PMC free article] [PubMed] [Google Scholar]
- 40.Bronte V, Brandau S, Chen SH, Colombo MP, Frey AB, Greten TF, Mandruzzato S, Murray PJ, Ochoa A, Ostrand-Rosenberg S, Rodriguez PC, Sica A, Umansky V, Vonderheide RH and Gabrilovich DI (2016) Recommendations for myeloid-derived suppressor cell nomenclature and characterization standards. Nat Commun 7, 12150. [DOI] [PMC free article] [PubMed] [Google Scholar]
- 41.Fridlender ZG, Sun J, Kim S, Kapoor V, Cheng G, Ling L, Worthen GS and Albelda SM (2009) Polarization of tumor-associated neutrophil phenotype by TGF-beta: “N1” versus “N2” TAN. Cancer Cell 16, 183–194. [DOI] [PMC free article] [PubMed] [Google Scholar]
Associated Data
This section collects any data citations, data availability statements, or supplementary materials included in this article.


