

Abstract
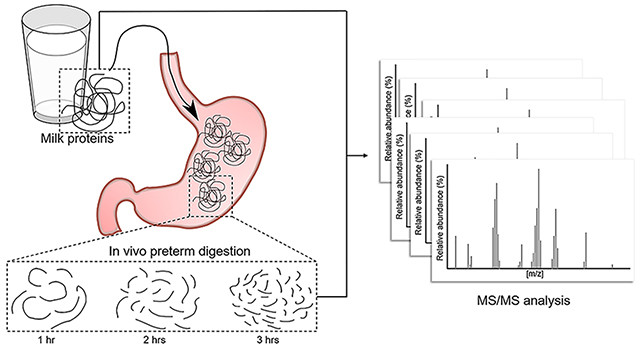
Over the course of milk digestion, native milk proteases and infant digestive proteases fragment intact proteins into peptides with potential bioactivity. This study investigated the release of peptides over 3 h of gastric digestion in 14 preterm infant sample sets. The peptide content was extracted and analyzed from milk and gastric samples via Orbitrap tandem mass spectrometry. The relative ion intensity (abundance) and count of peptides in each sample were compared over time and between infants fed milk fortified with bovine milk fortifier and infants fed unfortified milk. Bioactivity of the identified peptides was predicted by sequence homology to known bioactive milk peptides. Both total and bioactive peptide abundance and count continuously increased over 3 h of gastric digestion. After accounting for infant weight, length, and postconceptual age, fortification of milk limited the release of peptides from human milk proteins. Peptides that survived further gastric digestion after their initial release were structurally more similar to bioactive peptides than nonsurviving peptides. This work is the first to provide a comprehensive profile of milk peptides released during gastric digestion over time, which is an essential step in determining which peptides are most likely to be biologically relevant in the infant. Data are available via ProteomeXchange with identifier PXD012192.
Keywords: bioactive, digestion, gastric, human milk, peptide, preterm
Graphical Abstract
1. INTRODUCTION
Milk has evolved as the sole source of nutrition for the human infant. Milk contains the ideal balance of macronutrients, micronutrients, and other bioactive factors to fuel infant growth and aid in development.1 In addition to providing amino acids for protein synthesis, intact milk proteins have multiple functions within the infant, including supporting the infant immune system,2,3 preventing pathogen growth,4 serving as growth factors,5 and regulating sequestration and delivery of iron.6 Digestion of milk proteins occurs by the action of a combination of proteases native to the milk and digestive proteases secreted by the infant gastrointestinal tract.7 Our previous work has determined that even before expression of milk from the mammary gland, native milk proteases initiate the hydrolysis of milk proteins.8 However, beyond milk proteins’ role as a source of amino acids and as bioactive molecules, digestion of the proteins also releases protein fragments (peptides) that have specific biological activities, including antimicrobial,9 antihypertensive,10 immunomodulatory,11 anti-inflammatory,12 and opioid agonistic and antagonistic effects.13 The evolutionary role of milk proteins in the development of the human infant thus might not be limited to intact function and amino acid release but may also encompass the release and function of bioactive peptides.
The release of these bioactive milk peptides varies by stage of digestion. As different proteases with different cleavage specificities are secreted throughout the gastrointestinal tract, more of the parent protein sequence is broken apart to release peptides with diverse sequences. As the amino acid sequence of the released peptides determines the type of activity they can exert,14 peptides released in the infant stomach may have different functions and sites of action than those already present in human milk, and peptides that survive gastric digestion intact might be released only to act further downstream in the intestine. As such, identifying the release of peptides from milk proteins across time will provide a more complete picture of gastric protein digestion that can aid in the identification of potential bioactive peptides that are most biologically relevant.
Previous work has measured the proteolysis of intact milk proteins in real or simulated infant stomach conditions without examining the resulting peptides.15,16 Other studies have examined in vitro and in vivo gastric milk peptide release, but samples were only collected at a single time point.17–19 These types of profiles of human milk peptides are vital for efforts to identify promising peptide sequences for determination of further bioactivities that are most relevant to the human infant. However, in vitro studies do not adequately represent how digestion occurs in the infant stomach, and the previous in vivo peptidomic analysis study19 only analyzed gastric samples collected 2 h after feeding. As such, there is limited knowledge on which peptides are released and at what time during gastric digestion, and the types of functions these peptides may have in the body.
The present study aimed to identify the peptidomic profile of fortified and nonfortified human milk from preterm-delivering mothers and in gastric samples at three time points (1, 2, and 3 h postfeeding) from their preterm infants. Peptides from the milk and gastric contents were isolated and identified via Orbitrap Fusion Lumos mass spectrometry analysis to assess the change in their release over time. Bioactivity of the peptides was assessed based on sequence homology to known functional peptides in the literature.
2. EXPERIMENTAL PROCEDURES
2.1. Materials
HPLC-grade acetonitrile (ACN) was obtained from Fisher Scientific (Waltham, MA), trifluoroacetic acid (TFA) and HPLC-grade formic acid (FA) were obtained from EMD Millipore (Billerica, MA), and trichloroacetic acid was obtained from Sigma-Aldrich (St. Louis, MO).
2.2. Participants and Samples
This study was approved by the Institutional Review Boards of the University of California, Davis and Oregon State University. Preterm infants were enrolled if they were inpatients in the UC Davis Children’s Hospital Neonatal Intensive Care Unit in Sacramento, California, had an indwelling nasogastric or orogastric feeding tube, and could tolerate full enteral feeding. Most of the enrolled infants required a feeding tube because of uncoordinated or immature capacity to suck and swallow. Infants with anatomic or functional gastrointestinal disorders were excluded from enrollment. Samples were collected from 10 preterm-delivering mother-infant pairs ranging in gestational age (GA) at birth from 23 to 32 weeks and postnatal age of 7 to 98 days. Infant characteristics are described in Table 1. Enrolled preterm infants had medical conditions typical of premature infants, including lung immaturity (respiratory distress syndrome), bronchopulmonary dysplasia, intraventricular hemorrhage, retinopathy of prematurity, patent ductus arteriosus, and sepsis/meningitis but no overt gastrointestinal tract issues. None of the infants sampled received medications known to affect gastric pH or gastric digestion capacity, including prokinetics, H2 blockers/antagonists or proton-pump inhibitors. The enrolled infants were clinically stable at the time of sample collection.
Table 1.
Infant Characteristicsa
| infant | sex | GA at birth (week) | postconceptual age (week) | weight (kg) | length (cm) | fortification | twins with |
|---|---|---|---|---|---|---|---|
| 1b | F | 23 | 28 | 0.95 | 30.5 | None | |
| 1b | F | 23 | 30 | 1.2 | 32 | Gastric Only | |
| 1b | F | 23 | 32 | 1.67 | 39 | Gastric Only | |
| 1b | F | 23 | 35 | 1.8 | 41.5 | All | |
| 1b | F | 23 | 37 | 2.3 | 42 | All | |
| 2 | F | 29 | 30 | 1.1 | 38.5 | None | 3 |
| 3 | F | 29 | 30 | 1.1 | 39.4c | None | 2 |
| 4 | F | 26 | 32 | 1.4 | 37.5 | Gastric Only | |
| 5 | F | 32 | 32 | 1.6 | 42.5 | None | 6 |
| 6 | F | 32 | 32 | 1.5 | 40 | None | 5 |
| 7 | F | 29 | 32 | 1.5 | 39 | All | 8 |
| 8 | F | 29 | 32 | 1.4 | 39 | All | 7 |
| 9 | F | 26 | 34 | 2 | 40.5 | All | |
| 10 | M | 26 | 34 | 2.3 | 43.8 | All |
Postconceptual age is the time at which samples were collected, and includes infant GA plus infant lifespan. Weight and Length were measured at the postconceptual age.
Samples were collected from infant 1 at five different postconceptual ages.
Length value represents birth length rather than postconceptual age length.
The mothers pumped their breast milk into sterile plastic containers at home and froze it in home freezers. Mothers transported their milk to the NICU on ice where it was stored at −20 C. At time of feeding, a 1.5–2 mL sample of the breast milk was collected into a sterile Eppendorf tube after it had been thawed and fortified, or just thawed if no fortification was added. Nine preterm infants (25.2 week GA ± 0.7, 50 ± 7 days of postnatal age) were fed their mother’s milk (not pasteurized) fortified with 1 packet of Human Milk Fortifier (Similac Human Milk Fortifier Powder, Abbot Park, IL, USA) per 25 mL of milk, and five preterm infants (25 ± 3 week GA, 29 ± 9 days of postnatal age) were fed their mother’s milk (not pasteurized) unfortified. The fortifier contained nonfat bovine milk, whey protein concentrate, corn syrup solids, medium-chain triglycerides, calcium phosphate, and potassium citrate. Three sets of twins were included in the study and shared milk samples (11 total milk samples).
The human milk feedings were delivered via the nasogastric tubes over 30 min. A volume of 2 mL was collected from the initial milk feed, and 0.5–2 mL of each preterm infant’s gastric contents was collected in a 3 mL syringe via suction through the feeding tube at 1, 2, and 3 h after the initiation of feeding. Only infants from whom samples were successfully collected at all three time points were included in the study. Milk and gastric samples were placed into sterile plastic vials and stored immediately at −20 °C to prevent further proteolysis. Human milk and gastric samples were transported to OSU on dry ice and stored at −80 °C.
2.3. Sample Preparation
Samples were prepared as in our previous study20 with the following changes. Fifteen microliter aliquots of the skimmed samples were collected and dissolved in 85 μL of 0.1% FA solution to reduce the viscosity of the gastric samples. Milk proteins were precipitated from the samples by addition of 100 μL of 24% trichloroacetic acid. After mixing for 10 s with a vortex mixer, the samples were centrifuged at 10 000g for 20 min at 4 °C, and the supernatant containing the peptides was collected. Peptides were loaded onto C18 reverse-phase preparative chromatography 96-well plates (Glygen, Columbia, MD). Trichloroacetic acid, salts, oligosaccharides, and lactose were washed out with 1% ACN, 0.1% TFA, and peptides were eluted in 80% ACN, 0.1% TFA. The peptide solutions were frozen at −80 °C and lyophilized using a freeze-dry system (Labconco FreeZone 4.5 L, Kansas City, MO). After drying, the samples were rehydrated in 15 μL of 0.1% FA.
2.4. Liquid Chromatography Nanoelectrospray Ionization Mass Spectrometry
Peptides were analyzed with an Orbitrap Fusion Lumos (Thermo Scientific, Waltham, MA) mass spectrometer connected to a Waters Nano Acquity UHPLC (Water Corporation, Milford, MA). One μL of peptides were loaded onto a C18 180 μm × 20 mm, 5-μm bead nanoAcquity UPLC Trap Column (Waters) for enrichment and desalting, and separated with a 100 μm × 100 mm, 1.7-μm bead Acquity UPLC Peptide BEH C18 column (Waters) over 120 min. The mobile phase consisted of 0.1% FA in H2O (Solvent A) and 0.1% FA in ACN (Solvent B). The separation gradient consisted of 3–10% solvent B over 3 min, 10–30% solvent B over 99 min, 30–90% solvent B over 3 min, 90% solvent B for 4 min, 90–3% solvent B over 1 min then finally held at 3% solvent B for 10 min. A 30 min column wash was performed after each sample run.
Mass spectra were collected in positive ionization mode and with data dependent acquisition. Peptides were ionized with an electrospray voltage of 2400 V and ion transfer tube temperature of 300 °C. The mass spectrometer scanned masses between 400 and 1500 m/z. Full scan MS data were acquired in the Orbitrap at 120 K resolution at 200 m/z. The automatic gain control target was 4.0 × 10⁵ over a maximum injection time of 50 ms. Precursor ions were selected for most intense peaks with an ion intensity threshold of 5.0 × 10³ and charge state 2–7. Precursor ions were fragmented using collision-induced dissociation with a collision energy of 35%. Following fragmentation, precursors were excluded (10 ppm mass error) for 1 min.
Raw files were analyzed in Thermo Proteome Discoverer (v2.1.0.81), and a SequestHT search engine identified peptides using an in-house human and bovine milk protein sequence database (Table S1). Potential modifications allowed included phosphorylation of serine and threonine, and oxidation of methionine. Only peptides identified with high confidence were included (P < 0.01), and peptide sequences with multiple modifications were grouped into a single peptide for counts. Counts measured the number of unique peptide sequences identified in a sample. Abundance measured the area under the curve of the eluted peak (ion intensity), as determined by Proteome Discoverer. The mass spectrometry proteomics data have been deposited to the ProteomeXchange Consortium via the PRIDE21 partner repository with the data set identifier PXD012192.
2.5. Data Analysis
A workflow of sample analysis is included as Figure S1. Identified peptides were examined for homology with literature-identified bioactive peptides using our recently created Milk Bioactive Peptide Database (MBPDB, http://mbpdb.nws.oregonstate.edu/ ).22 The MBPDB is a comprehensive source for all milk bioactive peptides. The search was performed as a sequence search that searches for bioactive peptides matching the input peptide sequence. The similarity threshold was set to 80%, with the amino acid scoring matrix set to identity. “Get extra output” was selected to obtain the specific percentage similarity between the query sequence and the database sequence.
The total abundances of peptides were summed and mapped to the parent sequence of human milk proteins using an in-house tool (PepEx), which can be accessed at http://mbpdb.nws.oregonstate.edu/pepex/.
2.6. Statistical Methods
For all statistical analyses, twin samples were considered as separate sample sets (14 complete milk/gastric sample sets). Repeated measures ANOVA followed by Tukey’s honest significant difference post hoc test (GraphPad Prism software, version 7.04) were applied to compare human milk and gastric samples at the three times postingestion for peptide abundance and count. Bonferroni-corrected t-tests were used to compare amino acid percentage between surviving and nonsurviving peptides. Chi-squared test with Yates correction was used to compare proportion of peptides with modifications.
A multiple linear regression model (RStudio, version 3.3.2) was used to assess the impact of meal fortification to peptide content over time, starting with the initial model:
| (1) |
Body weight (kg) refers to the infant’s weight at time of sample collection, body length (cm) refers to the infant’s length at time of collection, and postconceptual age (days) is the age of the infant plus its gestational period. Model selection was performed among the covariates for body weight, body length, and postconceptual age using the function “regsubsets” in the package “leaps”. P values were determined for the coefficients for fortification, time, and fortification × time. Differences were designated significant at P ≤ 0.05.
3. RESULTS AND DISCUSSION
3.1. Peptidomic Profile of Milk Peptides during Digestion
This research is the first study in which in vivo proteolysis and peptide release were tracked over time in the preterm infant stomach. Both in vitro17,18 and in vivo19 studies have been performed in order to measure milk protein digestion and identify the peptides released in the infant stomach. Because these were “snapshot” studies, there is no information on whether the identified peptides represent the end point of gastric digestion, or some time in between the beginning of feeding and the completion of gastric emptying. The inclusion of time as a variable in the study parameters allowed us to gain a deeper understanding of when milk proteins are digested and peptides are released and which peptides survive further digestion. In addition, the use of a state-of-the-art Orbitrap Fusion Lumos mass spectrometer identified a larger number of identified peptides in each sample than previous studies, thus improving the accuracy and comprehensiveness of the final peptide profile.
The peptidomic data from all 56 samples included 11 592 unique peptides (13 545 when counting different post-translational modifications as unique peptides) derived from 299 different milk proteins (Table S2). Of these peptides, 8037 were human milk peptides from 202 human milk proteins, and 3304 were bovine milk peptides from 97 bovine milk proteins. Another 251 identified peptides may have derived from either human or bovine milk proteins due to shared sequences between the species. Table 2 lists the proteins with the highest abundance and count of peptides from all samples. A majority of peptides (8747) were not present in human milk, and were identified in at least one of the three gastric time points (Figure 1). Compared with a previous in vivo digestion study by Dallas et al. that identified 661 unique peptides in milk or after 2 h of digestion,19 this study identified 8916. Most (88.4%) of the peptides in the Dallas study were also identified in the present study. A likely reason for the large difference in number of peptides identified is due to our use of the Orbitrap Fusion Lumos mass spectrometer, which is able to acquire high-accuracy mass spectra much faster than the Q-TOF used in the previous study.
Table 2.
Proteins with the Highest Abundance and Count Averaged Across Relevant Samplesa
| protein | average abundance ± SD | protein | average count ± SD |
|---|---|---|---|
| Human β-casein | 8.85 × 10¹⁰ ± 4.49 ×10¹⁰ | Human β-casein | 285.4 ± 86.8 |
| Bovine β-casein | 4.18 × 10¹⁰ ± 1.60 × 10¹⁰ | Bovine β-casein | 185.2 ± 27.4 |
| Human αs1-casein | 2.34 × 10¹⁰ ± 1.63 × 10¹⁰ | Bovine αs1-casein | 138.9 ± 18.6 |
| Bovine κ -casein | 2.30 × 10¹⁰ ± 1.50 × 10¹⁰ | Bovine κ -casein | 90.2 ± 18.6 |
| Bovine αs1-casein | 2.17 × 10¹⁰ ± 1.28 × 10¹⁰ | Human αs1-casein | 88.8 ± 39.3 |
| Human lactoferrin | 2.12 × 10¹⁰ ± 1.67 × 10¹⁰ | Human osteopontin | 64.7 ± 35.5 |
| Human α-lactalbumin | 2.06 × 10¹⁰ ± 1.65 × 10¹⁰ | Human PIgR | 63.7 ± 19.5 |
| Bovine GLYCAM1 | 1.58 × 10¹⁰ ± 8.65 × 10⁹ | Human lactoferrin | 61.2 ± 37.8 |
| Bovine β-lactoglobulin | 1.54 × 10¹⁰ ± 1.47 × 10¹⁰ | Bovine β-lactoglobulin | 57.2 ± 13.7 |
| Human osteopontin | 1.33 × 10¹⁰ ± 1.25 × 10¹⁰ | Bovine αs2-casein | 54.3 ± 9.6 |
| Human PIgR | 7.30 × 10⁹ ± 3.77 × 10⁹ | Bovine GLYCAM1 | 43.8 ± 6.4 |
| Bovine αs2-casein | 5.94 × 10⁹ ± 2.91 × 10⁹ | Bovine PIgR | 32.4 ± 5.1 |
| Human serum albumin | 5.19 × 10⁹ ± 4.79 × 10⁹ | Human bile salt-activated lipase | 31.8 ± 14.2 |
| Human bile salt-activated lipase | 5.06 × 10⁹ ± 4.56 × 10⁹ | Human tenascin | 21.7 ± 21.7 |
| Human κ-casein | 2.86 × 10⁹ ± 2.13 × 10⁹ | Human κ-casein | 20.4 ± 7.1 |
Human protein n = 14; bovine protein n = 6.
Figure 1.

Venn diagram of the unique peptides identified in each sample and combination of samples.
Both milk peptide count and abundance continuously increased over 3 h of gastric digestion. With milk samples representing the zero time point of gastric digestion for the statistical analyses, the average abundance of peptides increased after each hour of digestion (Figure 2A). Significant increases in abundance occurred between milk and 3 h gastric digestion, and between 1 h digestion and 3 h digestion. Milk to 2 h digestion trended to increase, but was not significant (P = 0.057). Milk peptide counts also significantly increased from 671.2 ± 52.7 unique peptides in milk to 1254.9 ± 142.8 in 1 h gastric samples, 1490.6 ± 113.2 in 2 h samples, and 1629.1 ± 102.1 in 3 h samples (Figure 2B). Interestingly, of the peptides found in both milk and 3 h samples, more peptides were significantly higher in milk than 3 h (Figure 2C). The majority of the increase in peptide abundance in 3 h samples is thus likely due to the release of additional peptides that were not present in milk.
Figure 2.

Boxplots of the abundance (A) and count (B) of total peptides from all infants by sample type. Boxes are bordered by the first and third quartiles. The center bar represents the median, n = 14. ***P < 0.001, **P < 0.01, and *P < 0.05. Volcano plot (C) depicting the fold change in peptide intensity (3 h gastric divided by milk) vs the FDR-corrected p-value between peptides found in both milk and 3 h gastric digests. Filled circles indicate significant (q < 0.05) peptides >10-fold higher or lower in gastric samples.
Milk peptides that were present in a majority of the infants (8 or more out of 14) for each sample type accounted for the majority of peptide abundance. One hundred and ninety-one peptides were found in a majority of milk samples, 314 in a majority of 1 h gastric samples, 454 in a majority of 2 h samples, and 613 in a majority of 3 h samples. These common peptides accounted for the majority of peptide abundance at 62.9% ± 23.9%, 63.1% ± 15%, 60.5% ± 10.9%, and 69.1% ± 10.7% of sample type abundances, respectively. A small subset of these peptides was found in every infant for each sample type. Sixteen peptides were found in all milk samples, 9 in all 1 h gastric samples, 7 in all 2 h samples, and 11 in all 3 h samples. These shared peptides are indicated on Table S2.
These findings support our previous finding of an increase in total proteolysis in the infant stomach over time.23 As average gastric half-emptying time ranges from 45 to 100 min for preterm infants,24–26 3 h likely represents the end point of gastric digestion and captures all peptides released by pepsin and milk proteases in the stomach before transit to the duodenum. Pepsin is secreted by the infant stomach, and additional proteases, such as cathepsin D and plasmin,7,27 are naturally present in milk and known to be active even in somewhat acidic gastric conditions in the infant. The combined activity of pepsin and native milk proteases on intact milk proteins and any peptides already released in the mammary gland maximizes the count of unique peptides and peptide abundance prior to milk entering the small intestine. As this study concluded with the end of gastric digestion, it is not known whether 3 h gastric digest samples represent maximum peptide content, or whether the activity of pancreatic proteases continues to increase the count and abundance of milk peptides rather than reduce them through further degradation to their component amino acids.
3.2. Comparison between Fortified and Nonfortified Samples
Preterm infant milk is often fortified with additional milk protein to provide for the infant’s increased protein requirements. However, fortification is typically sourced from bovine milk, thus altering the total protein composition of the milk. Human milk is the ideal source of nutrition for preterm infants as it reduces risk of sepsis, necrotizing enterocolitis, and other infections compared with formula.28,29 Human milk provides the infant with bioactive proteins such as immunoglobulins, cytokines, growth factors, and antimicrobial proteins that are not active in bovine milk-based fortifier.30 It is therefore possible that human milk peptides are also more beneficial to the infant than other peptide sources. To determine the effect of fortification on peptide release, fortified milk-fed infants were compared with nonfortified milk-fed infants. Three sets of infant samples were removed from these comparisons, as the milks collected from these infants’ mothers was reported as nonfortified yet the infant gastric samples reflected fortified milk feeding. The final sample sets included five infants in the nonfortified group and six infants in the fortified group. Peptides that could not be distinguished as either human or bovine milk protein-derived were included in the total peptide analysis, but excluded from the human- and bovine-specific analyses.
Neither total peptide abundance nor human milk peptide abundance changed significantly over time, but nonfortified infants had significantly greater total and human milk peptide abundance than fortified infants (Figure 3A). Bovine milk peptide abundance significantly increased during digestion, but no comparisons were made between fortified and nonfortified samples, as nonfortified infants were only fed human milk. Human milk peptide count, bovine milk peptide count, and total peptide count all significantly increased across 3 h of gastric digestion (Figure 3B). Nonfortified total and human milk peptide counts were also significantly higher than fortified counts. Since the nonfortified samples generally were collected from infants at a lower corrected gestational age (Table 1), it is unlikely that maturity or development of the GI tract (capacity for efficiently releasing milk peptides) is the explanation for the observed differences. A more likely justification for the observed differences is that pepsin activity in fortified infants is divided between digesting human milk proteins and fortifier proteins during the same time of digestion, thus releasing fewer human milk peptides than infants who only receive human milk.
Figure 3.

Comparison of average peptide abundance (A) and count (B) between fortified and nonfortified infants, grouped by milk protein source species. Data are shown as means ± SE, fortified n = 6 infants, nonfortified n = 5 infants. ***P < 0.001, **P < 0.01, and *P < 0.05. M, milk samples; G1, G2, and G3 are gastric samples after 1, 2, and 3 h of digestion, respectively.
We identified additional significant differences between fortified and nonfortified infants concerning how peptides were released from individual milk proteins. Figure 4 compares the release of peptides from the five highest abundance and count human milk proteins. Fortified infants had significantly lower β-casein, αs1-casein, and osteopontin peptide abundance and count, and lower polymeric immunoglobulin count. Only lactoferrin peptide release did not differ by fortification status. These results are notable, as every bioactive peptide identified from human milk was identified from either β-casein, αs1-casein, lactoferrin, or κ-casein (which also had significantly lower count in fortified infants, results not shown).22 These differences likely did not impact total protein nutrition to fortified infants, as bovine milk peptides accounted for the difference in protein digestion. However, the impact to infant health and development could potentially arise from the reduced presence of human milk protein-derived bioactive peptides in fortified infants.
Figure 4.

Comparison of average peptide abundance (A) and count (B) between fortified and nonfortified infants, grouped by human milk proteins. Data are shown as means ± SE, fortified n = 6 infants, nonfortified n = 5 infants. ***P < 0.001, **P < 0.01, and *P < 0.05. M, milk samples; G1, G2, and G3 are gastric samples after 1, 2, and 3 h of digestion, respectively; CASB, human β-casein; CASA1, human αs1-casein; TRFL, human lactoferrin; LALBA, human α-lactalbumin; OSTP, human osteopontin; PIGR, human polymeric immunoglobulin receptor.
3.3. Bioactive Peptides in the Stomach
Milk proteins have been a highly studied source of bioactive peptides due to milk’s evolution as a source of nutrition for mammals. Bioactive peptides have been shown to be released from milk proteins by natural milk proteases,8 bacterial proteases,31,32 and in vitro digestive proteases,17,18,33 but few studies have measured the bioactivity of peptides released by in vivo human digestive proteases. The purpose of this study was not to determine the bioactivity of gastric milk peptides, but it does serve as a launch pad for future studies of bioactive peptides. Homology search of total identified peptides revealed 92 unique peptides identical to a known bioactive peptide, and 678 unique peptides with ≥80% sequence homology (770 total) (Table S2). Of the 770 matching peptides, 127 were human milk protein-derived, 631 were bovine milk protein-derived, and 12 could be sourced to either species. Most of the potential bioactive peptides identified were bovine milk peptides, and thus only present in fortified infants. This finding is despite the fact that there were fewer total bovine peptides than human peptides, and is most likely a result of our use of a homology search for identification of potential bioactivity. As bovine milk peptides have been studied far more than human milk peptides, a larger pool of bioactive bovine milk peptides is available for comparison. Continued progress in human milk peptide discovery will increase the number of homologous matches that can be identified in milk digestive samples.
Table 3 lists the breakdown of proteins from which the peptides were found and the types of bioactive function they were identified with. One hundred forty-nine peptides were matched to more than 1 function: 32 had 4 different functions, 32 had 3 functions, and 85 had 2 functions. A range of potential bioactivities was determined in peptides across all sample types. However, it is likely that only a few of the peptides may be functional in the stomach. Opioid-receptors in the stomach can bind milk-derived opioid peptides and delay gastric emptying time,34 and increase mucin production.35 Some bacteria susceptible to antimicrobial peptides have been found in the stomach, although whether these bacteria inhabit the stomach or are merely passing through remains unknown.36
Table 3.
Milk Proteins from Which Homologous Bioactive Peptides Were Identified
| protein | homologous peptides | antihypertensive | antimicrobial | antioxidant | cell proliferative | immunomodulatory | mucin stimulatory | other |
|---|---|---|---|---|---|---|---|---|
| Bovine β-casein | 227 | 150 | 73 | 21 | 21 | 23 | 22 | 84 |
| Bovine α s1-casein | 146 | 71 | 64 | 5 | − | 6 | 5 | 15 |
| Bovine β-lactoglobulin | 118 | 29 | 75 | 5 | 11 | − | − | 41 |
| Human β-casein | 118 | 51 | 46 | 1 | 20 | − | 1 | 1 |
| Bovine α s2-casein | 66 | 9 | 59 | 6 | − | − | − | 1 |
| Bovine κ-casein | 56 | 5 | 41 | − | − | − | 2 | 11 |
| Both β-casein | 12 | 12 | − | − | − | − | − | 1 |
| Bovine α-lactalbumin | 11 | 3 | − | − | − | − | − | 8 |
| Bovine lactoferrin | 7 | − | 2 | − | 5 | − | − | − |
| Human lactoferrin | 6 | − | 4 | − | − | − | 2 | − |
| Human κ-casein | 2 | 1 | − | 1 | − | − | − | − |
| Human α-lactalbumin | 1 | − | − | − | − | − | − | 1 |
Peptides homologous to bioactive peptides in the MBPDB increased over time of gastric digestion. The average abundance of all ≥80% homologous peptides significantly increased from milk to 1 h of gastric digestion (Figure 5A). Homologous peptide abundance tended to increase after two and 3 h of gastric digestion, but changes were not significant. Homologous peptides in the gastric samples represented 18.9%, 18.1%, and 19.9% of the total abundance of 1, 2, and 3 h gastric samples, respectively. Homologous peptides in milk only represented 3.4% of total milk peptide abundance. Peptide count followed a similar pattern of increase as abundance (Figure 5B). Milk contained an average of 52 ± 9.2 homologous peptides, which significantly increased to 129 ± 14.5 in 1 h gastric samples, 147.9 ± 16.7 in 2 h samples, and 158.2 ± 18.3 in 3 h samples. Unlike for total peptide abundance, homologous peptides did not continue to increase across gastric digestion. The only significant increase occurred from milk to 1 h gastric digestion. It seems that the initial introduction of milk proteins to gastric conditions catalyzed the majority of potentially bioactive peptide release, with only small increases thereafter.
Figure 5.

Boxplots of the abundance (A) and count (B) of peptides homologous to bioactive peptides by sample type. Boxes are bordered by the first and third quartiles. The center bar represents the median, n = 14. ***P < 0.001, **P < 0.01, and *P < 0.05.
3.4. Structural Characteristics of Peptide Survivability
Though the relative abundance and count of bioactive peptides increased over digestion, a remaining question was whether bioactive milk peptides were more likely to survive gastric proteolysis than nonbioactive peptides. Consideration of these factors is important, as many identified bioactive peptides are functional for enterocytes specifically,37,38 or against bacteria that primarily inhabit the gut,31 whereas others are functional only when they are absorbed across the intestinal membrane.39 Peptides that survive longer in gastric proteolytic conditions are more likely to reach the intestine and be biologically relevant. We therefore identified factors that may contribute to a peptide’s survival in the stomach by comparing peptides that survived further digestion after their appearance with peptides that were absent from one or more time point after their appearance. However, as gastric emptying is continuous during digestion,24 it is possible that some of the differences were due to peptides progressing into the intestine early rather than being further cleaved.
With milk considered to be digestion time = 0 h, 153 of the 770 homologous peptides were present in at least 1 infant at all time points, 242 were present after 1 h of gastric digestion onward, 80 from 2 h onward, and 46 only appeared after 3 h of digestion. The remaining 244 peptides were not identified in any infant for at least 1 of the time points after their initial appearance, thus likely being further digested after release. In the total peptidome, 7210 peptides survived digestion after their appearance time and 4402 did not. A slightly larger percentage of homologous peptides survived compared with total peptides (67.9% and 62.1%, respectively).
Homologous peptide amino acid composition had more similarities with surviving peptides than nonsurviving peptides (Figure 6A). Surviving peptides had significantly higher percentages of F, L, M, P, Q, V, W, and Y residues, and lower D, E, R, and S residues than nonsurviving peptides. Surviving peptides were thus more likely to be hydrophobic and contain more proline residues. Though pepsin has low amino acid specificity with slight preference for bulky hydrophobic side-chains,40 these bulky side-chains made up a larger percentage of surviving peptides than nonsurviving peptides, indicating an alternate determining factor for survivability. Proline, due to its nitrogen being covalently bound into a ring structure, forms bends in a protein’s secondary structure.41 These bends might be enough to prevent efficient interaction of the active site of pepsin and other proteases with substrate peptide bonds. Proline has been known to reduce protease efficiency when substituted for other amino acids;42,43 thus, the relatively higher percentage of proline in surviving peptides could be a contributing factor to their survival. The high ratio of proline in homologous peptides could indicate their tendency to survive further gastric digestion.
Figure 6.

Comparison of peptide characteristics. (A) Average percentage of amino acids in surviving, nonsurviving, and bioactive peptides. Data are means ±95% CI, surviving n = 7210 peptides, nonsurviving n = 4402, bioactive n = 770. Asterisks (*) indicate significant differences. (B) Percentage of total peptides with modifications for surviving, nonsurviving, and bioactive peptides; surviving n = 7210 peptides, nonsurviving n = 4402, bioactive n = 770. Asterisks (*) indicate significant differences. O, oxidation; P, phosphorylation.
As with amino acid composition, bioactive peptide post-translational modification (PTM) rates more closely resembled surviving peptide modification rates than those of nonsurviving peptides (Figure 6B). Surviving peptides had fewer oxidized Met and phosphorylated Ser and Thr residues than nonsurviving peptides. There are examples of substrate phosphorylation enhancing proteolytic activity of proteases or marking substrates for digestion,44,45 but phosphorylation can also impart proteolytic resistance to the substrate.46 The present study only examined oxidation and phosphorylation as potential PTMs. Future identification of other types of PTMs in peptidomic data can allow further determination of the effect of specific PTMs on peptide resistance or susceptibility to proteolysis. As homologous peptide PTMs more closely resembled surviving peptide PTMs, it is possible that bioactive peptides are more likely to survive gastric digestion.
In addition to analyzing factors that contributed to overall peptide survivability, we also examined rates of peptide release over time across the sequence of three human milk proteins. β-Casein (Figure 7A), αs1-casein (Figure 7B), and lactoferrin (Figure 7C) released the most abundant human milk peptides. Regions of protein digestion appeared to be consistent over time within the protein sequences. For β-casein and αs1-casein, the N-terminal regions (β-casein f(1–42) and αs1-casein f(1– 36)) were most highly abundant in milk, then decreased during gastric digestion, whereas the peaks in regions β-casein f(52–146), β-casein f(181–211), αs1-casein f(97–126), and αs1-casein f(150–167) consistently increased in abundance as digestion progressed. Though lactoferrin had major abundance peaks at f(65–93) and f(271–299), abundance was only distinctly different between milk and gastric samples, and not over time.
Figure 7.

Abundance of peptides released from human milk β-casein (A), αs1-casein (B), and lactoferrin (C) mapped to the protein sequence by amino acid. Results are shown as means, n = 14. Bracketed lines indicate regions of homologous bioactive peptides. i, antihypertensive (20 peptides); ii, antihypertensive (8); iii, cell-proliferative (20); iv, antihypertensive (31); v, antimicrobial (46); vi, antimicrobial (4); vii, mucinstimulatory (2).
We identified seven regions in these three proteins that released multiple peptides with similar bioactivity based on homology. The regions β-casein f(35–52), β-casein f(90–103), and β-casein f(107–133) were antihypertensive, β-casein f(179–211) and lactoferrin f(269–288) were antimicrobial, β-casein f(102–120) was cell-proliferative, and lactoferrin f(660–667) was mucin-stimulatory peptides. Four of these regions corresponded to peaks of peptide release that increased during digestion, suggesting their release may be controlled inside the stomach.
3.5. Conclusions
Several limitations of this study include the use of mass spectrometry to measure peptide release and protein digestion over time. Peptide abundance is an incomplete estimation of protein digestion as the ionization efficiency of peptides differs based on amino acid side chains and PTMs.47,48 Furthermore, the parameters of this study’s mass spectrometry analysis did not allow for identification of low m/z peptides, which may significantly contribute to the total peptide content. The identification of these peptides will be necessary in future studies to complete the peptide profile of milk protein digestion. This study also lacked information on the protein composition of the milk and fortifier, which would improve the analysis of relative peptide release from individual milk proteins. Human milk proteins can vary by the individual, so it will be important to understand how initial milk protein composition affects peptide release.49
The results from the present study contribute to a comprehensive view of milk protein digestion and bioactive peptide release from milk in the stomach of infants. Some remaining questions that future studies will need to address include how protein digestion and peptide release differ between term and preterm infants, the degree of peptide release in the infant intestinal tract, and what bioactive peptides remain undiscovered from the less well-studied regions of the milk proteome, particularly those known to release a large amount of milk peptides. In addition, questions related to clinical practice that deserve study include the impact of released peptide profiles on measures of intestinal health, including inflammation, permeability, motility, the composition and functional capacity of the microbiota, and on gut-related health outcomes such as sepsis and necrotizing enterocolitis. It will also be valuable to determine the impact of continuous vs bolus feeding on milk peptide release and to determine whether some infants would benefit from exogenous proteases (e.g., infants with short gut syndrome or other forms of protein malabsorption).
Supplementary Material
ACKNOWLEDGMENTS
The authors thank Dr. Adam Branscum for statistical guidance and acknowledge the Mass Spectrometry Center at Oregon State University, which is supported in part by the National Institute of Health grant S10OD020111. This work was supported by the K99/R00 Pathway to Independence Career Award, Eunice Kennedy Shriver Institute of Child Health & Development of the National Institutes of Health (R00HD079561) (D.C.D.), the USDA National Institute of Food and Agriculture (D.C.D.), and the Gerber Foundation (D.C.D.).
ABBREVIATIONS
- ACN
acetonitrile
- TFA
trifluoroacetic acid
- FA
formic acid
- GA
gestational age
- PTM
post-translational modification
Footnotes
The authors declare no competing financial interest.
Supporting Information
The Supporting Information is available free of charge on the ACS Publications website at DOI: 10.1021/acs.jproteome.8b00604.
Figure S1: Workflow of the infant samples and the analyses performed on them (PDF)
Table S1: FASTA sequences of the human and bovine milk protein library used to identify peptides in MS/MS; Table S2: List of all milk peptides found in the preterm infant milk and gastric samples (XLSX)
The mass spectrometry proteomics data have been deposited to the ProteomeXchange Consortium via the PRIDE21 partner repository with the data set identifier PXD012192.
REFERENCES
- (1).Lawrence PB Breast milk: best source of nutrition for term and preterm infants. Pediatr. Clin. North Am 1994, 41, 925–941. [DOI] [PubMed] [Google Scholar]
- (2).Liu B; Newburg DS Human milk glycoproteins protect infants against human pathogens. Breastfeed. Med 2013, 8, 354–362. [DOI] [PMC free article] [PubMed] [Google Scholar]
- (3).Hurley WL; Theil PK Perspectives on immunoglobulins in colostrum and milk. Nutrients 2011, 3, 442–474. [DOI] [PMC free article] [PubMed] [Google Scholar]
- (4).Jenssen H; Hancock REW Antimicrobial properties of lactoferrin. Biochimie 2009, 91, 19–29. [DOI] [PubMed] [Google Scholar]
- (5).Blum JW; Baumrucker CR Colostral and milk insulin-like growth factors and related substances: mammary gland and neonatal (intestinal and systemic) targets. Domest. Anim. Endocrinol 2002, 23, 101–110. [DOI] [PubMed] [Google Scholar]
- (6).Rosa L; Cutone A; Lepanto MS; Paesano R; Valenti P Lactoferrin: a natural glycoprotein involved in iron and inflammatory homeostasis. Int. J. Mol. Sci 2017, 18, 1985. [DOI] [PMC free article] [PubMed] [Google Scholar]
- (7).Demers-Mathieu V; Nielsen SD; Underwood MA; Borghese R; Dallas DC Changes in proteases, antiproteases and bioactive proteins from mother’s breast milk to the premature infant stomach. J. Pediatr. Gastroenterol. Nutr 2018, 66, 318–324. [DOI] [PMC free article] [PubMed] [Google Scholar]
- (8).Nielsen SD; Beverly RL; Dallas DC Milk proteins are predigested within the human mammary gland. J. Mammary Gland Biol. Neoplasia 2017, 22, 251–261. [DOI] [PMC free article] [PubMed] [Google Scholar]
- (9).Mohanty D; Jena R; Choudhury PK; Pattnaik R; Mohapatra S; Saini MR Milk derived antimicrobial bioactive peptides: a review. Int. J. Food Prop 2016, 19, 837–846. [Google Scholar]
- (10).Jäkälä P; Vapaatalo H Antihypertensive peptides from milk̈ proteins. Pharmaceuticals 2010, 3, 251–272. [DOI] [PMC free article] [PubMed] [Google Scholar]
- (11).Reyes-Díaz A; González-Có rdova AF; Hernández-Mendoza A; Reyes-Díaz R; Vallejo-Cordoba B Immunomodulation by hydrolysates and peptides derived from milk proteins. Int. J. Dairy Technol 2018, 71, 1–9. [Google Scholar]
- (12).Ma Y; Liu J; Shi H; Yu LL Isolation and characterization of anti-inflammatory peptides derived from whey protein. J. Dairy Sci 2016, 99, 6902–6912. [DOI] [PubMed] [Google Scholar]
- (13).Pihlanto-Leppälä A Bioactive peptides derived from bovinë whey proteins: opioid and ace-inhibitory peptides. Trends Food Sci. Technol 2000, 11, 347–356. [Google Scholar]
- (14).Li Y; Yu J Research progress in structure-activity relationship of bioactive peptides. J. Med. Food 2015, 18, 147–156. [DOI] [PubMed] [Google Scholar]
- (15).Zhang Q; Cundiff JK; Maria SD; McMahon RJ; Wickham MSJ; Faulks RM; van Tol EAF Differential digestion of human milk proteins in a simulated stomach model. J. Proteome Res 2014, 13, 1055–1064. [DOI] [PubMed] [Google Scholar]
- (16).Davidson LA; Lönnerdal BO Persistence of human milk proteins in the breast-fed infant. Acta Paediatr. 1987, 76, 733–740. [DOI] [PubMed] [Google Scholar]
- (17).Hernandez-Ledesma B; Quiros A; Amigo L; Recio I Identification of bioactive peptides after digestion of human milk and infant formula with pepsin and pancreatin. Int. Dairy J 2007, 17, 42–49. [Google Scholar]
- (18).Tsopmo A; Romanowski A; Banda L; Lavoie JC; Jenssen H; Friel JK Novel anti-oxidative peptides from enzymatic digestion of human milk. Food Chem. 2011, 126, 1138–1143. [Google Scholar]
- (19).Dallas DC; Guerrero A; Khaldi N; Borghese R; Bhandari A; Underwood MA; Lebrilla CB; German JB; Barile D A peptidomic analysis of human milk digestion in the infant stomach reveals protein-specific degradation patterns. J. Nutr 2014, 144, 815–820. [DOI] [PMC free article] [PubMed] [Google Scholar]
- (20).Nielsen SD; Beverly RL; Dallas DC Peptides released from foremilk and hindmilk proteins by breast milk proteases are highly similar. Front. Nutr 2017, 4, 54. [DOI] [PMC free article] [PubMed] [Google Scholar]
- (21).Vizcaíno JA; Csordas A; del-Toro N; Dianes JA; Griss J; Lavidas I; Mayer G; Perez-Riverol Y; Reisinger F; Ternent T; Xu Q-W; Wang R; Hermjakob H 2016 update of the PRIDE database and its related tools. Nucleic Acids Res. 2016, 44, D447–D456. [DOI] [PMC free article] [PubMed] [Google Scholar]
- (22).Nielsen SD; Beverly RL; Qu Y; Dallas DC Milk bioactive peptide database: a comprehensive database of milk protein-derived bioactive peptides and novel visualization. Food Chem. 2017, 232, 673–682. [DOI] [PMC free article] [PubMed] [Google Scholar]
- (23).Demers-Mathieu V; Qu Y; Underwood MA; Dallas DC The preterm infant stomach actively degrades milk proteins with increasing breakdown across digestion time. Acta Paediatr. (Oxford, U. K.) 2018, 107, 967–974. [DOI] [PMC free article] [PubMed] [Google Scholar]
- (24).Ewer AK; Durbin GM; Morgan ME; Booth IW Gastric emptying in preterm infants. Arch. Dis. Child Fetal Neonatal Ed 1994, 71, F24–F27. [DOI] [PMC free article] [PubMed] [Google Scholar]
- (25).Bonner JJ; Vajjah P; Abduljalil K; Jamei M; Rostami-Hodjegan A; Tucker GT; Johnson TN Does age affect gastric emptying time? A model-based meta-analysis of data from premature neonates through to adults. Biopharm. Drug Dispos 2015, 36, 245–257. [DOI] [PMC free article] [PubMed] [Google Scholar]
- (26).Ramirez A; Wong WW; Shulman RJ Factors regulating gastric emptying in preterm infants. J. Pediatr 2006, 149, 475–479.e1. [DOI] [PubMed] [Google Scholar]
- (27).Khaldi N; Vijayakumar V; Dallas DC; Guerrero A; Wickramasinghe S; Smilowitz JT; Medrano JF; Lebrilla CB; Shields DC; German JB Predicting the important enzyme players in human breast milk digestion. J. Agric. Food Chem 2014, 62, 7225–7232. [DOI] [PMC free article] [PubMed] [Google Scholar]
- (28).Hylander MA; Strobino DM; Dhanireddy R Human milk feedings and infection among very low birth weight infants. Pediatrics 1998, 102, e38. [DOI] [PubMed] [Google Scholar]
- (29).Meinzen-Derr J; Poindexter B; Wrage L; Morrow AL; Stoll B; Donovan EF; the National Institute of Child, H.; Human Development Neonatal Research, N.. Role of human milk in extremely low birth weight infants’ risk of necrotizing enterocolitis or death. J. Perinatol 2009, 29, 57–62. [DOI] [PMC free article] [PubMed] [Google Scholar]
- (30).Ballard O; Morrow AL Human milk composition. Pediatr. Clin. North Am 2013, 60, 49–74. [DOI] [PMC free article] [PubMed] [Google Scholar]
- (31).Hayes M; Ross RP; Fitzgerald GF; Hill C; Stanton C Casein-derived antimicrobial peptides generated by Lactobacillus acidophilus DPC6026. Appl. Environ. Microbiol 2006, 72, 2260–2264. [DOI] [PMC free article] [PubMed] [Google Scholar]
- (32).Minervini F; Algaron F; Rizzello CG; Fox PF; Monnet V; Gobbetti M Angiotensin I-converting-enzyme-inhibitory and antibacterial peptides from Lactobacillus helveticus PR4 proteinase-hydrolyzed caseins of milk from six species. Appl. Environ. Microbiol 2003, 69, 5297–5305. [DOI] [PMC free article] [PubMed] [Google Scholar]
- (33).Liepke C; Zucht H-D; Forssmann W-G; Ständker L Purification of novel peptide antibiotics from human milk. J. Chromatogr., Biomed. Appl 2001, 752, 369–377. [DOI] [PubMed] [Google Scholar]
- (34).Murphy DB; Sutton JA; Prescott LF; Murphy MB Opioid-induced delay in gastric emptying a peripheral mechanism in humans. Anesthesiology 1997, 87, 765–770. [DOI] [PubMed] [Google Scholar]
- (35).Zoghbi S; Trompette A; Claustre J; El Homsi M; Garzón J; Jourdan G; Scoazec J-Y; Plaisancié P beta-Casomorphin-7́ regulates the secretion and expression of gastrointestinal mucins through a mu-opioid pathway. Am. J. Physiol. Gastrointest. Liver Physiol 2006, 290, G1105–13. [DOI] [PubMed] [Google Scholar]
- (36).Yang I; Nell S; Suerbaum S Survival in hostile territory: the microbiota of the stomach. FEMS Microbiol. Rev 2013, 37, 736–761. [DOI] [PubMed] [Google Scholar]
- (37).Plaisancié P; Claustre J; Estienne M; Henry G; Boutrou R; Paquet A; Léonil J A novel bioactive peptide from yoghurts modulates expression of the gel-forming MUC2 mucin as well as population of goblet cells and Paneth cells along the small intestine. J. Nutr. Biochem 2013, 24, 213–221. [DOI] [PubMed] [Google Scholar]
- (38).Dalziel JE; Spencer NJ; Dunstan KE; Lynch AT; Haggarty NW; Gopal PK; Roy NC An in vitro rat model of colonic motility to determine the effect of beta-casomorphin-5 on propagating contractions. Food Funct. 2014, 5, 2768–2774. [DOI] [PubMed] [Google Scholar]
- (39).Fuglsang A; Nilsson D; Nyborg NCB Characterization of new milk-derived inhibitors of angiotensin converting enzyme in vitro and in vivo. J. Enzyme Inhib. Med. Chem 2003, 18, 407–412. [DOI] [PubMed] [Google Scholar]
- (40).Ahn J; Cao M-J; Yu YQ; Engen JR Accessing the reproducibility and specificity of pepsin and other aspartic proteases. Biochim. Biophys. Acta, Proteins Proteomics 2013, 1834, 1222–1229. [DOI] [PMC free article] [PubMed] [Google Scholar]
- (41).Morgan AA; Rubenstein E Proline: the distribution, frequency, positioning, and common functional roles of proline and polyproline sequences in the human proteome. PLoS One 2013, 8, e53785. [DOI] [PMC free article] [PubMed] [Google Scholar]
- (42).Frenken LGJ; Egmond MR; Batenburg AM; Verrips CT Pseudomonas glumae lipase: increased proteolytic stabifity by protein engineering. Protein Eng., Des. Sel 1993, 6, 637–642. [DOI] [PubMed] [Google Scholar]
- (43).Markert Y; Köditz J; Ulbrich-Hofmann R; Arnold U Proline versus charge concept for protein stabilization against proteolytic attack. Protein Eng., Des. Sel 2003, 16, 1041–1046. [DOI] [PubMed] [Google Scholar]
- (44).Zheng H; Shen M; Cha Y-L; Li W; Wei Y; Blanco MA; Ren G; Zhou T; Storz P; Wang H-Y; Kang Y PKD1 phosphorylation-dependent degradation of SNAIL by SCF-FBXO11 regulates epithelial-mesenchymal transition and metastasis. Cancer Cell 2014, 26, 358–373. [DOI] [PMC free article] [PubMed] [Google Scholar]
- (45).Trentini DB; Suskiewicz MJ; Heuck A; Kurzbauer R; Deszcz L; Mechtler K; Clausen T Arginine phosphorylation marks proteins for degradation by a Clp protease. Nature 2016, 539, 48. [DOI] [PMC free article] [PubMed] [Google Scholar]
- (46).Benore-Parsons M; Seidah NG; Wennogle LP Substrate phosphorylation can inhibit proteolysis by trypsin-like enzymes. Arch. Biochem. Biophys 1989, 272, 274–280. [DOI] [PubMed] [Google Scholar]
- (47).Oss M; Kruve A; Herodes K; Leito I Electrospray ionization efficiency scale of organic compounds. Anal. Chem 2010, 82, 2865–2872. [DOI] [PubMed] [Google Scholar]
- (48).Gao Y; Wang Y A method to determine the ionization efficiency change of peptides caused by phosphorylation. J. Am. Soc. Mass Spectrom 2007, 18, 1973–1976. [DOI] [PMC free article] [PubMed] [Google Scholar]
- (49).Liao Y; Weber D; Xu W; Durbin-Johnson BP; Phinney BS; Lönnerdal B Absolute quantification of human milk caseins and the whey/casein ratio during the first year of lactation. J. Proteome Res 2017, 16, 4113–4121. [DOI] [PubMed] [Google Scholar]
Associated Data
This section collects any data citations, data availability statements, or supplementary materials included in this article.