

Abstract
Reliable single unit neuron recordings from chronically implanted microelectrode arrays (MEAs) are essential tools in the field of neural engineering. However, following implantation, MEAs undergo a foreign body response that functionally isolates them from the brain and reduces the useful longevity of the array. We tested a novel electrodeposited platinum-iridium coating (EPIC) on penetrating recording MEAs to determine if it improved recording performance. We chronically implanted the arrays in rats and used electrophysiological and histological measurements to compare quantitatively the single unit recording performance of coated vs. uncoated electrodes over a 12-week period. The coated electrodes had substantially lower impedance at 1 kHz and reduced noise, increased signal-to-noise ratio, and increased number of discernible units per electrode as compared to uncoated electrodes. Post-mortem immunohistochemistry showed no significant differences in the immune response between coated and uncoated electrodes. Overall, the EPIC arrays provided superior recording performance than uncoated arrays, likely due to lower electrode impedance and reduced noise.
Keywords: Rats, neural recording, neural interface, foreign body response, electrode surface modification, electrodeposited platinum iridium
1. Introduction
Chronically implanted microelectrode arrays (MEAs) to record from multiple single neurons are essential for brain-machine interfaces and electrophysiological research. Devices have a diverse range of recording capabilities, insertion depths, and electrode numbers [1–6] and are used for many applications, including motor control [7,8], visual prostheses [9,10], and analyzing the neural response to deep brain stimulation [11–15]. However, limited functional longevity is a persistent challenge, and electrode failure can occur due to material failure, mechanical issues, or biological failure due to the foreign body response (FBR) to the electrode [16–24]. Recording electrodes should be designed with a low electrochemical impedance per surface area, as a higher impedance increases thermal noise and signal shunting [25,26], and to minimize the FBR, which results in a glial and astrocytic scar that functionally isolates the electrodes from the brain. This isolation leads to decreased electrode unit yield over time and increased electrode impedance [1,18,19,22,27–30]. The optimal recording electrode material thus should have both a low electrochemical impedance and generate a minimal FBR, and both iridium and iridium oxide have been used for implantable microelectrodes because they meet these criteria [31].
Three approaches are used to produce thin film iridium based microelectrode arrays: sputtered iridium oxide films (SIROF), activated iridium oxide films (AIROF), and electrodeposited iridium oxide films (EIROF). SIROF electrodes are produced by magnetron sputtering and typically have some texture which increases with increasing film thickness [32]. AIROF electrodes are produced by taking an iridium or iridium oxide microelectrode and subjecting it to a series of controlled electrochemical biphasic pulses, which reversibly oxidize and reduce the metallic thin film [33]. Like SIROF, the surface morphology/topology of these thin films may have some roughness [34]. Finally, EIROF electrodes are produced by electrochemically depositing thin films of iridium oxide formed by electrochemical reduction of iridium ions in solution into iridium oxide on the microelectrode contact base [35,36]. This technique can result in the highest surface area morphologies of the three approaches [37].
All iridium electrodes benefit from high charge injection capacities per unit of real surface area due to the large reversible capacitances of the multiple valence oxides that iridium can form. However, each of these iridium oxide thin films have distinct disadvantages associated with them. First, iridium is well-known to have low ductility and is subject to brittle fracture when mechanically strained [38]. Iridium cracking in thicker deposits have been reported [39]. Second, SIROF and AIROF both use sputtering, which is a stencil-based, line-of-site deposition process. Thickness uniformity is easily attained on two dimensional surfaces, but deposition is challenging on complex, non-planar surfaces or devices where films must be applied on facets with different orientations. Third, these stencil-based processes apply the noble metal across the entire area of the chamber, and subsequently use lithographic lift-off to leave iridium only on the targeted locations. These approaches are inefficient with noble metal consumption.
In this study we investigated the use of an electrodeposited platinum-iridium coating (EPIC) as an alternative to these conventional iridium-oxide thin film microelectrodes. EPIC contains platinum and iridium in a ratio of approximately 60:40 (Pt:Ir) molar fraction and is intended to leverage advantages of electrochemical processing as well as physical properties of the two component metals to produce an enhanced microelectrode [40,41]. Similar to EIROF, EPIC uses electrodeposition to deposit noble metals onto only the targeted locations, thus minimizing waste. Also like EIROF, the EPIC plating process creates high surface area topologies [37]. The additional surface area helps to increase the overall charge injection capacitance and reduce the impedance of these microelectrodes [42]. Although some of the valence oxide capacitance may be lost by substituting a significant portion of the iridium atoms with platinum atoms, the increased surface area is intended to compensate for this tradeoff. While the platinum in EPIC may reduce the iridium oxide capacitance contribution to charge transfer, the lower elastic modulus and more ductile characteristics of platinum increase the mechanical strength of EPIC compared to EIROF and allow it to be grown thicker than EIROF without cracking [39]. Ductility and hardness studies of EPIC thin films suggested that EPIC is more resistant to fracture than iridium and iridium oxide. Finally, platinum-iridium composite microelectrodes have been used extensively in both in vivo and clinical devices, therefore establishing a good foundation of biocompatibility.
We evaluated the in vivo performance of EPIC by chronically implanting 16 channel Pt-Ir microwire arrays, with approximately half of the electrodes randomly chosen to be coated with EPIC and the other half left uncoated. The arrays were implanted in the basal ganglia in the unilateral 6-hydroxydopamine (6-OHDA) lesioned rat model of Parkinson’s disease, which is an established model of chronic single-unit neural recording for studying the effects and mechanisms of deep brain stimulation [12–15]. We compared quantitatively the performance of coated and uncoated electrodes and found that the EPIC electrodes exhibited improved single unit recording capabilities.
2. Materials and Methods
Female Sprague Dawley rats (n = 8, 250–300 g) were implanted unilaterally with recording microelectrodes in the substantia nigra pars reticulata (SNr). At regular intervals following implantation we measured the electrode impedance at 1 kHz and recorded single units to quantify unit yield, unit amplitude, noise, and signal-to-noise ratio (SNR). The rats were rendered hemiparkinsonian via unilateral infusion of 6-OHDA into the medial forebrain bundle (MFB). Post-mortem immunohistochemistry was used to quantify the tissue response to the implanted electrodes.
2.1. Electrode Arrays
Commercially available, 16-electrode microwire arrays (Microprobes for Life Science, Gaithersburg MD; platinum-iridium, 13 mm length, 75 μm diameter, 0.25 mm interelectrode spacing, ~500 kΩ impedance) were used for this study (Figure 1a). These were selected because of the team’s experience with these devices and the known reliability/robustness of their construction. Many other studies have shown their structural longevity [43] including one performed by the FDA [44]. Each device constituted a 4×4 arrangement of Pt-Ir microwires that were insulated with a layer of chemical vapor deposition Parylene-C over each microwire’s entire surface, followed by an overlayer of polyimide tubing around the base of the wires to provide additional insulation and protection. At the base, the microwires were mated to a printed circuit board which split the leads out to an 18-channel interconnect header (Omnetics). Once assembled, each electrode tip was exposed by electropolishing away the Parylene-C insulation to a predetermined impedance. For this study, the electropolishing was performed to produce electrode tips approximately 10 μm in length. These fabricated devices were then finished by electrochemical deposition of EPIC (Platinum Group Coatings, Pasadena CA) on selected microwires to create a checkboard-like pattern of coated and uncoated electrodes on each array (Figure 1b,c). This was accomplished by making a custom busbar to connect to approximately half of the electrodes during electrodeposition. The other half of microelectrodes were left as open circuits and therefore not coated with EPIC. The coating pattern was randomized between electrodes and the investigators conducting the impedance measurements, neural recordings, and histological data collection were blinded to the electrode coating key. We previously reported on EPIC on a variety of different microelectrode constructs [41,45–47] which demonstrated our ability to apply the coating uniformly across many different platforms. Prior to implantation, each array underwent electrochemical characterization in vitro, including electrochemical impedance spectroscopy (±10 mV vs Ag|AgCl) and cyclic voltammetry (CV) (0.8 V to - 0.6 V vs Ag|AgCl) in room temperature phosphate buffered saline (PBS). The cathodic charge storage capacity (CSCc) was also quantified by taking the time interval of the cathodic current during the anodic to cathodic sweep of the CV [48]. Arrays were also imaged with a scanning electron microscope (SEM) prior to implantation (Figure 1). Each microelectrode array was mounted onto an aluminum SEM stub and plasma coated with Au (Cressington 108 Sputter Coater). Imaging was performed using a field emissions SEM (Joel JSM-7001) at 15kV.
Figure 1.
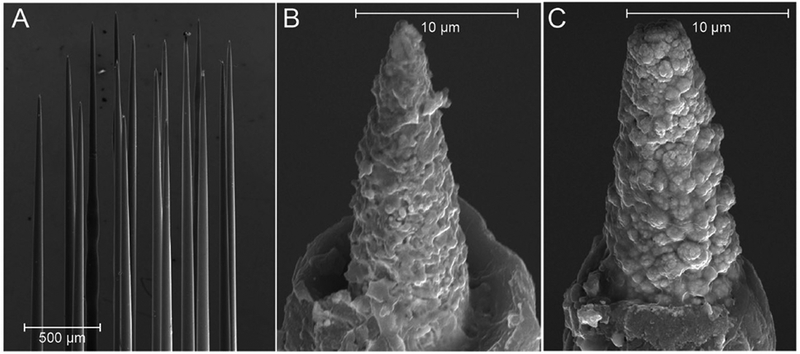
Scanning electron micrographs of an example Pt-Ir microelectrode array prior to implantation. a) Each MEA had 16 recording electrodes and an additional 17th reference electrode. Each array had a checkerboard-like pattern of coated and uncoated electrodes. b) Example uncoated Pt-Ir electrode. c) Example EPIC coated electrode. Note the rougher surface than the uncoated electrode in b.
2.2. Electrode Implantation and 6-OHDA Lesioning
All animal care and experimental procedures were approved by the Duke University Institutional Animal Care and Use Committee (IACUC). We conducted stereotactic surgery under 3.0 – 3.5% sevoflurane anesthesia using aseptic technique and coordinates obtained from a rat brain atlas [49]. The cannula and electrodes were implanted unilaterally and ipsilateral to each other, with the hemisphere randomized between the rats. Implantations were performed using a stereotaxic electrode manipulator (Stoelting 51600) and inserted manually at a rate of approximately 100 μm/sec. One 4×4 recording MEA (see Section 2.1) was implanted in the SNr [5.8 mm posterior (P), 2.3 mm mediolateral (ML) from bregma; 7.2 mm dorsoventral (DV) from surface of brain]. The target depth was determined by performing simultaneous intraoperative recordings to find the location within the SNr with the greatest number of discernible single units. The ground wire of the MEA was attached to two stainless steel bone screws inserted in the skull above the cerebellum. A cannula was placed in the MFB [2.0 mm P, 2.0 mm ML from bregma; 8.5 mm from surface of skull]. In addition, one 2×2 stimulating MEA (Microprobes, Gaithersburg, MD; platinum-iridium, 13 mm length, 75 μm diameter, 0.3 mm interelectrode spacing, 10 kΩ impedance) was implanted in the subthalamic nucleus (STN) [3.6 mm P, 2.6 mm ML from bregma; 6.6 – 6.9 mm DV from surface of brain]. This array was not used in the current evaluation, but rather was used as part of another parallel study. The implanted arrays and cannula were secured using dental acrylic attached to stainless steel bone screws anchored to the skull.
At five weeks post-implantation (p.i.), rats were lesioned under 3.0 – 3.5% sevoflurane anesthesia to cause unilateral degeneration of dopaminergic neurons in the substantia nigra pars compacta (SNc). Thirty minutes before lesioning, the rats were pretreated with 50 mg/kg pargyline and 5 mg/kg desipramine injected intraperitoneally (IP). The 6-OHDA (Sigma-Aldrich; 5 mg 6-OHDA / 2 mL 0.9% NaCl) solution was prepared immediately before use, and 10 μL was infused through the cannula at a rate of 2 μL/min. Rats were left to recover at least one week before any additional measurements.
2.3. Recording MEA Measurements and Neural Recordings
Weekly measurements were conducted during the first two weeks after implantation and then repeated every two weeks until week twelve. The impedance at 1 kHz was measured for each recording electrode between the electrode and the ground wire (BAK Electronics, Germantown, MD). Single-unit neural activity was recorded using a multichannel acquisition processor system (Plexon). The data were sampled at 40 kHz. Spikes were detected by applying a band-pass filter (150 Hz – 9 kHz) to raw traces and a threshold of −4*standard deviation. Waveforms of 800 μs were extracted. Spikes were further sorted using Offline Sorter (Plexon) and single-unit activity was isolated on the basis of principal component analysis. Only single-unit activity with a clear separation from noise was used for the analysis.
All 16 channels were recorded simultaneously while the rats were awake and resting inside a Faraday cage. Recording sessions were five minutes long. In each recording session, we quantified the discernible units per electrode (unit yield), as well as per-unit amplitude, noise, and SNR. The amplitude was calculated as the root mean square (r.m.s.) of the peak-to-peak amplitudes of each spike, the noise was calculated as the r.m.s. of the first 50 μs of each waveform recording, and the SNR was the ratio of these two.
2.4. Electrode Rejuvenation
Applying a dc voltage to implanted electrodes, termed rejuvenation, can reduce electrode impedance and increase SNR [50–52]. In select animals, at various points past the week 12 time point, we conducted electrode rejuvenation experiments, with at least 2 weeks between each rejuvenation procedure. In three rats (N coated = 21, N uncoated = 20) we applied a stepped rejuvenation signal on select electrodes of equivalent starting impedance, constituting a stepped series of 4 s long dc voltage pulses from 0.25 to 2.0 V, with steps of 0.25 V and ~10 minutes between steps, recording the impedance after each 10 minute mark. In two rats (N coated = 13, N uncoated = 17) we also performed a standard rejuvenation [1.5 V, 4 seconds] as well as a ramped rejuvenation procedure [−0.8 – 0.6 V, 500 mV/sec, 20 cycles]. We measured both electrode impedance and single unit characteristics before and after rejuvenation. However, one of the rats had no discernible units and the other only had seven units (N coated = 4, N uncoated = 3), so there was little statistical power for the single unit responses. Electrodes with 1 kHz impedances greater than 4 MΩ were excluded due to likely electrode damage.
2.5. Histology
After the completion of experiments, rats were deeply anesthetized with urethane (1.8 g/kg, i.p.) and perfused transcardially with 0.1 M PBS followed by 4% paraformaldehyde in 0.1 M PBS. The brain was post-fixed overnight in 4% paraformaldehyde and then transferred to 30% sucrose. The brains were cut into 50 μm sections in either the coronal (N brains = 2) or horizontal (N brains = 6) planes using a cryostat (CM3050S, Leica Microsystems) and processed for three sets of staining. Tyrosine hydroxylase (TH) immunohistochemistry was used to verify the extent of degeneration of dopaminergic neurons in the SNc [53–55]. Briefly, after three rinses in PBS, brain sections were first incubated for 10 min in 3% hydrogen peroxide. The sections were rinsed and blocked for 1 h at room temperature in blocking solution containing 10% goat serum. The sections were then incubated in anti-tyrosine hydroxylase antibody (AB152; 1:1000, Vector Laboratories) overnight at 4°C in PBS with 10% goat serum and 0.25% Trion X-100. After three rinses in PBS, the sections were incubated with biotinylated goat anti-rabbit secondary antibody (BA-1000, 1:250, Vector Laboratories) with 10% goat serum and 0.25% Trion X-100 in PBS for 1 h at room temperature. After rinsing, the sections were incubated in a VECTASTAIN Elite ABC kit (Vector Laboratories) solution for 1 h and then visualized using DAB solution. Cresyl violet counter staining was used to verify electrode locations.
To examine brain tissue immunoreaction to the electrodes, adjacent brain sections were immunostained for GFAP and ED1 to visualize reactive astrocytes and activated microglia/macrophages, respectively [24]. In brief, the sections were blocked for 1 h at room temperature in blocking solution containing 8% normal goat serum with 0.1% Triton-X. The sections were then rinsed and incubated in primary antibodies (ED1, MCA341GA; 1:1000, Bio-Rad; GFAP, Z0334; 1:2000, Dako) overnight at 4°C in solution with blocking solution. After three washes in PBS, the sections were incubated in secondary antibodies including goat anti-rabbit IgG Alexa 488 (1:500, Life Technologies) and goat anti-mouse IgG1 Alexa 594 (1:500, Life Technologies) for 1 h at room temperature. After rinsing, all sections were mounted with DAPI-FluoroMount-G (SouthernBiotech). Imaging was conducted and captured at 10 × with a Nikon Eclipse TE2000-U and at 1.25 × with a Zeiss AxioPlan 2 Microscope.
2.6. Quantitative Analysis of Immunohistochemistry
We conducted image quantification for the section nearest each electrode tip. For each electrode within the array we quantified the deepest section that had a visible “hole,” indicative of the electrode track (Figure 2a,b). These sections were not the same for every electrode in a given array, as the horizontal sectioning may not be perpendicular to the electrode array (Figure 2c). In addition, electrodes with tips residing in a ventricle were excluded from analysis. Electrode track fluorescence intensity was then quantified using a method similar to that in Winslow and Tresco [56]. The outline of each electrode “hole” was traced in MATLAB (r2018a, The Mathworks Inc.) to represent the electrode-tissue interface. The fluorescence intensity was measured along line profiles every 10°, extending from the interface outwards to a radius of 110 μm. The intensity profile was then averaged across the lines and binned into five annuli of 22 μm widths for comparison (changing the number of radial bins to 3, 10, or 20 had no effect on the reported results). To normalize the profiles, we selected two additional regions per section: an area adjacent to the electrodes to obtain the background fluorescence, and an area encompassing all of the electrodes to obtain the maximum fluorescence. Each profile was then normalized by subtracting the median fluorescence intensity of the background region and then normalizing to the 99th percentile of the intensity in the region containing the electrodes.
Figure 2.
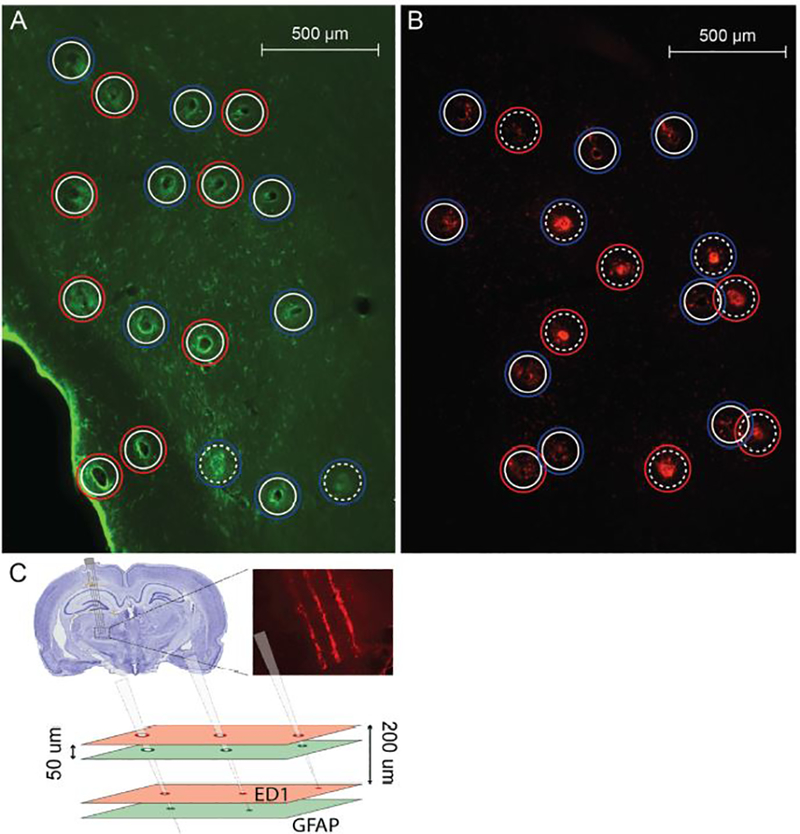
Immunohistochemistry example. a) Sample GFAP section near electrode tip for animal A4. b) Sample ED1 section near electrode tip for animal A7. a,b) Solid white inner circles represent electrode “holes” while dotted white inner circles represent “filled” electrodes, which are likely below the electrode tip. Blue outer circles are coated arrays while red outer circles are uncoated. c) Visualization of the method of post-mortem histology sectioning along the tips of the electrode arrays illustrating how a given section may have both “holes” and “filled” profiles. Tissue was sliced every 50 μm, but GFAP and ED1 were only stained for at every fourth slice, resulting in a distance of 200 μm between slices.
2.7. Animal Summary
The in vivo work, including number of animals, implant duration, challenges encountered, etc. is summarized in Table 1. Two (2/8) rats were excluded from all recording array analysis, one due to its recording electrodes being exposed to a large dc bias and the second due to a broken ground wire that prevented impedance measurements and unit recordings. The remaining 6/8 rats were used for impedance measurements, although one rat missed its measurements between weeks 0–4, and a second rat was euthanized after week 6 to prevent imminent failure of the acrylic headcap. Overall, 4/8 rats had complete impedance measurements (N coated = 31, N uncoated = 33), while 2/8 had partial measurements (N coated = 17, N uncoated = 15).
Table 1.
Animal experiment summary
| Animal | Coated | Uncoated | Impedance Measurements | Neural Recordings | Measurement Notes | Quantitative IHC Performed | Histology Notes | Sacrifice Week |
|---|---|---|---|---|---|---|---|
| A1 | 10 | 6 | - | - | Electrodes exposed to large dc bias | No | Coronally sliced | Week 17 |
| A2 | 7 | 9 | Weeks 6 – 12 | Weeks 1 – 12 | Missed early impedance measurements | No | Coronally sliced | Week 16 |
| A3 | 9 | 7 | Weeks 0 – 12 | Weeks 1 – 12 | - | Yes | - | Week 28 |
| A4 | 8 | 8 | Weeks 0 – 12 | Weeks 1 – 12 | - | Yes | - | Week 27 |
| A5 | 7 | 9 | Weeks 0 – 12 | - | Electrode imp lantation misplaced | No | Merged electrode tracks | Week 28 |
| A6 | 12 | 4 | - | - | Broken ground wire | No | Headcap failure led to merged electrode tracks | Week 11 |
| A7 | 10 | 6 | Weeks 0 – 6 | Weeks 1 – 4 | Early euthenasia to p revent headcap failure | Yes | - | Week 8 |
| A8 | 7 | 9 | Weeks 0 – 12 | Weeks 1 – 12 | - | Yes | - | Week 31 |
For neural recordings, one rat’s array was at an improper depth and missed the SNr, and it was excluded, leaving 5/8 rats. Of those, the rat that was euthanized early only had recordings through week 4. Overall, 4/8 rats had the complete 12 weeks of neural recordings (N coated = 31, N uncoated = 33), and 1/8 had partial recordings (N coated = 10, N uncoated = 6).
For histology, two rats were sliced coronally, and as such could not have the quantitative track analysis performed. In addition, one rat had the electrode tracks merge following electrode explantation and sectioning, while another had early headcap failure that excluded it from analysis. Overall, 4/8 rats underwent quantitative tissue analysis.
Following the 12 week experiment, most rats were used for subsequent experiments with the implanted stimulating electrodes in the STN. These experiments should have no impact on the recording electrode performance metrics reported here, but they did postpone sacrificing the animals and performing the subsequent histology. In addition, electrodes that underwent a rejuvenation experiment within two weeks of perfusion (N = 6) were excluded from the quantitative tissue analysis.
2.8. Statistical Analysis
Statistical significance between conditions was determined using a two or three-way repeated measures analysis of covariance (RM-ANCOVA) for multiple comparisons. Normality was tested by performing the Shapiro-Wilk Test on the residuals of each model and was found to be significant for all tests reported. When a significant factor was found, we performed a post hoc one-way RM-ANCOVA or ANOVA. All ANCOVA or ANOVA tests incorporated the electrode contact nested within the animal number as a random effect. For single comparisons between groups an F-test was first used to test equivalency in variance, and two sample Student’s t-tests were used for groups with equal variances while Welch’s unequal variances t-tests were used for groups with unequal variances. One sample Student’s t-tests were used for determining the difference with a hypothesized mean. Pearson’s product-moment correlation (PPMC) was used for tests of correlation. All statistical tests were performed in JMP (SAS Institute Inc.). All results are presented as mean ± standard error (SE) and were considered significant at p < 0.05. The data necessary to reproduce these results can be found at [57].
3. Results
3.1. In Vitro Electrochemical Characterization
Prior to implantation, each electrode underwent in vitro electrochemical characterization. The impedance spectrograms (Figure 3a) show a substantially reduced impedance for coated electrodes across all frequencies. The impedance at 1 kHz (Figure 3b) was significantly lower for coated electrodes (80 ± 18 kΩ) than uncoated electrodes (534 ± 57 kΩ; Welch’s t-test, p < 0.001). Representative CVs are shown in Figures 3c (coated, N=6) and 3d (uncoated, N=8). Due to the lower impedance of the coated electrodes, the CV drew a higher current for the coated electrodes than the uncoated electrodes during the voltage sweep. The coated electrodes (1091 ± 100 nC) had a significantly higher CSCc (Figure 3e) than the uncoated electrodes (49 ± 17 nC; Welch’s t-test, p < 0.001).
Figure 3.
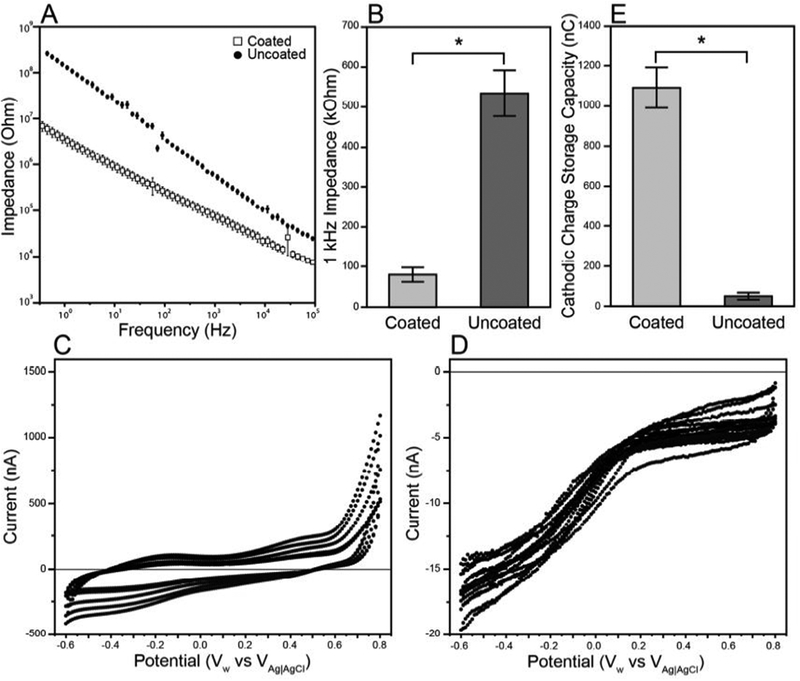
In vitro electrochemical characterization of electrodes prior to implantation. a) Mean values of full spectrum impedance ± standard error of coated electrodes (squares) compared to uncoated electrodes (circles). The coated electrodes show a substantially reduced impedance across all frequencies. b) The impedance at 1 kHz for coated and uncoated electrodes. Coated electrodes have a significantly lower impedance than the uncoated electrodes (Welch’s t-test, p < 0.0001). c,d) Representative cyclic voltammograms from animal A5 for the coated (c) and uncoated (d) electrodes. The coated electrodes drew a significantly higher current than the uncoated electrodes (note the difference in axes), likely due to the lower impedance of the coated electrodes. e) The cathodic charge storage capacity of the coated and uncoated electrodes calculated from the anodic to cathodic sweep of the cyclic voltammetry. The coated electrodes have a significantly higher CSCc than the uncoated electrodes (Welch’s t-test, p < 0.0001).
3.2. Effect of Coating on Electrode Recording Performance
Single units were isolated and recorded at each time point (Figure 4), and the number of discernible units per electrode was quantified for each electrode in each array. To determine if there was an effect of electrode location within the array, we first examined the average unit yield for each electrode position in the array, normalized by the hemisphere in which the array was implanted (Figure 5a). This revealed a trend of decreasing unit yield on the lateral, posterior edge of the array, which anatomically likely corresponds to those electrodes being outside of the SNr and instead lying within the cerebral peduncle or the fissure between the cerebral peduncle and the dentate gyrus [49]. To quantify the effect of electrode location, we created an independent location variable, defined as the mean of the medial-lateral location and the anterior-posterior location, each with a value from 1 – 4 with 1 being most lateral/posterior and 4 being most medial/anterior (Figure 5b). We then performed a three-way RM-ANCOVA to determine the contributions to unit yield of three independent variables: coating, location, and week number (Figure 5c,d). There was a significant effect of coating (p < 0.0291), with coated electrodes exhibiting a higher unit yield, and of location (p < 0.0020), with electrodes with larger location values (i.e., more medial/anterior) having higher unit yields. However, there was no significant interaction between location and coating or week, indicating that the effect of coating was independent of the location. Finally, there was a significant interaction between week and coating (p < 0.0071), prompting subsequent subdivision by coating. The unit yield for coated electrodes increased over time (one-way RM-ANCOVA, slope = +0.029 units/week, p < 0.0122) while there was no detectable change in unit yield over time on uncoated electrodes (slope = −0.017 units/week, p < 0.1596).
Figure 4.
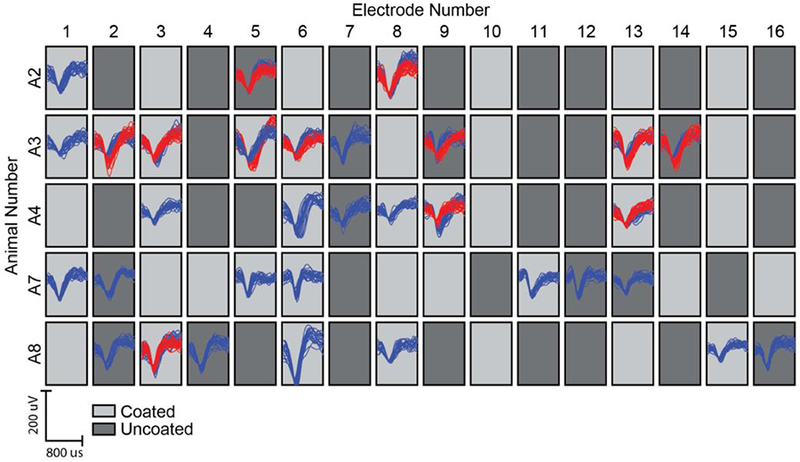
Example of single unit recordings at week 4 for each animal (row) and each electrode (column). Red and blue traces represent different single units recorded at a single electrode. Dark grey and light grey tiles indicate uncoated vs coated electrodes, respectively.
Figure 5.
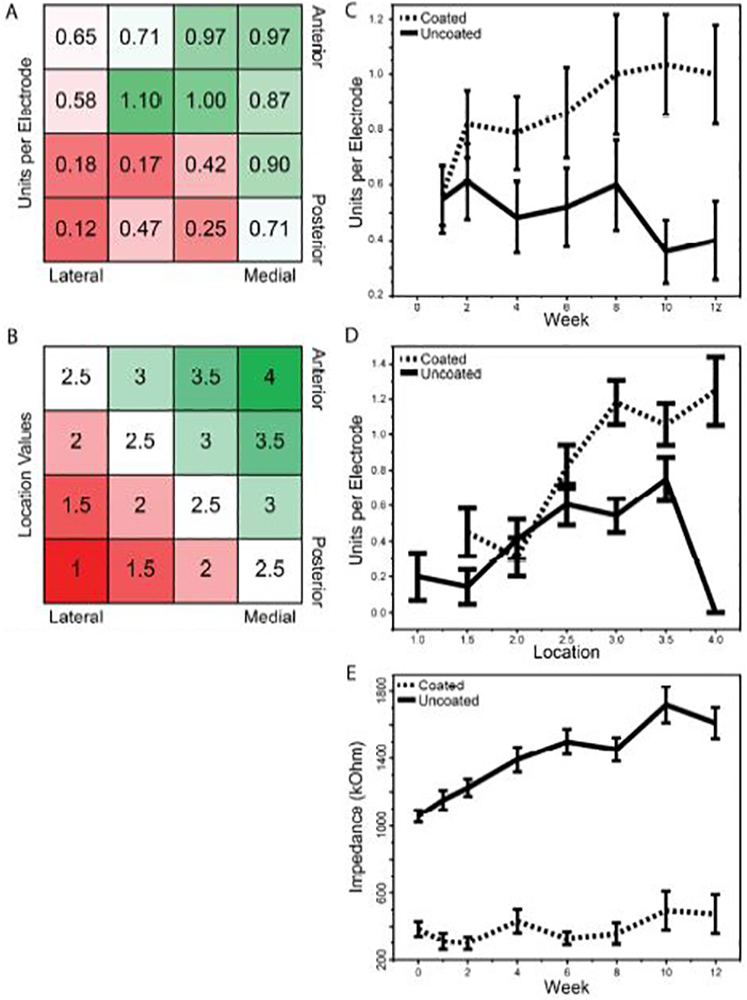
Electrode recording performance across time post-implantation and location. a) Average number of discernible units per electrode across electrode locations within the array. Unit yield was higher for electrodes located more medial and anterior. b) Definition of a location metric based upon the trend observed in a. c,d) Discernible units per electrode across time (c) and location (d) for coated vs. uncoated electrodes. The three-way RM-ANCOVA revealed significant effects of coating (p<0.0291), location (p<0.0020), and coating*week (p<0.0071). Subdividing by coating, one-way RM-ANCOVA for coated electrodes had a slope of 0.029 units/week (p<0.0122) while there was no significant slope for the uncoated electrodes (p<0.1596). e) The impedance at 1 kHz of each electrode across time post-implantation. The three-way RM-ANCOVA revealed significant effects of week (p<0.0001), coating (p<0.0001), and coating*week (p<0.0255). Subdividing by coating, one-way RM-ANCOVA for coated electrodes had a slope of 14.7 kΩ/week (p<0.0039) and for uncoated electrodes had a slope of 31.1 kΩ/week (p<0.0001).
The impedance at 1 kHz for each electrode was also tracked over time (Figure 5e). The three-way RM-ANCOVA test revealed no detectable interaction between location and week or coating. There were strong main effects of week (p < 0.0001) and coating (p < 0.0001) on the impedance, with the coated electrodes having lower impedance at 1 kHz than the uncoated electrodes. In addition, there was a significant interaction between coating and week (p < 0.0255), prompting subdivision by coating. Across weeks, both the coated and uncoated electrode impedances increased over time (one-way RM-ANCOVA, coated slope = +14.7 kΩ/week, p < 0.0039; uncoated slope = +31.1 kΩ/week, p < 0.0001), with the significant interaction term indicating that the slope for the uncoated electrodes was significantly greater than the slope for the coated electrodes.
3.3. Effect of Coating on Single Unit Characteristics
The unit SNR, unit amplitude, and noise of each discernible single unit were tracked over time for each electrode (Figure 6). For each metric we performed a three-way RM-ANCOVA, testing the effect of coating, week, and electrode location. For SNR (Figure 6a), there was a significant main effect of location (p < 0.0001), with greater locations having higher SNR. However, there were no detectable interactions between location and any other variable. There was a significant interaction between week and coating (p < 0.0197), prompting subdivision by coating. The SNR for coated electrodes began lower than that of the uncoated electrodes but increased over time (one-way RM-ANCOVA, slope = +0.11 per week, p < 0.0018), while the SNR of the uncoated electrodes began higher but decreased over time (slope = −0.15 per week, p < 0.0056).
Figure 6.

Single-unit recording performance across time for the coated and uncoated electrodes. a) Signal to noise ratio of coated and uncoated electrodes. The three-way RM-ANCOVA revealed significant effects of location (p<0.0001) and coating*week (p<0.0197). Subdividing by coating, one-way RM-ANCOVA gave slopes of 0.11 (p<0.0018) and −0.15 (p<0.0056) per week for coated and uncoated electrodes, respectively. b) Unit amplitude calculated as the r.m.s. of the peak-to-peak amplitude of single units. The three-way RM-ANCOVA had no significant effects or interactions. c) Average noise calculated as the r.m.s. voltage of the first 50 μs of each waveform. The three-way RM-ANCOVA revealed a significant effect of coating (p<0.0009) and coating*week (p<0.0271). Subdividing by coating, oneway RM-ANCOVA gave slopes of −0.03 μA/week (p<0.7561) and 0.40 μA/week (p<0.0022) for coated and uncoated electrodes, respectively.
For unit amplitude (Figure 6b), there were no detectable main effects or interactions in the three-way RM-ANCOVA. From visual observation of the data, the unit amplitude for the coated electrodes appeared to increase over the first six weeks, after which it decreased slightly until week 12. The unit amplitude for the uncoated electrodes had a nearly opposite trend, with a decreasing amplitude over the first four weeks followed by a steady increase over the remaining eight. Overall, the coating did not result in a conclusive change in unit amplitude.
Finally, for electrode noise (Figure 6c) there was a significant main effect of coating (three-way RMANCOVA, p < 0.0009), with coated electrodes having less noise than uncoated electrodes. In addition, there was a significant interaction between week and coating (p < 0.0271). Subsequent division by coating revealed that the noise for the coated electrodes showed no detectable change over time (one-way RM-ANCOVA, slope = −0.03 μA/week, p < 0.7561) while the noise for the uncoated electrodes increased over time (slope = +0.40 μA/week, p < 0.0022).
3.4. Effects of Rejuvenation on Electrode Performance
The pre-rejuvenation impedance at 1 kHz varied dramatically between the coated (514 ± 116 kΩ) and uncoated electrodes (1493 ± 102 kΩ). As such, all reported changes in impedance due to rejuvenation were represented as the impedance normalized to its pre-rejuvenation value. For stepped rejuvenation there was a significant effect of both coating (two-way RM-ANCOVA, p < 0.0001) and applied voltage (p < 0.0001) (Figure 7a). Coated electrodes exhibited a greater reduction in impedance than uncoated electrodes, and higher applied voltages produced larger reductions in impedance. The interaction between coating and applied voltage was not significant (p < 0.3720), indicating that the effect of coating did not change across the range of applied voltages.
Figure 7.
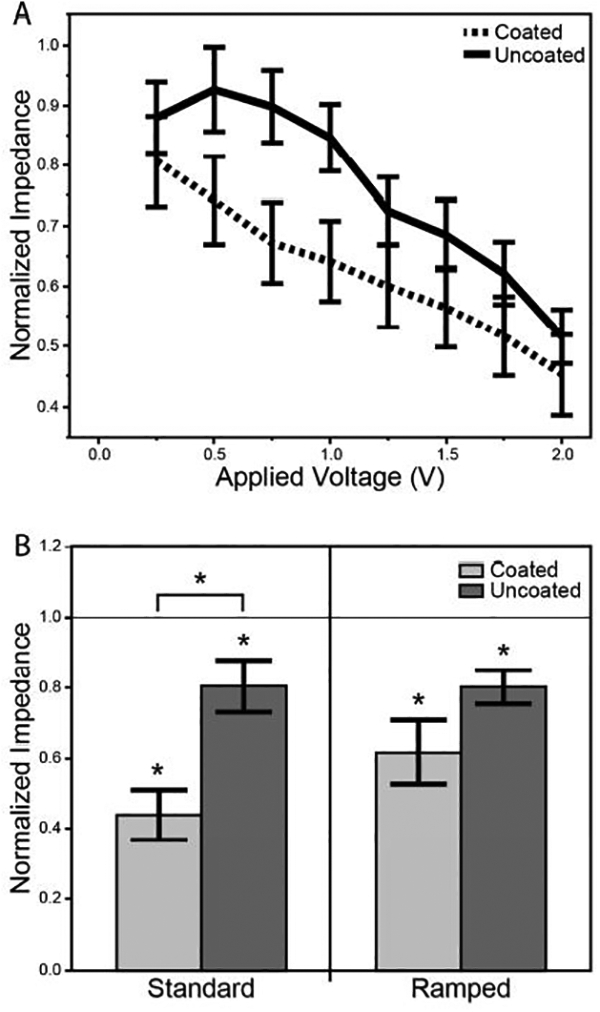
Changes in electrode impedance as a result of rejuvenation with applied voltages. a) Stepped rejuvenation experiment, which applied a stepped series of 4 second dc voltage pulses from 0.25 to 2.0V, with steps of 0.25V. Electrode impedance was normalized to its starting value. The two-way RM-ANCOVA revealed significant effects of coating (p<0.0001) and applied voltage (p<0.0001). b) Standard rejuvenation experiments. On the left a 1.5V dc pulse was applied for four seconds. On the right a ramped procedure was applied [−0.8 – 0.6 V, 500 mV/sec, 20 cycles]. The resulting impedance, normalized to its starting value, is displayed for each method. A single * above a bar represents a significant difference from baseline (one sample t-test), while a bracket with an * represents a significant difference between the two distributions (two sample t-test).
Following standard rejuvenation, both the coated (one sample t-test, p < 0.0001) and uncoated (p < 0.0198) electrode impedances decreased from baseline (Figure 7b), and the coated electrode impedance was lower than the uncoated electrode impedance (two sample t-test, p < 0.0016). Ramped rejuvenation reduced the impedance of both the coated (one sample t-test, p < 0.0010) and uncoated (p < 0.0010) electrodes from baseline. However, there was no detectable difference in reduction between the coated and uncoated electrodes (two sample t-test, p < 0.0858). Neither dc rejuvenation nor ramped rejuvenation had any detectable effects on unit yield, SNR, unit amplitude, or noise (data not shown), when comparing recording epochs conducted immediately before and after rejuvenation.
3.5. Comparison of the Tissue Response Around Coated and Uncoated Microelectrodes
The average normalized fluorescence intensity was quantified for five binned annuli out from the electrode-tissue interface (Figure 8a,b), excluding those electrodes that underwent rejuvenation within two weeks of perfusion. For both ED1 and GFAP immunoreactivity, the coated electrodes appeared on average to have a higher fluorescent intensity than the uncoated electrodes. However, there were no regions with a statistically significant difference in fluorescence between coated and uncoated electrodes for either stain (two sample t-test). This analysis was repeated after changing the number of radial bins to 3, 10, and 20, yet there remained no detectable differences in fluorescence. The analysis was also repeated by excluding the electrodes that underwent rejuvenation at any time point (as opposed to just within two weeks of sacrifice), and once again there were no significant differences in fluorescence.
Figure 8.
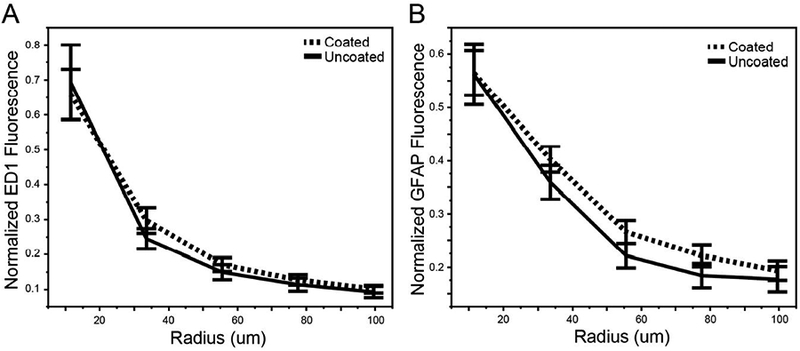
Quantification of immunofluorescence intensity around coated and uncoated electrodes. a) Average ED1 and b) GFAP immunofluorescence intensity around the electrode-tissue interface, binned into five 22 μm regions. No radial bins for either stain had a significant difference between the coated and uncoated electrodes (two sample t-tests).
We also performed a Pearson’s product-moment correlation analysis between the immunofluorescence intensity and the recording performance metrics for each electrode at the first, second, and last week of recording (Figure S1), similar to the analysis conducted by McCreery et al. [58], and these results are provided in the supplementary material.
4. Discussion
We quantified the recording performance of 16-channel Pt-Ir microwire arrays coated with electrodeposited platinum-iridium and compared them to uncoated electrodes on the same array. The innovative checkboard arrays, interspersing coated and uncoated electrodes, allowed us to compare recoding performance within animal and thereby reduce one source of variance. The coated electrodes exhibited superior recording performance to the uncoated electrodes over the 12 week observation period, including measures of unit yield, SNR, noise, and electrode impedance. Quantitative immunohistochemical analysis of the tissue response to the electrodes did not show any substantial difference in ED1 or GFAP immunofluorescence intensity between the coated and uncoated electrodes, suggesting that the improved performance was likely not due to a reduced foreign body response. Rather, the increase in performance is likely due to the reduced impedance of the coated electrodes, which exhibited reduced noise and increased SNR, making it easier to discern single units.
4.1. EPIC improved single unit recording performance
The recording performance of the coated electrodes was superior to that of the uncoated electrodes for the three primary metrics of recording quality: unit yield, SNR, and impedance at 1 kHz. The reduced impedance is not surprising, as the coating increased the electrode surface area [40] which directly reduces the impedance. However, it is noteworthy that the increase in impedance typically observed p.i. [22,29,30,59,60] was significantly reduced with the coating. Electrode modeling and in vitro measurements suggest that the increased electrode impedance at 1 kHz is likely due to protein adsorption, or biofouling, on the electrode tip [59,61], and the coating may reduce such biofouling.
A lower impedance is thought to improve recording performance by reducing thermal noise and signal shunting [25,26], and the stable, low impedance of the coated electrodes resulted in both reduced noise and an increased SNR. The noise of both the coated and uncoated electrodes began at similar levels, but significantly increased over time for the uncoated electrodes while remaining stable for the coated electrodes. The increased SNR for coated electrodes in later weeks apparently stemmed from this reduction in noise. Alternatively, the reduced SNR of coated electrodes in the early weeks appeared to be due to smaller unit amplitudes than those of the uncoated electrodes. However, modeling work predicts that the impedance at 1 kHz has a relatively weak effect on unit amplitude [59], so these amplitude differences between the coated and uncoated electrodes are likely unrelated to the impedance reduction from the coating.
The third, and arguably most important, metric of recording performance is the number of discernible units per electrode, or unit yield. Typically, unit yield either decreases or remains constant following implantation [1,19,22,30,60]. While the unit yield of the coated and uncoated electrodes began at approximately the same level, yield substantially increased over time for the coated electrodes while slightly decreasing for the uncoated electrodes. This trend may be at least partially explained by the noise data. As the noise increases, a higher unit amplitude is necessary to discern a unit, or, in other words, the amplitude threshold increases. Because the noise for the uncoated electrodes increased over time relative to the coated electrodes, the difference in amplitude thresholds should result in fewer discernible units for the uncoated than the coated electrodes. This may explain why the unit amplitude appears to increase for the uncoated electrodes from weeks 4–12; the lower amplitude units can no longer be discriminated. Although this likely explains the widening difference in unit yield over time between the coated and uncoated electrodes, it does not account for the observed increase in unit yield for the coated electrodes over time. This may be due to the observed increase in SNR over time for the coated electrodes, but the large SNR for the uncoated electrodes in the early weeks did not similarly correspond to a higher unit yield. With these disparities, we may not be able to account entirely for the increase in unit yield with solely electrophysiological measurements.
4.2. Immunohistochemistry exhibited little relationship with recording performance
Given that the improvement in unit yield could not be fully explained with the unit noise, unit amplitude, or SNR measurements, a plausible explanation could be a reduced FBR that led to reduced neural death surrounding the electrode tip. However, immunohistochemical staining of ED1 and GFAP did not support this theory, and we observed no significant differences in fluorescence between coated and uncoated electrodes. This remained true regardless of the bin size used or whether rejuvenated electrodes were included in the analysis. Because the majority of the animals used in the histology study were sacrificed more than 25 weeks after implantation, the final measurements may be less sensitive to differences in the time course of the FBR for coated and uncoated electrodes. However, one of the four animals was sacrificed at eight weeks p.i. and it did not show any difference in FBR between coated and uncoated electrodes. Thus, these data suggest that the coating did not reduce the long-term foreign body response to the electrodes.
Despite a lack of difference between coated and uncoated electrodes, a correlation analysis could provide potential insight into the contribution of the FBR to the electrode performance metrics. Previous studies showed a positive correlation between GFAP density and 1 kHz impedance [24], and between GFAP and NeuN density and unit amplitude and SNR measurements [58]. However, the large time difference between animal sacrifice and the conclusion of our 12 week study introduced uncertainty to whether a correlation study would be informative. The previously reported time course of tissue encapsulation shows a sustained response that develops over at least the first 12 weeks p.i., with continuous changes occurring throughout [16,17]. Although our correlation results did show positive correlations between ED1 fluorescence and SNR, unit amplitude, noise, and 1 kHz impedance (Figure S1), it is unclear that the immunofluorescence at > 25 weeks p.i. is representative of the conditions during unit recordings. Regardless, we did not observe any stark differences between correlations with the coated and uncoated electrodes, further indicating that it is unlikely that differences in the FBR contributed to the observed improvements in electrode performance with the EPIC coating.
It is not entirely surprising that the immunohistochemical metrics failed to provide substantial insight into the mechanisms by which the electrode coating affected unit yield, unit amplitude, noise, and SNR. A recent study by Michelson et al. [21] performed a highly controlled, multi-modal analysis on the brain response to implanted electrode arrays, and they were unable to show a relationship between standard histological metrics of FBR and electrophysiological outcomes. Instead, their results indicated that the neural environment around an implant is highly complex and dynamic, depending on changes in vasculature, cellular damage, ion channel expression, and neurite morphology. Such changes can result in neural silencing and changes in network activity that can be difficult to discern with classically used histological and electrophysiological measurements.
4.3. Rejuvenation was effective in EPIC electrodes
It has been observed that conventional, charge balanced stimulation causes a reduction in impedance of stimulating electrodes, and this may be due to electroporation and/or changes in cellular adhesion [62–64]. However, less is known about the effects of “rejuvenating” signals on single unit recording performance. Standard 1.5 V dc rejuvenation reduces impedance, increases SNR, and increases CSC in chronically implanted microelectrodes [50–52]. Although the mechanisms of rejuvenation are unclear, the impedance reduction for iridium electrodes is thought to be due to the formation of a hydrous oxide monolayer that helps remove protein and cellular buildup on the electrode [50,65]. Additionally, a 1.5 V dc bias will cause electrolysis of water [48,66,67] and can create a gas bubble around the electrode site that results in mechanical strain and deformation of the surrounding tissue [68]. In vivo calcium imaging also demonstrated alterations in neuronal activity following rejuvenation, with both silencing of previously active neurons and activation of previously silent neurons [68]. It is uncertain how each of these factors may contribute to the observed improvement in electrode performance following rejuvenation, but since each involve electrochemical processes, it is informative to test rejuvenation with alternative electrode materials that may exhibit different electrochemical properties.
In the current study, both standard and revised rejuvenation protocols produced significant and substantial reductions in electrode impedance for both the EPIC coated and uncoated Pt-Ir electrodes. Although these results are not dissimilar to those seen with iridium electrodes [50–52], they indicate that rejuvenation can effectively reduce 1 kHz impedance in electrode materials other than iridium. The coated electrodes exhibited a greater proportional reduction in impedance than the uncoated electrodes, but the absolute difference in impedance was similar between them. The mechanism may thus be the same for both electrode types, resulting in a similar net reduction in impedance. Ultimately, it is unclear whether there is a functional difference between the absolute and proportional reduction in impedance as there was no observable change in recorded unit yield, SNR, unit amplitude or noise following either rejuvenation protocol. However, the number of units was quite small and thus the statistical power was limited. Literature on rejuvenation has shown the reduction in electrode impedance is approximately proportional to the increase in SNR [51], suggesting that both the coated and uncoated electrodes may have exhibited an increase in SNR if the sample size was larger.
4.4. Limitations
This study has limitations in the extent to which the electrophysiological recording properties of the electrode arrays were characterized. The noise was calculated from the initial 50 μs of each recorded waveform, which should be indicative of the baseline noise in the channel [22,69]. However, a better method would be to record the continuous signal to determine the r.m.s. noise. Additionally, we only measured the impedance at 1 kHz, while more comprehensive impedance spectroscopy may be more informative as to how recording properties change over time [29,60,70,71]. For the rejuvenation experiments, we did not test enough animals with discernible units to determine adequately the effects of rejuvenation on single unit characteristics. Finally, the immunohistochemical analysis was limited to only ED1 and GFAP, and staining for additional markers such as NeuN and IgG could have provided a more complete picture of the FBR around the electrode tip [21,58,72]. We were also limited by the distance between sections, as the ideal section would be at the electrode tip but sections for each marker were taken every 200 μm.
An additional factor that must be considered is the potential impact of the other implanted hardware in the brain. In addition to the 16 channel recording array, which was the focus of this study, a second 4 channel stimulating array and a cannula were both implanted in each rat. The direct impact of these implants on the FBR of the recording array should be negligible, as the implants are approximately 2.2 and 3.8 mm away, respectively, and astrogliosis does not appear to extend beyond 500 – 600 μm from the implantation site [16,17]. However, recent work indicates that standard astrogliosis measurements do not adequately capture the additional subcellular and network effects of implants on the brain [20,21,68], which leaves open the possibility that these additional implants may have some impact on the results. Additionally, the 6-OHDA lesion induces parkinsonian symptoms in rats, which is characterized by widespread changes in neural firing patterns in the basal ganglia [13,14]. Although these widespread effects may limit the ability to compare these results against other recording stability studies, the use of interspersed coated and uncoated electrodes within each array allowed us to quantify the effect of the EPIC coating independent of these potential sources of variation.
5. Conclusion
The recording performance of microelectrode arrays functionalized with EPIC was superior to that of standard, uncoated Pt-Ir arrays. The coating resulted in lower impedance at 1 kHz, reduced noise, increased SNR, and increased unit yield, and these differences were maintained at 12 weeks p.i. The increase in SNR and unit yield is likely a product of the lower impedance leading to reduced noise in the recordings. Post-mortem immunohistochemistry showed no apparent reduction in glial scarring; however, the immunohistochemical measurements used in this study may not account for all potential variations in the immune response between the coated and uncoated electrodes. Finally, standard rejuvenation techniques produced greater proportional reductions in impedance of the coated electrodes than the uncoated electrodes. This may indicate the potential for effective electrode rejuvenation with the coated electrodes, thereby increasing further the functional longevity of the EPIC arrays.
Supplementary Material
Figure S1. Pearson’s product-moment correlation between ED1 (a-c) and GFAP (d-f)immunofluorescence in each radial bin with electrode performance metrics at multiple time points: one week post-implantation (a,d), two weeks post-implantation (b,e), and the final measurements recorded for each animal (c,f). A single * above a bar represents a PPMC coefficient significant at p<0.05 while a double ** is significant at p<0.01.
6. Acknowledgements
This work was supported in part by NIH R44NS083183 and by the Robert Plonsey Graduate Fellowship from the Duke University Department of Biomedical Engineering. The authors would also like to thank Khoa Do for his assistance with histology and Nathan Titus for helpful discussions that improved the quality of the manuscript.
Footnotes
Publisher's Disclaimer: This is a PDF file of an unedited manuscript that has been accepted for publication. As a service to our customers we are providing this early version of the manuscript. The manuscript will undergo copyediting, typesetting, and review of the resulting proof before it is published in its final citable form. Please note that during the production process errors may be discovered which could affect the content, and all legal disclaimers that apply to the journal pertain.
7. Data Availability
The raw and processed data required to reproduce these findings are available to download from [57].
Works Cited
- [1].Williams JC, Rennaker RL, Kipke DR. Long-term neural recording characteristics of wire microelectrode arrays implanted in cerebral cortex. Brain Res Protoc. 1999;4(3):303–313. doi: 10.1016/S1385-299X(99)00034-3 [DOI] [PubMed] [Google Scholar]
- [2].Liu X, McCreery DB, Carter RR, Bullara LA, Yuen TGH, Agnew WF. Stability of the interface between neural tissue and chronically implanted intracortical microelectrodes. IEEE Trans Rehabil Eng. 1999;7(3):315–326. doi: 10.1109/86.788468 [DOI] [PubMed] [Google Scholar]
- [3].Nicolelis MAL, Dimitrov D, Carmena JM, et al. Chronic, multisite, multielectrode recordings in macaque monkeys. Proc Natl Acad Sci. 2003;100(19):11041–11046. doi: 10.1073/pnas.1934665100 [DOI] [PMC free article] [PubMed] [Google Scholar]
- [4].Maynard EM, Nordhausen CT, Normann RA. The Utah Intracortical Electrode Array: A recording structure for potential brain-computer interfaces. Electroencephalogr Clin Neurophysiol. 1997;102(3):228–239. doi: 10.1016/S0013-4694(96)95176-0 [DOI] [PubMed] [Google Scholar]
- [5].Greger B, Kateb B, Gruen P, Patterson PH. A chronically implantable, hybrid cannula-electrode device for assessing the effects of molecules on electrophysiological signals in freely behaving animals. J Neurosci Methods. 2007;163(2):321–325. doi: 10.1016/j.jneumeth.2007.03.017 [DOI] [PMC free article] [PubMed] [Google Scholar]
- [6].Kipke DR, Vetter RJ, Williams JC, Hetke JF. Feasibility of Long-term Spike Recording in Cerebral Cortex Using Silicon-substrate Intracortical Microelectrode Arrays. Electr Eng. 2003;11(2):1–13. [DOI] [PubMed] [Google Scholar]
- [7].Chapin JK, Moxon KA, Markowitz RS, Nicolelis MA. Real-time control of a robot arm using simultaneously recorded neurons in the motor cortex. Nat Neurosci. 1999;2(7):664–670. doi: 10.1038/10223 [DOI] [PubMed] [Google Scholar]
- [8].Carmena JM, Lebedev MA, Crist RE, et al. Learning to control a brain-machine interface for reaching and grasping by primates. PLoS Biol. 2003;1(2):193–208. doi: 10.1371/journal.pbio.0000042 [DOI] [PMC free article] [PubMed] [Google Scholar]
- [9].Margalit E, Maia M, Weiland JD, et al. Retinal prosthesis for the blind. Surv Ophthalmol. 2002;47(4):335–356. doi: 10.1016/S0039-6257(02)00311-9 [DOI] [PubMed] [Google Scholar]
- [10].Normann RA, Maynard EM, Rousche PJ, Warren DJ. A neural interface for a cortical vision prosthesis. Vision Res. 1999;39(15):2577–2587. doi: 10.1016/S0042-6989(99)00040-1 [DOI] [PubMed] [Google Scholar]
- [11].Brocker DT, Swan BD, So RQ, Turner DA, Gross RE, Grill WM. Optimized temporal pattern of brain stimulation designed by computational evolution. Sci Transl Med. 2017;3532(January). doi: 10.1126/scitranslmed.aah3532 [DOI] [PMC free article] [PubMed] [Google Scholar]
- [12].Dorval AD, Grill WM. Deep brain stimulation of the subthalamic nucleus reestablishes neuronal information transmission in the 6-OHDA rat model of parkinsonism. J Neurophysiol. 2014;111(10):1949–1959. doi: 10.1152/jn.00713.2013 [DOI] [PMC free article] [PubMed] [Google Scholar]
- [13].Brazhnik E, Cruz AV, Avila I, et al. State-Dependent Spike and Local Field Synchronization between Motor Cortex and Substantia Nigra in Hemiparkinsonian Rats. J Neurosci. 2012;32(23):7869–7880. doi: 10.1523/JNEUROSCI.0943-12.2012 [DOI] [PMC free article] [PubMed] [Google Scholar]
- [14].Avila I, Parr-Brownlie LC, Brazhnik E, Castañeda E, Bergstrom DA, Walters JR. Beta frequency synchronization in basal ganglia output during rest and walk in a hemiparkinsonian rat. Exp Neurol. 2010;221(2):307–319. doi: 10.1016/j.expneurol.2009.11.016 [DOI] [PMC free article] [PubMed] [Google Scholar]
- [15].Anderson JC, Sheppard DT, Huynh R, et al. Subthalamic deep brain stimulation reduces pathological information transmission to the thalamus in a rat model of parkinsonism. Front Neural Circuits. 2015;9(July):1–11. doi: 10.3389/fncir.2015.00031 [DOI] [PMC free article] [PubMed] [Google Scholar]
- [16].Szarowski DH, Andersen MD, Retterer S, et al. Brain responses to micro-machined silicon devices. Brain Res. 2003;983(1–2):23–35. doi: 10.1016/S0006-8993(03)03023-3 [DOI] [PubMed] [Google Scholar]
- [17].Turner JN, Shain W, Szarowski DH, et al. Cerebral astrocyte response to micromachined silicon implants. Exp Neurol. 1999;156(1):33–49. doi: 10.1006/exnr.1998.6983 [DOI] [PubMed] [Google Scholar]
- [18].Polikov VS, Tresco PA, Reichert WM. Response of brain tissue to chronically implanted neural electrodes. J Neurosci Methods. 2005;148(1):1–18. doi: 10.1016/j.jneumeth.2005.08.015 [DOI] [PubMed] [Google Scholar]
- [19].Nolta NF, Christensen MB, Crane PD, Skousen JL, Tresco PA. BBB leakage, astrogliosis, and tissue loss correlate with silicon microelectrode array recording performance. Biomaterials. 2015;53:753–762. doi: 10.1016/j.biomaterials.2015.02.081 [DOI] [PubMed] [Google Scholar]
- [20].Salatino JW, Ludwig KA, Kozai TDY, Purcell EK. Glial responses to implanted electrodes in the brain. Nat Biomed Eng. 2017;1(November). doi: 10.1038/s41551-017-0154-1 [DOI] [PMC free article] [PubMed] [Google Scholar]
- [21].Michelson NJ, Vazquez AL, Eles JR, et al. Multi-scale, multi-modal analysis uncovers complex relationship at the brain tissue-implant neural interface: New emphasis on the biological interface. J Neural Eng. 2018;15(3). doi: 10.1088/1741-2552/aa9dae [DOI] [PMC free article] [PubMed] [Google Scholar]
- [22].Barrese JC, Rao N, Paroo K, et al. Failure mode analysis of silicon-based intracortical microelectrode arrays in non-human primates. J Neural Eng. 2013;10(6):066014. doi: 10.1088/1741-2560/10/6/066014 [DOI] [PMC free article] [PubMed] [Google Scholar]
- [23].Kozai TDY, Catt K, Li X, et al. Mechanical failure modes of chronically implanted planar silicon-based neural probes for laminar recording. Biomaterials. 2015;37:25–39. doi: 10.1016/j.biomaterials.2014.10.040 [DOI] [PMC free article] [PubMed] [Google Scholar]
- [24].McConnell GC, Rees HD, Levey AI, Gutekunst CA, Gross RE, Bellamkonda RV. Implanted neural electrodes cause chronic, local inflammation that is correlated with local neurodegeneration. J Neural Eng. 2009;6(5). doi: 10.1088/1741-2560/6/5/056003 [DOI] [PubMed] [Google Scholar]
- [25].Robinson DA. The electrical properties of metal microelectrodes. Proc IEEE. 1968;56(6):1065–1071. doi: 10.1109/PROC.1968.6458 [DOI] [Google Scholar]
- [26].Humphrey DR, Schmidt EM. Extracellular Single-Unit Recording Methods. Neurophysiol Tech II. 1977:1–64. doi: 10.1385/0-89603-185-3:1 [DOI] [Google Scholar]
- [27].Edell DJ, Van Toi V, McNeil VM, Clark LD. Factors Influencing the Biocompatibility of Insertable Silicon Microshafts in Cerebral Cortex. IEEE Trans Biomed Eng. 1992;39(6):635–643. doi: 10.1109/10.141202 [DOI] [PubMed] [Google Scholar]
- [28].Biran R, Martin DC, Tresco P a. Neuronal cell loss accompanies the brain tissue response to chronically implanted silicon microelectrode arrays. Exp Neurol. 2005;195:115–126. doi: 10.1016/j.expneurol.2005.04.020 [DOI] [PubMed] [Google Scholar]
- [29].Williams JC, Hippensteel JA, Dilgen J, Shain W, Kipke DR. Complex impedance spectroscopy for monitoring tissue responses to inserted neural implants. J Neural Eng. 2007;4(4):410–423. doi: 10.1088/1741-2560/4/4/007 [DOI] [PubMed] [Google Scholar]
- [30].Prasad A, Sanchez JC. Quantifying long-term microelectrode array functionality using chronic in vivo impedance testing. J Neural Eng. 2012;9(2). doi: 10.1088/1741-2560/9/2/026028 [DOI] [PubMed] [Google Scholar]
- [31].Geddes LA, Roeder R. Criteria for the Selection of Materials for Implanted Electrodes. Ann Biomed Eng. 2003;31(7):879–890. doi: 10.1114/1.1581292 [DOI] [PubMed] [Google Scholar]
- [32].Cogan SFF, Plante TDD, Ehrlich J, Morphology AS. Sputtered iridium oxide films (SIROFs) for low-impedance neural stimulation and recording electrodes. 26th Annu Int Conf IEEE Eng Med Biol Soc. 2004;4:4153–4156. doi: 10.1109/IEMBS.2004.1404158 [DOI] [PMC free article] [PubMed] [Google Scholar]
- [33].Gielen FLH, Bergveld P. Comparison of electrode impedances of Pt, Ptlr (10 % Ir) and Ir-AIROF electrodes used in electrophysiological experiments. Med Biol Eng Comput. 1982;20(January):77–83. [DOI] [PubMed] [Google Scholar]
- [34].Troyk PRR, Detlefsen DEE, Cogan SFF, et al. “Safe” charge-injection waveforms for iridium oxide (AIROF) microelectrodes. 26th Annu Int Conf IEEE Eng Med Biol Soc. 2004;4:4141–4144. doi: 10.1109/IEMBS.2004.1404155 [DOI] [PubMed] [Google Scholar]
- [35].Meyer RD, Cogan SF, Nguyen TH, Rauh RD. Electrodeposited iridium oxide for neural stimulation and recording electrodes. IEEE Trans Neural Syst Rehabil Eng. 2001;9(1):2–11. doi: 10.1109/7333.918271 [DOI] [PubMed] [Google Scholar]
- [36].Kang XY, Liu JQ, Tian HC, Yang B, Nuli Y, Yang CS. Fabrication and electrochemical comparison of SIROF-AIROF-EIROF microelectrodes for neural interfaces. 2014 36th Annu Int Conf IEEE Eng Med Biol Soc EMBC 2014. 2014;1(c):478–481. doi: 10.1212/WNL.0000000000002053 [DOI] [PubMed] [Google Scholar]
- [37].Erlebacher J, Searson PC, Sieradzki K. Computer Simulations of Dense-Branching Patterns. Phys Rev Lett. 1993;71(20):3311–3314. doi: 10.1103/PhysRevLett.71.3311 [DOI] [PubMed] [Google Scholar]
- [38].Darling SF. Strength and Ductility of Iridium. Causes of Fabrication Difficulties. Platin Met Rev. 1970;14(20):60. [Google Scholar]
- [39].Hasenkamp W, Musa S, Alexandru A, Eberle W, Bartic C. Electrodeposition and characterization of iridium oxide as electrode material for neural recording and stimulation Electrodeposition and characterization of iridium oxide as electrode material for neural recording and stimulation. In: World Congress on Medical Physics and Biomedical Engineering.; 2009:472–475. doi: 10.1007/978-3-642-03889-1 [DOI] [Google Scholar]
- [40].Petrossians A, Whalen JJ III, Weiland JD, Mansfeld F. Surface Modification of Neural Stimulating / Recording Electrodes with High Surface Area Platinum-Iridium Alloy Coatings. IEEE Eng Med Biol Mag. 2011:3001–3004. doi: 10.1109/IEMBS.2011.6090823 [DOI] [PubMed] [Google Scholar]
- [41].Petrossians A, Whalen JJ III, Weiland JD, Mansfeld F. Electrodeposition and Characterization of Thin-Film Platinum-Iridium Alloys for Biological Interfaces. J Electrochem Soc. 2011;158(5):269–276. doi: 10.1149/1.3559477 [DOI] [Google Scholar]
- [42].Petrossians A, Whalen JJ III, Weiland JD, Whalen JJ, Weiland JD. Improved Electrode Material for Deep Brain Stimulation In: 38th Annual International Conference of the IEEE Engineering in Medicine and Biology Society (EMBC). Vol 2016-Octob IEEE; 2016:1798–1801. doi: 10.1109/EMBC.2016.7591067 [DOI] [PubMed] [Google Scholar]
- [43].Schmidt EM, Bak MJ, Hambrecht FT, Kufta CV, Rourke DKO, Vallabhanath P. Feasibility of a visual prosthesis for the blind based on intracorticai microstimulation of the visual cortex. Brain. 1996;119:507–522. papers2://publication/uuid/47A7E5E8-B487–4FB8-A39F-3675EACE4BC5. [DOI] [PubMed] [Google Scholar]
- [44].Takmakov P, Ruda K, Phillips KS, Isayeva IS, Krauthamer V, Welle CG. Rapid evaluation of the durability of cortical neural implants using accelerated aging with reactive oxygen species. J Neural. 2015;12(2):1–29. doi: 10.1088/1741-2560/12/2/026003.Rapid [DOI] [PMC free article] [PubMed] [Google Scholar]
- [45].Xu L, Gutbrod SR, Ma Y, et al. Materials and Fractal Designs for 3D Multifunctional Integumentary Membranes with Capabilities in Cardiac Electrotherapy. Adv Mater. 2015;27(10):1731–1737. doi: 10.1002/adma.201405017 [DOI] [PMC free article] [PubMed] [Google Scholar]
- [46].Davuluri NS, Nimmagadda K, Petrossians A, Humayun MS, Weiland JD. Strategies to improve stimulation efficiency for retinal prostheses. IEEE Xplore. 2016;2016-Octob:3133–3138. doi: 10.1109/EMBC.2016.7591393 [DOI] [PubMed] [Google Scholar]
- [47].Lee CD, Hudak EM, Whalen JJ, et al. Low-Impedance, High Surface Area Pt-Ir Electrodeposited on Cochlear Implant Electrodes. J Electrochem Soc. 2018;165(12):3015–3017. doi: 10.1149/2.0031812jes [DOI] [Google Scholar]
- [48].Cogan SF. Neural Stimulation and Recording Electrodes. Annu Rev Biomed Eng. 2008;10:275–309. doi: 10.1146/annurev.bioeng.10.061807.160518 [DOI] [PubMed] [Google Scholar]
- [49].Paxinos G, Watson C. The Rat Brain in Stereotaxic Coordinates Sixth Edition. Elsevier Acad Press. 2007;170:547–612. [Google Scholar]
- [50].Otto KJ, Johnson MD, Kipke DR. Voltage pulses change neural interface properties and improve unit recordings with chronically implanted microelectrodes. IEEE Trans Biomed Eng. 2006;53(2):333–340. doi: 10.1109/TBME.2005.862530 [DOI] [PubMed] [Google Scholar]
- [51].Johnson MD, Otto KJ, Kipke DR. Repeated voltage biasing improves unit recordings by reducing resistive tissue impedances. IEEE Trans Neural Syst Rehabil Eng. 2005;13(2):160–165. doi: 10.1109/TNSRE.2005.847373 [DOI] [PubMed] [Google Scholar]
- [52].Johnson M, Otto KJ, Williams JC, Kipke DR. Bias voltages at microelectrodes change neural interface properties in vivo. IEEE EMBS. 2004:4103–4106. [DOI] [PubMed] [Google Scholar]
- [53].So RQ, McConnell GC, August AT, Grill WM. Characterizing effects of subthalamic nucleus deep brain stimulation on methamphetamine-induced circling behavior in hemi-parkinsonian rats. IEEE Trans Neural Syst Rehabil Eng. 2012;20(5):626–635. doi: 10.1109/TNSRE.2012.2197761 [DOI] [PMC free article] [PubMed] [Google Scholar]
- [54].McConnell GC, So RQ, Hilliard JD, Lopomo P, Grill WM. Effective deep brain stimulation suppresses low-frequency network oscillations in the basal ganglia by regularizing neural firing patterns. J Neurosci. 2012;32(45):15657–15668. doi: 10.1523/JNEUROSCI.2824-12.2012 [DOI] [PMC free article] [PubMed] [Google Scholar]
- [55].McConnell GC, So RQ, Grill WM. Failure to suppress low-frequency neuronal oscillatory activity underlies the reduced effectiveness of random patterns of deep brain stimulation. J Neurophysiol. 2016;(919):jn.00822.2015. doi: 10.1152/jn.00822.2015 [DOI] [PMC free article] [PubMed] [Google Scholar]
- [56].Winslow BD, Tresco PA. Quantitative analysis of the tissue response to chronically implanted microwire electrodes in rat cortex. Biomaterials. 2010;31(7):1558–1567. doi: 10.1016/j.biomaterials.2009.11.049 [DOI] [PubMed] [Google Scholar]
- [57].NEED MENDELEY DATA LINK FROM ELSEVIER.
- [58].McCreery D, Cogan S, Kane S, Pikov V. Correlations between histology and neuronal activity recorded by microelectrodes implanted chronically in the cerebral cortex. J Neural Eng. 2016;13(3). doi: 10.1088/1741-2560/13/3/036012 [DOI] [PMC free article] [PubMed] [Google Scholar]
- [59].Malaga KA, Schroeder KE, Patel PR, et al. Data-driven model comparing the effects of glial scarring and interface interactions on chronic neural recordings in non-human primates. J Neural Eng. 2016;13(1):16010. doi: 10.1088/1741-2560/13/1/016010 [DOI] [PubMed] [Google Scholar]
- [60].Ludwig KA, Uram JD, Yang J, Martin DC, Kipke DR. Chronic neural recordings using silicon microelectrode arrays electrochemically deposited with a poly(3,4-ethylenedioxythiophene) (PEDOT) film. J Neural Eng. 2006;3(1):59–70. doi: 10.1088/1741-2560/3/1/007 [DOI] [PubMed] [Google Scholar]
- [61].Newbold C, Richardson R, Millard R, et al. Changes in biphasic electrode impedance with protein adsorption and cell growth. J Neural Eng. 2010;7(056011):1–11. doi: 10.1088/1741-2560/7/5/056011 [DOI] [PMC free article] [PubMed] [Google Scholar]
- [62].Chen KH, Dammann JF, Boback JL, et al. The effect of chronic intracortical microstimulation on the electrode-tissue interface. J Neural Eng. 2014;11(2):1–13. doi: 10.1088/1741-2560/11/2/026004 [DOI] [PMC free article] [PubMed] [Google Scholar]
- [63].Lempka SF, Miocinovic S, Johnson MD, Vitek JL, McIntyre CC. In vivo impedance spectroscopy of deep brain stimulation electrodes. J Neural Eng. 2009;6(4):046001. doi: 10.1088/1741-2560/6/4/046001 [DOI] [PMC free article] [PubMed] [Google Scholar]
- [64].Newbold C, Richardson R, Millard R, Seligman P, Cowan R, Shepherd R. Electrical stimulation causes rapid changes in electrode impedance of cell-covered electrodes. J Neural Eng. 2011;8(036029):1–13. doi: 10.1088/1741-2560/8/3/036029 [DOI] [PMC free article] [PubMed] [Google Scholar]
- [65].Pickup PG, Birss VI. A model for anodic hydrous oxide growth at iridium. J Electroanal Chem. 1987;220(1):83–100. doi: 10.1016/0022-0728(87)88006-3 [DOI] [Google Scholar]
- [66].Merrill DR, Bikson M, Jefferys JGR. Electrical stimulation of excitable tissue: design of efficacious and safe protocols. J Neurosci Methods. 2005;141(2):171–198. doi: 10.1016/j.jneumeth.2004.10.020 [DOI] [PubMed] [Google Scholar]
- [67].Cogan SF, Ludwig KA, Welle CG, Takmakov P. Tissue damage thresholds during therapeutic electrical stimulation. J Neural Eng. 2016;13(021001):21001. doi: 10.1088/1741-2560/13/2/021001 [DOI] [PMC free article] [PubMed] [Google Scholar]
- [68].Eles JR, Vazquez AL, Kozai TDYY, Cui XT. In vivo imaging of neuronal calcium during electrode implantation: Spatial and temporal mapping of damage and recovery. Biomaterials. 2018;174:79–94. doi: 10.1016/j.biomaterials.2018.04.043 [DOI] [PMC free article] [PubMed] [Google Scholar]
- [69].Flesher SN, Collinger JL, Foldes ST, et al. Intracortical microstimulation of human somatosensory cortex. Sci Transl Med. 2016;8(361):1–10. doi: 10.1126/scitranslmed.aaf8083 [DOI] [PubMed] [Google Scholar]
- [70].Green RA, Lovell NH, Wallace GG, Poole-Warren LA. Conducting polymers for neural interfaces: Challenges in developing an effective long-term implant. Biomaterials. 2008;29(24–25):3393–3399. doi: 10.1016/j.biomaterials.2008.04.047 [DOI] [PubMed] [Google Scholar]
- [71].Cui X, Lee V a, Raphael Y, et al. Surface modification of neural recording electrodes with conducting polymer / biomolecule blends. J Biomed Mater Res. 2001:261–272. [DOI] [PubMed] [Google Scholar]
- [72].Skousen JL, Merriam SME, Srivannavit O, Perlin G, Wise KD, Tresco PA. Reducing surface area while maintaining implant penetrating profile lowers the brain foreign body response to chronically implanted planar silicon microelectrode arrays. Prog Brain Res. 2011;194(November 2017):167–180. doi: 10.1016/B978-0-444-53815-4.00009-1 [DOI] [PubMed] [Google Scholar]
Associated Data
This section collects any data citations, data availability statements, or supplementary materials included in this article.
Supplementary Materials
Figure S1. Pearson’s product-moment correlation between ED1 (a-c) and GFAP (d-f)immunofluorescence in each radial bin with electrode performance metrics at multiple time points: one week post-implantation (a,d), two weeks post-implantation (b,e), and the final measurements recorded for each animal (c,f). A single * above a bar represents a PPMC coefficient significant at p<0.05 while a double ** is significant at p<0.01.