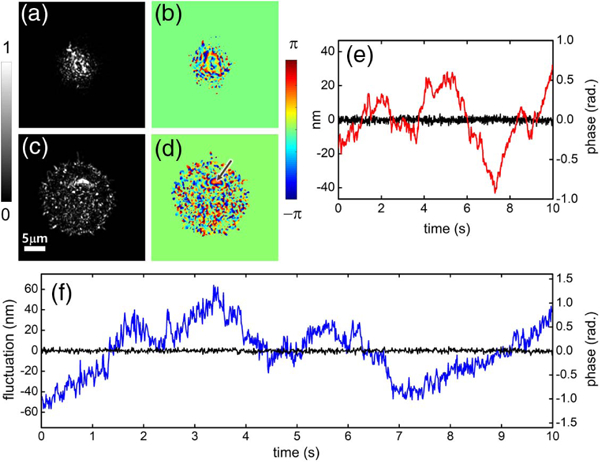
Fig. 4.

Observation of the nuclear fluctuation. (a) Reflection intensity and (b) corresponding phase image for the top plasma membrane of the cell. (c) Reflection intensity and (d) corresponding phase image for the nuclear membrane of the cell. (e) Background fluctuation before (red line) and after (black line) the phase stabilization. (f) Nuclear membrane motion (blue trace) measured at the point indicated by the arrow in (d). Black trace represents the background fluctuation in the blank region. Color bar in (a) and (c): normalized intensity. (a) and (c) are presented with the same color scale. Color bar in (b) and (d): phase in radians.
