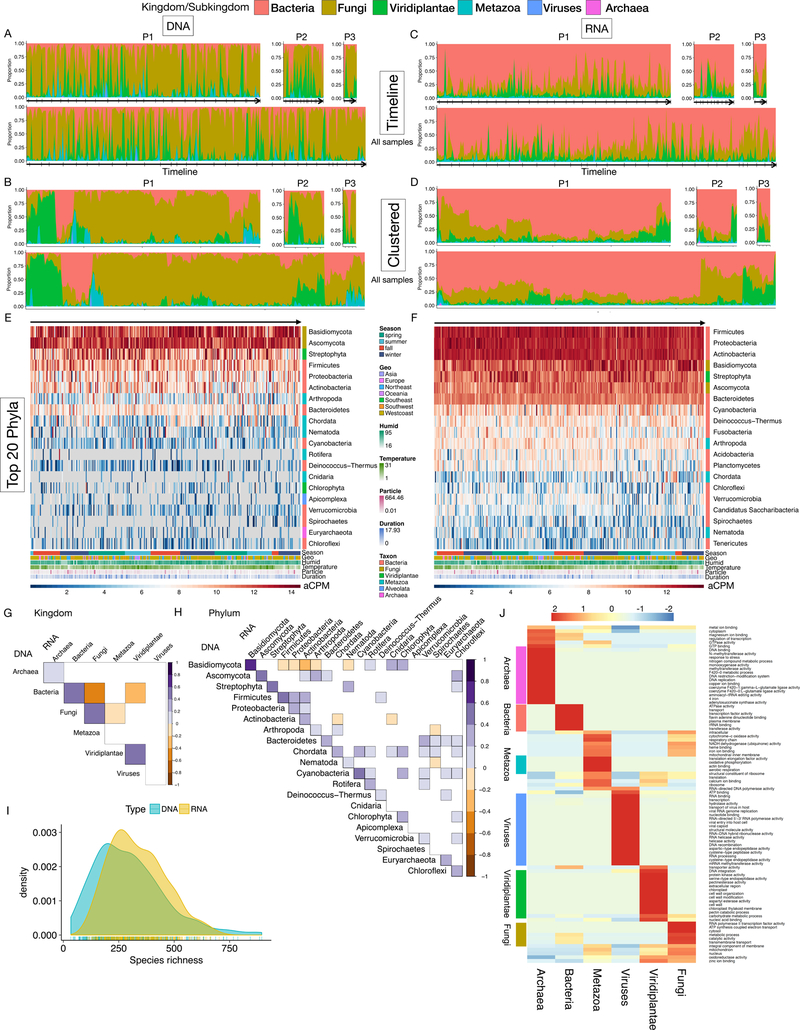
Fig. 2.
The highly dynamic and diverse human environmental exposome. (A) Timeline and (B) hierarchical clustered exposome profiles of samples from P1, P2, and P3 (top row) and all samples (bottom row), respectively. Proportions are calculated at the kingdom/subkingdom level. Ticks on arrows indicate months. (C-D) Same as A-B except for RNA exposome profiles. (E-F) Heatmap of DNA (E) and RNA (F) chronological exposome profiles at the phylum level. Colored bar denotes the domain of phylum, respectively. (G-H) Correlation plots between DNA and RNA exposome profiles at the kingdom/subkingdom (G) and the phylum (H) level. Correlations with Adj. p < 0.05 are shown. (I) Species richness analyses in DNA and RNA exposome profiles. (J) Functional transcriptomics analyses of the RNA exposome data. Domain-relevant GO terms are denoted by the colored bars next to the heatmap.

