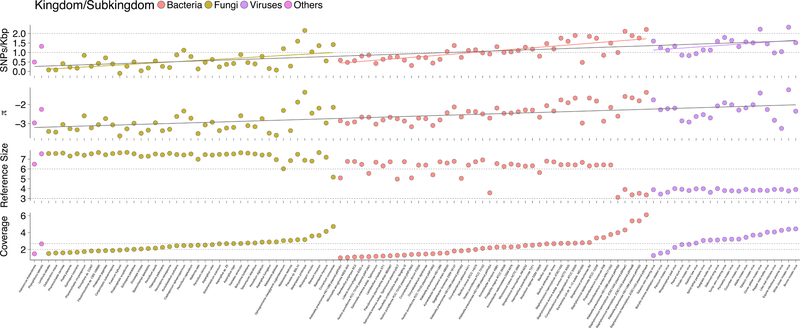
Fig. 6.
Extensive pan-domain intra-species variation in the exposome. Population genetics analyses on top abundant species (N = 108) from Bacteria, Fungi, and Viruses domains. Archaeon Halococcus thailandensis and Oomycetes Phytophthora lateralis are also included. First row, SNP density, dashed lines denote 100, 10 SNPs/Kbp, respectively; second row, nucleotide diversity (n); third row, reference genome size, dashed line denotes 1e6 bps; and fourth row, average coverage of reference genomes. Dashed lines denote 100- and 500-fold coverage, respectively. All values are in log scale (base 10).

