Abstract
Chronic traumatic encephalopathy (CTE) is a neurodegenerative tauopathy associated with repetitive head impacts or exposure to blast waves. First described as punch-drunk syndrome and dementia pugilistica in retired boxers1-3, CTE has since been identified in former participants of other contact sports, ex-military personnel and following physical abuse4-7. No disease-modifying therapies exist and diagnosis requires an autopsy. CTE is defined by an abundance of hyperphosphorylated tau protein in neurons, astrocytes and cell processes around blood vessels8,9. This, together with the accumulation of tau inclusions in cortical layers II and III, distinguishes CTE from Alzheimer’s disease and other tauopathies10,11. However, the morphologies of tau filaments in CTE and the mechanisms by which brain trauma can lead to their formation are unknown. We used electron cryo-microscopy (cryo-EM) to determine the structures of tau filaments, with resolutions down to 2.3 Å, from the brains of three individuals with CTE, one American football player and two boxers. We show that filament structures are identical in the three cases, but distinct from those of Alzheimer’s and Pick’s diseases, and from those formed in vitro12-15. Like in Alzheimer’s disease12,14,16-18, all six brain tau isoforms assemble into CTE filaments, and residues K274/S305-R379 form the ordered core of two identical C-shaped protofilaments. However, CTE filaments have novel protofilament interfaces, resulting in different overall morphologies. Moreover, a different conformation of the β-helix region creates a hydrophobic cavity that is absent in tau filaments from Alzheimer’s disease brain. This cavity encloses an additional density that is not connected to tau, suggesting that incorporation of cofactors may play a role in tau aggregation in CTE. The tau filament structures presented here provide a unifying neuropathological criterion for CTE, and support the hypothesis that the formation and propagation of distinct conformers of assembled tau underlie different neurodegenerative diseases.
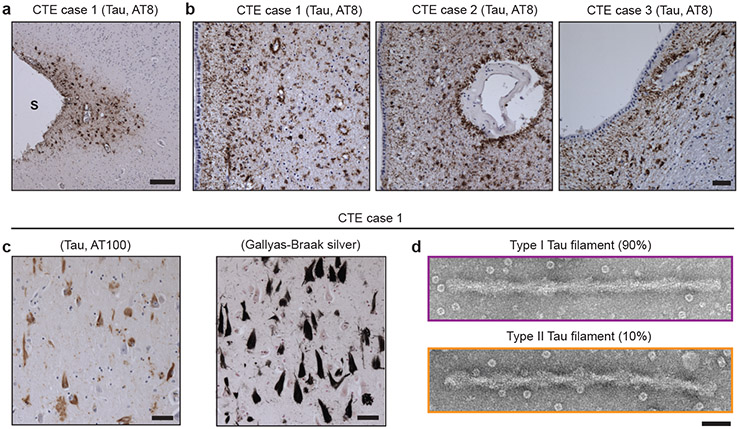
We extracted tau filaments from the temporal cortices of a former professional American football player (case 1) and two ex-professional boxers (cases 2 and 3) with neuropathologically-confirmed diagnoses of CTE. Perivascular hyperphosphorylated tau (AT8-positive) was present in neurons, astroglia and cell processes in the depths of cortical sulci and around blood vessels more generally, especially in the subependymal region (Figure 1a,b), with abundant tau inclusions composed of assembled, hyperphosphorylated three-repeat (3R) and four-repeat (4R) tau isoforms in superficial cortical layers (Figure 1c, Extended Data Figure 1 and see Methods).
Figure 1: Filamentous tau pathology of CTE.
a, Perivascular staining of tau inclusions in the depth of a sulcus (S) in the frontal cortex of CTE case 1 using antibody AT8 (pS202/pT205 tau; brown). Nuclei were counterstained blue. Scale bar, 100 μm. b, Perivascular staining of tau inclusions in the subependymal regions of CTE cases 1, 2 and 3 using antibody AT8 (brown). Nuclei were counterstained blue. Scale bar, 100 μm. c, Staining of tau inclusions using antibody AT100 (pT212/pS214/pT217 tau; brown) and Gallyas-Braak silver staining (black) of inclusions in the temporal cortex of CTE case 1. Nuclei were counterstained blue. Scale bar, 50 μm. d, Negative-stain electron micrographs of a type I and a type II tau filament extracted from temporal cortex of CTE case 1. Scale bar, 50 nm.
Negative-stain electron microscopy revealed a predominant helical filament type in all three cases, comprising ~90% of filaments, with projected widths of 20-25 nm and cross-over spacings of 65-80 nm (Figure 1d; type I tau filaments). These filaments differed from paired helical and straight filaments (PHFs and SFs) of Alzheimer’s disease14,16, which consist of 3R and 4R tau, narrow and wide Pick filaments (NPFs and WPFs) of Pick’s disease15, which are made of only 3R tau, and filaments assembled from either recombinant 3R or 4R tau using heparin17. The remaining filaments resembled PHFs, with pronounced helical twists resulting in projected widths of 15-30 nm (Figure 1d; type II tau filaments).
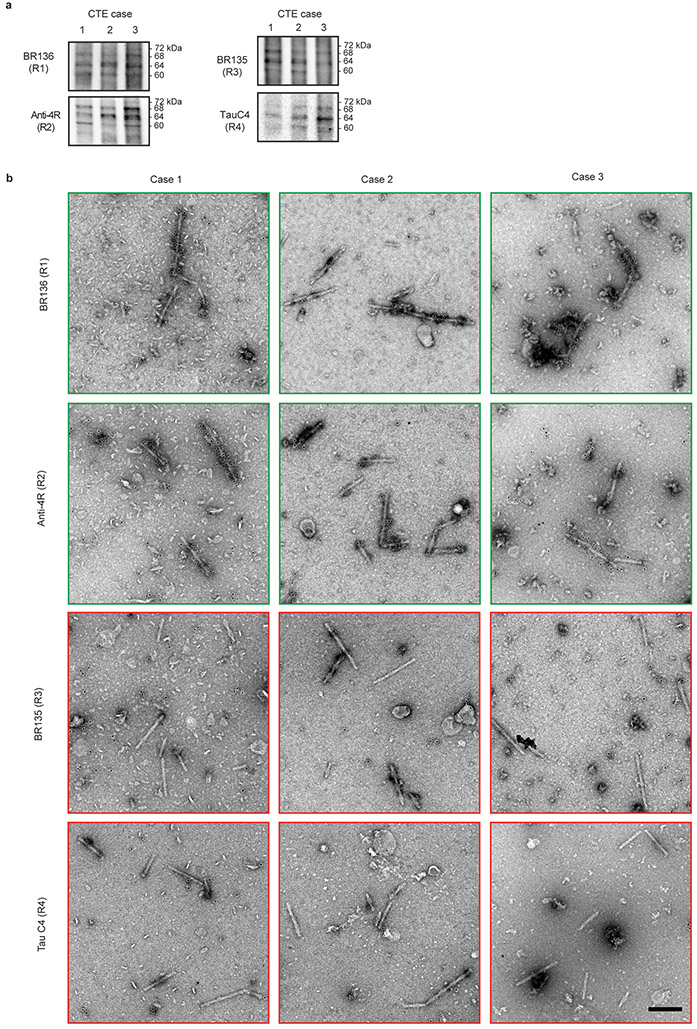
Immunoblotting of the sarkosyl-insoluble fractions from temporal cortex showed a pattern of tau bands like that of Alzheimer’s disease17,18 in the footballer and in both boxers16, consistent with the presence of all six brain tau isoforms in a hyperphosphorylated state17,18 (Extended Data Figure 1d). Immunogold negative-stain electron microscopy (immuno-EM) indicated that in all three CTE cases the sequences within the structured core of filaments contained R3 and R4 of tau, as in PHFs and SFs12,14, with the N-terminal parts of R1 and R2 forming part of an unstructured fuzzy coat (Extended Data Figure 2)19.
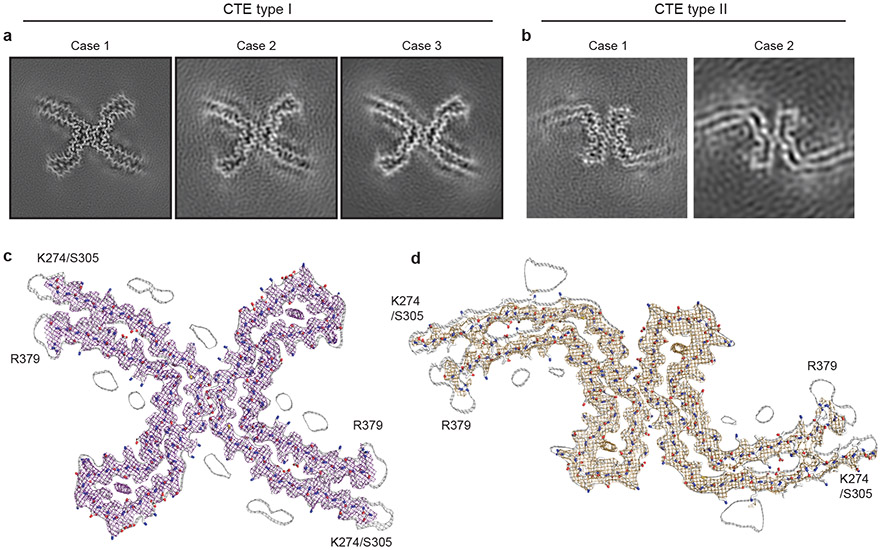
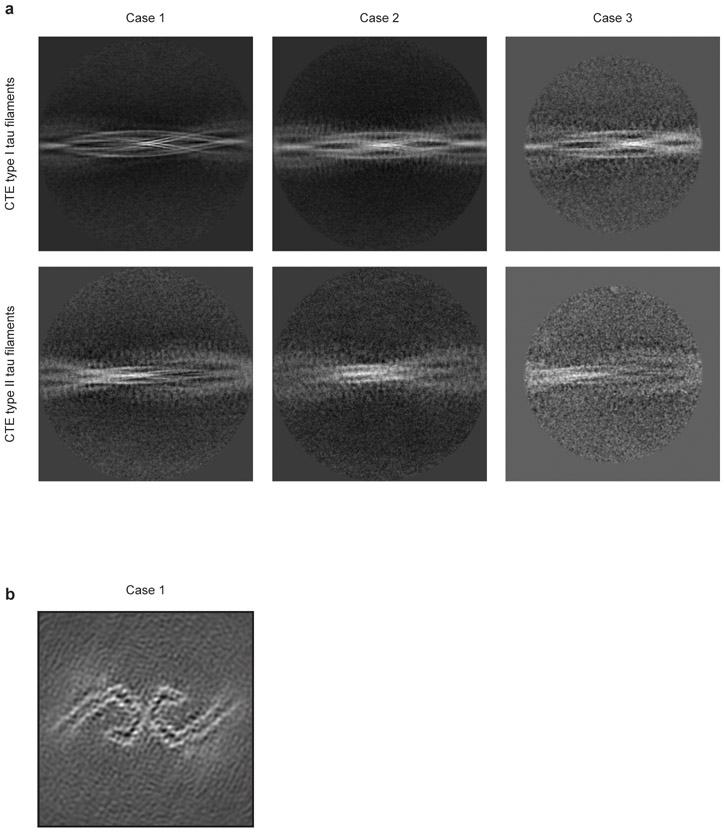
We used cryo-EM and helical reconstruction in RELION20 to determine the structures of the tau filaments of CTE (Figure 2, Extended Data Figure 3a, Extended Data Table 1). In all three cases, the predominant tau filament type, which we named type I, comprised pairs of identical protofilaments related by an approximate 21 helical symmetry (Figure 2a, Extended Data Figure 3a). The protofilament structure (CTE fold) is reminiscent of the C-shaped Alzheimer fold12, but adopts a more open conformation. Most strikingly, additional density, not present in the Alzheimer fold, is surrounded by the density of the tau protein chain within the ordered core. Three-dimensional classification of the minority population of filaments from case 1 revealed that it comprised two types. About 75% of these filaments were composed of pairs of the same protofilament as in CTE type I tau filaments, including the extra density, but with a different protofilament interface, also related by an approximate 21 helical symmetry (Figure 2b, Extended Data Figure 3a). We named these tau filaments CTE type II. The remaining filaments were identical to PHFs (Extended Data Figure 3b). For case 2, 3D classification only identified CTE type II tau filaments in the minority population (Figure 2b). For case 3, too few filaments were present to perform 3D classification or refinement of the minority population. As in PHFs and SFs14, we observed weaker densities extending from the N- and C-terminal regions of the core of all the filament types, as well as bordering the solvent-exposed side-chains of K317 and K321; H362 and K369; and K369 and K375. We conclude that over 97% of tau filaments in CTE comprise pairs of protofilaments with a conserved fold that is distinct from the Alzheimer and Pick folds.
Figure 2: Cryo-EM structures of CTE type I and type II tau filaments.
a,b, Cryo-EM structures of CTE type I tau filaments from the temporal cortices of cases 1, 2 and 3 (a) and type II tau filaments from the temporal cortices of cases 1 and 2 (b). All structures show identical pairs of protofilaments and the same inter-protofilament packing between cases in CTE type I and type II filaments. c,d, Sharpened, high-resolution cryo-EM maps of CTE type I (c) and type II (d) tau filaments with their corresponding atomic models overlaid. Unsharpened, 4.5 Å low-pass filtered maps are shown as grey outlines, showing weaker densities extending from the N- and C-terminal regions, as well as bordering the solvent-exposed side-chains of K317 and K321, H362 and K369, and K369 and K375.
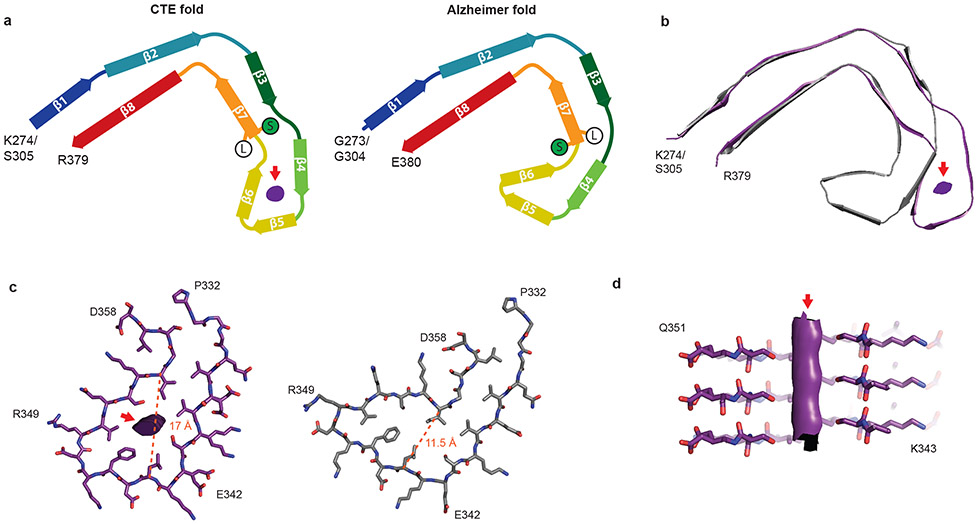
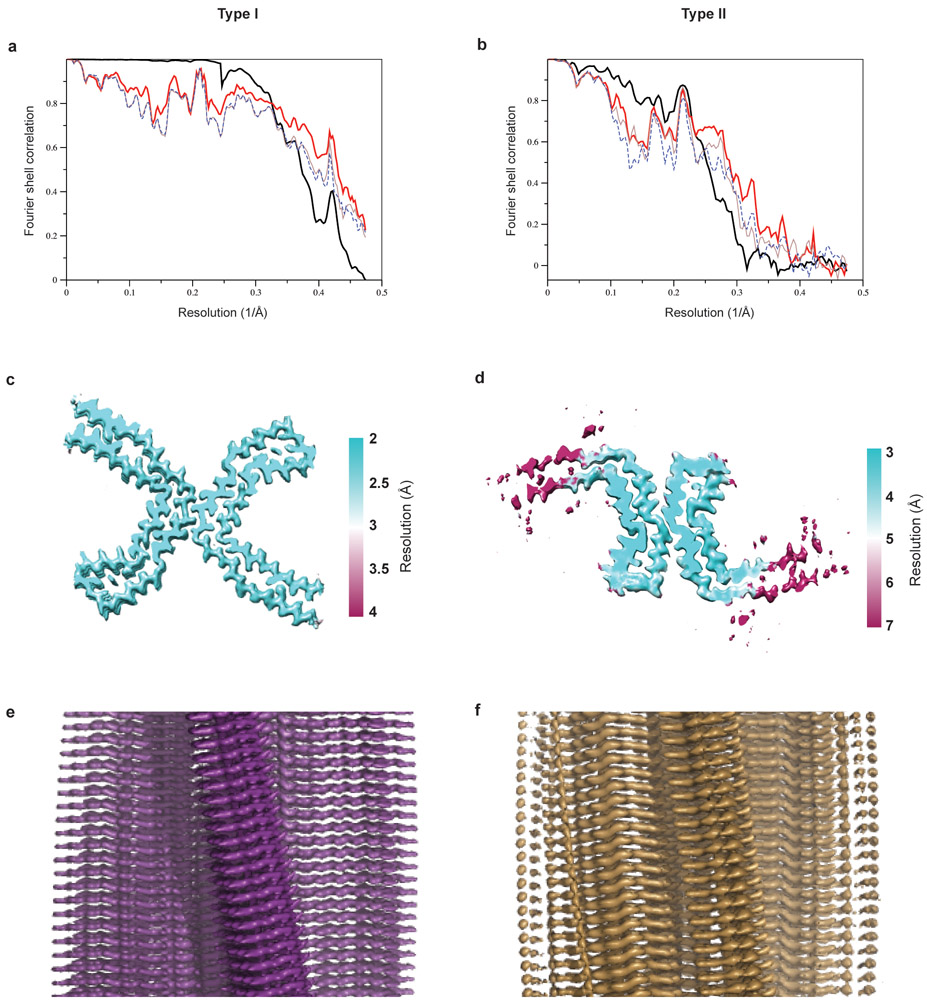
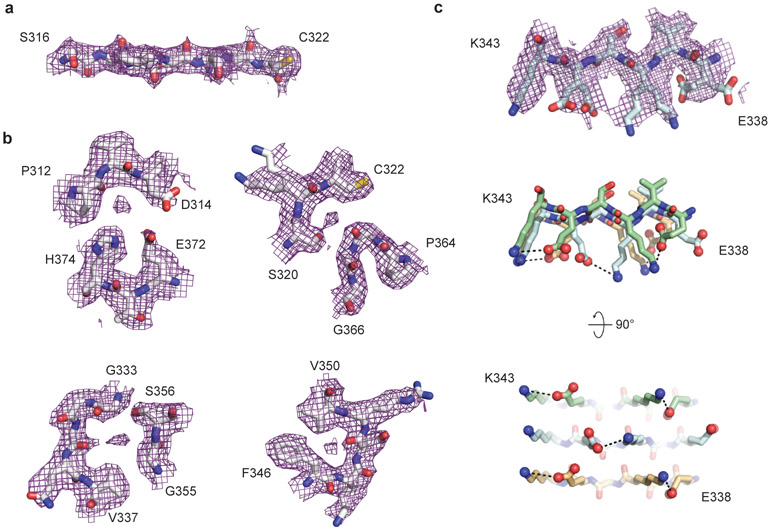
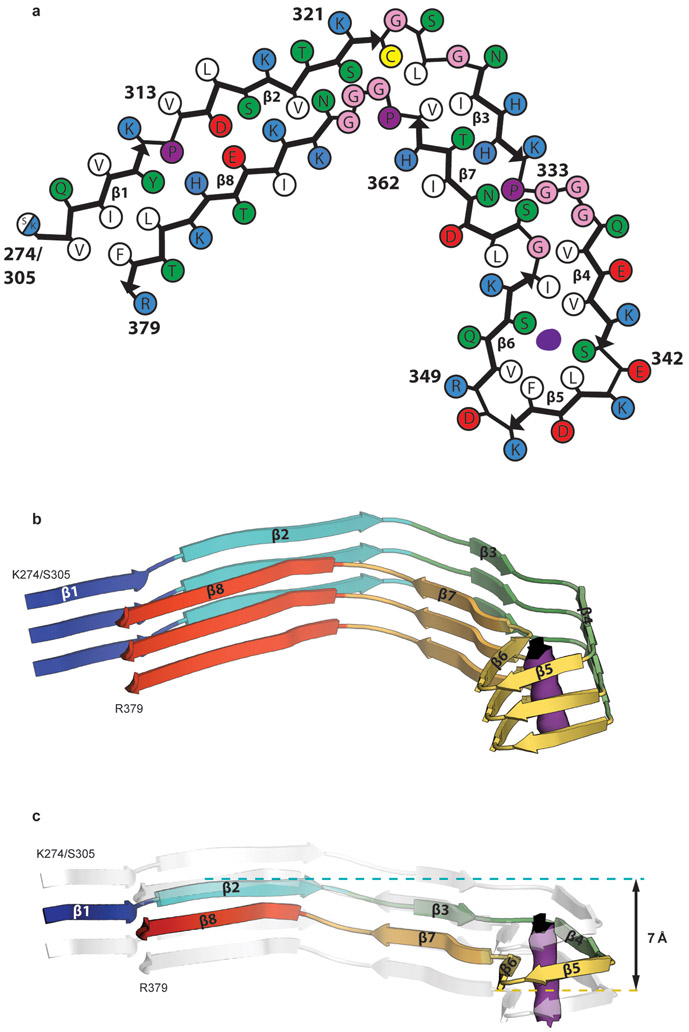
By correcting for 3- and 4-fold astigmatism in the case 1 dataset (see Methods), we obtained a 2.3 Å-resolution map of CTE type I tau filaments (Figure 2c, Extended Data Figure 4). Densities corresponding to peptide group oxygen atoms, ordered solvent molecules and alternative conformations of amino acid side-chains were identified (Extended Data Figure 5). Consequently, we could build and stereochemically refine an atomic model with unprecedented accuracy for amyloid filaments (Figure 2c). This revealed that, similar to the Alzheimer fold, the CTE fold is formed from residues K274 - R379 of 3R tau and S305 - R379 of 4R tau. The topology and secondary structure elements of the CTE fold are also similar to the Alzheimer fold12 (Figure 3a). These may be common features of filaments composed of both 3R and 4R tau in human brain. Eight β-strands (β1-8) pack against each other to form a combined cross-β/β-helix fold: β1 and β2 engage in anti-parallel cross-β packing against β8; β3 packs against β7; and β4-6 form a triangular β-helix that turns the main chain back on itself (Extended Data Figure 6). We resolved alternative conformations for the stretch of solvent-exposed side-chains in the β-helix (β4) with alternating positive and negative charges (Extended Data Figure 5c), demonstrating intramolecular charge interactions that compensate for stacked side-chains with identical charges, as hypothesised for the Alzheimer fold12. We also identified density corresponding to ordered solvent molecules, which we interpreted as water, between the backbone of V313 in β1 and the side-chains of H374 and E372 of β8; between the side-chain of S320 and the backbones of K321 of β2 and of G365; between the backbones of G333 and G335 and the side-chain of S356 in β7; and between the backbones of K337 and D348 in the β-helix (Extended Data Figure 5b). It is likely that other tau filament folds, including those of Alzheimer’s and Pick’s diseases, incorporate ordered solvent molecules in a similar manner.
Figure 3: Comparison of the CTE and Alzheimer tau filament folds.
a, Schematic of the secondary structure elements in the CTE and Alzheimer folds, depicted as a single rung. The positions of S356 (green ‘S’) and L357 (white ‘L’) in the two folds are highlighted. The extra density is depicted in grey. b, Overlay of the CTE fold (purple) and the Alzheimer fold (grey), shown as a single rung. c, The β-helices of the Alzheimer fold (grey) and the CTE fold (purple), depicted as a single rung. The distances between the Cα atoms of L344 and I354 are shown as orange dashed lines. d, View normal to the helical axis of the CTE fold β-helix, depicted as three rungs and shown as a cross-section through S341 and S352.
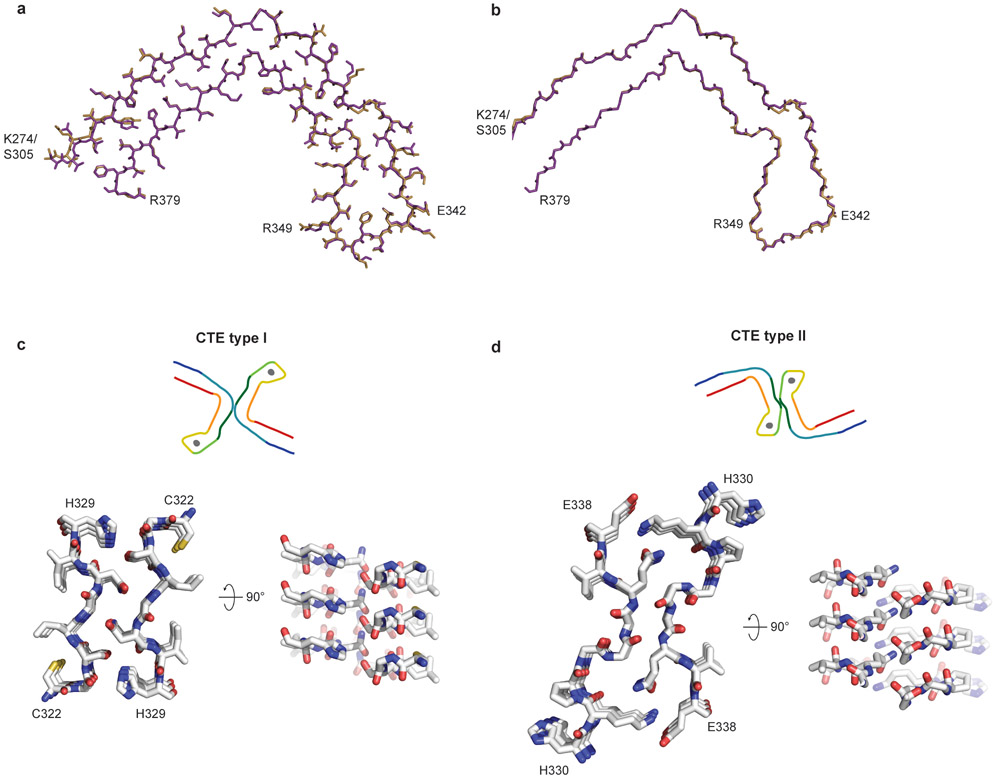
The 3.4 Å-resolution map of the CTE type II tau filaments from case 1 also enabled us to generate a stereochemically refined atomic model (Figure 2d, Extended Data Figure 4). This showed that CTE type I and type II tau filaments are ultrastructural polymorphs, with a common protofilament structure, but different protofilament interfaces (Extended Data Figure 7). The protofilament interface of type I tau filaments consists of an anti-parallel steric zipper formed by residues 324SLGNIH329. This interface is not compatible with phosphorylation of S324, which has been reported in Alzheimer’s disease21, and may explain why tau filaments with this protofilament interface are not observed in Alzheimer’s disease. The protofilament interface of CTE type II tau filaments is formed by the 331KPGGGQVE338 motif that also forms the PHF interface in Alzheimer’s disease12,14. However, whereas the 322PGGG335 motif adopts an extended conformation in the Alzheimer fold, with all three glycine residues forming hydrogen bonds12, it has a kinked conformation in CTE type II filaments, with only G334 and G335 contributing to hydrogen bonding. Similar to PHFs14, the side-chain of K331 interacts with those of Q336 and E338 on the other protofilament. Possibly, a less stable interface accounts for the lower abundance of CTE type II than type I filaments.
A different β-strand packing in the β-helix motif creates a hydrophobic cavity that courses through CTE type I and II tau filaments (Figure 3a,b). In the Alzheimer fold, the interior facing side-chains of the β-helix pack tightly against each other, leaving no space to incorporate additional mass12. The distance between the Cα atoms of L344 and I354 is 11.5 Å in the Alzheimer fold and 17 Å in the CTE fold (Figure 3c). This cavity is fully occupied by an extra density in the CTE fold (Figure 3d). The repacked β-helix coincides with the kink in the preceding 332PGGG335 motif, which is compensated for by a different conformation of the 353KIGSL357 motif than in the Alzheimer fold (Figure 3a). This new conformation, in which the side-chain of S356 points inward and that of L357 points outward, opposite to the Alzheimer fold, creates a tighter turn and precludes phosphorylation of S356. In addition, minor conformational adjustments tighten the turn formed by 341SEKL344 between β4 and β5 and relax the turn formed by FKDRV between β5 and β6, compared to the Alzheimer fold. Overall, these conformational changes swivel the β-helix motif relative to the common cross-β packing stacks in the CTE fold, yielding a more open fold than in the tau filaments of Alzheimer’s disease.
The extra density in the cavity is as strong as that of tau, implying near-stoichiometric occupancies (Figure 2). It is surrounded by the hydrophobic side-chains of V339, L344, F346, V350 and I354, and the hydroxyl groups of S341 and S352, indicating that the extra density is primarily hydrophobic (Figure 3c,d). It does not connect to the density for the tau molecules, suggesting that it is not covalently linked to tau, and we found no evidence by mass-spectrometry of post-translational modifications of either S341 or S352. The extra density appears as an elliptical rod, with cross-sectional dimensions similar to those of the neighbouring side-chain of F346. Despite the resolution of our reconstruction, the extra density has few features along the helical axis and attempts to resolve it in this direction, by performing refinements with a larger helical rise, were unsuccessful. This is consistent with the observation that power spectra of individual filaments, as well as the average power spectra of all segments used for refinement, show only a layer line at 4.7 Å. The extra density may correspond to hydrophobic molecules that fill the cavity end-to-end, spanning a variable number of tau molecules along the helical axis. RNA and sulphated glycosaminoglycans, such as heparin, which induce tau aggregation in vitro22-24, are too hydrophilic and too large to occupy the cavity. Candidate molecules include non-polar sterols and sterol derivatives, as well as fatty acids and their derivatives, with one or two aliphatic chains.
The CTE fold is, thus far, the only known amyloid structure to incorporate non-proteinaceous molecules, suggesting a novel basis for conformer formation and propagation that is not only dependent on protein. Their buried nature, high occupancy and presence in the majority of filaments at end-stage disease indicate that these molecules are continuously incorporated during filament formation. They may act as cofactors to stabilise the folding of tau during initial filament assembly and/or subsequent seeded aggregation. Indeed, fatty acids induce recombinant tau to form filaments25 and CTE tau filaments seed the aggregation of 3R and 4R tau in cultured cells26. Moreover, in Niemann-Pick disease type C, cellular accumulation of cholesterol leads to the formation of abundant filamentous tau inclusions in brain27,28. In contrast, structures of in vitro assembled α-synuclein and β2-microglobulin filaments contain similar cavities devoid of densities29-32. Sequestration of cellular factors by CTE filaments within the hydrophobic cavity may contribute to their neurotoxicity33.
The presence of tau inclusions around blood vessels in CTE suggests that cofactors for assembly may initially enter the brain from the periphery following head trauma, or be dependent on peripheral mechanisms. Repetitive head trauma has been shown to lead to a transient inflammatory response and compromise of the blood brain barrier34. Although the epidemiology of CTE is not known, it appears likely that brain trauma leads to CTE in only a subset of individuals, which could include those with elevated levels of cofactors35. The latter may, therefore, represent therapeutic targets for the prevention of tau assembly in CTE. Moreover, the stereochemical environment of cofactors within the CTE fold may inform the design of compounds that displace them, destabilise the filament fold or prevent the addition of tau monomers during filament elongation. Incorporation of a compound into a similar cavity in α-synuclein filaments has been shown to inhibit assembly36.
The CTE fold supports the hypothesis that conformers of filamentous tau define distinct tauopathies. We previously showed that tau filaments from Alzheimer’s and Pick’s diseases adopt different folds, establishing the existence of molecular conformers. In contrast to Pick’s disease, filaments in CTE have the same tau isoform composition as in Alzheimer’s disease, showing that the same protein sequences can also form different conformers or aggregate strains. The results presented here provide a unifying neuropathological criterion, and confirm that dementia pugilistica and CTE are the same disease. The structures will aid in the design of specific tracer compounds, which are crucial for early diagnosis, so as to allow for timely therapeutic intervention.
METHODS
Clinical history and neuropathology
Case 1 of CTE is a retired professional American football player, who died aged 67. Cases 2 and 3 are former professional boxers, who died aged 67 and 78, respectively. Case 1 is documented for the first time, whereas cases 2 and 3 have been described before5,16,37-40. Case 1 played football during high school and college, and in over 30 professional matches during the 1970s. He reported a history of at least 30 concussions, 7 of which were accompanied by a loss of consciousness. Case 1 suffered from memory problems for several years and his family noticed an irritable mood and behavioural outbursts. He also reported muscle weakness. He was able to walk a few steps, but was mostly reliant on a wheelchair. Physical examination confirmed a motor neuron-predominant weakness without prominent upper motor signs. The mother of case 1 was diagnosed with amyotrophic lateral sclerosis (ALS) in her 80s. During his footballing career, case 1 used the anabolic steroid methandrostenolone (Dianabol).
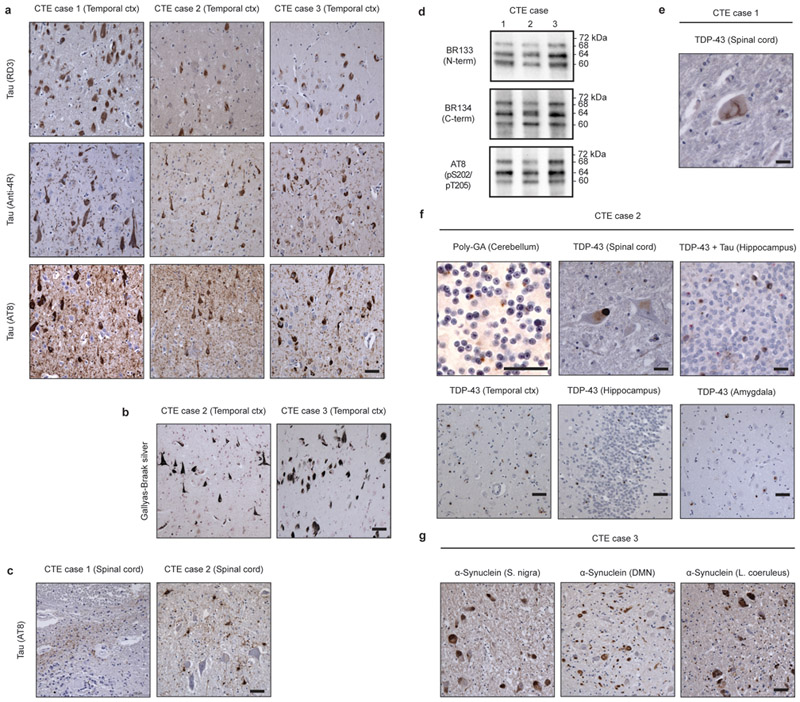
Neuropathologically, all three cases had stage 4 CTE5, with abundant silver-positive tau inclusions in brain (Figure 1a-c, Extended Data Figure 1a,b). By immunoblotting of the sarkosyl-insoluble fraction of the temporal cortex, a pattern consistent with the presence of all six brain tau isoforms was observed (Extended Data Figure 1d)16-18. Case 1 also had a small number of AT8-positive inclusions in spinal cord, mostly around blood vessels (Extended Data Figure 1c). TAR DNA-binding protein of 43 kDa (TDP-43) inclusions were present in spinal cord (Extended Data Figure 1e). TDP-43 inclusions and ALS are increased in individuals with CTE41,42. As described before5,16,37-39, case 2 had abundant tau and TDP-43 inclusions in both brain and spinal cord (Extended Data Figure 1a,c,f). The inclusions were present in separate cells (Extended Data Figure 1f, top right-hand panel). The TDP-43 pathology in brain was type B43. Dipeptide repeat inclusions (poly-GA) were present in cerebellum (Extended Data Figure 1f), prompting the sequencing of C9orf72. A heterozygous hexanucleotide GGGGCC repeat expansion mutation in intron 1 of C9orf72 was detected (more than 145 repeats). Cases 1 and 3 had wild-type numbers of hexanucleotide repeats in both alleles. As mentioned before37, case 2 had a sibling with ALS. We conclude that case 2 suffered from inherited frontotemporal lobar degeneration (FTLD)/ALS, in addition to CTE. Case 3 had abundant tau inclusions in brain, as reported before16,40 (Extended Data Figure 1a). Abundant α-synuclein inclusions were also present in substantia nigra, dorsal motor nucleus of the vagus nerve, locus coeruleus and several other brain regions, confirming a previous study40 (Extended Data Figure 1g). This individual therefore had CTE and Parkinson’s disease. Clinical and neuropathological comorbidities are common in CTE44. The spinal cord of case 3 was not available, but there was no reported clinical or family history of ALS. By immunohistochemistry, abundant Aβ plaques were not observed in any of the three cases.
No known mutations in over 50 genes reported to cause Alzheimer’s disease, Parkinson’s disease, many cases of ALS or frontotemporal dementia were detected in the three cases by next-generation sequencing. The APOE genotypes were: Case 1 (ε2/ε3); case 2 (ε3/ε4); case 3 (ε3/ε3). Case 1 was homozygous, and cases 2 and 3 heterozygous for the TMEM106B variant, rs3173615 (c.554c>g, p.T185S), which has been reported to alter the neuropathology of CTE45. Case 1 was heterozygous and case 2 homozygous for the T allele at the RS5848 locus in the 3’-untranslated region of GRN. A C>T substitution occurs more frequently in cases of FTLD-TDP than in controls46.
Extraction of tau filaments
Sarkosyl-insoluble material was extracted from fresh-frozen temporal cortex, as described17. Approximately 6 g tissue was used for cryo-EM and 0.6 g for immuno-EM. The pelleted sarkosyl-insoluble material was resuspended in 10 mM Tris–HCl pH 7.4, 800 mM NaCl, 5 mM EDTA, and 1 mM EGTA, with a final concentration of 10% (w/v) sucrose at 750 μl/g, followed by centrifugation at 20,100g for 30 min at 4 °C. The resulting supernatants were centrifuged at 100,000g for 1 h at 4 °C. The pellets were resuspended in 20 mM Tris–HCl pH 7.4 containing 100 mM NaCl at 250 μl/g and centrifuged at 100,000g for 30 min at 4 °C. The final pellets were resuspended in buffer at 15 μl/g for cryo-EM and 150 μl/g for immuno-EM.
Electron cryo-microscopy
Extracted tau filaments were applied to glow-discharged holey carbon grids (Quantifoil Au R1.2/1.3, 300 mesh) and plunge-frozen in liquid ethane using an FEI Vitrobot Mark IV. Images were acquired on a Gatan K2-Summit detector in counting mode using an FEI Titan Krios at 300 kV. A GIF-quantum energy filter (Gatan) was used with a slit width of 20 eV to remove inelastically scattered electrons. Further details are given in Extended Data Table 1.
Helical reconstruction
Movie frames were corrected for gain reference, motion-corrected, and dose-weighted using MOTIONCOR247. Aligned, non-dose-weighted micrographs were used to estimate the contrast transfer function (CTF) in Gctf48. All subsequent image-processing steps were performed using helical reconstruction methods in RELION 3.020,49. Filaments were picked manually; CTE Type I tau filaments and PHF-like tau filaments were subsequently separated by reference-free 2D classification of segments comprising an entire helical crossover (using box sizes of 800 pixels and an inter-box distance of 14 Å). CTE Type I tau filament and PHF-like tau filament segments were re-extracted using box sizes of 270 pixels and an inter-box distance of 14 Å. Reference-free 2D classification was performed and segments contributing to suboptimal 2D class averages discarded. Initial 3D models were constructed de novo from 2D class averages from the case 1 dataset of segments comprising entire helical crossovers, and low-pass filtered to 40 Å.
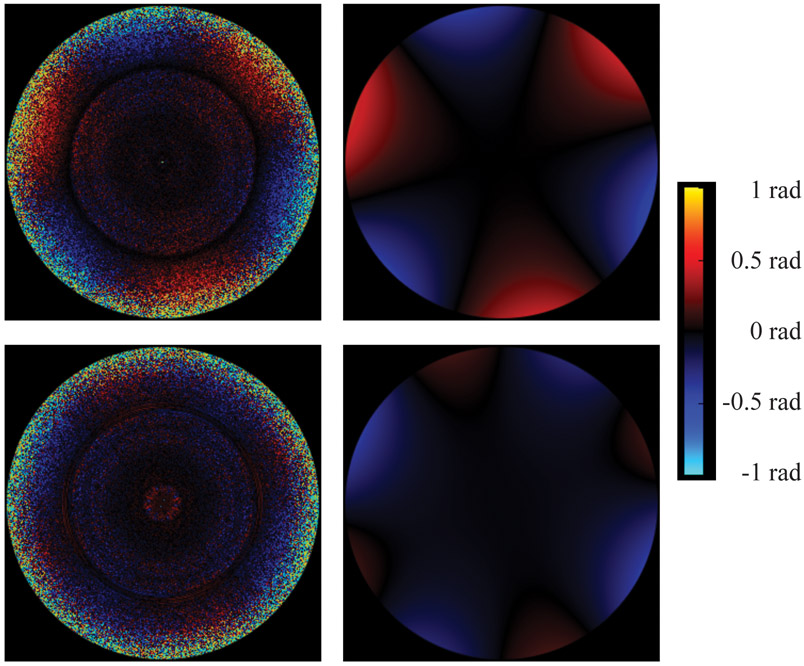
For CTE type I tau filaments from case 1, 3D auto-refinement with optimisation of the helical twist was performed with a value of 10% for the helical z percentage parameter, before correcting for per-particle beam-induced motion and defoci using Bayesian polishing and CTF refinement, respectively. We then performed 3D classification with local optimisation of helical twist and rise, to remove segments contributing to suboptimal 3D class averages, and further 3D auto-refinement. Following attempted beam-tilt estimation, instead of the axial coma that would be produced by a tilted beam, we observed strong 3-fold astigmatism in the per-Fourier-pixel average phase-error plot (Extended Data Figure 8, upper panels). Transmission electron microscopes often exhibit optical aberrations, i.e. unequal phase delays between the waves corresponding to different image frequencies. Those aberrations can always be separated into a symmetrical and an anti-symmetrical component: the symmetrical component gives rise to the CTF, while the anti-symmetrical component induces phase shifts in the complex amplitudes of the observed image. The 3-fold astigmatism that we measured is such an anti-symmetrical aberration. In a development version of RELION, we modelled this using the first 6 anti-symmetrical Zernike polynomials (radial orders 1 and 2), assuming the effect to be constant across the entire data set. The coefficients of the Zernike polynomials were estimated so as to minimise the sum of squared per-pixel differences over all pixels and particles between the predicted and the observed particle images. Expressing the aberration in this way allowed us to demodulate the phases of the particle images and thus to correct for the anti-symmetrical aberration, yielding an improvement in resolution from 2.7 to 2.5 Å. In addition to the anti-symmetrical aberration, we developed a related method to estimate the symmetrical aberrations. We extended the argument of the CTF sine function in RELION by an offset term that was modelled using the first 9 symmetrical Zernike polynomials (radial orders 0, 2 and 4). The coefficients were again estimated so as to minimise the sum of squared differences. Visualisation of the per-Fourier-pixel offset term revealed the presence of 4-fold astigmatism, which cannot be expressed by the traditional CTF model and which deforms the rings of the CTF from the usually elliptical shape to be slightly square-shaped (Extended Data Figure 8, lower panels). Correcting for 4-fold astigmatism, combined with a larger box size of 400 pixels, led to a resolution of 2.3 Å. Details of the higher-order aberration correction in RELION will be published elsewhere.
For CTE type I tau filaments from cases 2 and 3, 3D classification with local optimisation of helical twist and rise was performed to remove segments contributing to suboptimal 3D class averages, followed by 3D auto-refinement with optimisation of the helical twist with a value of 10% for the helical z percentage parameter. For the PHF-like tau filaments from case 1, CTE type II tau filaments were separated from PHFs by 3D classification with local optimisation of helical twist and rise. For case 2, 3D classification of the PHF-like tau filaments only identified CTE type II tau filaments. 3D auto-refinement with optimisation of the helical twist with a value of 10% for the helical z percentage parameter was then performed on the separated filaments. PHF-like tau filaments from case 3 did not yield reliable 3D reconstructions.
The final reconstructions were sharpened using the standard post-processing procedures in RELION and helical symmetry was imposed using the RELION helix toolbox20. Finally, overall resolution estimates were calculated from Fourier shell correlations at 0.143 between two independently refined half-maps, using phase randomization to correct for the convolution effects of a generous, soft-edged solvent mask50. Local resolution estimates were obtained using the same-phase randomization procedure, but with a soft spherical mask that was moved over the entire map. For further details, see Extended Data Table 1.
Model building and refinement
The two cross-β packing stacks and their linking regions were taken from the Alzheimer’s disease PHF model (PDB accession number 6HRE). The β-helix and its preceding and proceeding regions were built de novo into the 2.3 Å resolution reconstruction of CTE type I tau filaments from case 1 using COOT51. Water molecules and generic fused ring compounds (PubChem CID 1107) were added in COOT. The new model was then refined against the CTE type I and type II filament reconstructions from case 1 using targeted real-space refinement in COOT. The models were subsequently translated to give stacks of three consecutive monomers to preserve nearest-neighbour interactions for the middle chains in subsequent Fourier space refinements in REFMAC52. Local symmetry restraints were imposed to keep all β-strand rungs identical. Side-chain clashes were detected using MOLPROBITY53 and corrected by iterative cycles of real-space refinements in COOT and Fourier space refinements in REFMAC. Separate model refinements were performed against single half-maps, and the resulting models compared with the other half-maps to confirm the absence of overfitting. The final models were stable in refinements without additional restraints. Further details are given in Extended Data Table 1.
Immunolabelling, histology and silver staining
Immunogold negative-stain EM was carried out as described13. Primary antibodies were BR13613 (raised against tau residues 244–257), Anti-4R54 (raised against tau residues 275–291, with D279; Cosmo Bio CAC-TIP-4RT-P01), BR13555 (raised against tau residues 323–335), and TauC456 (raised against tau residues 354–369), all used at 1:50. Images were acquired at 11,000 × , with a defocus value of −1.4 μm with a Gatan Orius SC200B CCD detector using a Tecnai G2 Spirit at 120 kV. To distinguish non-specific background from specific labelling, we only considered filaments with more than six gold beads to be positively labelled.
Immunoblotting was carried out as described13. Samples were resolved on 4-20% Tris-glycine gels (Novex), and the primary antibodies were diluted in PBS plus 0.1% Tween 20 and 1% bovine serum albumin (BSA). Primary antibodies were BR13355, used at 1:4,000, BR13613, used at 1:1,000, Anti-4R54 (Cosmo Bio CAC-TIP-4RT-P01), used at 1:2,000, BR13555, used at 1:4,000, and TauC456, used at 1:2,000, BR13455, used at 1:4,000, and AT8 (specific for pS202/pT205 tau; Thermo Fisher Scientific MN2010), used at 1:1,000.
Histology and immunohistochemistry were carried out as described57. Brain sections were 8-μm thick and were counterstained with haematoxylin. Primary antibodies were AT8 (Thermo Fisher Scientific MN1020), used at 1:300, AT100 (specific for pT212/pS214/pT217 tau, Thermo Fisher Scientific MN1060), used at 1:400, Anti-4R54 (Cosmo Bio CAC-TIP-4RT-P01), used at 1:400, RD3 (Merck 05-803), used at 1:3,000, anti-phospho-TDP-43 (specific for pS409/pS410 TDP-43; Cosmo Bio CAC-TIP-PTD-M01), used at 1:1,000, SYN58 (specific for α-synuclein residues 119-137), used at 1:300, and anti-poly-GA (Cosmo Bio CAC-TIP-C9-P01), used at 1:300. Sections were silver-impregnated using the method of Gallyas-Braak to visualize inclusions59,60.
Whole-exome sequencing
Target enrichment made use of the SureSelectXT human all exon library (V6, 58 Mb, Agilent) and high-throughput sequencing was carried out using a HiSeq4000 (2 × 75 bp paired-end configuration, Illumina). Bioinformatics analyses were performed as described61.
Whole-genome sequencing
Sequencing libraries were prepared using 100 ng high-quality genomic DNA from cerebellum using the Illumina Nextera DNA Flex Library Prep Kit, and assessed using a Qubit and Agilent Bioanalyzer. High-throughput sequencing was carried out on multiple libraries pooled in equal molarity using a NovaSeq6000 (150 bp paired-end configuration, Illumina) and aligned to the human reference genome GRCh38 using BWA and Bwakit (v0.7.15). ExpansionHunter was applied to estimate expansion numbers of short tandem repeats (v2.5.5) and germline variants were identified with Strelka2 (v2.9.9), with default parameters for whole genome sequence data. The variants were annotated for their effects with ANNOVAR62.
C9orf72 hexanucleotide repeat expansion
Repeat-primed polymerase chain reaction was used to determine the number of GGGGCC hexanucleotide repeats in the first intron of C9orf72 (Asuragen AmplideX PCR/CE C9orf72 kit). Internal standards were analyzed along with samples to evaluate assay performance. Up to 25 repeats were determined with an accuracy of +/− 1 repeat and repeat numbers greater than 25 were determined with an accuracy of +/− 3 repeats.
Extended Data
Extended Data Figure 1: Further characterization of tau pathologies in CTE cases 1-3. Coexisting pathologies.
a, Staining of tau inclusions in the temporal cortex of CTE cases 1, 2 and 3 using antibodies RD3 (3R tau), Anti-4R (4R tau) and AT8 (pS202/pT205 tau). Scale bar, 50 μm. b, Gallyas-Braak silver staining of tau inclusions in the temporal cortex of CTE cases 2 and 3. Scale bar, 50 μm. c, Staining of tau inclusions in the spinal cord of CTE cases 1 and 2 using antibody AT8. Scale bar, 50 μm. d, Immunoblots of sarkosyl-insoluble tau from the temporal cortices of CTE cases 1, 2 and 3 using antibodies BR133, BR134 and AT8. e, Staining of a TDP-43 inclusion in the spinal cord of CTE case 1. Scale bar, 25 μm. f, Staining of CTE case 2 for poly-GA inclusions in the cerebellum and TDP-43 inclusions in the spinal cord, temporal cortex, hippocampus and amygdala. In the top right-hand panel, double-labelling of tau inclusions (AT8; brown) and TDP-43 inclusions (red) is shown. Scale bars, 25 μm (upper panels) and 50 μm (lower panels). g, Staining of CTE case 3 for α-synuclein inclusions in the substantia nigra, dorsal motor nucleus (DMN) of the vagus nerve and locus coeruleus. Scale bar, 50 μm. Nuclei were counterstained blue in all images.
Extended Data Figure 2: Immunolabelling of tau filaments extracted from the brains of CTE cases 1-3.
a,b, Immunoblots and immunolabelling of tau filaments extracted from the temporal cortices of CTE cases 1, 2 and 3. a, Immunoblots of sarkosyl-insoluble tau using antibodies BR136, Anti-4R, BR135 and TauC4. b, Representative immuno-EM images of tau filaments labelled with antibodies BR136 and Anti-4R. Unlike BR136 and Anti-4R, antibodies BR135 and TauC4 did not label the filaments, indicating that their epitopes lie within the ordered filament cores. Scale bar, 200 nm.
Extended Data Figure 3: Cryo-EM two-dimensional and three-dimensional classification.
a, 2D-class averages spanning an entire helical crossover of type I and type II tau filaments from CTE cases 1-3. b, Cryo-EM structure of PHFs from the temporal cortex of CTE case 1.
Extended Data Figure 4: Cryo-EM map and model comparisons.
a,b, Fourier shell correlation curves between two independently refined half-maps (bold black line); between the final cryo-EM reconstruction and refined atomic model (bold red line); between the first half-map and the atomic model refined against the first half map (brown line); and between the second half map and the atomic model refined against the first half map (blue dashed line) for CTE type I (a) and type II (b) filaments. c,d, Local resolution estimates for the CTE type I (c) and type II (d) filament reconstructions. e,f, Views normal to the helical axis of the CTE type I (e) and type II (f) filament reconstructions.
Extended Data Figure 5: Cryo-EM map of type I tau filaments from CTE case 1.
a-c, Close-up view of the cryo-EM map with the atomic model overlaid showing densities for oxygens atoms of the peptide groups (a) and ordered solvent molecules (b). c, Side-chain conformations for the alternating positively and negatively charged solvent-exposed side-chains of residues 336-343 in successive rungs.
Extended Data Figure 6: CTE tau filament fold.
a, Schematic view of the CTE tau filament fold. b, Rendered view of the secondary structure elements in the CTE fold, depicted as three successive rungs. c, As in b, but in a view perpendicular to the helical axis, revealing the changes in height within a single molecule.
Extended Data Figure 7: Comparison of CTE type I and type II tau filament folds and protofilament interfaces.
a, The type I protofilament structure is shown in purple and the type II protofilament structure in gold. b, As in a, but showing backbone atoms only. c,d, Packing between residues 322CGSLGNIH329 of the two protofilaments in type I filaments (c) and between residues 331KPGGGQVE338 of the two protofilaments in type II filaments (d).
Extended Data Figure 8: Measurement and modelling of optical aberrations.
Three-fold astigmatism (antisymmetrical; upper panels) and 4-fold astigmatism (symmetrical; lower panels) measured in per-Fourier-pixel average phase-error plots (left images) and represented by our parametric model (right images) for CTE type I tau filaments from case 1. The plot shows image frequencies up to 2.9 Å. The outlier ring at 4.7 Å corresponds to the dominant frequency given by a double-repetition of the helix. This ring has been excluded from the parametric fit.
Extended Data Table 1:
Cryo-EM data collection, refinement and validation statistics.
| Case 1 (EMD-0527, EMD-0528) |
Case 2 | Case 3 | |
|---|---|---|---|
| Data collection and processing | |||
| Magnification | x130,000 | x105,000 | X130,000 |
| Voltage (kV) | 300 | 300 | 300 |
| Electron exposure (e–/Å2) | 55.5 | 55 | 57.5 |
| Defocus range (μm) | −1.7 to −2.8 | −1.7 to −2.8 | −1.7 to −2.8 |
| Pixel size (Å) | 1.055 | 1.15 | 1.05 |
| Symmetry imposed | 21 helical | 21 helical | 21 helical |
| Initial no. particle images | 203,154 | 148,485 | 31,889 |
| Final no. particle images | Type I: 113,178 | Type I: 14,147 | Type I: 14,959 |
| Type II: 7,621 | Type II: 3,080 | ||
| PHF: 3,199 | |||
| Map resolution (Å; FSC=0.143) | Type I: 2.3 | Type I: 3.7 | Type I: 3.45 |
| Type II: 3.4 | Type II: 7.6 | ||
| PHF: 7.5 | |||
| Helical rise (Å) | 2.37 | 2.37 | 2.37 |
| Helical twist (°) | 179.4 | 179.4 | 179.4 |
| |
|||
| Case 1 Type I (6NWP) |
Case 1 Type II (6NWQ) |
||
| Refinement | |||
| Initial model used (PDB code) | 6HRE | 6HRE | |
| Model resolution (Å; FSC=0.5) | 2.32 | 3.45 | |
| Map sharpening B factor (Å2) | −50 | −50 | |
| Model composition | |||
| Non-hydrogen atoms | 3738 | 3738 | |
| Protein residues | 480 | 480 | |
| Protein B factor (Å2) | 51.7 | 115 | |
| R.m.s. deviations | |||
| Bond lengths (Å) | 0.01 | 0.01 | |
| Bond angles (°) | 1.27 | 0.81 | |
| Validation | |||
| MolProbity score | 1.53 | 1.75 | |
| Clashscore | 6.74 | 3.27 | |
| Poor rotamers (%) | 1.39 | 1.52 | |
| Ramachandran plot | |||
| Favored (%) | 94.44 | 90.91 | |
| Allowed (%) | 100 | 100 | |
| Disallowed (%) | 0 | 0 | |
Supplementary Material
ACKNOWLEDGEMENTS
We thank the patients’ families for donating brain tissue; J. Gonzalez, P. Dooley, F. Epperson, R. M. Richardson, M. Danley and U. Kuederli for brain collection and technical support with neuropathology; M. Hasegawa for antibody TauC4; S. Chen, G. Cannone and J. Brown, C. Savva, Z. Yang, and C. Wigger for support with electron microscopy; T. Nakane for help with RELION; G. Murshudov for help with REFMAC; T. Darling and J. Grimmett for help with high-performace computing.
M.G. is an Honorary Professor in the Department of Clinical Neurosciences of the University of Cambridge. This work was supported by the UK Medical Research Council (MC_UP_A025_1013 to S.H.W.S. and MC_U105184291 to M.G.), the European Union (Joint Programme-Neurodegeneration Research REfrAME to B.F. and M.G. and the EU/EFPIA/Innovative Medicines Initiative [2] Joint Undertaking IMPRiND, project 116060, to M.G.), the US National Institutes of Health (P30AG010133 and U01NS110437), the Department of Pathology and Laboratory Medicine, Indiana University School of Medicine to B.G. and R.V., and the Department of Pathology and Laboratory Medicine, University of Kansas School of Medicine to KN. Some of the tissue specimens were obtained with support of the Massachusetts Alzheimer’s Disease Research Center (P50 AG005134).
We acknowledge DIAMOND for access to and support of the cryo-EM facilities at the UK electron Bio-Imaging Centre (eBIC), proposal EM17434, funded by the Wellcome Trust, the MRC and the BBSRC, for acquisition of the case 1 cryo-EM data set. We acknowledge the Midlands Regional Cryo-EM facility at the Leicester Institute of Structural and Chemical Biology (LISCB), major funder MRC, for acquisition of the case 3 cryo-EM data set. We acknowledge the Center for Medical Genomics of Indiana University School of Medicine for next generation sequencing.
Footnotes
Ethical review board and informed consent
The studies carried out at Indiana University and the University of Kansas were approved through the institutional review process at each University’s. Informed consent was obtained from the patients’ next of kin.
Reporting summary
Further information on experimental design is available in the Nature Research Reporting Summary linked to this paper.
Data availability
Cryo-EM maps for case 1 have been deposited in the Electron Microscopy Data Bank (EMDB) under accession numbers EMD-0527 for CTE type I tau filament and EMD-0528 for CTE type II tau filament. Refined atomic models for case 1 have been deposited in the Protein Data Bank (PDB) under accession numbers 6NWP for CTE type I tau filament and 6NWQ for CTE type II tau filament. Whole-exome and whole-genome sequencing, and C9orf72 hexanucleotide repeat expansion results, have been deposited in the National Institute on Aging Alzheimer’s Disease Data Storage Site (NIAGADS) under accession number NG00077.
The authors declare no competing interests. Readers are welcome to comments on the online version of the paper.
REFERENCES
- 1.Martland HS Punch drunk. J. Am. Med. Assoc. 19, 1103–1107 (1928). [Google Scholar]
- 2.Millspaugh JA Dementia pugilistica. US Nav Med. Bull. 35, 297–303 (1937). [Google Scholar]
- 3.Corsellis JA, Bruton CJ & Freeman-Browne D The aftermath of boxing. Psychol. Med. 3, 270–303 (1973). [DOI] [PubMed] [Google Scholar]
- 4.Omalu BI et al. Chronic traumatic encephalopathy in a National Football League player. Neurosurgery 57, 128–134 (2005). [DOI] [PubMed] [Google Scholar]
- 5.McKee AC, Daneshvar DH, Alvarez VE & Stein TD The neuropathology of sport. Acta Neuropathol. 127, 29–51 (2014). [DOI] [PMC free article] [PubMed] [Google Scholar]
- 6.Omalu B et al. Chronic traumatic encephalopathy in an Iraqi war veteran with posttraumatic stress disorder who committed suicide. Neurosurg. Focus 31, E3 (2011). [DOI] [PubMed] [Google Scholar]
- 7.Hof PR, Knabe R, Bovier P & Bouras C Neuropathological observations in a case of autism presenting with self-injury behavior. Acta Neuropathol. 82, 321–326 (1991). [DOI] [PubMed] [Google Scholar]
- 8.Geddes JF, Vowles GH, Nicoll JA & Revesz T Neuronal cytoskeletal changes are an early consequence of repetitive head injury. Acta Neuropathol. 98, 171–178 (1999). [DOI] [PubMed] [Google Scholar]
- 9.McKee AC et al. The first NINDS/NIBIB consensus meeting to define neuropathological criteria for the diagnosis of chronic traumatic encephalopathy. Acta Neuropathol. 131, 75–86 (2016). [DOI] [PMC free article] [PubMed] [Google Scholar]
- 10.Hof PR et al. Differential distribution of neurofibrillary tangles in the cerebral cortex of dementia pugilistica and Alzheimer’s disease cases. Acta Neuropathol. 85, 23–30 (1992). [DOI] [PubMed] [Google Scholar]
- 11.Tokuda T, Ikeda S, Yanagisawa N, Ihara Y & Glenner GG Re-examination of ex-boxers’ brains using immunohistochemistry with antibodies to amyloid beta-protein and tau protein. Acta Neuropathol. 82, 280–285 (1991). [DOI] [PubMed] [Google Scholar]
- 12.Fitzpatrick AWP et al. Cryo-EM structures of tau filaments from Alzheimer’s disease. Nature 547, 185–190 (2017). [DOI] [PMC free article] [PubMed] [Google Scholar]
- 13.Falcon B et al. Structures of filaments from Pick’s disease reveal a novel tau protein fold. Nature 561, 137–140 (2018). [DOI] [PMC free article] [PubMed] [Google Scholar]
- 14.Falcon B et al. Tau filaments from multiple cases of sporadic and inherited Alzheimer’s disease adopt a common fold. Acta Neuropathol. 136, 699–708 (2018). [DOI] [PMC free article] [PubMed] [Google Scholar]
- 15.Zhang W et al. Heparin-induced tau filaments are polymorphic and differ from those in Alzheimer’s and Pick’s diseases. eLife 8:e43584 (2019). [DOI] [PMC free article] [PubMed] [Google Scholar]
- 16.Schmidt ML, Zhukareva V, Newell KL, Lee VM & Trojanowski JQ Tau isoform profile and phosphorylation state in dementia pugilistica recapitulate Alzheimer’s disease. Acta Neuropathol. 101, 518–524 (2001). [DOI] [PubMed] [Google Scholar]
- 17.Goedert M, Spillantini MG, Cairns NJ & Crowther RA Tau proteins of Alzheimer paired helical filaments: abnormal phosphorylation of all six brain isoforms. Neuron 8, 159–168 (1992). [DOI] [PubMed] [Google Scholar]
- 18.Mulot SF, Hughes K, Woodgett JR, Anderton BH & Hanger DP PHF-tau from Alzheimer’s brain comprises four species on SDS-PAGE which can be mimicked by in vitro phosphorylation of human brain tau by glycogen synthase kinase-3 beta. FEBS Lett. 349, 359–364 (1994). [DOI] [PubMed] [Google Scholar]
- 19.Wischik CM et al. Structural characterization of the core of the paired helical filament of Alzheimer disease. Proc. Natl. Acad. Sci. USA 85, 4884–4888 (1988). [DOI] [PMC free article] [PubMed] [Google Scholar]
- 20.He S & Scheres SHW Helical reconstruction in RELION. J. Struct. Biol. 198, 163–176 (2017). [DOI] [PMC free article] [PubMed] [Google Scholar]
- 21.Carlomagno Y et al. An acetylation-phosphorylation switch that regulates tau aggregation propensity and function. J. Biol. Chem. 292, 15277–15286 (2017). [DOI] [PMC free article] [PubMed] [Google Scholar]
- 22.Goedert M et al. Assembly of microtubule-associated protein tau into Alzheimer-like filaments induced by sulphated glycosaminoglycans. Nature 383, 550–553 (1996). [DOI] [PubMed] [Google Scholar]
- 23.Pérez M, Valpuesta JM, Medina M, Montejo de Garcini E & Avila J Polymerization of tau into filaments in the presence of heparin: the minimal sequence required for tau-tau interaction. J. Neurochem. 67, 1183–1190 (1996). [DOI] [PubMed] [Google Scholar]
- 24.Kampers T, Friedhoff P, Biernat J, Mandelkow EM & Mandelkow E RNA stimulates aggregation of microtubule-associated protein tau into Alzheimer-like paired helical filaments. FEBS Lett. 399, 344–349 (1996). [DOI] [PubMed] [Google Scholar]
- 25.Wilson DM & Binder LI Free fatty acids stimulate the polymerization of tau and amyloid beta peptides. In vitro evidence for a common effector of pathogenesis in Alzheimer’s disease. Am. J. Pathol. 150, 2181–2195 (1997). [PMC free article] [PubMed] [Google Scholar]
- 26.Woerman AL et al. Tau prions from Alzheimer’s disease and chronic traumatic encephalopathy patients propagate in cultured cells. Proc. Natl. Acad. Sci. USA 113, E8187–E8196 (2016). [DOI] [PMC free article] [PubMed] [Google Scholar]
- 27.Love S, Bridges LR & Case CP Neurofibrillary tangles in Niemann-Pick disease type C. Brain 118 119–129 (1995). [DOI] [PubMed] [Google Scholar]
- 28.Suzuki K et al. Neurofibrillary tangles in Niemann-Pick disease type C. Acta Neuropathol. 89, 227–238 (1995). [DOI] [PubMed] [Google Scholar]
- 29.Li B et al. Cryo-EM of full-length alpha-synuclein reveals fibril polymorphs with a common structural kernel. Nat. Commun 9, 3609 (2018). [DOI] [PMC free article] [PubMed] [Google Scholar]
- 30.Iadanza MG et al. The structure of a beta2-microglobulin fibril suggests a molecular basis for its amyloid polymorphism. Nat. Commun 9, 4517 (2018). [DOI] [PMC free article] [PubMed] [Google Scholar]
- 31.Li Y et al. Amyloid fibril structure of alpha-synuclein determined by cryo-electron microscopy. Cell Res. 28, 897–903 (2018). [DOI] [PMC free article] [PubMed] [Google Scholar]
- 32.Guerrero-Ferreira R et al. Cryo-EM structure of alpha-synuclein fibrils. eLife 7, e36402 (2018). [DOI] [PMC free article] [PubMed] [Google Scholar]
- 33.Yang H & Hu HY Sequestration of cellular interacting partners by protein aggregates: implication in a loss-of-function pathology. FEBS J. 283, 3705–3717 (2016). [DOI] [PubMed] [Google Scholar]
- 34.Donat CK, Scott G, Gentleman SM & Sastre M Microglial activation in traumatic brain injury. Front. Aging Neurosci. 9, 208 (2017). [DOI] [PMC free article] [PubMed] [Google Scholar]
- 35.Goldfinger MH et al. The aftermath of boxing revisited: identifying chronic traumatic encephalopathy pathology in the original Corsellis boxer series. Acta Neuropathol. 136, 973–974 (2018). [DOI] [PMC free article] [PubMed] [Google Scholar]
- 36.Pujols J et al. Small molecule inhibits alpha-synuclein aggregation, disrupts amyloid fibrils, and prevents degeneration of dopaminergic neurons. Proc. Natl. Acad. Sci. USA 115, 10481–10486 (2018). [DOI] [PMC free article] [PubMed] [Google Scholar]
- 37.Drachman DA & Newell KL Case records of the Massachusetts General Hospital. Case 12-1999. N. Engl. J. Med. 340, 1269–1277 (1999). [DOI] [PubMed] [Google Scholar]
- 38.McKee AC et al. Chronic traumatic encephalopathy in athletes: progressive tauopathy after repetitive head injury. J. Neuropathol. Exp. Neurol. 68, 709–735 (2009). [DOI] [PMC free article] [PubMed] [Google Scholar]
- 39.McKee AC et al. TDP-43 proteinopathy and motor neuron disease in chronic traumatic encephalopathy. J. Neuropathol. Exp. Neurol. 69, 918–929 (2010). [DOI] [PMC free article] [PubMed] [Google Scholar]
- 40.Kokjohn TA et al. Neurochemical profile of dementia pugilistica. J. Neurotr. 30, 981–997 (2013). [DOI] [PMC free article] [PubMed] [Google Scholar]
- 41.King A et al. Abnormal TDP-43 expression is identified in the neocortex in cases of dementia pugilistica, but is mainly confined to the limbic system when identified in high and moderate stages of Alzheimer’s disease. Neuropathology 30, 408–419 (2010). [DOI] [PubMed] [Google Scholar]
- 42.Schmidt S, Kwee LC, Allen KD & Oddone EZ Association of ALS with head injury, cigarette smoking and APOE genotypes. J. Neurol. Sci. 291, 22–29 (2010). [DOI] [PMC free article] [PubMed] [Google Scholar]
- 43.Mackenzie IR et al. A harmonized classification system for FTLD-TDP pathology. Acta Neuropathol. 122, 111–113 (2011). [DOI] [PMC free article] [PubMed] [Google Scholar]
- 44.McKee AC et al. The spectrum of disease in chronic traumatic encephalopathy. Brain 136, 43–64 (2013). [DOI] [PMC free article] [PubMed] [Google Scholar]
- 45.Cherry JD et al. Variation in TMEM106B in chronic traumatic encephalopathy. Acta Neuropathol. Commun. 6, 115 (2018). [DOI] [PMC free article] [PubMed] [Google Scholar]
- 46.Hsiung GY, Fok A, Feldman HH, Rademakers R & Mackenzie IR rs5848 polymorphism and serum progranulin level. J. Neurol. Sci. 300, 28–32 (2011). [DOI] [PMC free article] [PubMed] [Google Scholar]
- 47.Zheng SQ et al. MotionCor2: anisotropic correction of beam-induced motion for improved cryo-electron microscopy. Nat. Meth. 14, 331–332 (2017). [DOI] [PMC free article] [PubMed] [Google Scholar]
- 48.Zhang K Gctf: Real-time CTF determination and correction. J. Struct. Biol. 193, 1–12 (2016). [DOI] [PMC free article] [PubMed] [Google Scholar]
- 49.Zivanov J et al. New tools for automated high-resolution cryo-EM structure determination in RELION-3. eLife 7, e42166 (2018). [DOI] [PMC free article] [PubMed] [Google Scholar]
- 50.Chen S et al. High-resolution noise substitution to measure overfitting and validate resolution in 3D structure determination by single particle electron cryomicroscopy. Ultramicroscopy 135, 24–35 (2013). [DOI] [PMC free article] [PubMed] [Google Scholar]
- 51.Emsley P, Lohkamp B, Scott WG & Cowtan K Features and development of Coot. Acta Crystallogr. D 66, 486–501 (2010). [DOI] [PMC free article] [PubMed] [Google Scholar]
- 52.Murshudov GN, Vagin AA & Dodson EJ Refinement of macromolecular structures by the maximum-likelihood method. Acta Crystallogr. D 53, 240–255 (1997). [DOI] [PubMed] [Google Scholar]
- 53.Chen VB et al. MolProbity: all-atom structure validation for macromolecular crystallography. Acta Crystallogr. D 66, 12–21 (2010). [DOI] [PMC free article] [PubMed] [Google Scholar]
- 54.Dan A et al. Extensive deamidation at asparagine residue 279 accounts for weak immunoreactivity of tau with RD4 antibody in Alzheimer’s disease brain. Acta Neuropathol. Commun. 1, 54 (2013). [DOI] [PMC free article] [PubMed] [Google Scholar]
- 55.Goedert M, Spillantini MG, Jakes R, Rutherford D & Crowther RA Multiple isoforms of human microtubule-associated protein tau: sequences and localization in neurofibrillary tangles of Alzheimer’s disease. Neuron 3, 519–526 (1989). [DOI] [PubMed] [Google Scholar]
- 56.Taniguchi-Watanabe S et al. Biochemical classification of tauopathies by immunoblot, protein sequence and mass spectrometric analyses of sarkosyl-insoluble and trypsin-resistant tau. Acta Neuropathol. 131, 267–280 (2016). [DOI] [PMC free article] [PubMed] [Google Scholar]
- 57.Spina S et al. The tauopathy associated with mutation +3 in intron 10 of Tau: characterization of the MSTD family. Brain 131, 72–89 (2008). [DOI] [PMC free article] [PubMed] [Google Scholar]
- 58.Yamaguchi K et al. Abundant neuritic inclusions and microvacuolar changes in a case of diffuse Lewy body disease with the A53T mutation in the alpha-synuclein gene. Acta Neuropathol. 110, 298–305 (2005). [DOI] [PubMed] [Google Scholar]
- 59.Gallyas F Silver staining of Alzheimer’s neurofibrillary changes by means of physical development. Acta Morphol. Acad. Sci. Hung. 19, 1–8 (1971). [PubMed] [Google Scholar]
- 60.Braak H, Braak E, Ohm T & Bohl J Silver impregnation of Alzheimer’s neurofibrillary changes counterstained for basophilic material and lipofuscin pigment. Stain Technol. 63, 197–200 (1988). [DOI] [PubMed] [Google Scholar]
- 61.Farlow JL et al. Whole-exome sequencing in familial Parkinson disease. JAMA Neurol. 73, 68–75 (2016). [DOI] [PMC free article] [PubMed] [Google Scholar]
- 62.Wang K, Li M & Hakonarson H ANNOVAR: functional annotation of genetic variants from high-throughput sequencing data. Nucl. Ac. Res. 38, e164 (2010). [DOI] [PMC free article] [PubMed] [Google Scholar]
Associated Data
This section collects any data citations, data availability statements, or supplementary materials included in this article.


