

Summary
TDP-43 proteinopathy is a pathological hallmark of ALS/FTD where cytoplasmic TDP-43 inclusions are observed within degenerating regions of patient postmortem tissue. The mechanism by which TDP-43 aggregates has remained elusive due to technological limitations which prevent the analysis of specific TDP-43 interactions in live cells. We present an optogenetic approach to reliably induce TDP-43 proteinopathy under spatiotemporal control. We show that the formation of pathologically-relevant inclusions is driven by aberrant interactions between low-complexity domains of TDP-43 that are antagonized by RNA-binding. While stress granules are hypothesized to be a conduit for seeding TDP-43 proteinopathy, we demonstrate pathological inclusions outside these RNA-rich structures. Furthermore, we show that aberrant phase transitions of cytoplasmic TDP-43 are neurotoxic and treatment with oligonucleotides composed of TDP-43 target sequences prevent inclusions and rescue neurotoxicity. Collectively, these studies provide insight into the mechanisms that underlie TDP-43 proteinopathy and present a potential avenue for therapeutic intervention.
Graphical Abstract
Introduction
Amyotrophic Lateral Sclerosis (ALS) and Frontotemporal Dementia (FTD) are fatal neurodegenerative disorders characterized by the progressive loss of motor neurons of the spinal cord and motor cortex or cortical neurons of the frontal and temporal lobes, respectively. No effective treatments currently exist to halt ALS or FTD progression and the cause(s) of these disorders remain unknown. Significant overlap of clinical, genetic, and neuropathological features among patients suggests that ALS and FTD exist on a neurodegenerative disease spectrum (Ling et al., 2013), and a number of familial ALS and/or FTD causing mutations have been identified (Nguyen et al., 2018). Despite this vast genetic heterogeneity, 97% of ALS patients and up to 45% of FTD patients exhibit a common neuropathological feature called TDP-43 proteinopathy. TDP-43 proteinopathy is characterized by the cytoplasmic deposition and nuclear clearance of the transactivation response element DNA-binding protein 43 kDa (TDP-43; TARDBP) (Neumann et al., 2006).
TDP-43 is a ubiquitously-expressed, tightly-regulated, and predominantly nuclear DNA/RNA-binding protein that contains two RNA-Recognition Motifs (RRMs) and a C-terminal glycine-rich, low complexity domain (LCD) (Scotter et al., 2015). TDP-43 preferentially binds UG-rich RNA intronic sequences or 3’UTR stem loop structures and influences a variety of RNA processing events including alternative splicing, RNA trafficking, and RNA stability (Ling et al., 2013). In ALS and FTD, the protein is found in cytoplasmic inclusions that are detergent-insoluble, hyperphosphorylated, p62-positive, and ubiquitinated (Scotter et al., 2015). Cytoplasmic inclusions also contain truncated TDP-43 species resulting from its N-terminal cleavage (Neumann et al., 2007). This neuropathological hallmark correlates well with regions of neurodegeneration in ALS/FTD patient tissue (Baloh, 2011) and is found in postmortem tissue from patients diagnosed with Alzheimer’s Disease (60%) (Youmans and Wolozin, 2012), and Chronic Traumatic Encephalopathy (80%) (McKee et al., 2010). Thus, TDP-43 proteinopathy might serve as a convergence point of pathogenesis despite the diverse upstream mechanisms responsible for disease etiology across several neurodegenerative disorders.
Over 50 ALS/FTD-causing missense mutations have been identified in the TARDBP gene (Harrison and Shorter, 2017). While rare in the total patient population, these mutations occur more frequently in fALS patients (5%) as compared to patients with familial FTD (Ling et al., 2013). The majority of known ALS/FTD-causing TARDBP mutations cluster within the TDP-43 LCD, although others have been identified within the RRMs (Harrison and Shorter, 2017). The location and functional impact of these mutations likely reflects the importance of these regions in disease pathogenesis. LCDs are common in RNA-binding proteins (RBPs) and mediate protein and RNA interactions through a process termed liquid-liquid phase separation (LLPS). LLPS involves the condensation of molecules into liquid-like compartments and is driven by weak, transient interactions between LCD regions and other multivalent protein/nucleic acid interaction domains (Harrison and Shorter, 2017). Following specific protein:protein, protein:RNA and/or RNA:RNA nucleating interactions, this de-mixing process allows for intracellular compartmentalization, as observed with membraneless organelles such as nucleoli, P-bodies, and stress granules (SGs) (Shin and Brangwynne, 2017). Many of these biological condensates contain high local concentrations of LCD-containing proteins, which contribute to the properties of these structures through a combination of specific and non-specific heterotypic protein/nucleic acid interactions (Harrison and Shorter, 2017; Shin and Brangwynne, 2017). Interestingly, ALS-associated mutations in the TDP-43 LCD alter LLPS behavior and enhance aggregation of the protein (Conicella et al., 2016; Johnson et al., 2009; Schmidt and Rohatgi, 2016). Similar observations have been reported of other RBPs implicated in neurodegeneration, where disease-linked LCD mutations or aging of droplets promotes the maturation and fibrillization of initially reversible protein assemblies (Harrison and Shorter, 2017). While the physical processes underlying droplet solidification is unknown, these findings suggest that aberrant phase transitions drive the formation of pathological inclusions of RNA-binding proteins observed in neurodegenerative disease.
The cellular pathway(s) that promote aberrant TDP-43 phase transitions remain unclear, but evidence suggests that altered SG homeostasis contributes to the seeding of pathological inclusions. SGs are membraneless organelles that assemble in the cytoplasm via LLPS during periods of cellular stress and may reversibly inhibit non-essential protein synthesis (Anderson and Kedersha, 2008; Harrison and Shorter, 2017). In addition to mRNA, ribosomal subunits, and translation initiation factors, SGs sequester a number of RBPs mutated in fALS, including TDP-43 (Boeynaems et al., 2016). The nucleation and phase separation of these various proteins and RNAs into liquid-like droplets is required for cellular compartmentalization of SGs and alterations of intermolecular dynamics may promote an irreversible gel-like state or fibrillization of prion-like protein components of these structures. The high local concentration of aggregate-prone proteins, like TDP-43, within SGs is thought to enhance protein self-interactions that subsequently mature into pathological inclusions (Harrison and Shorter, 2017). Supporting the role of SGs in seeding TDP-43 proteinopathy, recent work has also revealed that antisense oligonucleotide-mediated depletion of SG components ameliorates neurotoxicity in a TDP-43 rodent model (Becker et al., 2017).
Modeling TDP-43 proteinopathy has proven challenging. Current cellular and animal models rely on enhanced expression of wildtype or rare mutant variants of TDP-43 to initiate pathological aggregation; however, this approach is unreliable and many models fail to develop inclusions that recapitulate ALS/FTD phenotypes (Philips and Rothstein, 2015). Furthermore, the lack of control over intracellular TDP-43 interactions impedes the ability to test whether cytoplasmic phase separation precedes inclusion formation and whether this process, or these inclusions themselves, are neurotoxic. A mechanistic understanding of the molecular processes that drive the formation of TDP-43 inclusions may reveal avenues for therapeutic intervention and uncover the underlying pathobiology of ALS/FTD and related neurodegenerative disorders. To this end, we developed an optogenetic method to induce TDP-43 proteinopathy with blue light and examine the mechanisms that drive the formation of intracellular inclusions. We found that homo-oligomerization of the TDP-43 LCD mediates light-induced phase separation (LIPS) capable of driving the formation of pathologically-relevant inclusions. We also show that RNA-binding regulates these aberrant phase transitions and TDP-43 residence in SGs. Finally, we demonstrate that aberrant TDP-43 phase transitions drive neurodegeneration, and that treatment of neurons with oligonucleotides comprised of TDP-43 binding sequences inhibits inclusion formation and are neuroprotective.
Results
Optogenetic modulation of TDP-43 inclusions.
We generated an optogenetic Cry2olig-TDP-43-mCherry expression construct (optoTDP43) to selectively induce TDP-43 proteinopathy under the spatiotemporal control of light stimulation. Cry2olig is a variant of the Photolyase-Homologous Region (PHR) of the Cryptochrome 2 protein from Arabidopsis thaliana that undergoes reversible homo-oligomerization (~5 min) in response to blue light (Taslimi et al., 2014) (Figure 1A, top). Due to recent findings, suggesting the importance of N-terminal oligomerization in promoting higher-order assembly and LLPS of TDP-43 (Afroz et al., 2017; Chang et al., 2012; Mompeán et al., 2017; Wang et al., 2018), we positioned the Cry2olig domain on the N-terminus of the full-length TDP-43 protein. We first tested whether Cry2olig-mediated increases in focal concentrations of optoTDP43 protein leads to intracellular TDP-43 proteinopathy upon light exposure (Figure 1A, bottom). To monitor this event, we performed automated epifluorescence imaging of live HEK293 cells expressing the mCherry-tagged optoTDP43 protein (Figure 1B, top). Cells were intermittently imaged during a persistent blue light treatment using a 96-well LED array positioned within a stage-top incubator (see STAR Methods for details). optoTDP43-expressing cells exposed to blue light showed a progressive depletion of nuclear optoTDP43 signal and developed significantly more cytoplasmic inclusions relative to optoTDP43-expressing cells kept in the dark over a 24 hr live-imaging session (Figure 1B-C, Movie S1). TDP-43 was not mislocalized in cells expressing Cry2olig-mCh alone with or without light exposure, as assessed by immunofluorescence and subcellular fractionation/western blotting (Figure S1A-B). TDP-43 inclusions were absent from TDP-43-mCh-expressing cells with or without light exposure during the imaging period indicating that optoTDP43 inclusion formation is selectively driven by light-induced oligomerization of TDP-43 and not TDP-43 overexpression (Figure 1C). Consistent with this observation, size-exclusion chromatography confirmed that light treatment induced the formation of higher-order optoTDP43 protein oligomers (Figure S2A-B, top bands). Together, these data indicate that light treatment initiates intracellular oligomerization of the optoTDP43 protein independent of overexpression-induced aggregation.
Figure 1. optoTDP43 is a light-inducible model of TDP-43 proteinopathy.
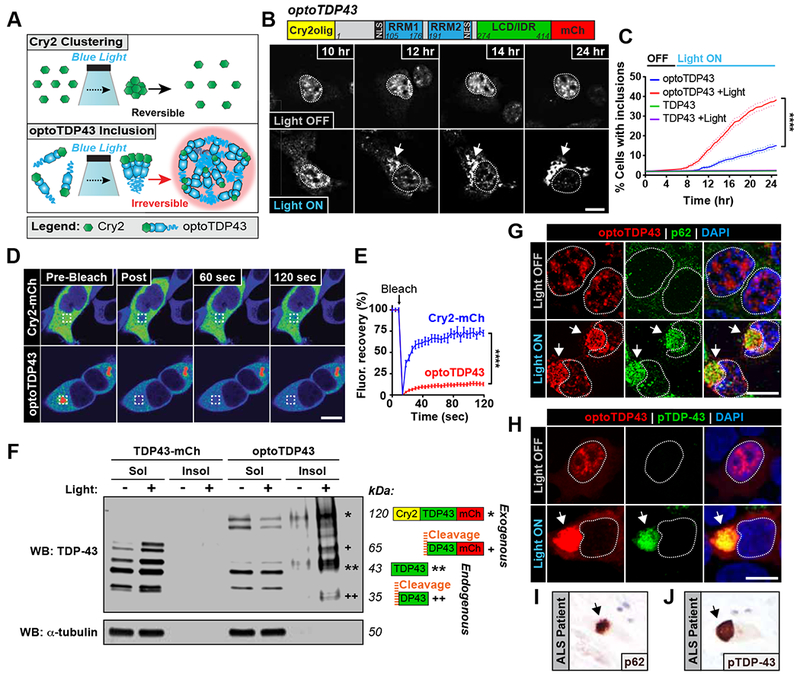
(A) Schematic of light-inducible TDP-43 proteinopathy approach using the Cry2olig photoreceptor and TDP-43 protein. (B) optoTDP43 fusion protein and representative images of HEK293 cells expressing optoTDP43 exposed to blue light stimulation (bottom) (~0.3 mW/cm2, 465 nm) or darkness (top). Cell nuclei are circled. Arrow indicates optoTDP43 inclusion formation with light treatment. (C) Percentage of cells exhibiting optoTDP43 inclusions over time using automated longitudinal live-imaging, n = 494-791 cells. (D) Representative images of FRAP analysis images of Cry2-mCh or light-induced optoTDP43 inclusions. (E) Quantification of FRAP analysis shows lack of signal recovery for optoTDP43 inclusions, n = 18-22 cells. (F) Detergent-solubility fractionation and western blotting for TDP-43 of optoTDP43-expressing cells with and without light stimulation. * indicates full-length exogenous optoTDP43; + indicates optoTDP43 cleavage product; ** indicates full-length endogenous TDP-43; ++ indicates endogenous TDP-43 cleavage product. (G-J) Immunofluorescence analysis of optoTDP43 inclusions (G-H) and ALS patient spinal cord (I-J) for pathological hallmarks p62 (G, I) and C-terminal hyperphosphorylated TDP-43 (H, J). Data shown are mean +/− S.E.M. **** p < 0.0001. Scale bars = 10 μm.
We next evaluated whether the features of optoTDP43 inclusions recapitulate the biochemical and neuropathological hallmarks of TDP-43 proteinopathy seen in patient tissue, including detergent-insolubility, N-terminal cleavage, C-terminal hyperphosphorylation, p62 co-localization, and the formation of ubiquitin-enriched inclusions (Al-Sarraj et al., 2011; Scotter et al., 2015). We first performed fluorescence recovery after photo-bleaching (FRAP) analysis of light-induced optoTDP43 inclusions to first assess the material state of light-induced optoTDP43 inclusions. While the Cry2-mCh signal recovered immediately, the optoTDP43 inclusions exhibited minimal signal recovery following photobleaching, indicating the formation of immobile intracellular protein assemblies (Figure 1D-E; Movie S2). In addition, detergent-solubility fractionation and immunoblotting for TDP-43 and mCherry proteins showed that light induced a dramatic shift in optoTDP43 to the insoluble fraction and promoted N-terminal cleavage (Figure 1F, Figure S2C), mimicking the biochemical profile observed in ALS/FTLD patient tissue (Figure S2D). TDP-43-mCh-expressing cells did not display a similar shift in solubility or cleavage in the presence or absence of light when examined at the same timepoint (Figure 1F). Endogenous TDP-43 was also detected in the insoluble fraction and exhibited enhanced N-terminal cleavage in optoTDP43-expressing cells exposed to light (Figure 1F). Size-exclusion chromatography similarly revealed a shift of endogenous TDP-43 species to heavier fractions relative to cells in the dark (Figure S2A). These combined data suggest that optoTDP43 sequesters non-optogenetic TDP-43 proteins into light-induced insoluble fraction. This phenomenon is likely due to TDP-43-specific interactions, as Cry2olig-mCh expression did not affect endogenous TDP-43 solubility or cleavage regardless of light exposure (Figure S2E).
We next confirmed the ability of optoTDP43 to directly recruit other non-optogenetic TDP-43 species into light-induced inclusions by co-expressing an EGFP-tagged TDP-43 construct along with optoTDP43 or Cry2-mCh alone. We found that EGFP-TDP-43 co-localized with the light activated optoTDP43 inclusions, while no such co-localization was observed with Cry2-mCh (Figure S2F). Furthermore, optoTDP43 inclusions are p62-positive (Figure 1G, 82.9%), hyperphosphorylated in the C-terminal domain (Figure 1H, 85.7%), and colocalize with ubiquitin (Figure S2G) as seen in patient tissue (see for example Figure 1I-J). Together, these data indicate that light-activated optoTDP43 inclusions exhibit the biochemical and pathological hallmarks of TDP-43 proteinopathy and may seed endogenous TDP-43 aggregation.
Aberrant LCD phase transitions drives the formation of TDP-43 inclusions.
Recent studies indicate that LCDs mediate the homo- and hetero-oligomerization of LCD-containing proteins through LLPS (Elbaum-Garfinkle et al., 2015; Molliex et al., 2015; Nott et al., 2015) and aberrant interactions between these low-complexity regions are hypothesized to promote the maturation/fibrillization of phase-separated droplets (Harrison and Shorter, 2017) . To determine whether the TDP-43 LCD mediates the formation of optoTDP43 inclusions, we employed the optoDroplet approach (Shin et al., 2017) to study intracellular TDP-43 LCD phase separation behavior using the WT Cry2 PHR domain (Cry2PHR). This photoreceptor has a higher saturation concentration as compared to the lower-threshold, and more potent, Cry2olig photoreceptor used to produce optoTDP43 inclusions, and allows us to detect subtle changes in droplet properties. We first generated an optogenetic construct containing the Cry2PHR photoreceptor fused to the TDP-43 LCD (optoLCD) and found that optoLCD proteins readily underwent reversible light-induced phase separation (LIPS) in response to brief pulses of blue light in HEK293 cells (Figure 2A-B, Movie S3). These findings are consistent with studies reporting that purified TDP-43 LCD protein undergoes LLPS in vitro (Conicella et al., 2016; Sun and Chakrabartty, 2017). Light-induced clustering of the Cry2PHR photoreceptor alone did not induce droplet formation, indicating that the TDP-43 LCD drives LIPS (Figure 2A-B). Light-activated optoLCD granules also displayed classical properties of phase-separated liquid-like protein droplets (Brangwynne et al., 2009, 2015), undergoing fusion upon granule contact (Figure S3A) and exhibiting concentration- (Figure 2C, Figure S3B) and light-dependent droplet formation (Figure S3C). These data are consistent with light-activated optoDroplet formation of the LCDs of other RNA-binding proteins, including FUS, HNRNPA1 and DDX4 (Shin et al., 2017).
Figure 2. Optogenetic phase transitions of the TDP-43 LCD drives inclusion formation.
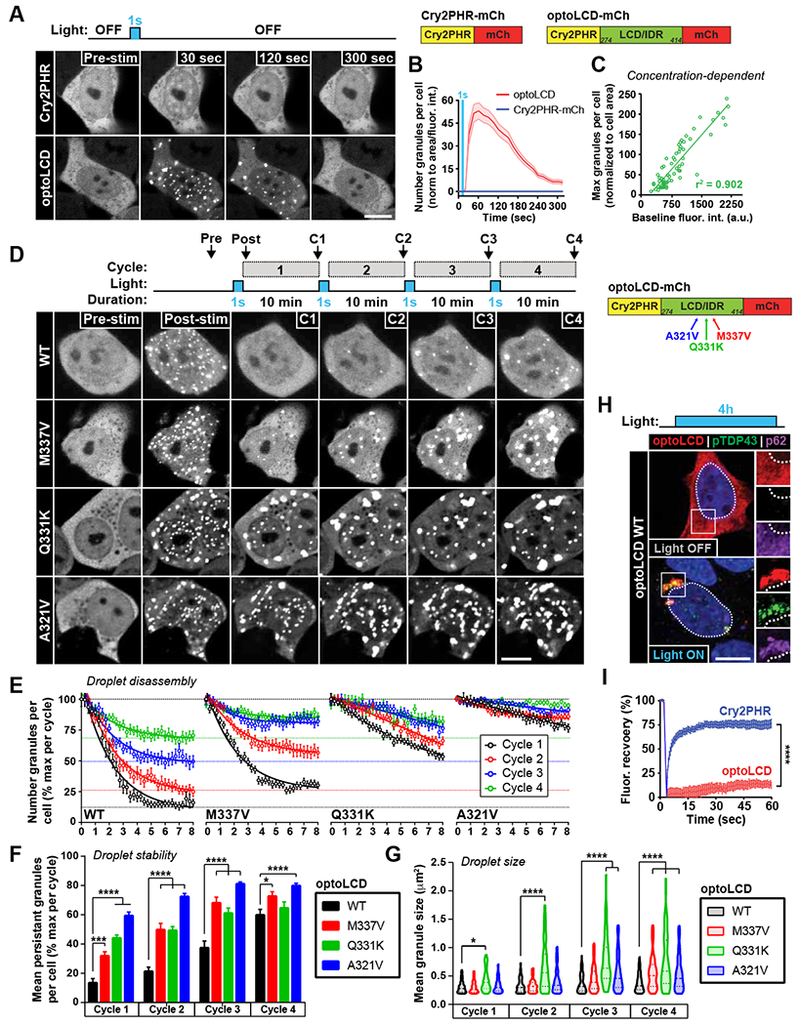
(A) Representative images of HEK293 cells expressing Cry2PHR-mCh (top) or optoLCD (bottom) exposed to acute blue light stimulation (1 sec, 1% laser power, 488 nm). (B) Quantification of normalized granule number per cell in response to acute stimulation, n = 26-48 cells. (C) Quantification of protein concentration-dependence of optoLCD phase transitions, r2 was determined by Pearson’s correlation. Data points represent individual cells. n = 66 cells. (D) Representative images of repetitive light-induced phase transitions of WT and ALS-linked mutant (M337V, Q331K, A321V) optoLCD proteins during a cycling light stimulation protocol consisting of a single blue light pulse (1 sec, 1% laser power) every 10 min for 40 min. Images shown are the final images acquired per cycle prior to subsequent light stimulation. (E) Quantification of granule disassembly dynamics following cycling stimulation protocol shown in (D). n = 21-31 cells per construct. (F-G) Quantification of irreversible optoLCD number (F) and area (G) per cycle with repeated phase transitions. (H) Immunofluorescence analysis of optoLCD inclusions formed following chronic blue light stimulation (4 hrs, ~0.3mW/cm2, 465 nm) for hyperphosphorylated TDP-43 (green) p62 (purple). (I) Quantification of fluorescence recovery after photobleaching of optoLCD inclusions formed by chronic light stimulation. n = 16 cells per construct. Data points shown are mean +/− S.E.M. ****, p < 0.0001. Scale bars = 10 μm.
To determine whether aberrant LCD interactions promote the formation of intracellular inclusions, we next examined the effects of repetitive and chronic LIPS on optoLCD droplet dynamics in live cells. We tested the wildtype TDP-43 LCD and optoLCD proteins containing three ALS-causing mutations (M337V, Q331K, A321V), which alter LLPS properties and promote aggregation of TDP-43 in diverse in vitro and cellular models (Gopal et al., 2017; Johnson et al., 2009; Schmidt and Rohatgi, 2016). Using a 10-minute cycling blue light stimulation protocol to induce repetitive LIPS of the LCD, we observed gradual maturation of optoLCD granules over successive cycles of droplet formation (Figure 2D-E; Movie S4). optoLCD droplets exhibited a progressive increase in the number of persistent, irreversible optoLCD granules with each successive cycle, an effect that was exacerbated by ALS-linked mutations (Figure 2E-F). Mutant optoLCD proteins displayed more rapid conversion to stable droplets upon successive LIPS, as determined by an increased number (Figure 2F) and size (Figure 2G) of persistent granules, compared to WT optoLCD droplets despite similar protein level as determined by Western blot analysis (Figure S3D). We next employed a chronic blue light stimulation paradigm to investigate whether the WT optoLCD droplets matured into pathologically-relevant inclusions with prolonged LCD oligomerization. Interestingly, a 4 hr chronic blue light stimulation resulted in hyperphosphorylated and p62-positive optoLCD inclusions (Figure 2H) that were immobile as evaluated by quantitative FRAP analysis (Figure 2I). These results indicate that TDP-43 LCD undergoes intracellular phase separation upon self-oligomerization and that maturation of LCD droplets, either through repetitive/chronic phase transitions or ALS-linked mutations, drives LCD inclusion formation.
RNA-binding inhibits TDP-43 LCD homo-oligomerization.
While the TDP-43 LCD undergoes intracellular LIPS with acute blue light treatment (Figure 2A), the same light stimulation paradigm did not induce a phase transition of full-length optoTDP43 (Figure S3E; Movie S5), even when fused to the more potent homo-oligomerizing Cry2 photoreceptor domain (Cry2olig) (Taslimi et al., 2014). Given the ability of full-length purified TDP-43 to undergo rapid LLPS (McGurk et al., 2018; Molliex et al., 2015; Wang et al., 2018), we suspected there may be components within the intracellular environment which oppose TDP-43 LLPS in our model. The presence of the prominent TDP-43 RNA-binding domains (or RNA-recognition motifs, RRMs), along with reports of an increased aggregation propensity of C-terminal cleavage products lacking these domains (Zhang et al., 2009), led us to hypothesize that RNA-binding inhibits the ability of the full-length optoTDP43 protein to homo-oligomerize via its LCD.
To test this notion, we fused the Cry2olig photoreceptor domain to the TDP-43 RRMs and evaluated the ability of the RRM domains to oligomerize in response to light. The enhanced homo-oligomerization of the Cry2olig photoreceptor domain allowed us to ensure that any observed inhibition of LIPS was likely a result of endogenous TDP-43 properties and not due to insufficient Cry2 activation. While the TDP-43 LCD fused to Cry2olig domain (Cry2olig-LCD) underwent LIPS in response to blue light and mimicked the droplet-like properties seen with optoLCD assemblies (Figure 3A-B, top row; Figure S4A-E; Movie S6), light treatment did not stimulate TDP-43 RRM phase separation (Figure 3A-B, bottom row; Movie S6). We next generated fusion proteins containing both the TDP-43 RRMs and Cry2olig-LCD (RRMs + LCD WT) to test whether the RRM domains affect TDP-43 LCD LIPS. Strikingly, the RRMs completely inhibited LIPS of the LCD, even when the potent Cry2olig photoreceptor was employed (Figure 3C-D, top row; Movie S6). To test whether RNA binding to the RRMs inhibits TDP-43 LCD oligomerization, we introduced five point phenylalanine to leucine mutations within the RRM domains (5FL), which were previously shown to significantly impair, but not abolish, TDP-43 RNA-binding (RRMs + LCD 5FL) (Elden et al., 2010). Remarkably, robust induction of LIPS is observed following light stimulation (Figure 3C-D, bottom row; Movie S6). Since Cry2olig fusion proteins containing mutated RRMs alone (RRMs 5FL) did not show any light-induced droplet formation (Figure S4F), the recovery of LIPS in the RNA-binding deficient construct is mediated by the LCD. To ensure that RNA-binding activity, and not a conformational change in the construct, inhibited LIPS, we assessed whether the TDP-43 LCD can drive phase separation of the FUS RRM (fusRRM WT + LCD). Like the TDP-43 RRMs, the FUS RRM fusion to the TDP-43 LCD failed to undergo LIPS (Figure 3E-F, top row; Movie S6). However, when similar phenylalanine to leucine point mutations that compromise the RNA-binding ability of the FUS RRM were introduced (Daigle et al., 2013) (fusRRM 4FL + LCD), the FUS RRM + TDP-43 LCD fusion protein underwent rapid LIPS (Figure 3E-F, bottom row; Movie S6). These data indicate that RNA-binding dictates the ability of the TDP-43 LCD to homo-oligomerize and drive LIPS.
Figure 3. RNA-binding prevents light-induced phase separation and aggregation of TDP-43.
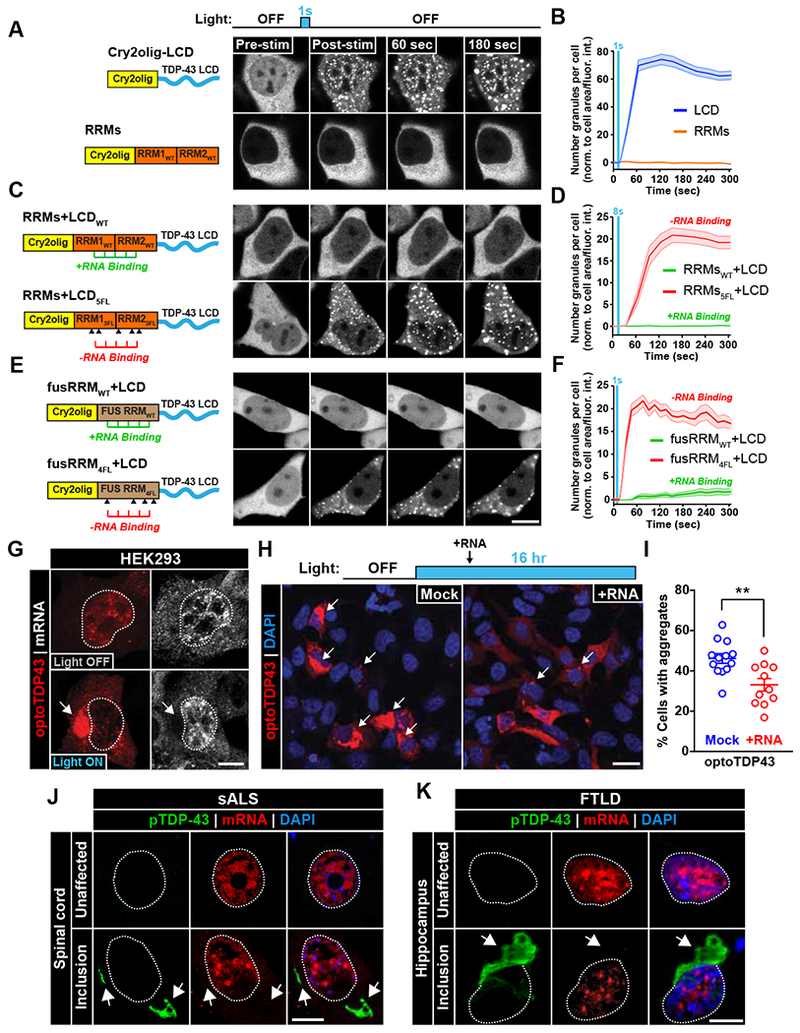
(A-F) HEK293 cells expressing the Cry2olig photoreceptor fused to the TDP-43 LCD (A), TDP-43 RNA-binding regions (RRMs) (A), TDP-43 LCD and functional (WT) RRMs (C), TDP-43 LCD and RNA-binding deficient (5FL) RRMs (C), TDP-43 LCD fused to the functional (WT) FUS RRM (E), or TDP-43 LCD fused to FUS RNA-binding deficient (4FL) RRM (E) were exposed to acute light stimulation (1-8 sec, 10% laser power, 488 nm) and normalized granule number per cell quantification is shown in right hand column (B, D, F). n = 33-59 (A-B), 24-36 (C-D) and 31-45 cells (E-F). Data shown are mean +/− S.E.M. (G) mRNA within full-length optoTDP43 inclusions was assessed by RNA fluorescence in situ hybridization (FISH) for Poly-A tails. Arrow indicates absence of mRNA signal within inclusion. (H) Representative images of HEK293 cells expressing optoTDP43 that received mock or RNA (2.5 μg HEK293 total mRNA) treatment 4 hours into a 16 hour chronic blue light treatment. (I) Quantification of optoTDP43-expressing cells with cytoplasmic inclusions. Data points correspond to individual fields of view. n = 662-673 cells. (J-K) RNA FISH analysis of ALS/FTLD patient tissue targeting Poly-A mRNA. TDP-43 inclusions (green, bottom rows) in spinal cord (J, sALS) and hippocampal (K, FTLD) sections both show no co-localization with mRNA signal (red). Data shown are mean +/− S.E.M. **, p < 0.01. Scale bars = 10 μm.
To determine whether RNA-binding also plays a role in the formation of pathological inclusions of full-length TDP-43, we performed RNA fluorescent in situ hybridization (FISH) and used an RNA dye to assess whether RNA resides within the light-induced optoTDP43 inclusions. Interestingly, RNA was absent in light-induced optoTDP43 inclusions (Figure 3G; Figure S5A). Supporting the notion that RNA-binding dictates the ability of the LCD to drive pathological oligomerization of TDP-43, longitudinal imaging also revealed that RNA-deficient optoTDP43 5FL formed inclusions at a significantly enhanced rate and frequency than the RNA-binding competent optoTDP43 in live cells (Figure S5B).
Since our data suggest that RNA-binding inhibits LCD-driven phase-transitions of TDP-43, we hypothesized that addition of exogenous RNA substrates might inhibit optoTDP43 inclusion formation. To test this hypothesis, we treated optoTDP43-expressing HEK293 cells with blue light for 16 hr to induce inclusions and transfected cells with total HEK293 cell RNA 4 hr after illumination. Surprisingly, there was a measurable reduction (28%) of optoTDP43 inclusion formation in cells treated with purified RNA, as compared to mock-treated cells, following light stimulation (Figure 3H-I). To determine whether mRNA colocalizes with TDP-43 inclusions in patients, we performed RNA FISH using a poly-T probe in ALS/FTLD patient tissue and examined TDP-43/mRNA colocalization. TDP-43 inclusions lacked mRNA signal in both sporadic ALS (sALS) spinal cord (Figure 3J, Figure S5C) and FTLD hippocampus (Figure 3K, Figure S5C; Table S1). Taken together, we propose that RNA-binding to the TDP-43 RRM domains inhibits LCD:LCD interactions, thus blocking aberrant TDP-43 phase transitions and the formation of pathological inclusions.
We next utilized purified WT TDP-43 and a TDP-43 protein with identical RRM point mutations (TDP-43 5FL, henceforth referred to as RNA-binding deficient TDP-43) to examine whether RNA-binding alters TDP-43 LLPS and aggregation in vitro. In the absence of RNA, C-terminal MBP-tagged TDP-43 WT and 5FL formed liquid-like droplets at physiological salt concentrations that did not form in the presence of 1,6 hexanediol, which disrupts weak contacts between LCDs that drive LLPS (Gopal et al., 2017; Patel et al., 2007) (Figure 4A). However, in the presence of increasing concentrations of total RNA, WT TDP-43 LLPS was inhibited in a dose-dependent manner (Figure 4B). In contrast, the RNA-binding deficient TDP-43 5FL species was unaffected by exogenous RNA (Figure 4B). Upon selective cleavage of the MBP tag with TEV protease, TDP-43 WT and 5FL form solid-phase aggregates (Figure 4C). While WT and RNA-binding-deficient TDP-43 displayed similar aggregation kinetics in the absence of RNA, the addition of RNA completely inhibited WT TDP-43 aggregation (Figure 4C-D). The aggregation kinetics of TDP-43 5FL was initially delayed in the presence of RNA, likely due to residual RNA-binding (Figure 4D), but the final extent of aggregation was identical to TDP-43 in the absence of RNA upon further incubation (Figure 4C-D). Moreover, the addition of RNase A (2.5μg) 90 min after TEV cleavage reversed the initial inhibition of WT TDP-43 aggregation conferred by RNA addition (Figure 4E).
Figure 4. TDP-43 LLPS and aggregation is inhibited by RNA-binding.
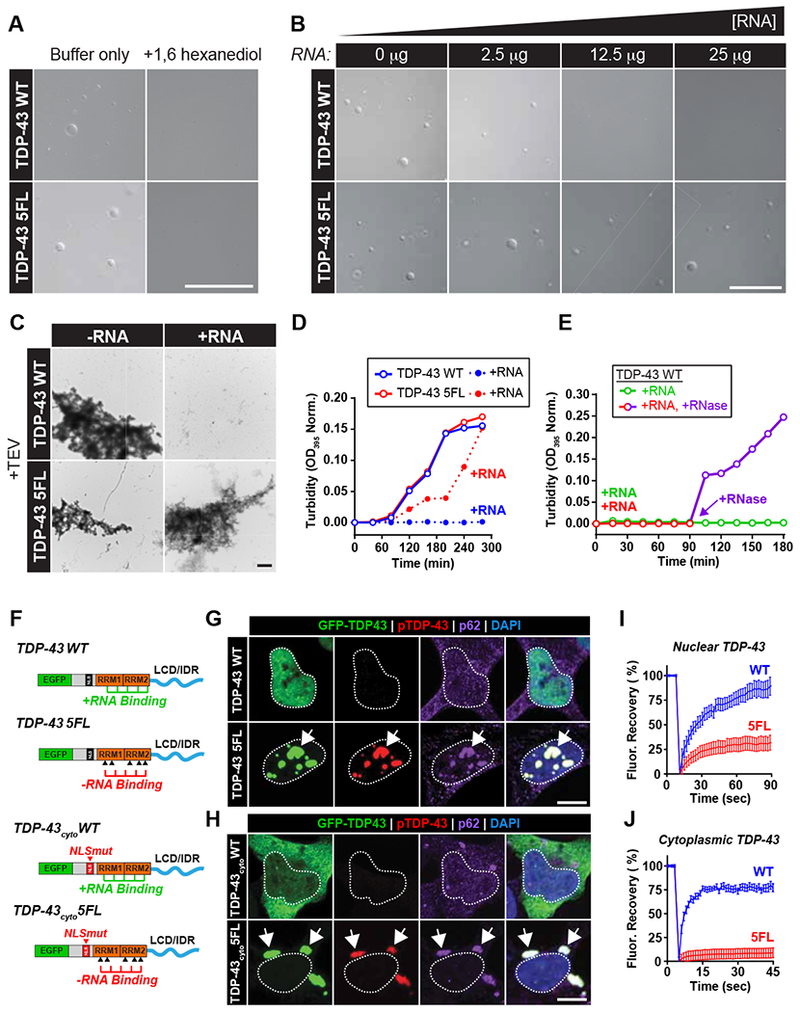
(A) Purified TDP43-MBP WT or 5FL (5μM) were incubated for 2 hours (10% dextran buffer, 150 mM NaCl) in the absence or presence of 1,6 hexanediol (10% w/v). Scale bar = 50 μm. (B) Representative DIC images of purified TDP43-MBP WT or 5FL following incubation with increasing concentrations of yeast total RNA. Scale bar = 50 μm. (C) Representative electron micrographs of TDP-43 WT and 5FL following TEV cleavage in the absence (left) or presence (right) of yeast total RNA (15 μg). Scale bars = 4 μm. (D) Turbidity changes (normalized OD395 readings) of TDP-43 WT (blue) and 5FL (red) following TEV cleavage in the absence (open circles) or presence (solid circles) of yeast total RNA (15 μg). (E) Turbidity changes (normalized OD395 readings) of TDP-43 WT proteins following TEV cleavage in the presence of yeast total RNA-only (25 μg) (green) or yeast total RNA (25μg) followed by RNase A addition (2.5μg) at 90 min post-TEV cleavage (red prior to/purple following RNase A). (F) Construct designs for non-optogenetic TDP-43 vectors containing functional (WT) or RNA-binding deficient (5FL) RRMs. TDP-43cyto constructs contain point mutations in the nuclear localization sequence to mimic cytoplasmic mislocalization. (G-H) Immunofluorescence analysis of cells expressing EGFP-TDP-43 constructs (G) or EGFP-TDP43cyto constructs (H) with/without functional RRMs (WT/5FL) for hyperphosphorylated TDP-43 (red) and p62 (purple). Scale bars = 10 μm. (I-J) FRAP analysis of EGFP-TDP43 5FL (G) and EGFP-TDP43cyto 5FL (H) inclusions, n = 14-23 (I) and 20-24 cells (J). Data shown are mean +/− S.E.M. Scale bars = 10 μm.
If RNA-binding prevents aberrant phase separation and TDP-43 inclusion formation, then RNA-binding deficient protein expression should generate TDP-43 proteinopathy. We therefore expressed (non-optogenetic) EGFP-tagged TDP-43 constructs containing wildtype or RNA-binding-reduced RRM domains in HEK293 cells (Figure 4F). Surprisingly, mere expression of the RNA-binding-deficient TDP-43 protein (EGFP-TDP43 5FL) generated large nuclear inclusions that were hyperphosphorylated and p62-positive (Figure 4G). When the protein’s NLS was mutated (EGFP-TDP43cyto 5FL), the RNA-binding-deficient protein localized to the cytoplasm and formed hyperphosphorylated and p62-positive inclusions that resembled the neuropathology observed in ALS/FTLD (Figure 4H). This finding suggests that cytoplasmic mislocalization is an upstream event preceding formation of RNA-deficient cytoplasmic inclusions. FRAP analysis revealed that RNA-deficient TDP-43 inclusions in both the nucleus and cytoplasm did not recover from photo-bleaching (Figure 4I-J). Nuclear RNA-binding deficient TDP-43 inclusions also exhibited slightly enhanced fluorescence recovery after photo-bleaching compared to the cytoplasmic RNA-deficient TDP-43. This may be due to the abundance of accessible RNA species in the nucleus whereas RNAs destined for the cytoplasm are pre-assemblied into heterogenous RNP complexes (Köhler and Hurt, 2007). Overall, these findings indicate that RNA-binding dictates the propensity for TDP-43 to form pathologically-relevant inclusions.
Impaired SG recruitment promotes aberrant TDP-43 phase transitions.
SG components are modifiers of toxicity and pathological aggregation associated with TDP-43-overexpression in yeast, fly, and mouse models (Becker et al., 2017; Elden et al., 2010; Kim et al., 2014). SGs are composed of high concentrations of LCD-containing proteins and form through LLPS (Shin and Brangwynne, 2017), and maturation of TDP-43-containing SGs may seed pathological inclusions (Harrison and Shorter, 2017). Since RNA-binding dictates the ability of TDP-43 to undergo LLPS and inclusion formation, we asked whether reducing the RNA-binding ability of TDP-43 would confer enhanced SG recruitment and subsequent maturation into insoluble inclusions. Because cytoplasmic mislocalization is required for TDP-43 recruitment to SGs (Bentmann et al., 2012), we first induced SG formation in cells expressing cytoplasmic TDP-43 (EGFP-TDP43cyto) with functional (WT) or RNA-binding deficient (5FL) RRMs and examined co-localization with known SG markers. Notably, RNA-binding-deficient TDP-43 (TDP43cyto 5FL) was excluded from endogenous SGs upon heat shock or sodium arsenite-induced cell stress, whereas RNA-binding-competent TDP-43 was recruited to SGs (TDP-43cyto WT; SG+ granules) (Figure 5A-C). However, during our analysis we discovered a subset of cytoplasmic WT TDP-43 granules that formed under stress conditions did not co-localize with SG markers (SG− granules) (Figure 5A-B). Further investigation revealed that these TDP-43 granules (SG− granules) lacked mRNA (Figure 5D) and were enlarged (Figure 5E). In contrast, cytoplasmic TDP-43 recruited to SGs (SG+) co-localized with mRNA signal (Figure 5D). FRAP analysis of these two subsets of cytoplasmic TDP-43 granules in live cells similarly revealed that TDP-43 recruited to RNA-containing stress granules (SG+) remained dynamic, whereas the excluded TDP-43 species (SG−) were static (Figure 5F-G, Movie S7). Furthermore, TDP-43 residing in SG− inclusions were hyperphosphorylated and p62-positive (Figure S6A), thus exhibiting pathological hallmarks of TDP-43 proteinopathy. This result suggests that TDP-43 recruitment to SGs requires RNA binding and that localization to acutely-formed, RNA-rich SGs promotes TDP-43 solubility, whereas TDP-43 outside of these RNA-containing assemblies are insoluble.
Figure 5. RNA-binding and stress granule localization prevents TDP-43 inclusions.
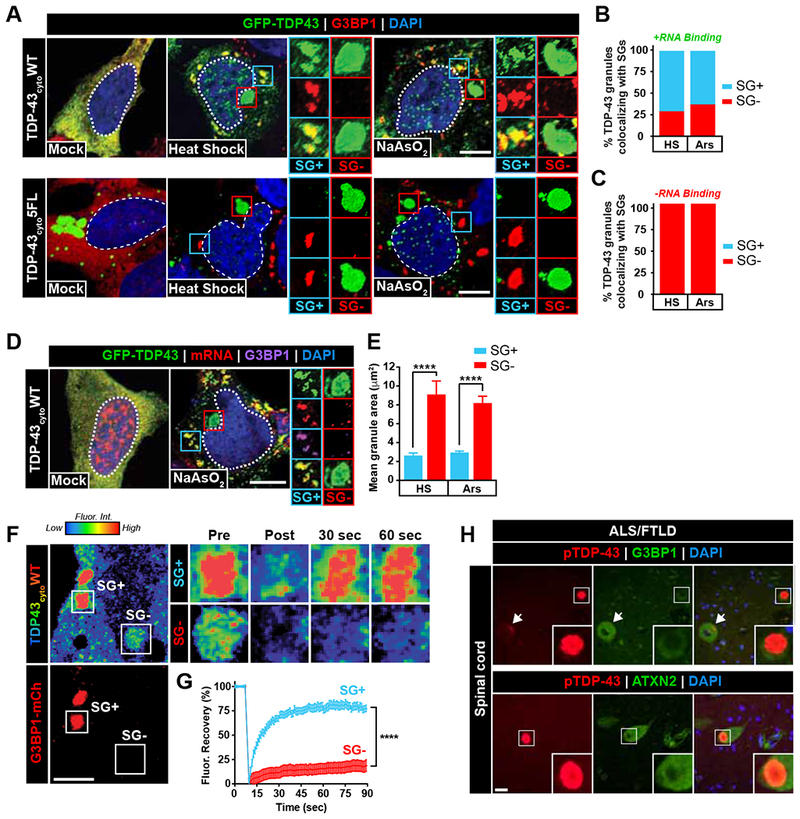
(A) Cytoplasmic EGFP-TDP43 constructs were expressed with functional (WT, top) or RNA-binding deficient (5FL, bottom) RRMs in HEK293 cells prior to heat shock or sodium arsenite treatment and immunostaining for G3BP1 (red) and eIF4G (not shown). (B-C) Percentage of EGFP-TDP43 granules that co-localized with G3BP1/eIF4G were calculated (SG+/−). n = 99-316 granules. (D) RNA FISH targeting Poly-A tails was performed to assess mRNA presence in SG+/− TDP-43 granules following sodium arsenite treatment. Scale bar = 10 μm. (E) Mean granule area for SG+ and SG− TDP-43 granules following heat shock and sodium arsenite treatment was determined by immunofluorescence, n = 24-68 granules per condition. (F-G) HEK293 cells were co-transfected with cytoplasmic EGFP-TDP43cyto and G3BP1-mCh and exposed to sodium arsenite treatment to induce stress granule formation. FRAP analysis of TDP-43 granules that co-localized (SG+) or did not co-localize (SG−) with G3BP-mCh was performed to assess material state of SG+/− granules, n = 17-27 cells. (H) Immunohistochemical analysis of ALS/FTLD spinal cord tissue was performed to determine whether patient TDP-43 inclusions contain SG proteins. Arrows or insets indicate a lack of co-localization between TDP-43 inclusions (red) and the SG components G3BP1 (top) and ATXN2 (bottom) (green). Scale bar = 20 μm. Data shown are mean +/− S.E.M. ****, p < 0.0001.
In support of this notion, TDP-43 5FL inclusions due to RNA-binding deficiencies did not co-localize with SG proteins in the nucleus or in the cytoplasm in HEK293 cells (Figure S6B). Furthermore, although optoTDP43 proteins were recruited to SGs upon sodium arsenite treatment, optoTDP43 inclusions of all sizes were devoid of key stress granule components (Figure S6C-D) (Boeynaems et al., 2016) after illumination. Neuropathological analysis of ALS/FTLD patient tissue similarly revealed an absence of co-localization between TDP-43 inclusions and G3BP1/ATXN2 (Figure 5H, Figure S6E).
Bait oligonucleotides rescue aberrant TDP-43 phase transitions and neurotoxicity
TDP-43 proteinopathy correlates with regions of neurodegeneration in ALS/FTD patients (Mackenzie et al., 2013). To determine whether the formation of TDP-43 inclusions is toxic to human neurons, we differentiated human ReNcell VM neural progenitor cells into cortical-like neurons and obtained highly-enriched neuronal cultures (Figure S7A-C) (Donato et al., 2007). We then utilized a lentiviral expression system to selectively express optoTDP43 and a far-red fluorescent reporter (iRFP670) in human ReNcell cortical neuron cultures under the control of the human synapsin promoter (hSyn) (Figure 6A) prior to induction of optoTDP43 inclusion formation with chronic light stimulation. Longitudinal live-imaging at 30 min intervals revealed no significant neuronal loss in optoTDP43-expressing neurons kept in the dark (Figure 6B-C, Movie S8). However, optoTDP43 neurons exposed to blue light exhibited progressive blebbing and loss of iRFP670 fluorescent signal in the soma after ~28 hr of light exposure (determined by Chi-Square analysis) (Figure 6B-C, Movie S8). At the final 90 hr timepoint, we observed a 4.3-fold increase in cell death in optoTDP43-expressing neurons exposed to light in comparison to those maintained in darkness (Figure 6B-C). No significant decrease in cell survival was recorded in neurons expressing the Cry2-mCh photoreceptor alone regardless of light treatment (Figure 6C, Movie S9). Light stimulation alone also failed to induce alterations in neuron morphology (Figure S7D) or cell viability (Figure S7E), indicating no phototoxicity due to the light exposure. Subsequent analyses revealed a striking cytoplasmic shift of optoTDP43 signal in dying cells ~1 hr before cell death (Figure 6D) that was followed by formation of either large optoTDP43 inclusions (inclusions) or smaller, more circular assemblies (particles) (Figure 6B). No significant differences were observed in either the overall survival patterns (Figure 6E) or the time-to-death following detection of either of these assembly types in individual neurons (Event-Death) (Figure 6F). Importantly, neurons harboring either optoTDP43 assemblies exhibited reduced survival as compared to those with diffuse nuclear signal throughout the imaging period (Figure 6E). Immunofluorescence analysis of neurons at the 48 hr timepoint confirmed the presence of hyperphosphorylated and p62-positive optoTDP43 inclusions in the cytoplasm of ReNcell neurons exposed to light (Figure 6G). However, examination of the smaller and equally toxic optoTDP43 particles revealed no co-localization with these markers (Figure 6G). These observations suggest that aberrant cytoplasmic phase transitions drive neurodegeneration and exert toxic downstream effects independent of S409/S410 phosphorylation or p62-colocalization status.
Figure 6. Light-induced optoTDP43 phase transitions are neurotoxic.
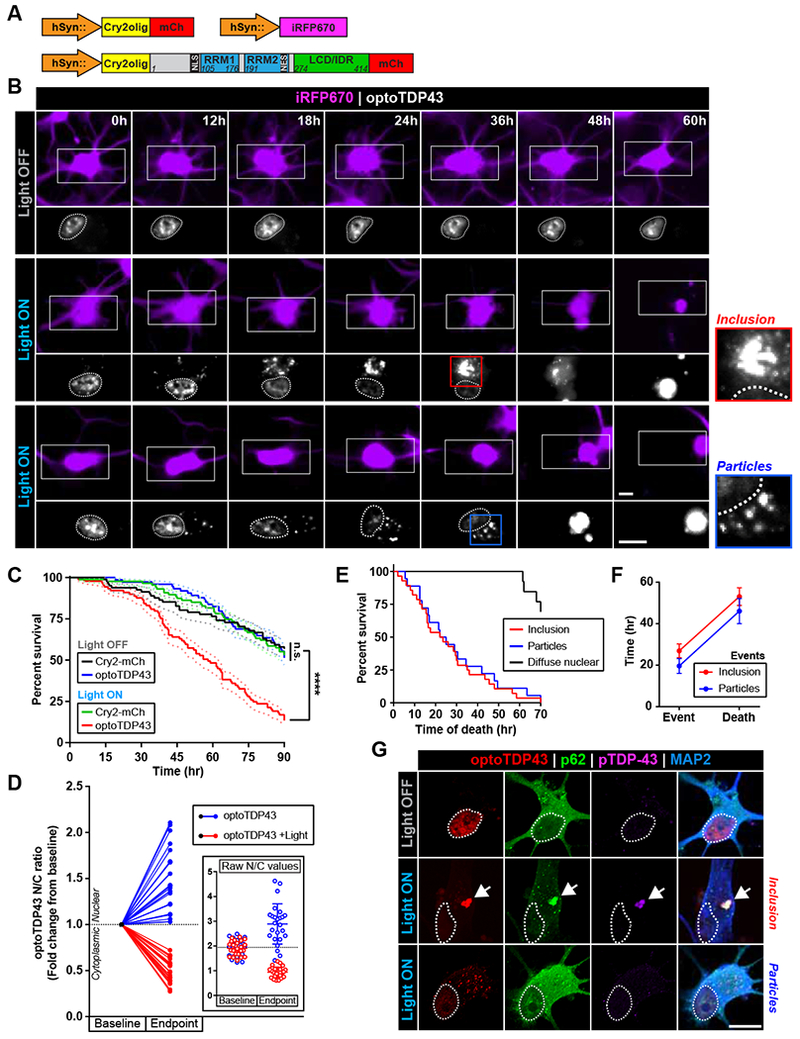
(A) Diagrams of lentiviral expression vectors used in neuronal survival experiments. optoTDP43 or the Cry2-mCh photoreceptor alone were expressed along with a far-red fluorescent reporter (iRFP670) under the control of the human synapsin promoter (hSyn). (B) Representative images of ReNcell cortical neurons expressing optoTDP43 kept in darkness (top row) or exposed to blue light (bottom two rows) (~0.3 mW/cm2, 465 nm) during longitudinal toxicity screening. The iRFP670 reporter is shown (purple) to visualize cell bodies and neurites. Insets show optoTDP43 signal (white) in the same neurons. Cell nuclei are circled. Loss of signal and neurite blebbing indicates cell death (bottom rows, 48-60 hr). (C) Survival curves of ReNcell neurons during longitudinal toxicity screening, n = 74-89 cells. Data are presented as mean percent survival. (D) Nuclear-cytoplasmic (N/C) ratios of optoTDP43 signal were analyzed at baseline (prior to light exposure) and endpoints (last frame prior to cell death or conclusion of imaging session) in neurons exposed to light (red) or maintained in darkness (blue). n = 25 cells per light condition. Data is presented as fold-changes in N/C ratios normalized to baseline values. Inset shows raw N/C values and data points represent individual neurons. Dotted lines indicate population mean at baseline. (E) Survival curves of optoTDP43-expressing neurons exposed to light stimulation stratified by optoTDP43 assembly phenotype, n = 13-28 cells. (F) Time-to-death between event onset (particle or inclusion formation) and cell death were analyzed between neurons showing either optoTDP43 assembly subtype, n = 17-28 cells. (G) Immunofluorescence analysis of light-induced optoTDP43 assemblies in ReNcell neurons for pathological hallmarks p62 (green) and hyperphosphorylated TDP-43 (purple). Data shown are mean +/− S.E.M. ****, p < 0.0001. Scale bar = 10 μm.
To investigate whether the neurotoxicity associated with aberrant optoTDP43 phase transitions could be mitigated through enhanced RNA binding, we designed a 2’OMe-modified RNA oligonucleotide based on a well-characterized TDP-43 binding sequence (Clip_34nt) previously shown to exhibit a high affinity for TDP-43 RRMs and a Kd of 112 nM (Ayala et al., 2011; Bhardwaj et al., 2013). We next employed the Clip_34nt to assess the ability of these bait oligonucleotides (bONs) to prevent light-induced optoTDP43 phase transitions in HEK293 cells. Cells expressing optoTDP43 were treated with either Clip_34nt or a scrambled oligonucleotide of equal length and nucleic acid composition prior to an 8 hr light stimulation protocol (Figure 7A). Similar to the effect produced by total HEK293 RNA, treatment with the bONs resulted in a dose-dependent reduction in cytoplasmic optoTDP43 assemblies (Figure 7B) in contrast to the non-targeting scrambled control. To test whether preventing light-induced optoTDP43 phase transitions enhanced neuronal survival, we next performed automated longitudinal imaging of optoTDP43-expressing ReNcell cortical neurons following a 4 hr pre-treatment with either Clip_34nt or the control oligonucleotide (Figure 7C). While no significant differences were observed in cumulative risk-of-death, we observed a significant and dose-dependent reduction in neurotoxicity during light treatment following treatment with the bONs (Figure 7D-E). Decreased toxicity was associated with similar dose-dependent reductions in light-induced optoTDP43 phase transitions, both inclusions and particles (Figure 7F), and nuclear-cytoplasmic redistribution of the optoTDP43 protein (Figure 7G). Consistent with results presented above, these studies suggest that the neuroprotective effect of a TDP-43-binding oligonucleotide occurs through the prevention of aberrant and neurotoxic cytoplasmic TDP-43 phase transitions.
Figure 7. Bait oligonucleotides inhibit aberrant phase transitions of TDP-43 and rescue associated neurotoxicity.
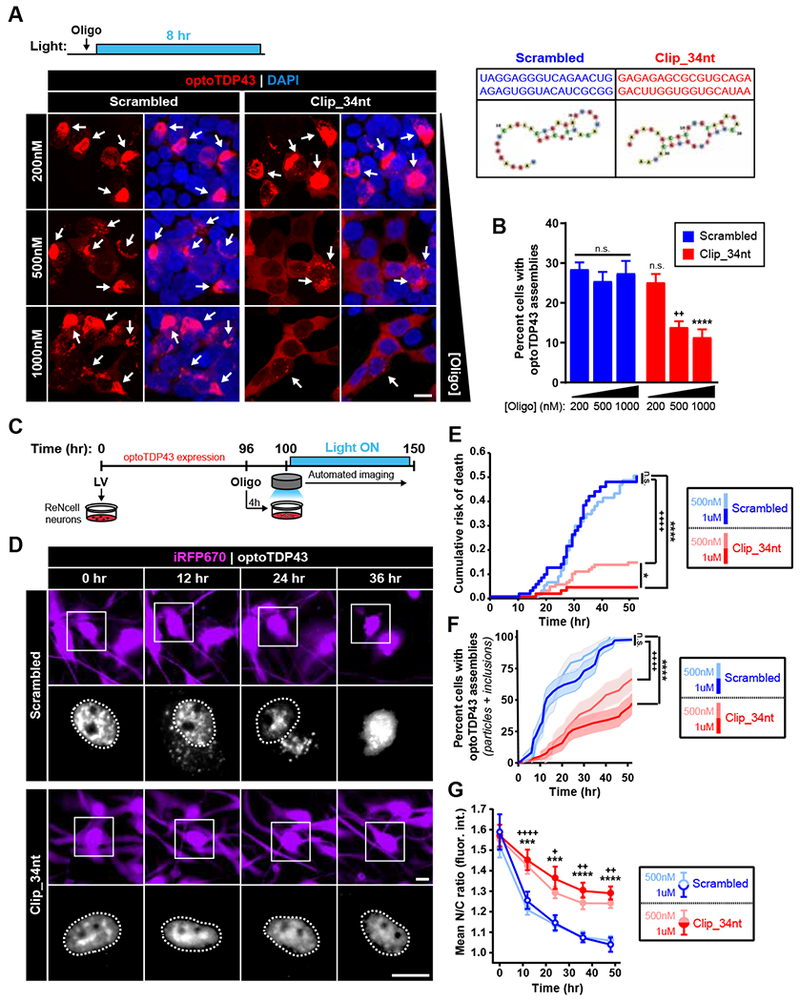
(A-B) HEK293 cells expressing optoTDP43 were pre-treated with non-targeting scrambled or targeting Clip_34nt RNA oligonucleotides for 30 min prior to chronic blue light stimulation (8 hr, −0.3 mW/cm2, 465 nm). Arrows indicate cytoplasmic optoTDP43 assemblies. (B) Quantification of percentage of cells showing light-induced cytoplasmic optoTDP43 assemblies following indicated oligonucleotide treatments, n = 578 – 943 cells. (C) Diagram representing timeline of oligonucleotide treatments and neuronal survival screening, optoTDP43-expressing ReNcell neurons were treated with indicated oligonucleotides 4 hr prior to blue light exposure and automated longitudinal imaging. (D) Representative images of neurons treated with 1 μM scrambled or Clip_34nt oligonucleotides prior to light exposure. Insets show optoTDP43 signal. Cell nuclei are circled. (E) Cumulative risk-of-death plots generated from Kaplan-Meier survival curves of ReNcell neurons over time following treatment with increasing doses of scrambled (blue) or targeting Clip_34nt (red) oligonucleotides. Shades of traces indicate treatment concentration (light = 500nM; dark = 1 μM). n = 78-121 cells. (F) Automated object detection was utilized to determine percentage of ReNcell neurons showing optoTDP43 assemblies (inclusions + particles) over time following the indicated oligonucleotide treatments, n = 37-39 cells. (G) Nuclear-cytoplasmic (N/C) ratios of optoTDP43 signal were calculated over time in neurons exposed to the indicated oligonucleotide treatments, n = 34-45 cells. *, p < 0.05; **, p < 0.01; ***, p < .001; p < 0.0001. + indicate comparisons between 500nM treatment groups; * indicate comparisons between 1000nM treatment groups. Data shown are mean +/− S.E.M. Scale bars = 10 μm.
Discussion
TDP-43 proteinopathy is a pathological hallmark in several neurodegenerative disorders. Modeling this pathology has proven challenging and no standard currently exists to reliably reproduce TDP-43 inclusions in live cells. To address this problem, we developed a photokinetic system to selectively induce TDP-43 proteinopathy that recapitulates pathological features observed in ALS/FTD and other neurodegenerative diseases. This system allowed us to study the intracellular mechanisms driving pathological phase separation. We show that the intracellular phase transitions of TDP-43 are mediated by the LCD, and events which promote homo-oligomerization of the TDP-43 LCD seed neuropathological inclusions. RNA-binding status dictates TDP-43 LCD-mediated oligomerization and RNA treatment blunts LLPS, aggregation of purified TDP-43, and light-induced optoTDP43 inclusion formation in live cells. Given recent evidence suggesting a role for SGs in seeding TDP-43 inclusions (Fernandes et al., 2018), we hypothesized that the heightened ability of RNA-binding deficient TDP-43 to undergo LLPS and aggregation confers enhanced recruitment to phase-separated SGs. Surprisingly, RNA-binding deficient TDP-43 is excluded from acutely-induced SGs and instead found in inclusions devoid of SG components. In contrast, TDP-43 recruited to SGs remained dynamic within these RNA-rich, liquid-like compartments. Since RNA binding inhibits aberrant phase transition of TDP-43, we tested whether a TDP-43-binding oligonucleotide sequence inhibits a pathogenic event. Remarkably, treatment with the oligonucleotide mitigated the cytoplasmic mislocalization and aberrant phase transition of optoTDP43 in response to light and rescued neurotoxicity.
Therefore, we propose that RNA-binding dictates the ability of optoTDP43 to form light-induced inclusions. In this model, LCD oligomerization of RNA-bound optoTDP-43 is blocked upon Cry2-mediated increases in local protein concentration while RNA-binding deficient optoTDP43 LCDs associate, thereby promoting inclusion formation (Figure 8A). This phenomenon could arise from a conformational change associated with nucleic acid binding, as shown for other RNA-binding proteins (Williamson, 2000). Nucleic acid binding also maintains the TDP-43 dimer and promotes solubility, potentially through an allosteric prevention of LCD:LCD interactions (Afroz et al., 2017; Sun et al., 2014). It is also possible that RNA-binding impedes TDP-43 homo-oligomerization through competitive inhibition. While the LCD appears to be dispensable for RNA binding (Buratti and Baralle, 2001), it contains an RGG motif that can mediate RNA interactions (Conicella et al., 2016). Consistent with this, RNA depletion results in the in vitro oligomerization and aggregation of a C-terminal TDP-43 cleavage product lacking RRM1 and a portion of RRM2 (TDP-25) (Kitamura et al., 2016). Contacts within the TDP-43 RRMs themselves may also cooperate and play a distinct role in the TDP-43 aggregation process, as both RRM1 and RRM2 can form tetrameric assemblies in vitro (Kuo et al., 2009), and the RRM2 contains various segments capable of forming amyloid-like conformations (Guenther et al., 2018). Overall, interactions between these domains and RNA may block regions that mediate aberrant TDP-43 phase transitions. Similarly, FUS LLPS is inhibited by the nuclear import receptor Karyopherin-β2 due to competitive interactions within domains that drive self-association (Guo et al., 2018; Yoshizawa et al., 2018).
Figure 8. RNA dependent model of TDP-43 proteinopathy.
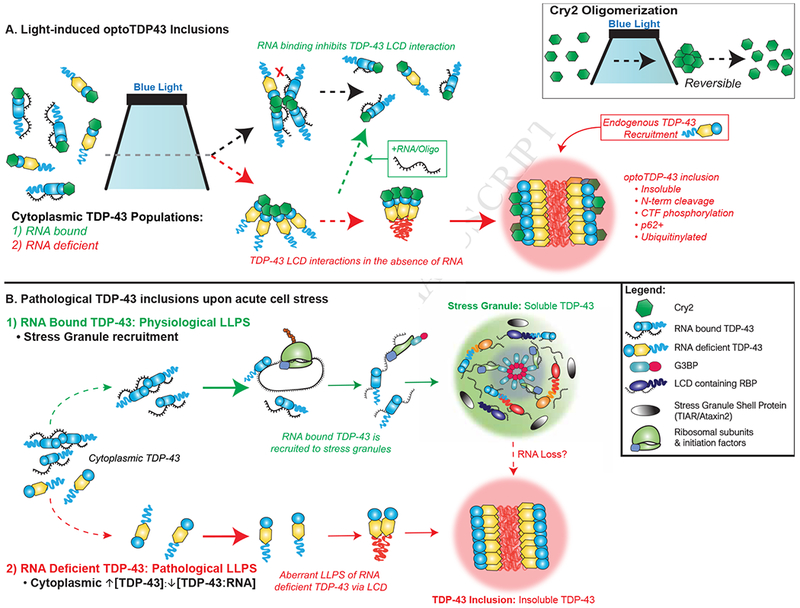
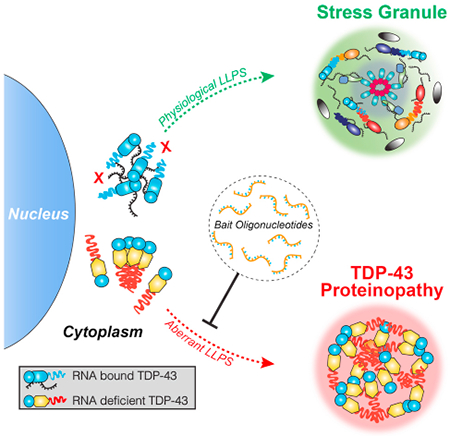
(A) Schematic of light-induced optoTDP43 inclusion formation. Cry2 photoreceptor reversibly homo-oligomerizes upon illumination (upper right corner). In the cytoplasm, light-induced increases in the focal concentration of RNA-unbound optoTDP43 (yellow) result in aberrant phase transitions that mature into insoluble inclusions capable of recruiting endogenous TDP—43. LCD interactions of RNA-bound optoTDP43 (blue) are blocked upon illumination, maintaining optoTDP43 solubility and inhibiting inclusion formation. Addition of TDP-43 target RNA sequences and bNAs inhibit aberrant phase transitions of optoTDP43. (B) Proposed role of SG localization and intracellular TDP-43 LLPS. Physiological LLPS: RNA-bound TDP-43 localizes to SGs and the LCD promotes physiological phase separation into a heterogeneous RNP environment. The abundance of additional LCD-containing RBPs and RNA species promotes transient hetero-molecular interactions and rapid exchange of molecules, which maintains the liquid-like state and solubility of the granule. Pathological LLPS: An altered stoichiometric balance of TDP-43:RNA substrates promote RNA-deficient TDP-43 interactions. These aberrant homo-molecular interactions through the LCD may initiate aberrant TDP-43 phase transitions into insoluble inclusions. Loss of SG RNA may also promote the liquid-to-solid transition of TDP-43.
Our work and other observations suggest that an altered TDP-43:RNA ratio creates an aggregation-prone environment for TDP-43 and serves as an upstream event in TDP-43 proteinopathy. This may occur due to disease causing mutations such as C9orf72 ALS/FTD that disrupt nuclear transport dynamics resulting in elevated cytoplasmic TDP-43 protein (Zhang et al., 2015b) and retention of RNA in the nucleus (Freibaum et al., 2015). Disease-causing mutations in the TDP-43 RRMs that abolish RNA binding have not yet been described. However, disease associated mutations within the TDP-43 LCD likely promote aberrant phase transitions of RNA-deficient TDP-43 proteins. This RNA-dependent model explains the aggregation of TDP-43 observed in overexpression models, in which insoluble inclusions may result from concentration-dependent phase transitions of cytoplasmic TDP-43 due to a lack of RNA substrates, as well as the cytoplasmic localization of TDP-43 inclusions observed in patient tissue (Scotter et al., 2015). Furthermore, this phenomenon likely serves as the convergence point for a number of pathways proposed to contribute to ALS/FTD including: altered TDP-43 expression, half-life and clearance; disrupted nucleocytoplasmic transport; and abnormal RNP assembly and trafficking (Boeynaems et al., 2016; Gopal et al., 2017; Ling et al., 2013). A TDP-43:RNA imbalance is further supported by a recent study indicating that RNAs are buffers to inhibit LLPS of nuclear RNA binding proteins (Maharana et al., 2018).
SG-mediated seeding may underly the formation of TDP-43 inclusions. For example, the modulation of SG components alleviates TDP-43 inclusion formation and toxicity in overexpression models (Becker et al., 2017; Elden et al., 2010; Kim et al., 2014). While previous studies show that both the TDP-43 RRMs and LCD are necessary for SG targeting (Colombrita et al., 2009), we show that TDP-43 RNA binding is required for SG localization. This is consistent with previous reports describing the RNA-dependent recruitment of ALS/FTD-linked FUS protein to SGs (Daigle et al., 2013). Furthermore, we observed that cytoplasmic TDP-43 excluded from acute SGs forms pathological inclusions lacking mRNA, whereas TDP-43 recruited to SGs is dynamic and mobile. This is likely due to the abundance of RNA and other LCD-containing RBPs within SGs. RNA itself has been shown to alter the properties of protein-rich droplets (Zhang et al., 2015a) and reduces droplet viscosity through dynamic protein:RNA interactions within LAF-1 droplets (Elbaum-Garfinkle et al., 2015). These dynamic protein:protein, protein:RNA, and RNA:RNA interactions within SGs likely contribute to the liquid-like properties of these structures and may convey a diminished propensity to initiate pathological maturation/fibrillization as compared to a more homogenous, protein-rich granule. Therefore, our findings may delineate between normal, physiological LLPS interactions, specifically in the formation of heterogeneously-composed membraneless organelles, and pathological homogeneous LLPS interactions prone to seed disease-associated protein inclusions (Figure 8B). However, this does not eliminate the possibility that altered SG dynamics contribute to the aggregation of TDP-43. For example, whereas RNA-containing SGs may initially inhibit TDP-43 proteinopathy, shifts in the SG composition to a more protein-saturated state might be capable of directly promoting TDP-43 LCD:LCD interactions. Consistent with this, prolonged stress was recently observed to elicit TDP-43-positive SGs that dissolve leaving phosphorylated TDP-43 (McGurk et al., 2018). Thus, there may be many roads to TDP-43 aggregation only some of which involve SGs (Boeynaems and Gitler, 2018).
It is unclear whether aberrant phase transitions or inclusions themselves are inherently neurotoxic and/or capable of driving neurodegeneration. ALS-linked mutations in TDP-43 that increase aggregation propensity result in enhanced toxicity in a variety of in vitro and in vivo models (Janssens and Van Broeckhoven, 2013). In contrast, neurodegeneration has also been characterized prior to significant accumulation of detergent-insoluble TDP-43 species in other systems (Arnold et al., 2013). TDP-43 sequestration within artificial inclusions recapitulates loss-of-function phenotypes (Prpar Mihevc et al., 2016) and TDP-43 knockout is embryonic lethal while conditional knockdown models produce ALS-like phenotypes in vivo (Xu and Yang, 2014). This suggests that perturbations in TDP-43 function, such as RNA processing, may also drive neurotoxicity. Our data indicate that cytoplasmic mislocalization precedes light-induced TDP-43 particle or inclusion formation and neuronal death, while neuroprotective oligonucleotide treatment delays/prevents these events. Thus, it is possible that cytoplasmic sequestration in the form of aberrant TDP-43 assemblies may produce neurodegeneration through both gain- and loss-of-function mechanisms.
In sum, we describe an optogenetic-based method to induce controlled TDP-43 proteinopathy in live cells and establish that RNA regulates the formation of TDP-43 inclusions. Our studies indicate that aberrant phase transitions are toxic to human cortical-like neuronal cells and future work will dissect the properties of toxic TDP-43 assemblies and the downstream processes that contribute to neurodegeneration. Finally, our data suggest bONs or bait nucleic acid (bNA) strategies can inhibit aberrant phase transitions of TDP-43, providing a potential therapeutic approach for future study.
STAR Methods
CONTACT FOR REAGENT AND RESOURCE SHARING
Further information and requests for resources and reagents should be directed to and will be fulfilled by the Lead Contact, Christopher Donnelly (chrisdonnelly@pitt.edu).
EXPERIMENTAL MODEL AND SUBJECT DETAILS
Cell culture
HEK293 cells (female, purchased from ATCC) were maintained in DMEM (Thermo Fisher Scientific) supplemented with 10% HyClone Bovine Growth Serum (GE Healthcare Life Sciences) and 1× GlutaMAX (Thermo Fisher Scientific) at 37 °C and 5% CO2. Cells were seeded onto coverslips or plates coated with collagen (50 μg/mL, Gibco) and allowed to incubate overnight prior to transfections (Lipofectamine 3000, Thermo Fisher Scientific) with 100 ng of DNA performed according to manufacturer’s instructions. Cells were plated on collagen-coated glass bottom plates for live-cell imaging, high throughput screening, and FRAP analysis. All manipulations of cells expressing optogenetic constructs were performed under red lamp illumination to avoid ambient light exposure.
Neuronal progenitor maintenance and differentiation
ReNcell VM (male, purchased from Millipore) were maintained and differentiated according to previously described protocols but with minor modifications (Donato et al., 2007). In brief, cells were maintained in proliferation media (DMEM/F-12, 1× GlutaMAX™ supplemented with 1× B27 (Gibco), 2 ng/mL heparin (Sigma), 20 μg/mL bFGF (Millipore) and 20 ug/mL hEGF (Millipore). Differentiation was initiated by plating ReNcell VM onto low attachment plates in proliferation media in order to establish neurosphere production. Neurospheres were then mechanically dissociated and grown to full confluency. Cells were further differentiated in DMEM/F-12, supplemented with 1× GlutaMAX™, 1× B27, 2 ng/mL GDNF (PeproTech) and 1 mM diburtyrl-cAMP (Tocris) for one week and then maintained in DMEM/F-12 supplemented with 1× GlutaMAX™, 1× B27, and 2 ng/mL GDNF. Neuronal differentiation was confirmed by immunofluorescence analysis of MAP2 and βIII-tubulin expression (see Figure S7) assessment of ability to fire action potentials (data not shown) prior to use.
ALS/FTLD human cases
All human brain and spinal cord tissue samples used in the present study were selected based upon primary clinical diagnoses of ALS/FTLD at the University of Pittsburgh Medical Center Alzheimer’s Disease Research Center or ALS-MDA clinic. Postmorten classification was performed for pathological characterization of TDP-43 inclusions by the University of Pittsburgh Neuropathology Department.
Lentiviral production and transduction
Lentiviral transfer vectors encoding optoTDP43, Cry2-mCh or iRFP670 were co-transfected with packaging plasmids (OriGene) into HEK293T cells using the Turbofectin transfection reagent (OriGene) according to manufacturer’s instructions. Following an initial media change, lentiviral supernatant was collected at 24 and 48 hr post-transfection prior to filtration and overnight incubation at 4 with 1× Lentivirus concentration solution (OriGene). The following day, concentrated lentiviral supernatant was centrifuged at 3,500 x g for 25 min at 4 . The resulting pellet was recentrifuged at 3,500 x g for 5 min prior to re-suspension in ice-cold, sterile PBS. Pellets were then allowed to dissolve for 1-2 days at 4 . Resuspended lentiviral particles were then aliquoted and titers were determined utilizing the One-Wash Lentivirus Titer Kit, HIV-1 p24 ELISA (OriGene). Neuron transductions were performed by diluting lentiviral particles at an MOI of 5 in neuronal differentiation media. Media changes were performed after 48 hr of incubation and all experiments were initiated at 96 hr post-transduction.
Stress treatments
Sodium arsenite (0.5 mM, 30 min) and heat shock (43 °C, 45 min) treatment were used to induce stress granule formation where indicated.
Blue light treatments
Blue light stimulation was performed in 24-well or 6-well plates using custom-built LED arrays designed to fit plate dimensions and withstand common temperature/humidity requirements of cell culture incubators. Individual LED diodes were positioned ~3.0 cm above the culture surface to provide a range of ~0.1-0.3 mW/cm2 of 465 nm light stimulation to the cultured cells.
RNA and oligonucleotide treatments
Total HEK293 RNA was extracted utilizing the miRNeasy RNA isolation kit (Qiagen) according to manufacturer’s instructions. RNA oligonucleotides with 2’OMe modifications were synthesized by GenScript (see Table S2 for sequence details). For experiments utilizing HEK293 cells, total RNA (2.5μg) or RNA oligonucleotides (200nM-1μM as indicated) were transfected into cells using the Lipofectamine RNAiMAX reagent (Thermo Fisher) according to manufacturer’s instructions. For ReNcell neuron experiments, oligonucleotides were diluted into normal differentiation medium at the indicated concentrations prior to direct addition to cells.
Bacterial growth and protein expression
For purification of MBP-tagged TDP-43 WT and 5FL proteins, BL21 (DE3) E. coli cell cultures were grown at 37°C to an OD600 of 0.6–0.9 as previously reported (Wang et al., 2018). Protein expression was induced by IPTG (1mM) prior to overnight incubation at 16°C. Cells were then harvested by centrifugation.
METHOD DETAILS
Cloning
All full-length and truncated optoTDP43 plasmids were constructed by inserting PCR-generated fragments at the SmaI restriction enzyme site by Gibson Assembly (HiFi DNA Assembly Master Mix, NEB) of Cry2olig-mCh and Cry2PHR-mCh base vectors (Plasmids 60032 and 26866, Addgene). TDP43-mCh was generated by inserting full-length TDP-43 CDS (synthesized by Genecopoeia) between the NheI and SmaI restriction enzyme sites of the Cry2olig-mCh backbone. All wild-type optoTDP43 vectors were constructed using the same TDP-43 insert. optoTDP43 constructs containing the TDP43cyto, 5FL and/or M337V point mutations were generated from mutant TDP43 plasmids (Plasmids 84912, 84914, 98674, Addgene). Constructs containing the fusRRM (WT or 4FL) were generated by three-fragment Gibson Assembly, inserting the fusRRM fragment and TDP-43 LCD simultaneously into the Cry2olig-mCh backbone at the SmaI restriction site. The plasmid encoding TDP as a C-terminal MBP-tagged protein (TDP43-MBP-His6) was purchased from Addgene (Plasmid 104480) and the 5FL mutant was generated via QuikChange Multi Site-directed Mutatagenesis (Agilent). EGFP-TDP43 constructs were generated by inserting the wild-type or mutant TDP-43 fragments between the HindIII and KpnI restriction enzyme sites of EGFP-alpha-synuclein vector (Plasmid 40822, Addgene). G3BP1-mCh was generated through the insertion of the full-length G3BP1 CDS (synthesized by Genecopoeia) into the mCherry2-C1 backbone (Plasmid 54563, Addgene) at the SmaI restriction site. See Table S2 for all primer sequences and backbone details.
Detergent solubility assay
Solubility of TDP-43 was assessed as previously described with minor modifications (van Eersel et al., 2011). In brief, cells were washed once with ice-cold PBS, lysed with modified RIPA buffer (25mM Tris-HCl pH 7.6 (Sigma-Aldrich), 150 mM NaCl (Millipore Sigma), 5 mM EDTA (Sigma-Aldrich), 1% Triton X-100 (Sigma-Aldrich), 1% sodium deoxycholate (Sigma-Aldrich), 0.1% SDS (Fisher Scientific), protease inhibitor cocktail (Sigma-Aldrich), 1 mM PMSF (Thermo Fisher Scientific), phosphatase inhibitor cocktails 2 and 3 (Sigma-Aldrich)) and incubated on ice for 10 min. Following brief sonication on ice, lysates or homogenates were centrifuged for 1 hr at 100,000 x g at 4 °C. Supernatants were collected as the detergent-soluble fraction. Protein concentrations were determined using the RC DC protein assay (Bio-Rad). Pellets were then resuspended in RIPA buffer and re-sonicated and re-centrifuged. The resulting supernatant was discarded and pellets were resuspended in urea buffer (30 mM Tris pH 8.5 (Sigma-Aldrich), 7 M urea (Sigma-Aldrich), 2 M thiourea (Sigma-Aldrich), 4% CHAPS (Thermo Fisher Scientific), protease inhibitor cocktail (Sigma-Aldrich), 1 mM PMSF (Thermo Fisher Scientific), phosphatase inhibitor cocktails 2 and 3 (Sigma-Aldrich)). Following brief sonication on ice, lysates were centrifuged for 1 hr at 100,000 x g at 22°C. This final supernatant was then collected as the detergent-insoluble, urea-soluble fraction. Proteins from each fraction were then separated by SDS-PAGE and analyzed by western blot analysis.
Nuclear/cytoplasmic fractionation
Nuclear/cytoplasmic subcellular fractionation was performed utilizing NE-PER Nuclear and Cytoplasmic Extraction Reagents (Thermo Fisher Scientific) according to manufacturer’s instructions. Protein concentrations for individual fractions were determined using the Pierce BCA Protein Assay Kit (Thermo Fisher Scientific) and subsequently analyzed by western blot.
Size-exclusion chromatography
A 90 mL Sephacryl S-300 column equilibrated in 25 mM Tris pH 7.8, 150 mM NaCl, 5 mM EDTA, 0.5% Triton X-100, 0.5% deoxycholate was calibrated with the size standards Blue Dextran (2000 kDa), Catalase (232 kDa), and Hemoglobin (60 kDa). Lysates from cells expressing optoTDP43 which had been subjected to blue light stimulation or darkness were loaded in a 0.5 mL volume and the column was run at a flow rate of 0.3 mL/min at 4°C. An initial volume of 30 mL was passed through the column, which corresponded to the column void volume, then 2.5 mL fractions were collected. A sample from each fraction was mixed with SDS sample buffer and subjected to SDS-PAGE, followed by western blotting as described below.
SDS-PAGE/Western blotting
Prior to SDS-PAGE, protein concentrations were determined using the Pierce BCA Protein Assay (Thermo Fisher Scientific) or RC DC Protein Assay (Bio-Rad). Samples were separated by SDS-PAGE (4-20% Mini-PROTEAN TGX Precast Gels, Bio-Rad) and transferred to PVDF membranes (Immobilon-FL, EMD Millipore) using the Trans-Blot Turbo Transfer System (Bio-Rad). Following water and TBS washes, membranes were blocked in Odyssey Blocking Buffer (Li-Cor) for 1 hr at room temperature. Membranes were then washed and incubated with primary antibodies in TBS-T (0.1% Tween) supplemented with 50% blocking buffer overnight at 4 °C. Primary antibody dilutions used were as follows: rabbit anti-TDP43 (Proteintech, 1:1000), mouse anti-α-tubulin (Sigma-Aldrich, 1:10000), rabbit anti-Lamin B1 (Abeam, 1:5000), rabbit anti-GAPDH (Sigma-Aldrich, 1:10000), mouse anti-mCherry (Novus Biologicals, 1:1000). Following TBS-T washes, membranes were incubated with secondary antibodies (Li-Cor, IRDye 680/800, 1:10000) for 1 hr at room temperature. Membranes were then washed with TBS-T and bands were visualized using the Odyssey CLx imaging system. All western blots shown are representative of results obtained from at least three biological replicates over three separate experiments.
Immunofluorescence
For standard immunofluorescence analysis, cells were then fixed with 4% PFA for 15 min at room temperature following one PBS wash. Following three additional PBS washes, cells were blocked with 5% normal donkey serum (NDS) in 0.3% Triton X-100 for 1 hr at room temperature. Primary antibodies were prepared in 1× PBS supplemented with 0.3% Triton X-100/5% NDS and cells were incubated in antibody solution overnight at 4°C. Primary antibody dilutions used were as follows: mouse anti-SQSTM1/p62 (Abeam, 1:100), rabbit anti-SQSTM1/p62 (Abeam, 1:500), rat anti-phospho TDP-43 (S409/410), Clone 1D3 (EMD Millipore, 1:200), rabbit anti-G3BP1 (Proteintech, 1:500), mouse anti-eIF4G (Santa Cruz, 1:300), rabbit anti-ATXN2 (Proteintech, 1:400), rabbit anti-TIAR (Santa Cruz, 1:300), mouse anti-digoxin (Jackson ImmunoResearch, 1:200), mouse anti-ubiquitin (Santa Cruz, 1:200). Following three PBS washes, secondary antibodies were diluted in 0.3% Triton X-100/5% NDS and incubated with cells for 1-2 hrs at room temperature. Cells were then washed and coverslips were mounted onto slides (ProLong Diamond Antifade Mounting Media with DAPI, Invitrogen) to be visualized by confocal microscopy.
For total RNA staining, cells were fixed in 100% methanol for 15 min at −20°C. Following three PBS washes, cells were incubated in SYTO® RNASelect™ Green Fluorescent Cell Stain (Thermo Fisher Scientific) staining solution (500 nM in PBS) for 20 min at room temperature. Cells were then washed three additional times in PBS prior to blocking and counterstaining as described above.
All images and quantification are representative of two or more independent experiments with at least three biological replicates per experiment. Random fields of view (9-16 per experiment) were acquired for quantification. This was performed utilizing unbiased, automated imaging protocols generated in Nikon Elements imaging software to position an automated stage. These positions were repeatedly imaged for longitudinal imaging. All images were acquired using identical settings within each experiment.
Immunohistochemistry
Formalin-fixed, paraffin-embedded human hippocampus and cervical spinal cord sections of ALS/FTLD subjects retrieved from the Neurodegenerative Brain Bank at the University of Pittsburgh, following protocols approved by the University of Pittsburgh Committee for Oversight of Research and Clinical Training Involving Decedents (CORID). Following antigen retrieval with Target Retrieval Solution, pH 9 (Dako Agilent), immunofluorescence staining was performed using the following primary antibodies: TIA1 (1:1000, Abeam), Ataxin 2 (1:50, Proteintech), G3BP1 (1:100, Proteintech) and pTDP-43 (1D3, 1:500, kindly provided by Manuela Neumann, Helmholtz Zentrum, Munich, Germany). Immunofluorescence signal was visualized using Alexa Fluor 488 and Cy3 labeled secondary antibodies (both 1:200, Jackson ImmunoResearch) and DAPI nuclear counterstain (1:1000, Thermo Scientific).
RNA Fluorescent In Situ Hybridization (RNA FISH)
RNA-FISH using PolyT (TTTTTTTTTTTTTTTTTTTTTTTTTVN/3Dig_N) (Exiqon) or scramble control (5DigN/GTGTAACACGTCTATACGCCCA) (Batch 233334, Exiqon) probes was conducted as previously described but with minor modifications (Zhang et al., 2015b). In short, cells were fixed in 3.2% PFA (Electron Microscopy Science), permeabilized for 10 min in 0.3% Triton X-100 (Sigma-Aldrich), equilibrated for 10 min in IX SSC (Thermo Fisher Scientific) and then incubated in 40% formamide (Sigma-Aldrich) at 55°C for 10 min. Hybridization buffer (100% formamide, 1 mg/mL BSA Fraction V (Fisher Scientific), 20 mM ribonucleoside vanadyl complex (Sigma-Aldrich), 0.1M NaPO4, 20× SSC) and then probe mixture (10 g/L salmon sperm (Thermo Fisher Scientific), 20 mg/mL E. Coli tRNA (Thermo Fisher Scientific), 80% formamide, 25 μM RNA-Probe preheated to 85 °C) were added to the cells for 2 hrs at 55°C. Next, the cells were washed with 40% formamide, IX SSC, TBS-50 pH 7.4, 5MNaCl (Thermo Fisher Scientific Scientific) 1M Tris pH 7 (Thermo Fisher Scientific), 1M Tris, pH 8 (Thermo Fisher Scientific Scientific)), and then IX PBS. Following a cross-linking step with 3.2% PFA and 0.3% Triton X-100, the cells were immunostained and washed with IF Buffer (TBS-50, 0.5 g BSA Fraction V, Protease-free BSA (Fisher Scientific)) and then incubated in blocking buffer (TBS-50, BSA Fraction V, 5% Normal Donkey Serum). Finally, the cells were incubated with primary antibodies at 4°C overnight, and the following day were washed with IF buffer and incubated with secondary antibodies for 1 hr at room temperature. Additional washes with IF Buffer, TBS-50, MgCl2, and 1× PBS were performed prior to mounting coverslips with ProLong Diamond Antifade Mounting Media and visualized by confocal microscopy.
Cell viability assays
Analysis of cell viability was performed utilizing the CellTiter Glo Luminescent Cell Viability Assay (Promega) according to manufacturer’s instructions. Treatment of cells with 0.1% Triton X-100 for 1 hr served as negative viability controls. Raw luminescence values were normalized to control group means and compared across experimental conditions. At least eight biological replicates were utilized per group for all experiments.
Microscopy
Live-cell imaging
All live-cell imaging experiments were performed on a Nikon A1 laser-scanning confocal microscope system outfitted with a Tokai HIT stagetop incubator utilizing 40× and/or 60× oil immersion objectives (CFI Plan Apo Lambda 60× Oil, Nikon; CFI Plan Fluor 40× Oil, Nikon). Following transfections and/or treatments, medium was changed to phenol red-free growth medium (Gibco) and cells were allowed to equilibrate on the preheated (37°C and 5% CO2) stagetop incubator for 10 min prior to imaging. Acute blue light stimulation was achieved by utilizing the 488nm laser line and the stimulation module within Nikon Elements imaging software. Activation duration varied from 1-8 sec and laser power ranged from 1-20% as indicated in different experiments. Stimulation regions of interest (ROIs) were drawn over fields of view prior to image acquisition. Following 2-5 baseline images, laser stimulation was performed and cells were imaged for up to 1 hr post-activation. Timing and order of image acquisition was alternated across experiments between experimental groups. Data presented are representative of at least two independent experiments utilizing three or more biological replicates per experiment.
Fluorescence Recovery After Photo-bleaching (FRAP) Imaging
Initially, granules or inclusions were identified using a 60× oil immersion objective by confocal microscopy and a 2×2 μm2 bleaching ROIs were drawn over objects of interest. Reference ROIs of the same size were drawn in adjacent, non-bleached cells to control for photo-bleaching. Following 2-5 baseline images, objects were bleached for 500 ms using 50% laser power (488nm or 594 nm laser lines) and cells were imaged for up to 5 min post-bleaching without delay. Data presented are representative of three or more independent experiments utilizing at least two biological replicates per experiment.
High-throughput LED Screening
Following transfection or transduction, plates were placed into a pre-warmed Tokai HIT stage-top incubator and allowed to equilibrate for 30 min prior to imaging. Custom 96-well LED arrays were positioned above wells to provide blue light stimulation (~0.3 mW, 465 nm) and were interfaced with Nikon Elements imaging software to cooperate with imaging protocols. Communication between the LED array and microscope occurred through a 5 V analog output transmitted from a Texas Instruments BNC-2110 triggering device. Voltage signals were interpreted by a microcontroller by taking real-time voltage measurements corresponding to a specific light group combination. Through the use of a map function, the software was able to assign a value to each light group and turn the group on or off following the reading of the corresponding value by the microcontroller. Automated imaging protocols were designed and executed utilizing the Jobs module within Nikon Elements imaging software. In brief, the microscope was first programmed to perform three sequential baseline plate scans prior to light exposure. Epifluorescent images were acquired with a Prime 95B CMOS camera (Photometries) using the ET-dsRED filter set (Chroma). Nine fields of view were imaged over time per well in duplicate per experiment per condition. Baseline images were acquired every 10 min for 30 min in total. This was followed by simultaneous blue light stimulation and image acquisition for up to 24 hrs. Every 10 min during the stimulation period, LED diodes were programmed to sequentially switch off and allow for image acquisition. Following completion of imaging within wells, LED diodes were programmed to switch back on to resume light stimulation and a subsequent set of diodes was programmed to turn off to allow for imaging. This pattern was repeated throughout the remainder of the imaged wells to complete the plate scan.
Recombinant protein purification
MBP-tagged TDP-43 WT and 5FL proteins were purified as previously reported (Wang et al., 2018). In brief, cells were harvested by centrifugation, resuspended in TDP-43 binding buffer (20mM Tris–Cl pH 8.0, 1 M NaCl, 10 mM imidazole, 10% (v/v) glycerol, 1 mM DTT), supplemented with complete EDTA-free protease inhibitor cocktail, and lysed via sonication. The protein was purified over Ni-NTA agarose beads (Qiagen) and eluted from the beads using 20mM Tris–Cl pH 8.0, 1 M NaCl, 300mM imidazole, 10% (v/v) glycerol, 1 mM DTT. The eluate was further purified over amylose resin (NEB) and eluted using 20mM Tris–Cl pH 8.0, 1 M NaCl, 10mM maltose, 10% (v/v) glycerol, 1mM DTT. The protein was concentrated, flash frozen in liquid N2, and stored as aliquots in −80°C until further use.
In vitro phase separation and aggregation assays
To induce formation of droplets, the proteins were first buffer exchanged into 20mM HEPES (pH 7.4), 150mM NaCl, and 1mM DTT using a Micro Bio-Spin P-6 Gel column (Bio-Rad). The protein was then centrifuged at 16,000 rpm for 10 min to remove any preformed aggregates and the protein concentration was measured via a Bradford assay. LLPS was initiated with the addition of 10% dextran (final buffer conditions of 5μM TDP43, 15mM Hepes (pH 7.4), 150mM NaCl, and 1mM DTT with the indicated amounts of total yeast RNA) and droplets were imaged using DIC microscopy.
To measure aggregation kinetics, TDP-43 was thawed and centrifuged at 16,000 rpm for 10 min. Protein concentration was measured via Bradford and TDP-43 WT or 5FL were diluted to a final concentration of 5μM (in 20mM Hepes (pH 7.0), 150mM NaCl, 1mM DTT, with indicated quantities of RNA). Aggregation was initiated by cleavage of the MBP tag using 5μg/mL TEV protease and monitored via turbidity measurements using a TECAN M1000 plate reader.
Electron Microscopy
Transmission electron microscopy (TEM) of purified TDP-43 WT and 5FL aggregates was performed as described previously (Guo et al., 2018). In brief, following the aggregation assays described above, 10μL of each sample was adsorbed onto 300-mesh Formvar/carbon-coated copper grids (Electron Microscopy Sciences, Hatfield, PA) and stained with 2% (w/v) uranyl acetate. Excess uranyl acetate solution was removed prior to drying of the grids. Samples were then imaged using a JEOL-1010T12 transmission electron microscope.
QUANTIFICATION AND STATISTICAL ANALYSIS
Image quantification and analysis
All image visualization and quantification was performed utilizing Nikon Elements Imaging Software and analyses were performed in a double-blind fashion. For fixed-cell image quantification of stress granule co-localization and granule size, 4-5 fields of view were analyzed per condition. EGFP-TDP43 granules were examined and percentages of granules co-localizing with stress granule markers (G3BP1, eIF4G) were calculated. Maximum intensity projections for each field of view were generated and granule area was determined using automated object detection.
For FRAP imaging experiments, mean fluorescence intensity was tracked within bleaching ROIs over time. Intensity values were corrected for photo-bleaching utilizing reference ROIs drawn within adjacent, non-bleached cells in the imaging field. Fluorescence intensity values were converted to percentages of baseline (pre-bleach) fluorescence intensity means, with minimum fluorescence intensity values collected throughout the imaging period set to 0%, and percentage fluorescence recovery to baseline values was plotted over time.
Time-lapse image sequences acquired during high-throughput LED screening were analyzed utilizing automated object recognition to identify intracellular optoTDP43 particles and inclusions. Objects were defined by fluorescence intensity and object area thresholding. The number of cells containing detected objects were tracked over time and divided by the total number of cells within the imaging field to generate percentage of cells with inclusions for each timepoint within the imaging sequence. Analysis of neuronal survival in longitudinal imaging datasets was performed through monitoring of the far-red iRFP670 fluorescent reporter. Cell death was defined by somatic rounding, neurite retraction/blebbing and loss of fluorescence signal. Times-of-death were recorded as the last timepoint at which neurons were observed to be alive and were used to generate Kaplan-Meier survival curves.
Quantification of light-induced granule formation and dissociation was performed using the spot detection function within Nikon Elements imaging software. Granules were identified according to size and contrast thresholding. Granule number per cell was monitored over time in pre-identified cells that were labeled by an ROI. Raw granule number per cell values were first normalized to baseline values per cell over time. In order to calculate normalized granule number per cell over time, a weighted baseline intensity and cell area was determined. Baseline cell fluorescence intensity and area were determined from the image acquired prior to light stimulation and from this means were calculated across all experimental groups to control for differences in protein concentration and cell size. Total group baseline mean fluorescence intensity and cell area were then used to weight granule number values per cell by dividing individual cell values by total group means. For granule dissociation rate quantification, raw granule number per cell values were first normalized to baseline values. Normalized granule number values were then converted to percentages of each individual cell’s maximum granule number per stimulation cycle. Mean percentages of cell maximum granule number were then plotted over time for each stimulation cycle.
Statistics
Statistical significance was calculated by Graphpad Prism software (Version 7.03) and resulting P values less than or equal to 0.05 were deemed to be significant. Unpaired Student’s t-tests were used to determine statistical significance in data sets comparing two variables. Two-way ANOVAs with Sidak Post-hoc analysis was used for comparisons of FRAP and granule formation/intracellular inclusion screening curves. Pearson’s correlations were performed to determine r2 values between data sets. Exponential decay nonlinear regression analysis was performed to compare optoLCD dissociation curves across groups. For survival analysis, Kaplan-Meier estimates were used to generate survival curves and Gehan-Breslow-Wilcoxon tests were used to compare across groups. Cumulative risk-of-death curves were generated as described previously (Malik et al., 2018) using custom scripts in RStudio. Sample sizes for previously published experimental paradigms matched or exceed those established in the literature across. n values described in text and figure legends represent number of cells per experimental group, unless otherwise indicated, across multiple independent experiments (see Figure Legends for details).
Supplementary Material
Mann et al. describe an optogenetic technique to generate neurotoxic TDP-43 assemblies found in ALS patient neurons. They show that aberrant phase transitions of TDP-43 is driven by its RNA binding status and develop an approach to prevent this neuropathology.
optoTDP43 is a light-inducible model of TDP-43 proteinopathy and is neurotoxic
RNA binding antagonizes aberrant liquid-liquid phase separation (LLPS) of TDP-43
Acute recruitment to RNA-containing stress granules maintains TDP-43 solubility
TDP-43 targeting oligonucleotides prevent aberrant LLPS and rescue neurotoxicity
Acknowledgements
We thank Dr. Sami Barmada, MD, Ph.D. (University of Michigan Medical Center) for assisting with Cumulative Risk of Death Analysis and Yunhong Huang (University of Pittsburgh, Thathiah Lab) for his assistance with the human ALS/FTD patient protein analysis. This work was supported by grants from NIH (R01NS105756 and R21NS098379 to CJD; R01GM099836 & R21NS090205 to JS; and GM075061 and DK079307 to JLB). Additional support was provided by the LiveLikeLou Fund at the Pittsburgh Foundation, the the University of Pittsburgh Brain Institute, and a generous gift from Barbara McCormick to. CJD. CJD was supported by fellowships from Target ALS and the Frick Foundation for ALS Research. JRM is a recipient of a graduate fellowship from the Center for Protein Conformational Diseases at the University of Pittsburgh. AMG is a recipient of the Milton Safenowitz Postdoctoral Fellowship from the ALS Association. JS was supported by grants from the University of Pennsylvania Department of Biochemistry and Biophysics Pilot Grant Program, Life Extension Foundation, the ALS Association, Target ALS, and the Robert Packard Center for ALS Research at Johns Hopkins. JKK was supported by the University of Pittsburgh Alzheimer’s Disease Research Center and grants from the NIH (P50AG005133).
Footnotes
Publisher's Disclaimer: This is a PDF file of an unedited manuscript that has been accepted for publication. As a service to our customers we are providing this early version of the manuscript. The manuscript will undergo copyediting, typesetting, and review of the resulting proof before it is published in its final citable form. Please note that during the production process errors may be discovered which could affect the content, and all legal disclaimers that apply to the journal pertain.
Competing Interests
No competing financial interests to declare. Dr. Christopher Donnelly and Jacob Mann are inventors of intellectual property described in this manuscript and submitted as provisional patents by the University of Pittsburgh.
References
- Afroz T, Hock E-M, Ernst P, Foglieni C, Jambeau M, Gilhespy LAB, Laferriere F, Maniecka Z, Plückthun A, Mittl P, et al. (2017). Functional and dynamic polymerization of the ALS-linked protein TDP-43 antagonizes its pathologic aggregation. Nat. Commun 8, 45. [DOI] [PMC free article] [PubMed] [Google Scholar]
- Al-Sarraj S, King A, Troakes C, Smith B, Maekawa S, Bodi I, Rogelj B, Al-Chalabi A, Hortobágyi T, and Shaw CE (2011). p62 positive, TDP-43 negative, neuronal cytoplasmic and intranuclear inclusions in the cerebellum and hippocampus define the pathology of C9orf72-linked FTLD and MND/ALS. Acta Neuropathol 122, 691–702. [DOI] [PubMed] [Google Scholar]
- Anderson P, and Kedersha N (2008). Stress granules: the Tao of RNA triage. Trends Biochem. Sci 33, 141–150. [DOI] [PubMed] [Google Scholar]
- Arnold ES, Ling S-C, Huelga SC, Lagier-Tourenne C, Polymenidou M, Ditsworth D, Kordasiewicz HB, McAlonis-Downes M, Platoshyn O, Parone PA, et al. (2013). ALS-linked TDP-43 mutations produce aberrant RNA splicing and adult-onset motor neuron disease without aggregation or loss of nuclear TDP-43. Proc. Natl. Acad. Sci. USA 110, E736–45. [DOI] [PMC free article] [PubMed] [Google Scholar]
- Ayala YM, De Conti L, Avendaño-Vázquez SE, Dhir A, Romano M, D’Ambrogio A, Tollervey J, Ule J, Baralle M, Buratti E, et al. (2011). TDP-43 regulates its mRNA levels through a negative feedback loop. EMBO J 30, 277–288. [DOI] [PMC free article] [PubMed] [Google Scholar]
- Baloh RH (2011). TDP-43: the relationship between protein aggregation and neurodegeneration in amyotrophic lateral sclerosis and frontotemporal lobar degeneration. FEBS J 278, 3539–3549. [DOI] [PMC free article] [PubMed] [Google Scholar]
- Becker LA, Huang B, Bieri G, Ma R, Knowles DA, Jafar-Nejad P, Messing J, Kim HJ, Soriano A, Auburger G, et al. (2017). Therapeutic reduction of ataxin-2 extends lifespan and reduces pathology in TDP-43 mice. Nature 544, 367–371. [DOI] [PMC free article] [PubMed] [Google Scholar]
- Bentmann E, Neumann M, Tahirovic S, Rodde R, Dormann D, and Haass C (2012). Requirements for stress granule recruitment of fused in sarcoma (FUS) and TAR DNA-binding protein of 43 kDa (TDP-43). J. Biol. Chem 287, 23079–23094. [DOI] [PMC free article] [PubMed] [Google Scholar]
- Bhardwaj A, Myers MP, Buratti E, and Baralle FE (2013). Characterizing TDP-43 interaction with its RNA targets. Nucleic Acids Res 41, 5062–5074. [DOI] [PMC free article] [PubMed] [Google Scholar]
- Boeynaems S, and Gitler AD (2018). Pour Some Sugar on TDP(-43). Mol. Cell 71, 649–651. [DOI] [PubMed] [Google Scholar]
- Boeynaems S, Bogaert E, Van Damme P, and Van Den Bosch L (2016). Inside out: the role of nucleocytoplasmic transport in ALS and FTLD. Acta Neuropathol 132, 159–173. [DOI] [PMC free article] [PubMed] [Google Scholar]
- Brangwynne CP, Eckmann CR, Courson DS, Rybarska A, Hoege C, Gharakhani J, Jülicher F, and Hyman AA (2009). Germline P granules are liquid droplets that localize by controlled dissolution/condensation. Science 324, 1729–1732. [DOI] [PubMed] [Google Scholar]
- Brangwynne CP, Tompa P, and Pappu RV (2015). Polymer physics of intracellular phase transitions. Nat. Phys 11, 899–904. [Google Scholar]
- Buratti E, and Baralle FE (2001). Characterization and functional implications of the RNA binding properties of nuclear factor TDP-43, a novel splicing regulator of CFTR exon 9. J. Biol. Chem 276, 36337–36343. [DOI] [PubMed] [Google Scholar]
- Chang C, Wu T-H, Wu C-Y, Chiang M, Toh EK-W, Hsu Y-C, Lin K-F, Liao Y, Huang T, and Huang JJ-T (2012). The N-terminus of TDP-43 promotes its oligomerization and enhances DNA binding affinity. Biochem. Biophys. Res. Commun 425, 219–224. [DOI] [PubMed] [Google Scholar]
- Colombrita C, Zennaro E, Fallini C, Weber M, Sommacal A, Buratti E, Silani V, and Ratti A (2009). TDP-43 is recruited to stress granules in conditions of oxidative insult. J. Neurochem 111, 1051–1061. [DOI] [PubMed] [Google Scholar]
- Conicella AE, Zerze GH, Mittal J, and Fawzi NL (2016). ALS Mutations Disrupt Phase Separation Mediated by α-Helical Structure in the TDP-43 Low-Complexity C-Terminal Domain. Structure 24, 1537–1549. [DOI] [PMC free article] [PubMed] [Google Scholar]
- Daigle JG, Lanson NA, Smith RB, Casci I, Maltare A, Monaghan J, Nichols CD, Kryndushkin D, Shewmaker F, and Pandey UB (2013). RNA-binding ability of FUS regulates neurodegeneration, cytoplasmic mislocalization and incorporation into stress granules associated with FUS carrying ALS-linked mutations. Hum. Mol. Genet 22, 1193–1205. [DOI] [PMC free article] [PubMed] [Google Scholar]
- Donato R, Miljan EA, Hines SJ, Aouabdi S, Pollock K, Patel S, Edwards FA, and Sinden JD (2007). Differential development of neuronal physiological responsiveness in two human neural stem cell lines. BMC Neurosci 8, 36. [DOI] [PMC free article] [PubMed] [Google Scholar]
- Elbaum-Garfinkle S, Kim Y, Szczepaniak K, Chen CC-H, Eckmann CR, Myong S, and Brangwynne CP (2015). The disordered P granule protein LAF-1 drives phase separation into droplets with tunable viscosity and dynamics. Proc. Natl. Acad. Sci. USA 112, 7189–7194. [DOI] [PMC free article] [PubMed] [Google Scholar]
- Elden AC, Kim H-T, Hart MP, Chen-Plotkin AS, Johnson BS, Fang X, Armakola M, Geser F, Greene R, Lu MM, et al. (2010). Ataxin-2 intermediate-length polyglutamine expansions are associated with increased risk for ALS. Nature 466, 1069–1075. [DOI] [PMC free article] [PubMed] [Google Scholar]
- Fernandes N, Eshleman N, and Buchan JR (2018). Stress granules and ALS: A case of causation or correlation? Adv. Neurobiol 20, 173–212. [DOI] [PubMed] [Google Scholar]
- Freibaum BD, Lu Y, Lopez-Gonzalez R, Kim NC, Almeida S, Lee K-H, Badders N, Valentine M, Miller BL, Wong PC, et al. (2015). GGGGCC repeat expansion in C9orf72 compromises nucleocytoplasmic transport. Nature 525, 129–133. [DOI] [PMC free article] [PubMed] [Google Scholar]
- Gopal PP, Nirschl JJ, Klinman E, and Holzbaur ELF (2017). Amyotrophic lateral sclerosis-linked mutations increase the viscosity of liquid-like TDP-43 RNP granules in neurons. Proc. Natl. Acad. Sci. USA 114, E2466–E2475. [DOI] [PMC free article] [PubMed] [Google Scholar]
- Guenther EL, Ge P, Trinh H, Sawaya MR, Cascio D, Boyer DR, Gonen T, Zhou ZH, and Eisenberg DS (2018). Atomic-level evidence for packing and positional amyloid polymorphism by segment from TDP-43 RRM2. Nat. Struct. Mol. Biol 25, 311–319. [DOI] [PMC free article] [PubMed] [Google Scholar]
- Guo L, Kim HJ, Wang H, Monaghan J, Freyermuth F, Sung JC, O’Donovan K, Fare CM, Diaz Z, Singh N, et al. (2018). Nuclear-Import Receptors Reverse Aberrant Phase Transitions of RNA-Binding Proteins with Prion-like Domains. Cell 173, 677–692. e20. [DOI] [PMC free article] [PubMed] [Google Scholar]
- Harrison AF, and Shorter J (2017). RNA-binding proteins with prion-like domains in health and disease. Biochem. J 474, 1417–1438. [DOI] [PMC free article] [PubMed] [Google Scholar]
- Janssens J, and Van Broeckhoven C (2013). Pathological mechanisms underlying TDP-43 driven neurodegeneration in FTLD-ALS spectrum disorders. Hum. Mol. Genet 22, R77–87. [DOI] [PMC free article] [PubMed] [Google Scholar]
- Johnson BS, Snead D, Lee JJ, McCaffery JM, Shorter J, and Gitler AD (2009). TDP-43 is intrinsically aggregation-prone, and amyotrophic lateral sclerosis-linked mutations accelerate aggregation and increase toxicity. J. Biol. Chem 284, 20329–20339. [DOI] [PMC free article] [PubMed] [Google Scholar]
- Kim H-J, Raphael AR, LaDow ES, McGurk L, Weber RA, Trojanowski JQ, Lee VM-Y, Finkbeiner S, Gitler AD, and Bonini NM (2014). Therapeutic modulation of eIF2α phosphorylation rescues TDP-43 toxicity in amyotrophic lateral sclerosis disease models. Nat. Genet 46, 152–160. [DOI] [PMC free article] [PubMed] [Google Scholar]
- Kitamura A, Nakayama Y, Shibasaki A, Taki A, Yuno S, Takeda K, Yahara M, Tanabe N, and Kinjo M (2016). Interaction of RNA with a C-terminal fragment of the amyotrophic lateral sclerosis-associated TDP43 reduces cytotoxicity. Sci. Rep 6, 19230. [DOI] [PMC free article] [PubMed] [Google Scholar]
- Köhler A, and Hurt E (2007). Exporting RNA from the nucleus to the cytoplasm. Nat. Rev. Mol. Cell Biol 8, 761–773. [DOI] [PubMed] [Google Scholar]
- Kuo P-H, Doudeva LG, Wang Y-T, Shen C-KJ, and Yuan HS (2009). Structural insights into TDP-43 in nucleic-acid binding and domain interactions. Nucleic Acids Res 37, 1799–1808. [DOI] [PMC free article] [PubMed] [Google Scholar]
- Ling S-C, Polymenidou M, and Cleveland DW (2013). Converging mechanisms in ALS and FTD: disrupted RNA and protein homeostasis. Neuron 79, 416–438. [DOI] [PMC free article] [PubMed] [Google Scholar]
- Mackenzie IR, Arzberger T, Kremmer E, Troost D, Lorenzl S, Mori K, Weng S-M, Haass C, Kretzschmar HA, Edbauer D, et al. (2013). Dipeptide repeat protein pathology in C9ORF72 mutation cases: clinico-pathological correlations. Acta Neuropathol 126, 859–879. [DOI] [PubMed] [Google Scholar]
- Maharana S, Wang J, Papadopoulos DK, Richter D, Pozniakovsky A, Poser I, Bickle M, Rizk S, Guillén-Boixet J, Franzmann TM, et al. (2018). RNA buffers the phase separation behavior of prion-like RNA binding proteins. Science 360, 918–921. [DOI] [PMC free article] [PubMed] [Google Scholar]
- McGurk L, Gomes E, Guo L, Mojsilovic-Petrovic J, Tran V, Kalb RG, Shorter J, and Bonini NM (2018). Poly(ADP-Ribose) Prevents Pathological Phase Separation of TDP-43 by Promoting Liquid Demixing and Stress Granule Localization. Mol. Cell 71, 703–717. e9. [DOI] [PMC free article] [PubMed] [Google Scholar]
- McKee AC, Gavett BE, Stern RA, Nowinski CJ, Cantu RC, Kowall NW, Perl DP, Hedley-Whyte ET, Price B, Sullivan C, et al. (2010). TDP-43 proteinopathy and motor neuron disease in chronic traumatic encephalopathy. J. Neuropathol. Exp. Neurol 69, 918–929. [DOI] [PMC free article] [PubMed] [Google Scholar]
- Molliex A, Temirov J, Lee J, Coughlin M, Kanagaraj AP, Kim HJ, Mittag T, and Taylor JP (2015). Phase separation by low complexity domains promotes stress granule assembly and drives pathological fibrillization. Cell 163, 123–133. [DOI] [PMC free article] [PubMed] [Google Scholar]
- Mompeán M, Romano V, Pantoja-Uceda D, Stuani C, Baralle FE, Buratti E, and Laurents DV (2017). Point mutations in the N-terminal domain of transactive response DNA-binding protein 43 kDa (TDP-43) compromise its stability, dimerization, and functions. J. Biol. Chem 292, 11992–12006. [DOI] [PMC free article] [PubMed] [Google Scholar]
- Neumann M, Sampathu DM, Kwong LK, Truax AC, Micsenyi MC, Chou TT, Bruce J, Schuck T, Grossman M, Clark CM, et al. (2006). Ubiquitinated TDP-43 in frontotemporal lobar degeneration and amyotrophic lateral sclerosis. Science 314, 130–133. [DOI] [PubMed] [Google Scholar]
- Neumann M, Kwong LK, Truax AC, Vanmassenhove B, Kretzschmar HA, Van Deerlin VM, Clark CM, Grossman M, Miller BL, Trojanowski JQ, et al. (2007). TDP-43-positive white matter pathology in frontotemporal lobar degeneration with ubiquitin-positive inclusions. J. Neuropathol. Exp. Neurol 66, 177–183. [DOI] [PubMed] [Google Scholar]
- Nguyen HP, Van Broeckhoven C, and van der Zee J (2018). ALS Genes in the Genomic Era and their Implications for FTD. Trends Genet 34, 404–423. [DOI] [PubMed] [Google Scholar]
- Nott TJ, Petsalaki E, Farber P, Jervis D, Fussner E, Plochowietz A, Craggs TD, Bazett-Jones DP, Pawson T, Forman-Kay JD, et al. (2015). Phase transition of a disordered nuage protein generates environmentally responsive membraneless organelles. Mol. Cell 57, 936–947. [DOI] [PMC free article] [PubMed] [Google Scholar]
- Patel SS, Belmont BJ, Sante JM, and Rexach MF (2007). Natively unfolded nucleoporins gate protein diffusion across the nuclear pore complex. Cell 129, 83–96. [DOI] [PubMed] [Google Scholar]
- Philips T, and Rothstein JD (2015). Rodent models of amyotrophic lateral sclerosis. Curr. Protoc. Pharmacol 69, 5.67.1–21. [DOI] [PMC free article] [PubMed] [Google Scholar]
- Prpar Mihevc S, Baralle M, Buratti E, and Rogelj B (2016). TDP-43 aggregation mirrors TDP-43 knockdown, affecting the expression levels of a common set of proteins. Sci. Rep 6, 33996. [DOI] [PMC free article] [PubMed] [Google Scholar]
- Schmidt HB, and Rohatgi R (2016). In Vivo Formation of Vacuolated Multi-phase Compartments Lacking Membranes. Cell Rep 16, 1228–1236. [DOI] [PMC free article] [PubMed] [Google Scholar]
- Scotter EL, Chen H-J, and Shaw CE (2015). TDP-43 Proteinopathy and ALS: Insights into Disease Mechanisms and Therapeutic Targets. Neurotherapeutics 12, 352–363. [DOI] [PMC free article] [PubMed] [Google Scholar]
- Shin Y, and Brangwynne CP (2017). Liquid phase condensation in cell physiology and disease. Science 357. [DOI] [PubMed] [Google Scholar]
- Shin Y, Berry J, Pannucci N, Haataja MP, Toettcher JE, and Brangwynne CP (2017). Spatiotemporal Control of Intracellular Phase Transitions Using Light-Activated optoDroplets. Cell 168, 159–171. e14. [DOI] [PMC free article] [PubMed] [Google Scholar]
- Sun Y, and Chakrabartty A (2017). Phase to Phase with TDP-43. Biochemistry 56, 809–823. [DOI] [PubMed] [Google Scholar]
- Sun Y, Arslan PE, Won A, Yip CM, and Chakrabartty A (2014). Binding of TDP-43 to the 3’UTR of its cognate mRNA enhances its solubility. Biochemistry 53, 5885–5894. [DOI] [PubMed] [Google Scholar]
- Taslimi A, Vrana JD, Chen D, Borinskaya S, Mayer BJ, Kennedy MJ, and Tucker CL (2014). An optimized optogenetic clustering tool for probing protein interaction and function. Nat. Commun 5, 4925. [DOI] [PMC free article] [PubMed] [Google Scholar]
- Wang A, Conicella AE, Schmidt HB, Martin EW, Rhoads SN, Reeb AN, Nourse A, Ramirez Montero D, Ryan VH, Rohatgi R, et al. (2018). A single N-terminal phosphomimic disrupts TDP-43 polymerization, phase separation, and RNA splicing. EMBO J 37. [DOI] [PMC free article] [PubMed] [Google Scholar]
- Williamson JR (2000). Induced fit in RNA-protein recognition. Nat. Struct. Biol 7, 834–837. [DOI] [PubMed] [Google Scholar]
- Xu Z, and Yang C (2014). TDP-43-The key to understanding amyotrophic lateral sclerosis. Rare Dis 2, e944443. [DOI] [PMC free article] [PubMed] [Google Scholar]
- Yoshizawa T, Ali R, Jiou J, Fung HYJ, Burke KA, Kim SJ, Lin Y, Peeples WB, Saltzberg D, Soniat M, et al. (2018). Nuclear Import Receptor Inhibits Phase Separation of FUS through Binding to Multiple Sites. Cell 173, 693–705. e22. [DOI] [PMC free article] [PubMed] [Google Scholar]
- Youmans KL, and Wolozin B (2012). TDP-43: a new player on the AD field? Exp. Neurol 237, 90–95. [DOI] [PMC free article] [PubMed] [Google Scholar]
- Zhang H, Elbaum-Garfinkle S, Langdon EM, Taylor N, Occhipinti P, Bridges AA, Brangwynne CP, and Gladfelter AS (2015a). RNA controls polyq protein phase transitions. Mol. Cell 60, 220–230. [DOI] [PMC free article] [PubMed] [Google Scholar]
- Zhang K, Donnelly CJ, Haeusler AR, Grima JC, Machamer JB, Steinwald P, Daley EL, Miller SJ, Cunningham KM, Vidensky S, et al. (2015b). The C9orf72 repeat expansion disrupts nucleocytoplasmic transport. Nature 525, 56–61. [DOI] [PMC free article] [PubMed] [Google Scholar]
- Zhang Y-J, Xu Y-F, Cook C, Gendron TF, Roettges P, Link CD, Lin W-L, Tong J, Castanedes-Casey M, Ash P, et al. (2009). Aberrant cleavage of TDP-43 enhances aggregation and cellular toxicity. Proc. Natl. Acad. Sci. USA 106, 7607–7612. [DOI] [PMC free article] [PubMed] [Google Scholar]
Associated Data
This section collects any data citations, data availability statements, or supplementary materials included in this article.