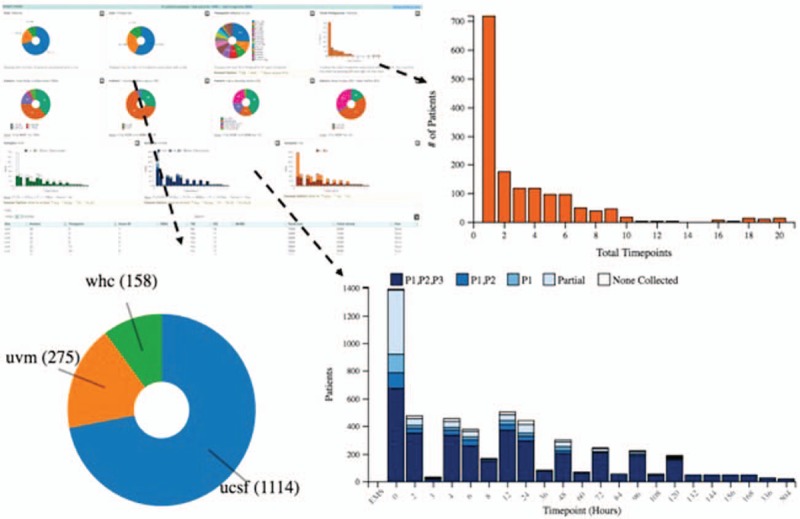
Fig. 3.
SysBioCube, Sample Tracker.

Screen shot of the sample tracker tool and examples of forms of data representation for interactive tracking of the samples collected using this tool. Bar chart displaying the number of time points and patients with available samples, pie chart to display the number of patients from different clinical sites, and stacked bar charts displaying the number of patient samples available at each time point based on the volumes collected.
