

Abstract
Background
Shared care has been used in the management of many chronic conditions with the assumption that it delivers better care than primary or specialty care alone; however, little is known about the effectiveness of shared care.
Objectives
To determine the effectiveness of shared care health service interventions designed to improve the management of chronic disease across the primary/specialty care interface. This is an update of a previously published review.
Secondary questions include the following:
1. Which shared care interventions or portions of shared care interventions are most effective?
2. What do the most effective systems have in common?
Search methods
We searched MEDLINE, Embase and the Cochrane Library to 12 October 2015.
Selection criteria
One review author performed the initial abstract screen; then two review authors independently screened and selected studies for inclusion. We considered randomised controlled trials (RCTs), non‐randomised controlled trials (NRCTs), controlled before‐after studies (CBAs) and interrupted time series analyses (ITS) evaluating the effectiveness of shared care interventions for people with chronic conditions in primary care and community settings. The intervention was compared with usual care in that setting.
Data collection and analysis
Two review authors independently extracted data from the included studies, evaluated study quality and judged the certainty of the evidence using the GRADE approach. We conducted a meta‐analysis of results when possible and carried out a narrative synthesis of the remainder of the results. We presented the results in a 'Summary of findings' table, using a tabular format to show effect sizes for all outcome types.
Main results
We identified 42 studies of shared care interventions for chronic disease management (N = 18,859), 39 of which were RCTs, two CBAs and one an NRCT. Of these 42 studies, 41 examined complex multi‐faceted interventions and lasted from six to 24 months. Overall, our confidence in results regarding the effectiveness of interventions ranged from moderate to high certainty. Results showed probably few or no differences in clinical outcomes overall with a tendency towards improved blood pressure management in the small number of studies on shared care for hypertension, chronic kidney disease and stroke (mean difference (MD) 3.47, 95% confidence interval (CI) 1.68 to 5.25)(based on moderate‐certainty evidence). Mental health outcomes improved, particularly in response to depression treatment (risk ratio (RR) 1.40, 95% confidence interval (CI) 1.22 to 1.62; six studies, N = 1708) and recovery from depression (RR 2.59, 95% CI 1.57 to 4.26; 10 studies, N = 4482) in studies examining the 'stepped care' design of shared care interventions (based on high‐certainty evidence). Investigators noted modest effects on mean depression scores (standardised mean difference (SMD) ‐0.29, 95% CI ‐0.37 to ‐0.20; six studies, N = 3250). Differences in patient‐reported outcome measures (PROMs), processes of care and participation and default rates in shared care services were probably limited (based on moderate‐certainty evidence). Studies probably showed little or no difference in hospital admissions, service utilisation and patient health behaviours (with evidence of moderate certainty).
Authors' conclusions
This review suggests that shared care improves depression outcomes and probably has mixed or limited effects on other outcomes. Methodological shortcomings, particularly inadequate length of follow‐up, may account in part for these limited effects. Review findings support the growing evidence base for shared care in the management of depression, particularly stepped care models of shared care. Shared care interventions for other conditions should be developed within research settings, with account taken of the complexity of such interventions and awareness of the need to carry out longer studies to test effectiveness and sustainability over time.
Plain language summary
Shared care across the interface between primary and specialty care in chronic disease management
What is the aim of this review?
We conducted this Cochrane review to find out if shared care between primary and specialty care physicians improves outcomes for patients with chronic conditions. Cochrane researchers collected and analysed studies to answer this question and found 42 studies relevant for inclusion.
Key messages
This review suggests that shared care is effective for managing depression. Shared care interventions for other conditions should be developed within research settings, so that further evidence can be considered before they are introduced routinely into health systems.
What was studied in this review?
We have defined shared care across the primary/specialty interface as joint participation of primary care physicians and specialty care physicians in planned delivery of care. This may be informed by enhanced information exchange, over and above routine discharge and referral notices. This approach has the potential to improve the management of chronic disease while leading to better outcomes than are attained by primary or specialty care alone.
What are the main results of the review?
Review authors found 42 relevant studies; 39 were randomised controlled trials. Studies were based in 12 different countries that use a range of healthcare systems. Investigators examined shared care for a range of chronic conditions, with diabetes and depression the most commonly included. Most studies examined shared care interventions that consisted of multiple elements and lasted an average of 12 months.
Study results suggest that shared care Interventions lead to improved outcomes for patients with depression. However, effects of shared care on a range of other outcomes are less certain. Shared care probably has limited or no effect on clinical outcomes, apart from modest effects on improving blood pressure management and mixed effects on patient‐reported outcome measures (such as quality of life and ability to carry out daily tasks), medication prescribing and use, participation in shared care services and management of risk factors. Shared care probably would have little or no effect on hospital admissions, use of services and patient health behaviours.
How up‐to‐date is this review?
Review authors searched for studies that had been published up to October 2015.
Summary of findings
for the main comparison.
| Shared care compared with usual care for patients with chronic conditions | |||
|
Patient or population: adults with chronic conditions Settings: primary care and community settings Intervention: shared care defined as joint participation of primary care physicians and specialty care physicians in planned delivery of care, informed by an enhanced information exchange over and above routine discharge and referral notices Comparison: usual care | |||
| Outcomes | Impacts | Number of studies (participants) | Certainty of the evidence (GRADE) |
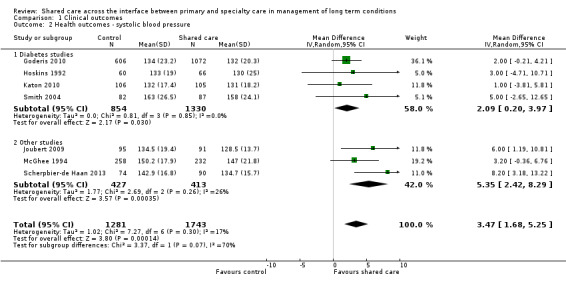
| Clinical outcomes: physical heath | Results show probably little or no difference in clinical outcomes related to physical health but a tendency towards improved blood pressure management in the few studies conducted to examine blood pressure outcomes in shared care studies for hypertension (one study, N = 490) diabetes (seven studies, N = 2184), chronic kidney disease (one study, N = 181) and stroke (one study, N = 186) (mean difference (MD) 3.47, 95% confidence interval (CI) 1.68 to 5.25) | 16 (6977) |
⊕⊕⊕⊖ Moderatea |
| Clinical outcomes: mental health | Shared care results in improved response to depression treatment (risk ratio (RR) 1.40, 95% confidence interval (CI) 1.22 to 1.62; six studies, N = 1708) and greater recovery from depression (RR 2.59, 95% CI 1.57 to 4.26; 10 studies, N = 4482) in studies examining the 'stepped care' design of shared care interventions (10 studies, N = 4482) Shared care has moderate effects on mean depression scores (standardised mean difference (SMD) ‐0.29, 95% CI ‐0.37 to ‐0.20; six studies, N = 3250) | 18 (6243) |
⊕⊕⊕⊕ Highb |
| Patient‐reported outcome measures (PROMs) | Effects on PROMs are probably mixed, as only half of studies reporting these outcomes reported benefit. | 18 (8698) |
⊕⊕⊕⊖ Moderatec |
| Hospital admissions | Data show probably little or no difference in hospital admissions, with only a third of studies reporting that this outcome showed benefit. | 9 (2396) |
⊕⊕⊕⊖ Moderatec |
| Process of care | Investigators noted little of no difference in service utilisation, with a third of studies reporting this outcome describing benefit (12 studies, N = 5072). Effects on medication‐related outcomes were probably modest, with half of studies reporting this outcome showing benefit (18 studies, N = 9118). Effects on management of risk factors were probably modest, with half of studies reporting this outcome showing benefit (seven studies, N = 2740). | 26 (13,088) |
⊕⊕⊕⊖ Moderatec |
| Participation and default rates | Effects on participation and default rates were probably modest, with most studies reporting this outcome showing benefit. | 7 (1639) |
⊕⊕⊕⊖ Moderatec |
| Participant health behaviours | Results showed probably little or no effect on patient health behaviours related to smoking (six studies, N = 3648), exercise (one study, N = 214) and diet (one study, N = 214). | 8 (4565) |
⊕⊕⊕⊖ Moderatec |
| GRADE Working Group grades of evidence. High quality: Further research is very unlikely to change our confidence in the estimate of effect. Moderate quality: Further research is likely to have an important impact on our confidence in the estimate of effect and may change the estimate. Low quality: Further research is very likely to have an important impact on our confidence in the estimate of effect and is likely to change the estimate. Very low quality: We are very uncertain about the estimate. | |||
aWe downgraded the evidence for effects on clinical outcomes to moderate owing to inconsistency across studies.
bWe graded evidence for mental health outcomes as high owing to consistency of effect across studies.
c We downgraded the evidence for effects on PROMs, hospital admissions, process of care, participation and default rates and patient behaviour and risk factors to moderate owing to inconsistency in effect across studies.
Background
Description of the condition
Shared care has been defined as joint participation of primary care physicians and specialist care physicians in planned delivery of care for patients with a chronic condition, informed by an enhanced information exchange over and above routine discharge and referral (Hickman 1994). Chronic or non‐communicable conditions are defined as conditions that are generally of long duration and slow progression (WHO). Shared care has been used over the past three to four decades on the basis that it offers patients the benefit of input from both specialist and primary care providers in the management of many chronic conditions. The initial focus was on diabetes (Greenhalgh 1994), and emphasis has been placed more recently on shared care for depression (Bartels 2014), but this approach has been used for patients with at least 14 other chronic conditions (Hickman 1994). With spiraling healthcare costs in most healthcare systems, cost‐effective and shared or integrated care is needed for management of chronic conditions (Atun 2013; Bauer 2014; Kings Fund 2015).
The importance of improving management of chronic disease has become increasingly apparent for healthcare practitioners in most countries. Evidence suggests that management is based on a complex interplay of system characteristics and population risk factors and is suboptimal in many cases (Bauer 2014;Wagner 2002).
Description of the intervention
A taxonomy of shared care for chronic disease originally created in the UK (Hickman 1994) suggested that shared care systems may be defined in the following ways.
Community clinics: Specialists attend or run a clinic in a primary care setting with primary care personnel. Communication is informal and depends on specialists and primary care team members meeting on‐site.
Basic model: A specific, regular communication system is set up between specialty and primary care. This may be enhanced by an administrator who organises appointments and follows up and recalls defaulters from care.
Liaison: A liaison meeting is attended by specialists and primary care team members, who discuss and plan ongoing treatment of patients within the service.
Shared care record card: In a more formal arrangement for information sharing, an agreed data set is entered onto a record card, which is usually carried by the patient.
Computer‐assisted shared care and electronic mail: A data set is agreed upon and collected in both specialty and primary care settings and is circulated between the two sectors via computer systems such as a central repository or email. This system may include centrally co‐ordinated computerised registration and recall of patients.
Theoretically, shared care presents an opportunity for patients to receive the benefits of specialist intervention combined with continuity of care and management of comorbidity provided by generalists, who maintain responsibility for all aspects of the patient's health care beyond the specified chronic disease. Starfield argued for a shared model of primary care and specialty care among physicians for the management of common chronic conditions with prevalence greater than two per 1000 in a practice population (Starfield 2003).
How the intervention might work
Shared care systems frequently include prespecified clinical protocols, referral guidelines, continuing education of participating clinicians, specifically designed information exchange systems and ongoing audit and evaluation of services delivered. They should provide an opportunity for structured, ongoing clinical management of the specified chronic disease provided by both sets of providers. Shared care is sometimes referred to as integrated care but commonly describes collaborative care between disciplines within a single setting.(description of the intervention).
Why it is important to do this review
Little is known about the nature or effectiveness of the primary/specialty care interface (Chen 2009;Starfield 2003), and evidence is needed that will guide healthcare planning and provide a framework for improved management of chronic disease.
The present systematic review considers the effects of shared care between specialists and primary care healthcare providers. This review is an update of Smith 2007.
Objectives
To determine the effectiveness of shared care health service interventions designed to improve the management of chronic conditions across the primary/specialty care interface. This is an update of a previously published review.
Secondary questions include the following.
Which shared care interventions or portions of shared care interventions are most effective?
What do the most effective systems have in common?
Methods
Criteria for considering studies for this review
Types of studies
We considered randomised controlled trials (RCTs), non‐randomised controlled trials (NRCTs) and controlled before‐after studies (CBAs) with at least two control sites and at least two intervention sites, as well as interrupted time series studies (ITS) that described a clearly defined point in time when the intervention occurred and at least three data points before and three data points after the intervention. We included studies published in all languages. We chose these study designs because we believed they were most appropriate for the health services research‐type question underpinning this review, and because we believed that non‐RCT designs might be used more commonly to evaluate new services.
Types of participants
People or populations with a specified chronic disease(s) who were enrolled in a defined, shared care service provided by primary and specialty care practitioners.
Primary care physicians defined as physicians who provide primary health care. Primary health care consists of integrated, easy‐to‐access healthcare services provided by clinicians who are accountable for addressing a large majority of personal healthcare needs, developing a sustained and continuous relationship with patients and practising in the context of family and community (Vaneslow 1995).
Specialist care physicians who work in hospital settings such as outpatient clinics and emergency departments or in community settings and deliver specialist care to individuals that is based on a certain physiological system or clinical condition or principally on patient age. In some healthcare systems, they may also deliver primary care‐type services that would not satisfy the full definition of primary care as outlined in the Vanselow definition, particularly in relation to practice within a family context.
Types of interventions
We considered all types of structured interventions that involved continuing collaborative clinical care provided by primary and specialist care physicians for treatment of patients with a prespecified chronic disease. We included shared care systems that reflect models 3, 4 and 5 in the taxonomy of shared care described above (Hickman 1994), that is:
liaison meetings between specialists and primary care team members for discussion and planning of ongoing management of prespecified chronic disease;
shared care record cards (usually patient‐held); and
computer‐assisted shared care and electronic mail whereby an agreed data set was collected in both primary and specialty care settings and circulated between sectors. This system could include centrally co‐ordinated computerised registration and recall of patients.
We also included a fourth category classified as 'other' to include additional types of shared care services not represented in the taxonomy, so as to make this review more comprehensive.
We classified shared care interventions as simple if they used only one of these approaches, and as multi‐faceted if they incorporated more than one feature.
Investigators compared interventions versus usual care.
We excluded the following interventions.
Structured disease management in primary or specialty care that did not routinely involve prespecified care from the other provider for most participating patients (e.g. diabetes mini‐clinics in general practice with structured care provided by primary care physicians only).
Specialist outreach clinics or specialist liaison services in primary care settings defined as planned and regular visits by specialist physicians from a usual practice location, with no ongoing structured joint management programmes for participating patients (Gruen 2004).
Professional educational interventions or research initiatives by which no specified, structured clinical care was delivered to patients.
Interventions directed at communities of people on the basis of location or age of participants that have no specified chronic disease management component (e.g. interventions to improve the care of elderly patients that are based solely on age rather than specified chronic disease management).
Types of outcome measures
We included studies if they reported any objective measure of:
clinical outcomes, including physical health outcomes such as blood pressure and mental health outcomes such as depression scores;
patient‐reported outcome measures (PROMs);
hospital admissions;
process of care, including visits, prescribing and management of risk factors;
participation and default rates;
treatment satisfaction if this was reported by validated measures in a study that also reported patient outcomes or provider behaviours;
patient health behaviours; or
cost outcomes including simple cost and economic analyses of cost‐effectiveness.
We did not consider attitudinal and knowledge outcomes.
Search methods for identification of studies
Electronic searches
Cochrane Effective Practice and Organisation of Care (EPOC) information specialists developed search strategies in consultation with the review author team. We revised searches conducted for previous versions of this review (Smith 2007) and searched the following databases on 12 October 2015.
Cochrane Central Register of Controlled Trials (CENTRAL; 2015, Issue 9), part of the Cochrane Library (www.cochranelibrary.com), including the Cochrane EPOC Specialised Register.
Database of Abstracts of Reviews of Effects (DARE) (the Cochrane Library; Wiley; 2015, Issue 2).
National Health Service (NHS) Economic Evaluation Database (NHSEED) (the Cochrane Library; Wiley; 2015, Issue 2).
Health Technology Assessment (HTA) (the Cochrane Library; Wiley; 2015, Issue 3).
MEDLINE In‐Process and other non‐indexed citations, and MEDLINE, OvidSP (1946 to 12 October 2015).
Embase, OvidSP (1974 to 9 October 2015).
See the full search strategies presented in Appendix 1.
Searching other resources
We searched the Science Citation Index (SCISearch) for papers that cited studies included in this review. We handsearched the reference lists of studies included in the review. We applied no language or date restrictions.
Data collection and analysis
Selection of studies
We downloaded to Endnote reference manager software (EndNote) all citations identified by electronic searches, and we removed duplicates. The lead review author (SS) identified potentially relevant studies by reviewing titles and abstracts provided by the search. We retrieved full‐text copies of all articles identified as potentially relevant. Two review authors independently assessed each retrieved article for inclusion (SS and SA/TOD/GC/BC). We resolved disagreements about eligibility by consensus between review authors and sought advice from the contact editor regarding the eligibility of one study. If details of the intervention provided in the paper were not clear, we contacted study authors to clarify the nature of the intervention. We contacted the authors of 16 papers and received replies from six.
Ongoing studies
We identified and described Ongoing studies, when possible, and provided an estimate of the reporting date when available.
Data extraction and management
Two review authors independently abstracted data using a modified version of the EPOC data collection checklist (EPOC 2013b). We resolved disagreements about eligibility and quality by consensus between review authors. When discrepancies remained, a third review author reviewed the paper or, if necessary, we referred the paper to the Cochrane contact editor.
We extracted the following data from all included studies.
Details of the intervention: We extracted a full description of the intervention including details regarding aims, clinical protocols, information exchange systems, use of link workers and remuneration and payment systems (whether free to patients at the point of delivery).
-
Participants.
Patients, nature of their chronic condition.
Providers (specialist and primary care providers involved).
Clinical setting: We examined the organisation of primary care and specialist services in that particular setting or country.
Study design: We excluded studies with significant design flaws.
Results: We organised results into health outcomes, process of care including changes in patient and provider behaviour, patient and provider acceptability and costs.
Assessment of risk of bias in included studies
Two review authors independently assessed the risk of bias for included studies using standard EPOC criteria and judgements (EPOC 2015). We discussed disagreements and reached consensus. If necessary, we would have consulted a third review author. We considered the following risk of bias domains: randomisation; allocation concealment; baseline data collection; blinding of participants and personnel; blinding of outcome assessors; incomplete outcome data; selective outcome reporting; and contamination and other bias.
Measures of treatment effect
When possible, we presented results in natural units for each study.
For RCTs, NRCTs and CBAs, we presented results of dichotomous outcomes in terms of:
absolute difference (mean or proportion of outcome in intervention group minus control at study completion);
relative percentage difference (absolute difference divided by postintervention score in the control group);
absolute change from baseline (before‐after changes in intervention and control groups); and
difference in absolute changes from baseline. For studies without baseline data, we reported only absolute difference and relative percentage difference.
We calculated standardised effect sizes (SESs) for continuous measures by dividing the difference in mean scores between intervention and comparison groups in each study by an estimate of the pooled standard deviation, when possible. We presented these in the accompanying tables.
Unit of analysis issues
We reported any issues related to cluster effects in the Results section but did not have to undertake corrections for unit of analysis errors, as no studies included in the meta‐analyses had unit of analysis errors.
Dealing with missing data
If data were missing, we contacted study authors, when possible, to obtain the missing information.
Assessment of heterogeneity
We considered clinical heterogeneity in terms of intervention components and clearly reported these in the Characteristics of included studies; we considered statistical heterogeneity when undertaking meta‐analyses.
Assessment of reporting biases
We assessed reporting bias by comparing outcomes listed in the Methods section versus those reported in the Results section and, when possible, checked outcomes in published protocols.
Data synthesis
Primary analyses
Primary analyses were based on primary and secondary outcome measures as defined by study authors. These included continuous variables (such as glycosylated haemoglobin in patients with diabetes) or dichotomous process measures (such as proportion of patients with diabetes undergoing a structured annual review for complications).
We undertook meta‐analyses using random‐effects models, when possible, and used forest plots to present outcomes. If analyses indicated significant heterogeneity (I2 > 60%), we presented graphs without a pooled effect to provide a visual representation of study results for that outcome. We used standardised mean differences (SMDs) in meta‐analyses when different scales were used to report the same outcome.
We assessed the certainty of evidence for the main comparison using Grading of Recommendations Assessment, Development and Evaluation (GRADE) criteria (GRADE 2012), and we have presented our judgements in a 'Summary of findings' table. We downgraded the certainty of the evidence when we had concerns about study limitations, consistency of effect, imprecision, indirectness and publication bias. We used EPOC Worksheet 23 to guide this process (EPOC 2013).
Subgroup analysis and investigation of heterogeneity
We had considered undertaking subgroup analyses by intervention type but found that this was not possible owing to the complex nature of the interventions. We undertook one subgroup analysis within the meta‐analysis of effects of shared care on hypertension for patients with and without diabetes. We explored heterogeneity within meta‐analyses visually and by using I2 statistics; we have not presented pooled estimates for analyses with significant heterogeneity.
Sensitivity analysis
We conducted no sensitivity analyses.
Results
Description of studies
Results of the search
We identified 14,857 titles and removed 2961 duplicates, leaving 11,896 titles for first review. We reduced this number to 175 abstracts to be screened by two review authors for eligibility (SS, SA, TOD, GC and BC). Of these, we identified 42 studies from 49 papers as eligible for inclusion; we identified one as an ongoing study (Characteristics of ongoing studies), excluded 107 with reasons (Excluded studies) and identified 18 as secondary data publications from other included or excluded studies.
We have provided a flow chart of the search process and results in Figure 1.
1.
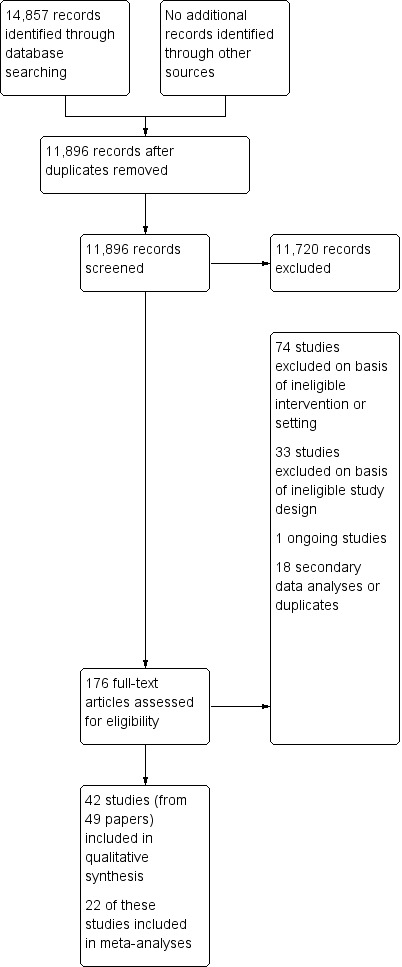
Study flow diagram.
Included studies
See the Characteristics of included studies table.
Study design
We identified 42 studies that met the eligibility criteria for this review (N = 18,859): 39 RCTs, two CBAs (Meulepas 2007; Wood 1994) and one NRCT with a stepped wedge design (Solberg 2015). NIneteen of the 39 RCTs were cluster‐RCTs (Byng 2004; Callahan 2006; Dey 2002; Dobscha 2009; Donohoe 2000; Doughty 2002; Fihn 2011; Fortney 2007; Holm 2002; Huijbregts 2013; Menchetti 2013; Rea 2004; Richards 2008; Scherpbier‐de Haan 2013; Smith 2004; Smith 2008; Swindle 2003; Van Orden 2009; Warner 2000). Follow‐up in these studies ranged from three months to three years; most studies lasted one year.
Targeted chronic condition(s)
These studies covered a range of chronic diseases, including asthma and chronic obstructive pulmonary disease (COPD) (Drummond 1994; Meulepas 2007; Rea 2004), cancer (Johannson 2001), congestive cardiac failure (CCF) (Dendale 2012; Doughty 2002), depression (Chew‐Graham 2007; Conradi 2007; Fortney 2007; Huijbregts 2013; Katon 1999; Katon 2001; Llewelyn‐Jones 1999; Menchetti 2013; Richards 2008; Solberg 2015; Swindle 2003; Unutzer 2002; Vera 2010), anxiety (Muntingh 2013), chronic mental illness (Byng 2004; Van Orden 2009; Warner 2000; Wood 1994), diabetes mellitus (DICE 1994; Donohoe 2000; Duran 2008; Goderis 2010; Hoskins 1992; Smith 2004; Smith 2008), comorbid depression and diabetes (Katon 2004; Katon 2010), comorbid depression and Alzheimer's disease (Callahan 2006), hypertension (McGhee 1994), ischaemic heart disease (Fihn 2011), transient ischaemic attack/cerebrovascular accident (TIA/CVA) (Joubert 2009), opiate misuse (Dey 2002), rheumatoid arthritis (Primdahl 2014), chronic kidney disease with comorbid diabetes and/or hypertension (Scherpbier‐de Haan 2013), chronic pain (Dobscha 2009) and a variety of chronic conditions requiring long‐term oral anticoagulation therapy (Holm 2002).
Participants
Professional participants included a wide variety of specialist physicians, specialist nurses and others, such as psychologists, psychiatrists, social workers and dieticians, and primary care professionals such as general practitioners (GPs) or family practitioners, primary care practitioners, practice nurses and home care nurses.
Settings
Studies were carried out in a variety of settings: eight in the UK, 13 in the USA, three in Australia, three in New Zealand, seven in the Netherlands, two in Denmark and Belgium and one each in Ireland, Sweden, Spain, Italy and Puerto Rico. These studies represented a variety of healthcare systems from publicly funded systems with universal free healthcare delivery, such as the UK, to more mixed public and private systems such as those in Australia and Ireland and insurance‐based systems within the USA and the Netherlands.
Shared care interventions
Forty‐one shared care interventions were multi‐faceted, and only one involved a simple intervention ‐ a shared care record card (Warner 2000). Therefore, most studies examined complex interventions involving combinations of previously agreed upon roles within each sector, clinical and referral guidelines, defined patient reviews in each sector, education and training for patients and professionals (principally for primary care professionals and workers at the interface) and synchronised patient records and recall systems. We originally planned to look for ‘other’ intervention types, but as 41 of the 42 studies provided complex multi‐faceted interventions, this was not really relevant.
Shared care interventions appeared to be driven by the specialist sector in 11 included studies (Dey 2002; Donohoe 2000; Doughty 2002; Duran 2008; Holm 2002; Hoskins 1992; Johannson 2001; Llewelyn‐Jones 1999; McGhee 1994; Primdahl 2014; Warner 2000). These studies performed relatively limited analyses of activity in primary care. Remaining studies involved a clearer collaboration between and more complete analysis of activity in both sectors.
Eighteen studies included a clearly identified professional (usually a nurse specialist) outside the study team and a usual service delivery team, whose role included co‐ordination of care across the primary/specialty care divide. Other studies reported that the service was co‐ordinated by members of the specialist team or study team (Byng 2004; Donohoe 2000; Doughty 2002; Goderis 2010; Holm 2002; Johannson 2001; Katon 1999; Katon 2002; Llewelyn‐Jones 1999; Muntingh 2013). Five studies reported on shared care interventions that were largely computer based (Dendale 2012; DICE 1994; Drummond 1994; McGhee 1994; Smith 2008).
The overall purpose of shared care interventions, as described by study authors, was to improve patient care. This was described as occurring through various mechanisms, including increasing and integrating care provided in each sector; improving, introducing or maintaining appropriate clinical management; delivering alternative and potentially more effective care; targeting higher‐risk patients; overcoming cost barriers; and increasing patient satisfaction.
Comparison intervention
Thirty‐three studies generally compared intervention groups versus a group of control patients who received what was described as 'usual care'. This was done in the primary care sector in most cases and in the specialist sector in seven studies (DICE 1994; Drummond 1994; Duran 2008; Hoskins 1992; Llewelyn‐Jones 1999; McGhee 1994; Primdahl 2014). For the remaining nine studies, the comparison was usual care augmented with an educational meeting (Callahan 2006; Dey 2002; Donohoe 2000; Fortney 2007; Menchetti 2013; Swindle 2003); an email outlining cardiovascular risk (Smith 2008); or information on depression screening results for primary care physicians (Katon 2010; Swindle 2003). In one study, participants received usual care but were themselves informed about their depression screening results and were advised to see their GP (Vera 2010).
Outcomes
The RCTs examined a range of outcomes including clinical outcomes, PROMs, process outcomes and cost outcomes. Two studies (Dey 2002; Donohoe 2000) presented a composite measure of the process of care, measuring participation in shared care or appropriateness of referral. The outcome in Dey 2002 (participation in shared care) was of borderline value in that control patients, by definition, could not participate in shared care and therefore scored zero automatically. Thirteen studies reported cost outcomes, and one study author (the review author, SS) provided cost data (from an MD thesis).
One CBA study reported inpatient admission days and time to first re‐admission in the two years before and after introduction of the intervention.
Excluded studies
We excluded 107 studies in total (see Characteristics of excluded studies). We excluded 33 studies on the basis of ineligible study design and 74 studies on the basis of an ineligible shared care intervention or setting, which usually involved conducting the study in a specialist setting or providing integrated care between different professional groups within the same setting.
Risk of bias in included studies
See Characteristics of included studies, Figure 2 and Figure 3 for summary assessments of the risk of bias of included studies. Overall only three studies were at low risk of bias for all domains (Dobscha 2009; Muntingh 2013; Smith 2004). Nine RCTs and all three NRCTs reported at least one domain as having high risk of bias (Callahan 2006; Chew‐Graham 2007; Dendale 2012; Donohoe 2000; Drummond 1994; Hoskins 1992; Huijbregts 2013; Llewelyn‐Jones 1999; Menchetti 2013; Meulepas 2007; Solberg 2015; Wood 1994). Among the 30 remaining studies (all RCTs), we classified some domains as having unclear risk due to lack of reporting, mainly related to lack of blinding of participants and personnel and potential contamination. We have reported the risk of bias for RCTs and NRCTs separately below.
2.
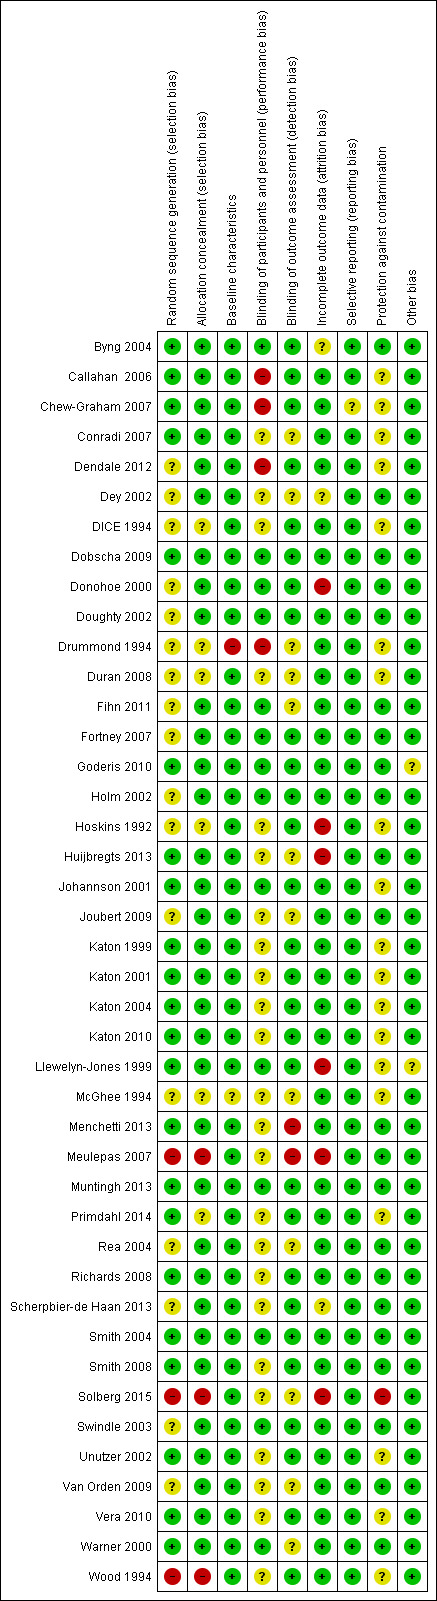
Risk of bias summary: review authors' judgements about each risk of bias item for each included study.
3.
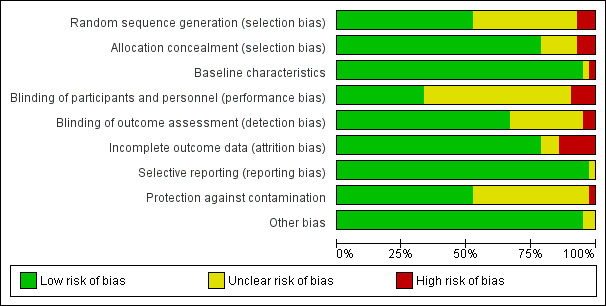
Risk of bias graph: review authors' judgements about each risk of bias item presented as percentages across all included studies.
Allocation
Randomisation was unclear in 17 of the 39 RCTs, and allocation concealment was unclear in six of the 39 RCTs, mainly owing to failure to report the actual method of allocation.
Baseline data collection
One study did not report baseline data collection (Drummond 1994), and another study had unclear risk, as investigators reported only demographic details of participants at baseline (McGhee 1994). The remaining 37 RCTs reported baseline data collection that was similar between groups.
Blinding
Four of the 39 RCTs did not report blinding of participants and personnel (Callahan 2006; Chew‐Graham 2007; Dendale 2012; Drummond 1994), and blinding was unclear in 24 other studies, mainly because it was impossible to blind participants given the nature of the complex interventions being tested, unless the study used a cluster design or reported geographical separation of control and intervention groups, as in Menchetti 2013. Blinded outcome assessment was unclear in 11 RCTs and was not done in another RCT (Menchetti 2013). In two studies, primary care providers were unaware that they were participating in an intervention study (Hoskins 1992; Llewelyn‐Jones 1999).
Incomplete outcome data
In most studies, risk of bias was low in relation to incomplete outcome data, but four of the 39 RCTs had high risk of bias for this domain (Donohoe 2000; Hoskins 1992; Huijbregts 2013; Llewelyn‐Jones 1999) and risk was unclear in three studies owing to lack of reporting.
Selective reporting
Only one of the 42 studies had clearly failed to report one of its stated secondary outcomes (Chew‐Graham 2007), but the effect of this was unclear. In all other studies, results were at least described in the text, although investigators did not necessarily present all data.
Protection against contamination
We noted potential for contamination in 18 of the 39 RCTs mainly owing to lack of clarity on reporting of intervention and comparison settings. Only one of the individually randomised trials specifically addressed the issue of potential contamination (Joubert 2009). Twenty‐one of the included RCTs had a cluster design (see Characteristics of included studies), which generally reduced the risk of contamination, although contamination was still possible when the unit of allocation was the physician ‐ not the care delivery centre. For example, Callahan 2006 used a cluster design but regarded the physician ‐ not the practice ‐ as the unit of allocation, meaning that control participants attending that practice could potentially receive care from intervention physicians.
Other potential sources of bias
Two studies had other potential sources of bias. One RCT (Llewelyn‐Jones 1999) used a controversial design and performed non‐concurrent assessment of control and intervention participants for pragmatic reasons, but this could have led to temporal bias, as study authors waited a year between assessments to avoid seasonal differences. This provoked commentary in the British Medical Journal as to whether the studies used a true RCT design (Deeks 1999). As a result of these issues, we reported this study (Llewelyn‐Jones 1999) alone and did not include study findings in any grouped analysis. A second RCT (Goderis 2010) reported very low participation rates for some of the physicians and participants involved.
NRCT designs
Three of the 42 included studies used an NRCT design. One was a controlled clinical trial for which we included two arms from a stepped wedge evaluation of a shared care model for depression (Solberg 2015). This study was at high risk of selection bias owing to lack of randomisation and incomplete outcome reporting, and the other risk of bias domains were unclear.
We included in the review two other NRCTs that used a CBA design (Meulepas 2007; Wood 1994). Meulepas 2007 incorporated baseline measurement but was at high risk of bias owing to lack of blinding, inadequate follow‐up and lack of randomisation. However, contamination was unlikely owing to the regional allocation of intervention and control general practices.
Wood 1994 met EPOC quality criteria for an NRCT in that it incorporated baseline measurements, blinded assessment of primary outcomes, used reliable outcomes and provided adequate participant follow‐up. We noted a unit of analysis error that occurred because study authors did not account for a potential clustering effect at the general practice level. In addition, as outlined previously, this study reported only preliminary data on process outcomes, with study authors stating their intention to publish health outcomes at a later date.
Certainty of the evidence
See Table 1. In general, although all included studies were RCTs, the main limitation of their findings was related to lack of consistency of effect for most outcomes. We regarded only evidence related to depression as having a high GRADE ranking. We downgraded the evidence to moderate for effects on all other outcomes owing to lack of consistency of effect across studies and small effect sizes. We did not include economic outcomes in Table 1 because we lacked robust economic analyses, rather we summarised this outcome in the main results and in additional tables.
Unit of analysis issues
Most of the cluster‐RCTs had incorporated clustering effects in both power calculations and analyses. Swindle 2003 and Warner 2000 explicitly incorporated clustering in their analyses but did not include a cluster effect in their power calculations, although Warner 2000 discussed this and presented data on the clustering effect, indicating that this study was underpowered when clustering was considered. Three of the included cluster‐RCTs had unit of analysis errors (Dey 2002; Donohoe 2000; Holm 2002), and Dey 2002 also included in its analysis patients described as a dynamic cohort (58 cases closed during the study and 46 new patients who entered the service, with unknown outcomes in all cases). None of these studies reported data that were included in meta‐analyses, so we made no adjustments to correct for these unit of analysis errors.
Effects of interventions
See: Table 1
In presenting review results, we included all studies as RCTs unless otherwise specified. We carried out meta‐analysis only when we considered this appropriate in relation to study characteristics and available data; we have presented these results only in forest plots. When we found differences between groups, we indicated this by inserting an asterisk (*) in the notes section of the additional tables.
1. Clinical outcomes
1.1 Clinical outcomes: physical health
Sixteen studies (15 RCTs and one CBA) evaluated effects of shared care on physical health outcomes (Dendale 2012; DICE 1994; Drummond 1994; Duran 2008; Fihn 2011; Goderis 2010; Hoskins 1992; Joubert 2009; Katon 2010; McGhee 1994; Meulepas 2007; Primdahl 2014; Rea 2004; Scherpbier‐de Haan 2013; Smith 2004; Smith 2008). These studies included participants with diabetes, hypertension, asthma and COPD, vascular conditions, musculoskeletal conditions or combinations of different conditions including cancer. Apart from providing beneficial but modest effects on blood pressure (BP), shared care probably leads to few or no differences in clinical outcomes. We have presented in Table 2 summary data regarding physical health outcomes.
1. Clinical outcomes: physical health.
| Study (condition) | Study type | Outcome | Results |
Notes *Statistically significant difference reported in trial |
| DICE (diabetes) | RCT | Mean HBA1c | Int: 5.3 (standard deviation (sd) 1.7). Con: 5.3 (sd 1.7). Absolute difference 0. Relative % difference 0%. | Standardised effect size (SES) = 0 |
| Hoskins (diabetes) | RCT | Mean HBA1c | Int: 6.6 (sd 1.6). Con: 7.3 (sd 1.6). Absolute difference 0.7. Relative % difference 9.6%. | SES = 0.47 |
| Smith 2004 (diabetes) | RCT | Mean HBA1c | Int: 7.0 (sd 1.6). Con: 6.7 (sd 1.5). Absolute difference 0.3. Relative % difference 4.5%. | SES = 0.19 |
| Katon 2010 (diabetes/CHD/ depression) | RCT | Mean HBA1c | Int: 7.33 (sd 1.21). Con: 7.81 (sd 1.9). Absolute difference 0.48. Relative % difference 6%. | SES = 0.31 |
| Goderis (diabetes) | RCT | Mean HBA1c | Int (AQIP): 6.7 (sd 1.01). Con (UQIP): 6.8 (sd 0.78). Absolute difference ‐0.1. Relative % difference 1%. | SES= 0.11 |
| Duran (diabetes) | RCT | % HBA1c < 7% | Int: 27/57. Con: 24/59. Absolute difference 4. Relative % difference 16.5%. | |
| Smith 2008 (diabetes) | RCT | % HBA1c < 7% | Int: 191/358. Con: 154/277. Absolute difference ‐2.2. Relative % difference 3.9%. | |
| Dice (diabetes) | RCT | Mean systolic BP | Int: 161.5 (sd 25.1). Con: 156.4 (sd 25.7). Absolute difference 5.1. Relative % difference 3.3%. | SES = 0.2 |
| Hoskins (diabetes) | RCT | Mean systolic BP | Int: 130 (sd 25). Con: 133 (sd 19). Absolute difference 3. Relative % difference 2%. | SES = 0.14 |
| Smith 2008 (diabetes) | RCT | Mean systolic BP | Int: 157.7 (sd 24.1). Con: 163.4 (sd 26.5). Absolute difference 5.7. Relative % difference 3.5%. | SES = 0.23 |
| Katon 2010 (diabetes/CHD/ depression) | RCT | Mean systolic BP | Int: 131 (sd 18.2). Con: 132 (sd 17.4). Absolute difference 0.7. Relative % difference 0.5%. | SES = 0.06* |
| Joubert (stroke) | RCT | Mean systolic BP | Int: 128.5 (sd 13.7). Con: 134.5 (sd 19.4). Absolute difference 6. Relative % difference 5%. | SES = 0.35* |
| Goderis (diabetes) | RCT | Mean systolic BP | Int (AQIP): 132 (sd 20.3) Con: 134 (sd 23.2) Absolute difference ‐2 Relative % difference 1.5 | SES = 0.09 |
| Scherpbier de Hann (CKD+) | RCT | Mean systolic BP | Int: 134.7 (sd 15.7). Con: 142.9 (sd 16.8). Absolute difference 8.2. Relative % difference 5.7%. | SES = 0.5* |
| McGhee (hypertension) | RCT | Mean systolic BP | Int: 147 (sd 21.8). Con: 150.2 (sd 17.9). Absolute difference 3.2. Relative % difference 2.3%. | SES = 0.16 |
| Scherpbier de Hann (CKD+) | RCT | % SBP meeting target < 130 mmHg | Int: 40/90. Con: 16/74. Absolute difference 22%. Relative % difference 100%. | |
| Duran (diabetes) | RCT | % SBP < 130 mmHg | Int: 23/57. Con: 29/59. Absolute difference 8%. Relative % difference 17.8%. | |
| Smith 2008 (diabetes) | RCT | % BP < 130/80 mmHg | Int: 146/358. Con: 128/277. Absolute difference ‐5. Relative % difference 11%. | |
| Dice (diabetes) | RCT | Mean BMI | Int: 28.7 (sd 7.6). Con: 27.9 (sd 4.5). Absolute difference 0.8. Relative % difference 2.8%. | SES = 0.13 |
| Hoskins (diabetes) | RCT | Mean weight (kg) | Int: 75 (sd 14). Con: 79 (sd 19). Absolute difference 4. Relative % difference 5%. | SES = 0.23 |
| Smith 2004 (diabetes) | RCT | Mean BMI | Int: 31.6 (sd 6.4). Con: 31 (sd 6.4). Absolute difference 0.6. Relative % difference 2%. | SES = 0.09 |
| Joubert (stroke) | RCT | Mean BMI | Int: 27.5 (sd 5.4). Con: 28.7 (sd 6.3). Absolute difference 1.2. Relative % difference 4%. | SES = 0.21* |
| Goderis (diabetes) | RCT | Mean BMI | Int: 29.2 (sd 2.0). Con: 29.2 (sd 2.3). Absolute difference 0. Relative % difference 0%. | SES = 0 |
| Duran (diabetes) | RCT | % BMI < 25 kg/m2 | Int: 7/57. Con: 13/59. Absolute difference ‐9.8. Relative % difference 44.3%. | * |
| Joubert (stroke) | RCT | Mean total cholesterol | Int: 4.9 (sd 1.0). Con: 5 (sd 1.0). Absolute difference 0.01. Relative % difference 2.0%. | SES = 0.1 |
| Goderis (diabetes) | RCT | Mean total cholesterol | Int: 174 (sd 40.5). Con: 180 (sd 38.6). Absolute difference ‐6. Relative % difference 3.3%. |
SES = 0.15 |
| Katon 2010 (diabetes/CHD/ depression) | RCT | Mean LDL cholesterol | Int 91.9 (sd 36.7) Con: 101.9 (sd 36.6) Absolute difference 10 Relative % difference 0.1% | SES = 0.27 |
| Goderis (diabetes) | RCT | Mean LDL cholesterol | Int (AQIP): 93 (sd 30.4). Con (UQIP): 98 (sd 30.9). Absolute difference ‐5. Relative % difference 5%. | SES = 0.16 |
| Duran (diabetes) | RCT | % cholesterol < 200 mg/dL | Int: 56/57. Con: 53/59. Absolute difference 8.2%. Relative % difference 9.1% | |
| Goderis (diabetes) | RCT | Mean HDL cholesterol | Int (AQIP): 55 (sd 20.2). Con (UQIP): 54 (sd 7.7). Absolute difference 1. Relative % difference 1.8. | SES = 0.07 |
| Smith 2008 (diabetes) | RCT | % LDL cholesterol< 130 mg/dL% | Int: 271/358. Con: 227/277. Absolute difference ‐6. Relative % difference 7.3%. | |
| Smith 2008 (diabetes) | RCT | % LDL cholersterol < 100 mg/dL% | Int: 184/358. Con: 139/277. Absolute difference 1. Relative % difference 2%. | |
| Drummond (asthma) | RCT | Mean peak flow rate | Int: 351 (sd 120). Con: 351 (sd 123). Absolute difference 0. Relative % difference 0%. | SES = 0 |
| Drummond (asthma) | RCT | Mean FEV1 as % predicted | Int: 76 (sd 28). Con: 75.2 (sd 27.2). Absolute difference 0.8. Relative % difference 1%. | SES = 0.03 |
| Meulepas (asthma) | RCT | % with exacerbations of asthma | Int: 70/87. Con: 55/79. Absolute difference 0.12. Relative % difference 17%. | |
| Rea (COPD) | RCT | Mean FEV1 as %predicted | Int: 53.9. Con: 45.6. Absolute difference 8.3. Relative % difference 18%. | No SD available* |
| Rea (COPD) | RCT | Shuttle walk test ‐ mean difference (metres) | Int: 303.3 m. Con: 283.4 m. Absolute difference 19.9. Relative % difference 7%. | No SD available |
| Primdahl (RA) | RCT | Disease activity score | Int: 16. Con: 17. Absolute difference 1.0. Relative % difference 6%. | No SD available |
| Dendale (heart failure) | RCT | All‐cause mortality | Int: 4/76. Con: 14/80. Absolute difference ‐12%. Relative % difference 71%. | * |
| Dendale (heart failure) | RCT | Mean days lost to death/patient | Int: 6.5 (sd 28.6). Con: 16.3 (sd 43.1). Absolute difference ‐9.8. Relative % difference 60%. | SES = 0.27* |
| Dendale (heart failure) | RCT | Mean days lost to dialysis/patient | Int: 3.1 (19.6). Con: 9.1 (36.6). Absolute difference ‐6. Relative % difference 66%. | SES = 0.21 |
| Fihn (ischaemic heart disease) | RCT | Adjusted difference in angina frequency (Seattle Angina Questionnaire) | Intervention effect coefficient 0.93. | |
| Fihn (ischaemic heart disease) | RCT | Adjusted difference in angina frequency (Seattle Angina Questionnaire) | Intervention effect coefficient 0.93. | |
| Fihn (ischaemic heart disease) | RCT | Adjusted difference in physical limitations (Seattle Angina Questionnaire) | Intervention effect coefficient 0.97. | |
| Fihn (ischaemic heart disease) | RCT | Adjusted difference in death | Intervention effect coefficient 0.01. |
HBA1c: glycolsylated haemoglobin.
BP: blood pressure.
BMI: body mass index.
LDL: low‐density lipoprotein cholesterol.
HDL: high‐density lipoprotein.
FEV1 : Forced Expiratory Volume in one second.
1.1.1 Diabetes
Seven studies targeted people with diabetes (DICE 1994; Duran 2008; Goderis 2010; Hoskins 1992; Katon 2010; Smith 2004; Smith 2008), and two of these reported clinically meaningful differences in mean glycosylated haemoglobin (HbA1c; i.e. > 0.5%) between groups receiving shared care and control groups (Hoskins 1992; Katon 2010). Five of these studies reported data that could be included in a meta‐analysis (Analysis 1.1). Results showed a limited difference in mean systolic blood pressure (SBP) within the diabetes studies (Analysis 1.2;Figure 4), with a difference in mean SBP of 2 mmHg. Four studies reported seven outcomes related to cholesterol levels (Duran 2008; Goderis 2010; Joubert 2009; Katon 2010), and only one of these noted improvement. Two of the six studies that examined body mass index (BMI) or weight (DICE 1994; Duran 2008; Goderis 2010; Hoskins 1992; Joubert 2009; Smith 2004) found limited or no differences between groups (Table 2).
1.1. Analysis.
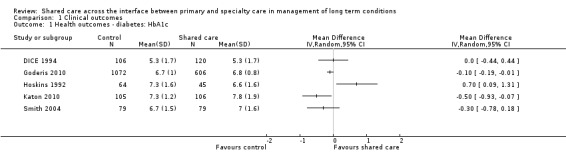
Comparison 1 Clinical outcomes, Outcome 1 Health outcomes ‐ diabetes: HbA1c.
1.2. Analysis.
Comparison 1 Clinical outcomes, Outcome 2 Health outcomes ‐ systolic blood pressure.
4.
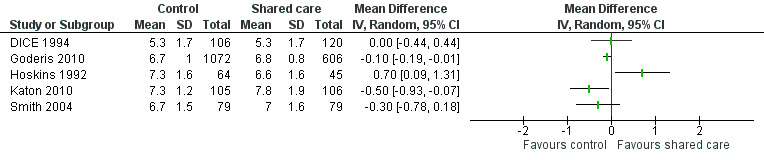
Forest plot of comparison: 1 Clinical outcomes, outcome: 1.1 Health outcomes ‐ diabetes: HbA1c.
1.1.2 Hypertension
Only one study reported on a shared care scheme targeting patients with hypertension (McGhee 1994) and found limited or no difference in SBP between intervention and control participants. This study was incorporated in a subgroup of the SBP analysis (Figure 5). This meta‐analysis presents SBP outcomes in diabetes shared care studies and in other studies targeting BP and reveals a modest effect favouring shared care. We performed a sensitivity analysis while removing DICE 1994, as participants were recruited from specialist settings and this removed statistical heterogeneity. This analysis shows modest benefit of shared care for the range of conditions included in these studies (mean difference (MD) 3.47, 95% confidence interval (CI) 1.68 to 5.25; Figure 5). However, this benefit is clinically modest.
5.
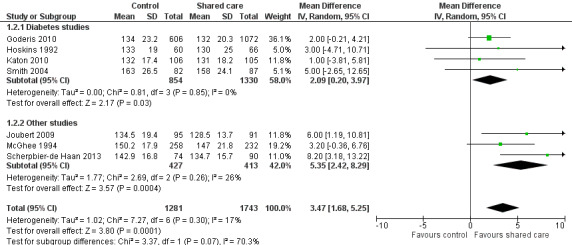
Forest plot of comparison: 1 Clinical outcomes, outcome: 1.2 Health outcomes ‐ systolic blood pressure.
1.1.3 Respiratory conditions
Three studies targeted respiratory conditions ‐ asthma and COPD (Drummond 1994; Meulepas 2007; Rea 2004). Drummond 1994 reported two biophysical measures for asthma control ‐ peak flow rate (PFR) and forced expiratory volume in one minute (FEV1) ‐ and indicated limited or no differences between shared care and control groups. Rea 2004 reported a difference in FEV1 favouring participants in the shared care group but described limited or no difference in distance walked in the shuttle walk test between those receiving shared care and participants given conventional care. Meulepas 2007, a CBA, found limited or no effect on proportions of participants with exacerbations of COPD.
1.1.4 Vascular conditions
Three studies (Dendale 2012; Fihn 2011; Joubert 2009) examined shared care for different vascular conditions (Table 2). One study (Dendale 2012) reported lower all‐cause mortality (absolute difference of 12%) in the intervention group than in the group of controls with congestive heart failure. This same study reported a greater reduction in mean days lost to death per participant in the intervention group but no difference in mean days lost to dialysis per participant. Fihn 2011 reported no intervention effect on mortality, angina symptoms or physical limitations. Joubert 2009, which targeted people with cerebrovascular disease (CVA/TIA), reported improvement in BMI among participants given intervention but limited or no difference in SBP or cholesterol levels.
1.1.5 Musculoskeletal conditions
Primdahl 2014 examined collaborative care for patients with rheumatoid arthritis and reported limited or no difference in disease activation measures between intervention and control participants (Table 2).
1.1.6 Comorbidity and cancer studies
Three studies included participants with specific comorbid conditions (Katon 2004; Katon 2010; Scherpbier‐de Haan 2013), and one study included participants with cancer (Johannson 2001). Katon 2004 examined shared care for people with depression and diabetes and found limited or no difference in mean HbA1c between intervention and control participants. The intervention in this study was targeted specifically toward improving depression outcomes. Katon 2010 included participants with depression and diabetes and/or ischaemic heart disease. The primary outcome for this study was a composite measure of depression score (Symptom Checklist Depression Scale (SCL‐20)), HBA1c, SBP and cholesterol, and investigators reported greater improvement in this composite outcome at 12 months (P < 0.001). Scherpbier‐de Haan 2013 examined collaborative care for participants with chronic kidney disease (CKD) and diabetes/hypertension and found improvement in BP management in terms of mean BP and proportions of participant achieving target BP levels but limited or no difference in lipids, renal function, weight and a range of 22 other biomarkers between intervention and control participants.
1.2 Clinical outcomes: mental health
Eighteen studies presented data on mental health outcomes. Sixteen of these studies examined shared care for various forms of depression (Callahan 2006; Chew‐Graham 2007; Conradi 2007; Dobscha 2009; Fortney 2007; Huijbregts 2013; Katon 1999; Katon 2001; Katon 2004; Katon 2010; Llewelyn‐Jones 1999; Menchetti 2013; Richards 2008; Solberg 2015; Swindle 2003; Unutzer 2002). All were RCTs except one (Solberg 2015). Results showed a tendency towards improvement in mean depression scores (six of 11 studies reported differences) and proportions responding to depression treatment (six of eight studies reported a difference) or achieving remission (four of seven studies reported a difference). This was based on high certainty of evidence regarding depression outcomes.
One RCT (Muntingh 2013) examined shared care for anxiety disorders and reported improvements in anxiety and depression scores among shared care participants (Table 3).
2. 2 Clinical outcomes: mental health.
| Study (condition) | Study type | Outcome | Results |
Notes *Statistically significant difference reported in trial |
|
| Katon 2004 (depression) | RCT | Mean SCL‐20 score | Int: 1.5. Con: 1.16. Absolute difference ‐0.34. Relative % difference 29.3%. | SES 0.23 (calculated using baseline standard deviations)* | |
| Llewelyn‐Jones 1999 (depression) | RCT | Mean Geriatric Depression Scale score | Int: 11.8 (sd 4.7). Con: 12.6 (sd 4.1). Absolute difference 0.76. Relative % difference 6%. | SES = 0.17 | |
| Swindle 2003 (depression) | RCT | Mean Beck Depression Inventory score | Int: 21.4 (sd 10.5). Con: 22.5 (sd 10.8). Absolute difference 1.1. Relative % difference 4.8%. | SES = 0.1 | |
| Unutzer (depression) | RCT | Mean SCL‐20 score | Int: 0.99 (0.67). Con: 1.39 (0.67). Absolute difference 0.4. Relative % difference 29%. | SES = 0.6* | |
| Katon 2010 (diabetes/CHD/ depression) | RCT | Mean SCL‐20 score | Int: 0.83 (sd 0.68). Con: 1.14 (sd 0.66). Absolute difference 0.31. Relative % difference 27%. | SES = 0.46* | |
| Menchetti (depression) | RCT | Mean PHQ‐9 score | Int: 7 (sd 4.7). Con: 7.5 (sd 4.4). Absolute difference 0.5. Relative % difference 7%. | SES = 0.11 | |
| Muntingh (anxiety) | RCT | Mean PHQ‐9 score | Int: 4.87. Con: 6.6. Absolute difference 0.64. Relative % difference 7%. | *No standard deviations available | |
| Richards (depression) | RCT | Mean PHQ‐9 score | Int: 10.0 (sd 7.1). Con: 11.7 (sd 6.8). Absolute difference 1.7. Relative % difference 14.5%. | SES = 0.28* | |
| Richards (depression) | RCT | Mean GAD score | Int: 7.7 (sd 6.2). Con: 9.1 (sd 6.2). Absolute difference 1.4. Relative % difference 15%. | SES = 0.22 | |
| Katon 1999 (depression) | RCT | % remission/recovery from depression | Int: 50/114. Con: 35/ 114. Absolute difference 13%. Relative % difference 42%. | * | |
| Katon 2001 (depression) | RCT | % remission/recovery from depression | Int: 113/174. Con: 99/152. Absolute difference 0. Relative % difference 0%. | ||
| Katon 2004 (depression) | RCT | % response, 40% reduction from baseline SCL‐20 score | Int: 79/164. Con: 59/165. Absolute difference 12.4%. Relative % difference 35%. | * | |
| Fortney (depression) | RCT | % response to treatment (50% improvement in SCL‐20 score) | Int: 53/146. Con: 51/189. Absolute difference 9%. Relative % difference 33%. | ||
| Menchetti (depression) | % response to treatment (at least 50% decrease in PHQ‐9 score) | Int: 90/128. Con: 60/99. Absolute difference 9%. Relative % difference 15%. | * | ||
| Richards (depression) | RCT | % response to treatment (at least 50% decrease in PHQ‐9 score) | Int: 115/235. Con: 93/263. Absolute difference 13.5%. Relative % difference 38%. | * | |
| Richards (depression) | RCT | % recovery/remission (PHQ‐9 < 9) | Int: 131/235. Con: 106/263. Absolute difference 15.4%. Relative % difference 38%. | * | |
| Menchetti (depression) | RCT | % recovery/remission from depression (PHQ‐9 < 5) | Int: 76/128. Con: 55/99. Absolute difference 3%. Relative % difference 54%. | ||
| Unutzer (depression) | RCT | % recovery/remission from depression | Int: 398/889. Con: 165/870. Absolute difference 25%. Relative % difference 132%. | * | |
| Fortney (depression) | RCT | % recovery/remission from depression (SCL‐20 score < 0.5) | Int: 35/146. Con: 24/187. Absolute difference 11%. Relative % difference 85%. | * | |
| Katon 2010 (diabetes/CHD/ depression) | RCT | % response to treatment (50% improvement in SCL‐20 score) | Int: 56/94. Con: 28/92. Absolute difference 30%. Relative % difference 100%. | * | |
| Byng (chronic mental illness) | RCT | Mean severity of illness score | Int: 2.34. Con: 2.36. Absolute difference ‐0.02. Relative % difference 0.8%. | No standard deviations available | |
| Warner (chronic mental illness) | RCT | Mean BASIS score | Int: 1.21 (sd 0.88). Con: 1.27 (sd 0.86). Absolute difference ‐0.06. Relative % difference ‐4.7%. | SES = 0.07 | |
| Warner (chronic mental illness) | RCT | Mean BPRS score | Int: 16.9 (sd 9.8). Con: 13.8 (sd 8.6). Absolute difference 3.1. Relative % difference 22%. | SES = 0.34 | |
| Byng (chronic mental illness) | RCT | % experiencing psychiatric relapse | Int: 126/177. Con: 56/145. Absolute difference 32%. Relative % difference 84%. | *Adjusted absolute difference reported in paper was 0.28 (95% CI 0.08 to 0.49) | |
| Callahan (Alzheimer/depression) | RCT | Mean Cornell Scale for Depression in Dementia | Int: 5.4 (sd 4.4). Con (augmented usual care): 4.2 (sd 3.9). Absolute difference 1.2. Relative % difference 29%. | SES = 0.29 | |
| Callahan (Alzheimer/depression) | RCT | Mean PHQ‐9 (caregiver) | Int: 3.1 (sd 4.5). Con (augmented usual care): 5.2 (5.3). Absolute difference ‐2.1. Relative % difference 40%. | SES = 0.43* | |
| Chew‐Graham (depression/older adults) | RCT | % with recovery/remission (5 or fewer symptoms on SCID Depression Scale) | Int: 36/45. Con: 26/43. Absolute difference 20%. Relative % difference 33%. | * | |
| Dobscha (chronic pain) | RCT | Mean PHQ‐9 depression | Int: 10.6 (sd 10.5). Con: 13.2 (sd 9.7). Absolute difference ‐2.6. Relative % difference 20%. Difference in absolute changes since baseline (‐2.5). | SES = 0.26 *Adjusted group difference in change in outcome over 12 months |
|
| Fihn (ischaemic heart disease) | RCT | Adjusted difference PHQ‐9 depression | Intervention effect coefficient 0.05. | i | |
| Vera (depression) | RCT | HSCL‐20 | Mean/sd not reported (improvement in intervention). | * | |
| Vera (depression) | RCT | % recovery/remission, at least 50% reduction in HSCL‐20 score at 6 months | Int: 50%. Con: 19%. Absolute difference 31. Relative % difference 163%. | * | |
| Huijbregts (depression) | RCT | % response, at least 50% reduction in PHQ‐9 scores at 12 months | Int: 16/39. Con: 24/94. Absolute difference 15.5. Relative % difference 60%. | ||
| Huijbregts (depression) | RCT | % recovery/remission (score < 5 on PHQ‐9) | Int: 8/39. Con: 6/94. Absolute difference 14.4. Relative % difference 229%. | ||
| Muntingh (anxiety) | RCT | Mean BAI score | Int: 12.2. Con: 16.8. Absolute difference 4.6. Relative % difference 27%. | *No standard deviations available |
SCL‐20: Symptom Checklist.
PHQ‐9: Patient Health questionnaire.
BASIS: Behavior and Symptom Identification Scale.
BPRS: Brief Psychiatric Rating Scale.
SCID: Structured Clinical Interview.
HSCL‐20: Hopkins Symptom Checklist Depression Scale.
BAI: Becks Anxiety Inventory.
Two RCTs (Byng 2004; Warner 2000) and one CBA (Wood 1994) targeted chronic mental illness and found no differences in shared care. We have presented summary outcome data in Table 3.
1.2.1 Depression
Eleven of the 16 studies examining shared care for depression presented depression outcomes as mean scores on validated depression scales and/or categorical depression outcomes. Eleven studies presented categorical data related to proportions recovered from depression or achieving remission, with a tendency towards improvement in response to treatment among intervention groups and limited effects on remission rates.
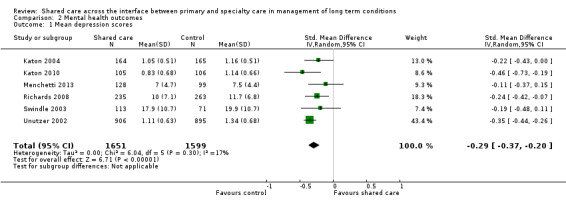
Eleven studies presented data related to mean depression scores (Katon 1999; Katon 2001; Katon 2004; Katon 2010; Llewelyn‐Jones 1999; Menchetti 2013; Richards 2008; Swindle 2003; Unutzer 2002; Van Orden 2009; Vera 2010). Two of these studies presented outcomes on graphs without providing raw data (Katon 1999; Katon 2001). Katon 1999 reported limited or no difference in mean depression score at six months between intervention and control groups; Katon 2001 reported benefit, with the intervention group having a lower mean score on the SCL‐20 depression scale at study completion (mean difference 0.08) (no data available for Table 2); Katon 2004, Katon 2010, Richards 2008, Unutzer 2002 and Vera 2010 reported improvement in mean depression scores, whereas Llewelyn‐Jones 1999, Menchetti 2013, Swindle 2003 and Van Orden 2009 found no differences between groups. We undertook a meta‐analysis of SMDs in depression scores among six studies, which showed a modest difference in these scores (RR ‐0.29, 95% CI ‐0.36 to ‐0.21; Analysis 2.1;Figure 6)..
2.1. Analysis.
Comparison 2 Mental health outcomes, Outcome 1 Mean depression scores.
6.
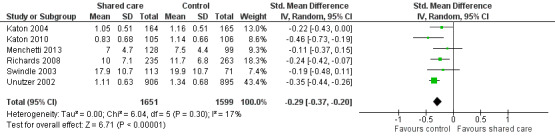
Forest plot of comparison: 2 Mental health outcomes, outcome: 2.1 Mean depression scores.
We included two arms from a stepped wedge evaluation of a shared care model for depression (Solberg 2015) and found limited or no difference in depression outcomes between participants who continued to receive usual care and those who received the shared care intervention. This study was at high risk of selection bias owing to lack of randomisation; therefore, we did not include it in the meta‐analysis.
Eleven studies examined categorical outcomes related to depression (Chew‐Graham 2007; Fortney 2007; Huijbregts 2013; Katon 1999; Katon 2001; Katon 2004; Llewelyn‐Jones 1999; Menchetti 2013; Richards 2008; Unutzer 2002; Vera 2010). Eight of these studies examined response to depression treatment, with six showing important differences favouring shared care (Table 3). We undertook a meta‐analysis of this outcome, which showed an effect favouring shared care (RR 1.4, 95% CI 1.22 to 1.62; Figure 7).
7.
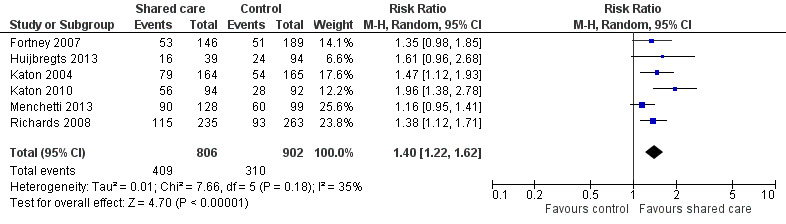
Forest plot of comparison: 2 Mental health outcomes, outcome: 2.2 Depression ‐ % with response to treatment.
Seven studies examined proportions achieving recovery or remission from depression. Four of these studies reported an effect (Table 3). We undertook a meta‐analysis of this outcome, but results were heterogeneous, so we have not reported a pooled result (Figure 8).
8.
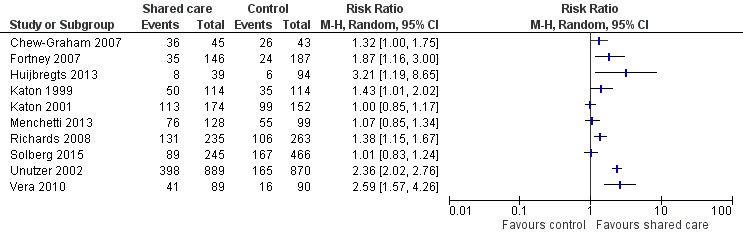
Forest plot of comparison: 2 Mental health outcomes, outcome: 2.3 Depression remission/recovery.
Llewelyn‐Jones 1999 reported a shift from more severe to less severe depression in the intervention group compared with the control group. We did not include this study in the meta‐analysis, as we noted issues regarding the quality of its study design (see section on methodological quality of included studies (Types of studies)).
Callahan 2006 included participants with both depression and Alzheimer's disease and found limited or no difference in mean depression scores for participants or caregivers.
Four studies examined shared care for diabetes, asthma, chronic pain and cancer and included depression measures as secondary outcomes (DICE 1994; Dobscha 2009; Drummond 1994; Johannson 2001). DICE 1994 used a validated scale ‐ the diabetes health questionnaire (which included scores for anxiety and depression) ‐ and found limited or no difference in mean anxiety and depression scores between shared care participants and controls. Dobscha 2009 found limited or no difference in mean depression scores among participants with chronic pain. Drummond 1994 showed limited or no difference between shared care participants and controls in Hospital Anxiety and Depression (HAD) scores at study completion. Johannson 2001 also examined HAD scores among participants with cancer receiving shared care but included the data only as covariates in an analysis of effects on hospital admissions (presented in Section 1.4).
1.2.2 Anxiety disorders
One study examined shared care for anxiety disorders and reported improvement in both anxiety and related depression scores (Muntingh 2013).
1.2.3 Chronic mental illness (other)
Three studies examined shared care for chronic mental illness (Byng 2004; Warner 2000; Wood 1994). Outcomes were mixed. Byng 2004 found limited or no difference in mean severity of illness scores between intervention and control participants. Warner 2000 evaluated a simple shared care intervention ‐ a shared care record card alone ‐ and presented data on general mental health outcomes ‐ the Behaviour and Symptom Identification Scale (BASIS) and the Brief Psychiatric Rating Scale (BPRS). Investigators found limited or no differences between intervention and control groups at study completion. Byng 2004 reported an adjusted 28% absolute reduction (95% CI 8% to 49%) in numbers of shared care participants experiencing a psychiatric relapse. Wood 1994 also looked at shared care for patients with chronic mental illness but reported only outcomes related to hospital admissions.
2. Patient‐reported outcome measures (PROMs)
Eighteen studies examined PROMs and found probably mixed effects, as only half of the studies reporting these outcomes showed any benefit. We have presented these results in Table 4. Only six of 15 studies reporting on well‐being and quality of life found an effect. Five of nine studies reporting on measures of functional impairment, productivity and disability showed an effect favouring shared care. Twelve additional PROMs were reported across studies, and five of these showed an effect favouring shared care.
3. Patient‐reported outcome measures.
| Study (condition) | Study type | Outcome | Results | Notes |
| Byng (chronic mental illness) | RCT | Lack well‐being ‐ mean score | Int: 3.41. Con: 3.46. Absolute difference 0.05. Relative % difference 1%. | No standard deviations available |
| Dice (diabetes) | RCT | Mean DWBS in patients with Type 2 Diabetes | Int: 46.5 (sd 6.7). Con: 47.1 (sd 7.5). Absolute difference ‐ 0.6. Relative % difference ‐1%. | SES = 0.08 |
| Dice (diabetes) | RCT | Mean DWBS in patients with Type 2 Diabetes | Int: 65.3 (sd 11.2). Con: 67.5 (sd 12.4). Absolute difference ‐2.2. Relative % difference ‐3%. | SES = 0.19 |
| Smith 2004 (diabetes) | RCT | Mean DWBS | Int: 50.9 (sd 2.82). Con: 47.6 (sd 3.56). Absolute difference 3.3. Relative % difference 6.9%. | SES = 0.03* |
| Katon 2010 (diabetes/CHD/ depression) | RCT | Mean quality of life score | Int: 6.0 (sd 2.2). Con: 5.2 (sd 1.9). Absolute difference 0.8. Relative % difference 15%. | SES = 0.38* |
| Joubert (stroke) | RCT | Mean AQoL score | Int: 26.4 (sd 5.3). Con: 29.7 (sd 6.2). Absolute difference 3.3. Relative % difference 11%. | SES = 0.57* |
| Unutzer (depression) | RCT | Mean quality of life score | Int: 6.58 (sd 2.15). Con: 6.02 (sd 2.13). Absolute difference 0.56. Relative % difference 9%. | SES = 0.26* |
| Drummond (asthma) | RCT | Mean number of nights of disturbed sleep | Int: 2.4 (sd 1.6). Con: 2.4 (sd 1.4). Absolute difference 0. Relative % difference 0%. | SES = 0 |
| Drummond (asthma) | RCT | Mean number of days of restricted activity | Int: 5.7 (sd 6.9). Con: 4.8 (sd 7.3). Absolute difference 0.9. Relative % difference 19%. | SES = 0.13 |
| Katon 1999 (depression) | RCT | Mean Sheehan Disability Scale scores | Int: 3.4 (sd 2.5). Con: 4.1 (sd 2.5). Absolute difference 0.7. Relative % difference 17%. | SES = 0.28* |
| Joubert (stroke) | RCT | Mean Rankin score | Int: 1.2 (sd 1.1). Con: 1.9 (sd 1.2). Absolute difference 0.7. Relative % difference 37%. | SES = 0.61* |
| Joubert (stroke) | RCT | Mean Barthel Index score | Int: 19.1 (sd 2.2). Con: 17.8 (sd 3.8). Absolute difference 1.3. Relative % difference 7%. | SES = 0.43 |
| Katon 1999 (depression) | RCT | Mean SF‐36 score ‐ role limitation (emotional) | Int: 55.1 (sd 33.04). Con: 52.4 (sd 33.04). Absolute difference 2.7. Relative % difference 5%. | SES = 0.08 |
| Muntingh (anxiety) | RCT | Mean SF‐36 score | Int: 43.6. Con: 40. Absolute difference 3.6. Relative % difference 9%. | *No standard deviations available |
| Muntingh (anxiety) | RCT | EQ5D score | Int: 0.8. Con: 7. Absolute difference 0.1. Relative % difference 14%. | *No standard deviations available |
| Rea (COPD) | RCT | Mean SF‐36 score ‐ role limitation (emotional) | Int: 68.1. Con: 62. Absolute difference 6.1. Relative % difference 10%. | No standard deviations available |
| Fortney (depression) | RCT | Mean SF‐12 PCS score | Int: 30.1. Con: 28.3. Absolute difference 1.8. Relative % difference 6%. | No standard deviations available |
| Fortney (depression) | RCT | Mean SF‐12 MCS score | Int: 36.1. Con: 36.9. Absolute difference 0.8. Relative % difference 2%. | No standard deviations available |
| Unutzer (depression) | RCT | Mean functional impairment score | Int: 3.58 (sd 2.8). Con: 4.52 (sd 2.7). Absolute difference 0.94. Relative % difference 21%. | SES = 0.34* |
| Byng (chronic mental illness) | RCT | Total unmet need ‐ mean score | Int: 1.49. Con: 1.31. Absolute difference 0.18. Relative % difference 14%. | No standard deviations available |
| Joubert (stroke) | RCT | MMSE score | Int: 21 (sd 4). Con: 19 (sd 5.2). Absolute difference 2. Relative % difference 11%. | SES = 0.43 |
| Katon 2010 (diabetes/CHD/ depression) | RCT | % better on global improvement score | Int: 41/92. Con: 16/91. Absolute difference 27%. Relative % difference 153%. | * |
| Callahan (Alzheimer) | RCT | Mean Neuropsychiatric Inventory score | Int: 8.4 (sd 10.2). Con (augmented usual care): 16.2 (sd 18.7). Absolute difference ‐7.8. Relative % difference 48%. | SES = 0.54* |
| Callahan (Alzheimer) | RCT | Mean Neuropsychiatric Inventory score (caregiver portion of NPI) | Int: 4.6 (sd 6.3). Con: 7.4 (9.7) (augmented usual care). Absolute difference ‐2.8. Relative % difference 38%. | SES = 0.35 |
| Callahan (Alzheimer) | RCT | Mean activities of daily living | Int: 45.7 (sd 20.1). Con (augmented usual care): 42.1 (16.8). Absolute difference 3.6. Relative % difference 8.6%. | SES = 0.20 |
| Chew‐Graham (depression/older adults) | RCT | Mean Health Assessment Questionnaire (HAQ) ‐ Pain | Int: 0.64 (sd 0.88). Con: 1.11 (sd 1.06). Absolute difference ‐0.47. Relative % difference 42%. | SES = 0.48 |
| Chew‐Graham (depression/older adults) | RCT | Mean Health Assessment Questionnaire (HAQ) ‐ Disability | Int: 0.78 (sd 0.74). Con: 1.05 (sd 0.75). Absolute difference ‐0.27. Relative % difference 26%. | SES = 0.36 |
| Dobscha (chronic pain) | RCT | Mean pain RMDQ | Int: 13.3 (sd 2.8). Con: 14.3 (sd 5.2). Absolute difference ‐1. Relative % difference 7%. Difference in absolute changes since baseline (‐1.2). | SES = 0.25 *Adjusted group difference in change in outcome over 12 months. |
| Dobscha (chronic pain) | RCT | % achieving 30% reduction in RMDQ scores over 12 months | Int: 21.9%. Con: 14%. Absolute difference 7.9. Relative % difference 56%. | *Adjusted |
| Dobscha (chronic pain) | RCT | Mean Chronic Pain Grade intensity | Int: 63.2 (sd 17.4). Con: 65.6 (sd 17.2). Absolute difference ‐2.3. Relative % difference 3.5%. Difference in absolute changes since baseline (‐4.64). | SES = 0.13 *Adjusted group difference in change in outcome over 12 months |
| Dobscha (chronic pain) | RCT | Mean Chronic Pain Grade pain interference subscale | Int: 44.6 (sd 26.9). Con: 51.1 (sd 26.1). Absolute difference ‐6.5. Relative % difference 13%. Difference in absolute changes since baseline (‐8). | SES = 0.25 *Adjusted group difference in change in outcome over 12 months |
| Dobscha (chronic pain) | RCT | Mean EQ5D QOL | Int: 0.64 (sd 0.21). Con: 0.60 (sd 0.22). Absolute difference 0.04. Relative % difference 6.7%. Difference in absolute changes since baseline (0.02). | SES = 0.19 |
| Fihn (ischaemic heart disease) | RCT | Adjusted difference disease perception | Intervention effect coefficient ‐0.02. | |
| Fihn (ischaemic heart disease) | RCT | Adjusted difference general self‐rated health (Veterans Rand 12‐Item Health Survey) | Intervention effect coefficient 0.37. | |
| Fihn (ischaemic heart disease) | RCT | Adjusted difference Physical Component Summary (Veterans Rand 12‐Item Health Survey) | Intervention effect coefficient ‐0.08. | |
| Fihn (ischaemic heart disease) | RCT | Adjusted difference Mental Component Summary (Veterans Rand 12‐Item Health Survey) | Intervention effect coefficient ‐0.20. | |
| Solberg (depression) | CCT | Productivity loss score | Int: 31. Con: 24.5. Absolute difference 6.5. Relative % difference 26%. | *No standard deviations |
| Van Orden (mental health) | RCT | Mean psychopathology subscale SCL‐90 | Int: 158.9 (sd 64.6). Con: 154.4 (sd 52.4). Absolute difference 4.5. Relative % difference 2.9%. | SES = 0.08 |
| Van Orden (mental health) | RCT | Mean WHOQOL‐BREF | Int: 3.3 (sd 9). Con: 3.3 (sd 7). Absolute difference 0. Relative % difference 0%. | SES = 0 |
| Vera (depression) | RCT | Social Functioning SF‐36 | Mean/sd not reported (improvement in intervention). | * |
DWBS: Diabetes well‐being score.
AQoL: Assesment of quality of life.
EQ5D: EuroQol five dimensions questionnaire.
SF‐12: Short form 12.
SF‐36: Short form 36.
WHOQOL‐BREF: World Health Organisation Quality of Life.
2.1 Well‐being and quality of life
Fifteen studies reported measures related to quality of life and well‐being (Byng 2004; DICE 1994; Dobscha 2009; Doughty 2002; Fihn 2011; Fortney 2007; Joubert 2009; Katon 2010; Muntingh 2013; Rea 2004; Richards 2008; Smith 2004; Unutzer 2002; Van Orden 2009; Vera 2010). Six of these studies reported benefit in favour of shared care (Table 4). Byng 2004 reported a 'lack of well‐being' score and found limited or no differences between groups. Doughty 2002 looked at changes in quality of life scores from baseline and reported these as improved in the shared care group for physical scores, with more modest differences for emotional scores (only data related to absolute changes in scores were provided in this paper). Richards 2008 reported both Short Form (SF)‐36 Mental Component Score (MCS) and Physical Component Score (PCS) with limited or no differences in either. We included studies that provided appropriate data on total scores in a meta‐analysis of SMDs in well‐being and quality of life scores (Figure 9).
9.
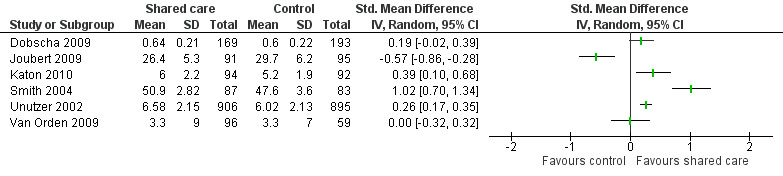
Forest plot of comparison: 3 Health‐related quality of life scores, outcome: 3.1 HRQoL mean scores.
2.2 Functional impairment and disability
Nine studies presented measures related to functional impairment, productivity and disability; three found benefit in relation to functional impairment for shared care (Joubert 2009 (Rankin score); Katon 1999; Unutzer 2002). Solberg 2015 reported improvements in productivity following shared care for depression. Drummond 1994 found limited or no difference in the mean number of nights of disturbed sleep per week or in the mean number of days of restricted activity per month. Joubert 2009 found limited or no difference in occupational performance measured by the Barthel Index. Katon 1999 reported on only two dimensions of the SF‐36 score and found limited or no differences between groups. Investigators described a trend towards improved social functioning in the shared care group but limited or no differences in role limitations due to emotional problems. Rea 2004 reported on eight dimensions of the SF‐36 score (but did not include social functioning) and found limited or no differences between groups overall. In Table 4, we have presented only the SF‐36 data from Katon 1999 and Rea 2004 that are common to both studies ‐ role limitation (emotional) scores ‐ so that a comparison can be made for this outcome. Scherpbier‐de Haan 2013 used the WONCA (World Organization of National Colleges and Academies) functional health status measure and found limited or no differences in any of its five domains.
Byng 2004 also reported PROMs analysing patients' perceptions of met and unmet needs and found limited or no differences between groups for these measures.
A range of studies reported 12 other PROMs, five of which showed an intervention effect (Table 4).
3. Hospital admissions
Nine studies ‐ eight RCTs (Dendale 2012; DICE 1994; Dobscha 2009; Doughty 2002; Drummond 1994; Johannson 2001; Rea 2004; Warner 2000) and one CBA (Wood 1994) ‐ examined effects of shared care on hospital admissions (Table 5) and found probably little or no difference, with only a third of studies reporting this outcome showing benefit. Studies revealed a trend towards association of shared care with reduced hospital admissions among older patients and reduced admissions related to specific conditions targeted for shared care.
4. Hospital admissions.
| Study (condition) | Study type | Outcome | Result | Notes |
| Doughty (CCF) | RCT | Mean time to first re‐admission (days) | Int: 102 (sd 104). Con: 122 (sd 116). Absolute difference 20. Relative % difference 16%. | SES = 0.18 |
| Doughty (CCF) | RCT | Number of all‐cause re‐admissions | Int: 56. Con: 95. Absolute difference 39. Relative % difference 41%. | * |
| Doughty (CCF) | RCT | Total hospital bed days | Int: 1074. Con: 1170. Absolute difference 96. Relative % difference 8%. | * |
| Doughty (CCF) | RCT | Re‐admssion rate per patient per year | Int: 1.37. Con: 1.84. Absolute difference 0.47. Relative % difference 26%. | |
| Doughty (CCF) | RCT | Bed days per patient per year | Int: 12.3. Con: 13.9. Absolute difference 1.6. Relative % difference 12%. | * |
| Drummond (asthma) | RCT | Mean number admissions for asthma | Int: 0.15 (sd 0.36). Con: 0.11 (sd 0.32). Absolute difference 0.04. Relative % difference 36%. | SES = 0.12 |
| Johannson (cancer) | RCT | Mean number admissions for patients < 70 | Int: 1 (sd 1). Con: 0.9 (sd 0.8). Absolute difference 0.1. Relative % difference 11%. | SES = 0.11 |
| Johannson (cancer) | RCT | Mean number admissions for patients ≥ 70 | Int: 0.4 (sd 0.6). Con: 0.9 (sd 1). Absolute difference 0.5. Relative % difference 55%. | SES = 0.63* |
| Johannson (cancer) | RCT | Mean number of days hospitalised for patients < 70 | Int: 4.4 (sd 5.9). Con: 3.6 (sd 4.9). Absolute difference 0.8. Relative % difference 22%. | SES = 0.15 |
| Johannson (cancer) | RCT | Mean number of days hospitalised for patients ≥ 70 | Int: 3.8 (sd 8.8). Con: 8.9 (sd 18.8). Absolute difference 5.1. Relative % difference 57%. | SES = 0.36* |
| Rea (COPD) | RCT | Mean number admissions in days per patient per year ‐ all causes | Int: 3.2. Con: 6.8. Absolute difference 3.6. Relative % difference 53%. | No standard deviations available |
| Rea (COPD) | RCT | Mean number admissions in days per patient per year ‐ respiratory | Int: 1.1. Con: 4. Absolute difference 2.9. Relative % difference 72%. | No standard deviations available* |
| Warner (chronic mental illness) | RCT | Median number of admissions | Int: 0.65. Con: 0.52. Absolute difference 0.13. Relative % difference 25%. | |
| Wood (chronic mental illness) | CBA | Median number of inpatient days | Int: 0 (IQR 22‐0). Con: 19 (IQR 81‐0). Absolute difference 19. Relative % difference 100%. | * |
| Wood (chronic mental illness) | CBA | % re‐admitted in 2 years post intervention | Int: 16/59. Con: 38/59. Absolute difference 37%. Relative % difference 58%. | * |
| Dendale (heart failure) | RCT | Mean number of heart failure‐related re‐admissions/patient | Int: 0.24 (sd 0.51). Con: 0.42 (sd 0.7). Absolute difference ‐0.18. Relative % difference 43%. | SES = 0.30 |
| Dendale (heart failure) | RCT | Mean number of renal failure‐related re‐admissions/patient | Int: 0.06 (sd 0.25). Con: 0.02 (sd 0.16). Absolute difference 0.04. Relative % difference 2%. | SES = 0.20 |
| Dendale (heart failure) | RCT | Mean number of re‐admissions/patient for other reasons | Int: 0.48 (sd 0.83). Con: 0.36 (0.66). Absolute difference 0.12. Relative % difference 33%. | SES = 0.16 |
| Dendale (heart failure) | RCT | Mean days lost to HF hospitalisations/patient | Int: 2.5 (sd 6.7). Con: 4.6 (9.3). Absolute difference ‐2.1. Relative % difference 46%. | SES = 0.26 |
| Dendale (heart failure) | RCT | Mean days lost to RF hospitalisations/patient | Int: 1.0 (sd 5.4). Con: 0.1 (1.2). Absolute difference 0.9. Relative % difference 9%. | SES = 0.27 |
| Dendale (heart failure) | RCY | Mean days lost to hospitalisations for other reasons/patient | Int: 3.4 (sd 10.2). Con: 3.2 (sd 7.9). Absolute difference 0.2. Relative % difference 6.3%. | SES = 0.02 |
| Dendale (heart failure) | RCT | Mean days lost to all hospitalisations/patient | Int: 7.1 (sd 13.0). Con: 8.0 (sd 12.8). Absolute difference ‐0.9. Relative % difference 11%. | SES = 0.07 |
| Dobscha (chronic pain) | RCT | % with any inpatient admission | Int: 22/185. Con: 28/212. Absolute difference ‐1%. Relative % difference 7.8%. |
DICE 1994 reported limited or no differences between groups in hospital admissions but provided no supporting data. Remaining studies used a variety of measures to examine effects on admissions, including time to first re‐admission, re‐admission rates, mean and median numbers of admissions, total hospital bed days and bed days per patient per year. Dendale 2012 reported seven measures related to admission, with none showing a difference between intervention and control participants. Dobscha 2009 found limited or no differences in the proportion of participants having any admission. Doughty 2002 reported several measures and incorporated time to first re‐admission into the primary outcome. This study included participants with chronic congestive cardiac failure who had a high baseline rate of admissions and high morbidity levels and found that the intervention reduced the number of all‐cause re‐admissions and the total number of bed days and bed days per participant per year but did not have an effect on mean time to first re‐admission or re‐admission rate per participant per year. Drummond 1994 found limited or no differences in admission rates between shared care and control participants. Johannson 2001 examined admissions among patients older and younger than 70 years of age with cancer and found an effect favouring shared care in the over‐70 group only, with an absolute reduction in mean number of admissions of 0.5 and an absolute difference in days hospitalised of five days, favouring shared care. Rea 2004 found limited or no differences in the mean number of admissions for all causes but a difference of 2.9 days in the mean number of respiratory admissions, favouring shared care. Warner 2000 found limited or no differences in the median number of admissions between shared care and control participants with chronic mental illness. Wood 1994 reported a CBA in which results showed a reduction in the proportion of participants with chronic mental illness in the intervention group who were re‐admitted over the two years following the introduction of shared care and a lower median number of inpatient days.
4. Process of care
Twenty‐six studies reported a range of measures related to the process of care. Overall, researchers found probably little or no difference in service utilisation and medication‐related outcomes and probably modest effects on management of risk factors. These findings are based on evidence of moderate certainty.
4.1 Service utilisation
Twelve studies reported measures of service utilisation; three of these indicated increased disease‐related visits for the shared care group (Table 6).
5. Process outcomes: service utilisation.
| Study (condition) | Study type | Outcome | Results | Notes |
| Drummond (asthma) | RCT | Mean number of GP visits | Int: 2.7 (sd 3.2). Con: 2.5 (sd 2.7). Absolute difference 0.2. Relative % difference 8%. | SES = 0.07 |
| Katon 1999 (depression) | RCT | Mean number PCP visits | Int: 3.4 (sd 4.3). Con: 3.3 (sd 3.1). Absolute difference 0.1. Relative % difference 3%. | SES = 0.03 |
| Johannson (cancer) | RCT | Mean number of OPD visits (patients < 70) | Int: 13.4 (sd 11.2). Con: 12.9 (sd 11.5). Absolute difference 0.5. Relative % difference 4%. | SES = 0.04 |
| Johannson (cancer) | RCT | Mean number of OPD visits (patients ≥ 70) | Int: 6.8 (sd 8.8). Con: 6 (sd 7). Absolute difference 0.8. Relative % difference 13%. | SES = 0.1 |
| Warner (chronic mental illness) | RCT | Median number of outpatient clinic visits | Int: 1.5. Con: 1.46. Absolute difference 0.04. Relative % difference 3%. | No standard deviations available |
| Dice (diabetes) | RCT | Mean number of diabetes care visits | Int: 5.3 (sd 1.4). Con: 4.8 (sd 1.7). Absolute difference 0.5. Relative % difference 10%. | SES = 0.32 |
| Katon 1999 (depression) | RCT | Mean number of PCP visits for depression | Int: 1.46 (sd 2). Con: 1.15 (sd 2). Absolute difference 0.31. Relative % difference 27%. | SES = 0.16. Pooled sd calculated from group confidence intervals* |
| Smith 2004 (diabetes) | RCT | Mean number of diabetes‐related GP visits | Int: 4.49 (sd 3.2). Con: 3.73 (sd 3.3). Absolute difference 0.76. Relative % difference 20%. | SES = 0.23 |
| Swindle (depression) | RCT | Mean number of mental health care visits | Int: 5.7 (sd 11.1). Con: 2.9 (sd 7.2). Absolute difference 2.8. Relative % difference 96%. | SES = 0.3* |
| Rea (COPD) | RCT | % patients attending pulmonary rehab | Int: 38/83. Con: 11/52. Absolute difference 0.25. Relative % difference 119%. | * |
| Donohue (diabetes) | RCT | Patient report of receiving a diabetes review | Int: 365/480. Con: 355/479. Absolute difference 2%. Relative % difference 3%. | |
| Meulepas (asthma) | RCT | % patients with planned visits | Int: 38/87. Con: 20/79. Absolute difference 18.4%. Relative % difference 73%. | * |
| Dobscha (chronic pain) | RCT | Mean number of primary care appointments | Int: 2.0 (sd 1.7). Con: 2.2 (sd 1.7). Absolute difference ‐0.2. Relative % difference 9%. | SES = 0.12 |
| Dobscha (chronic pain) | RCT | Mean number of total ambulatory visits | Int: 13.7 (sd 14). Con: 13.8 (sd 14). Absolute difference ‐0.1. Relative % difference 0.7%. | SES = 0.01 |
| Dobscha (chronic pain) | RCT | % with any physical therapy appointments | Int: 87/185. Con: 34/212. Absolute difference 32%. Relative % difference 194%. | * |
| Dobscha (chronic pain) | RCT | % with any pain speciality appointments | Int: 13/185. Con: 6/212. Absolute difference 4%. Relative % difference 1.3%. | |
| Dobscha (chronic pain) | RCT | % with any mental health appointments | Int: 83/185. Con: 59/212. Absolute difference 17%. Relative % difference 61%. | |
| Dobscha (chronic pain) | RCT | % with any orthopaedics or neurosurgery appointments | Int: 30/185. Con: 28/212. Absolute difference 3%. Relative % difference 23%. | |
| Dobscha (chronic pain) | RCT | % with any emergency department visits | Int: 56/185. Con: 64/212. Absolute difference 0%. Relative % difference 0%. | |
| Van Orden (mental health) | RCT | Mean patient waiting time | Int: 2.8 (sd 3.2). Con: 6.3 (sd 10.2). Absolute difference ‐3.5. Relative % difference 56%. | SES = 0.52* |
| Van Orden (mental health) | RCT | Mean number of treatment appointments | Int: 12.4 (sd 17.1). Con: 18.9 (sd 18.9). Absolute difference ‐6.5. Relative % difference 34%. | SES = 0.36* |
| Van Orden (mental health) | RCT | % mental health treatment for > 1 year after baseline | Int: 25/96. Con: 26/59. Absolute difference ‐18. Relative % difference 39%. | * |
4.1.1 Primary care and specialist visits
Four studies reported total primary care or GP visits (Dobscha 2009; Drummond 1994; Katon 1999; Van Orden 2009); three of these found limited or no differences between shared care and control groups. Van Orden 2009 found higher numbers of primary care visits among control participants. Two studies reported specialist clinic visits without specifying whether or not they were disease related (Johannson 2001; Warner 2000) and found limited or no differences between groups.
4.1.2 Condition‐related visits
Eight studies reported disease‐related visits (DICE 1994; Dobscha 2009; Donohoe 2000; Katon 2001; Meulepas 2007; Rea 2004; Smith 2004; Swindle 2003). Katon 2001, Swindle 2003 and Van Orden 2009 reported increased disease‐related visits among shared care participants, whereas the remaining five studies found limited or no differences between groups. Donohoe 2000 presented patient‐reported service utilisation and found limited or no differences among participants reporting that they received a diabetes review between shared care and control groups, although this intervention focused primarily on diabetes foot care. Rea 2004 found that a higher proportion of shared care participants attended pulmonary rehabilitation recommended to them as part of the intervention.
4.2 Medication prescribing and adherence
Eighteen studies reported outcomes related to prescribing and medication adherence. Results for these studies are presented in Table 7. Eight studies examined medication adherence and use, and seven of these reported an effect favouring shared care.
6. Process outcomes: medication related.
| Study (condition) | Study type | Outcome | Results | Notes |
| Doughty (CCF) | RCT | % receiving ACE inhibitor | Int: 83/100. Con: 71/97. Absolute difference 0.1. Absolute % difference 14%. | |
| Holm (OAT) | RCT | % median time spent in relation to therapeutic interval for INR | Int: 86.7. Con: 82.4. Absolute difference 4.3. Relative % difference 5.2%. | Includes only patients participating throughout the whole study. Unit of analysis error |
| Katon 1999 (depression) | RCT | % receiving adequate dosage of antidepressant medication | Int: 45/96. Con: 25/96. Absolute difference 21%. Relative % difference 82%. | * |
| Katon 2004 (depression) | RCT | % receiving adequate dosage of antidepressant medication | Int: 87/164. Con: 63/165. Absolute difference 0.15. Relative % difference 39%. | * |
| Swindle (depression) | RCT | % receiving new prescription of antidepressant | Int: 30/99. Con: 29/103. Absolute difference 2%. Relative % difference 7%. | |
| Drummond (asthma) | RCT | Mean number of bronchodilators prescribed | Int: 10.1 (sd 8.6). Con: 10.6 (sd 9.0). Absolute difference 0.5. Relative % difference 5%. | SES = 0.06 |
| Drummond (asthma) | RCT | Mean number of inhaled steroids prescribed | Int: 6.4 (sd 4.2). Con: 6.5 (sd 4.52). Absolute difference 0.1. Relative % difference 1.5%. | SES = 0.02 |
| Drummond (asthma) | RCT | Mean number course oral steroids | Int: 1.6 (sd 1.82). Con: 1.6 (sd 2.26). Absolute difference 0. Relative % difference 0%. | SES = 0 |
| Llewelyn‐Jones (depression) | RCT | Mean daily dose antidepressant medication | Int: 57.1. Con: 37.9. Absolute difference 19.2. Relative % difference 51%. | SES = 0.63. Calculated using pooled sd from baseline data |
| Llewelyn‐Jones (depression) | RCT | Mean number of depressogenic drugs | Int: 0.47. Con: 0.44. Absolute difference ‐0.03. Relative % difference ‐7%. | No standard deviations given |
| Katon 1999 (depression) | RCT | % adhering to antidepressant medication | Int: 70/96. Con: 49/96. Absolute difference 22%. Relative % difference 43%. | * |
| Katon 1999 (depression) | RCT | % with antidepressant medication refills | Int: 66/96. Con: 42/96. Absolute difference 25%. Relative % difference 57%. | * |
| Katon 2001 (depression) | RCT | % filling antidepressant medication script | Int: 109/174. Con: 76/152. Absolute difference 13%. Relative % difference 26%. | * |
| Katon 2004 (depression) | RCT | % adhering to antidepressant medication | Int: 94/164. Con: 76/165. Absolute difference 0.11. Relative % difference 24%. | * |
| Smith 04 (diabetes) | RCT | % taking lipid‐lowering medication | Int: 40/87. Con: 29/83. Absolute difference 11%. Relative % difference 31%. Absolute change from baseline: Int: 24%. Con: 19%. Difference in absolute change from baseline 5%. | |
| Smith 04 (diabetes) | RCT | % taking aspirin/warfarin | Int: 54/87. Con: 42/83. Absolute difference 11%. Relative % difference 22%. Absolute change from baseline: Int: 15%. Con: ‐6%. Difference in absolute change from baseline 21%. | |
| Goderis (diabetes) 2009 | RCT | % antiplatelet therapy use | Int: 62%. Con: 48%. Absolute difference 14%. Relative % difference 29%. | * |
| Goderis (diabetes) 2009 | RCT | % taking statin | Int: 55%. Con: 49%. Absolute difference 6%. Relative % difference 12%. | |
| Unutzer (depression) | RCT | % antidepressant medication use | Int: 649/889. Con: 496/870. Absolute difference 16%. Relative % difference 28%. | * |
| Meulepas (asthma) | RCT | % not needing to take emergency medications | Int: 122/146. Con: 144/189. Absolute difference 8%. Relative % difference 11%. | |
| Fortney (depression) | RCT | % adhering to medication | Int: 84/146. Con: 88/189. Absolute difference 11%. Relative % difference 23%. | * |
| Callahan (Alzheimer) | RCT | % receiving cholinesterase inhibitors | Int: 67/84. Con (augmented usual care): 38/69. Absolute difference 24.7%. Relative % difference 45%. | * |
| Callahan (Alzheimer) | RCT | % receiving antidepressants | Int: 38/84. Con (augmented usual care): 19/69. Absolute difference 17.7%. Relative % difference 64%. | * |
| Callahan (Alzheimer) | RCT | % receiving antipsychotics | Int: 11/84. Con (augmented usual care): 5/69. Absolute difference 5.8%. Relative % difference 79%. | |
| Callahan (Alzheimer) | RCT | % receiving sedative‐hypnotics | Int: 8/84. Con (augmented usual care): 7/69. Absolute difference ‐0.6%. Relative % difference 5.9%. | |
| Dobscha (chronic pain) | RCT | % prescribed opioids | Int: 120/185. Con: 129/212. Absolute difference 4%. Relative % difference 7%. | |
| Dobscha (chronic pain) | RCT | % prescribed antidepressants | Int: 99/185. Con: 83/212. Absolute difference 14%. Relative % difference 36%. | * |
| Dobscha (chronic pain) | RCT | % prescribed NSAIDs | Int: 115/185. Con: 83/212. Absolute difference 23%. Relative % difference 59%. | * |
| Dobscha (chronic pain) | RCT | % prescribed capsaicin | Int: 81/185. Con: 11/212. Absolute difference 39%. Relative % difference 780%. | * |
| Smith 2008 (diabetes) | RCT | % prescribed aspirin | Int: 238/358. Con: 145/277. Absolute difference 14. Relative % difference 27%. | * |
| Smith 2008 (diabetes) | RCT | % prescribed ACE inhibitor/angiotensin receptor blocker | Int: 193/358. Con: 155/277. Absolute difference 2%. Relative % difference 3.6%. | |
| Smith 2008 (diabetes) | RCT | % prescribed statins | Int: 172/358. Con: 127/277. Absolute difference 2. Relative % difference 4.3%. | |
| Scherpbier de Hann (CKD+) | RCT | % prescribed statins | Int: 66/90. Con: 38/74. Absolute difference 22%. Relative % difference 43%. | * |
| Scherpbier de Hann (CKD+) | RCT | % prescribed ACE inhibitors | Int: 73/90. Con: 47/74. Absolute difference 17.5%. Relative % difference 27.5%. | * |
| Van Orden (mental health) | RCT | % of patients using medication (antidepressants, benzodiazepines or antipsychotics) | Int: 27/96. Con: 18/59. Absolute difference ‐2.4%. Relative % difference 7.9%. |
ACE: Angiotensin converting enzyme.
INR: International normalised ratio.
NSAID: Non‐steroidal anti‐inflammatory drugs.
4.2.1 Appropriate prescribing
Ten studies examined the proportions of patients prescribed appropriate medication or appropriate doses of medication for their condition (Callahan 2006; Dobscha 2009; Doughty 2002; Holm 2002; Katon 1999; Katon 2004; Scherpbier‐de Haan 2013; Smith 2004; Smith 2008; Swindle 2003). Several of these recorded multiple medicines and variation in effect between medicines. For example, Callahan 2006 reported four prescribing measures, two of which showed an effect favouring shared care. Dobscha 2009 reported an effect for three of four medicines outcomes. Scherpbier‐de Haan 2013 reported higher proportions of participants receiving lipid‐lowering and angiotensin‐converting enzyme (ACE) inhibitor therapy for CKD. Smith 2008 reported a positive effect for only one of five medicine outcomes. Doughty 2002, Smith 2004 and Swindle 2003 found limited or no differences in appropriate prescribing. Katon 1999 and Katon 2004 reported an increase in proportions receiving adequate doses of antidepressants in the shared care group. Meta‐analysis of five of these studies with available data revealed benefit for shared care (RR 1.25, 95% CI 1.07 to 1.46; Figure 10), but this must be interpreted in the overall context that the 10 studies reported on 26 different outcomes related to appropriate prescribing, and less than half of these outcomes (11/26) showed a positive effect.
10.
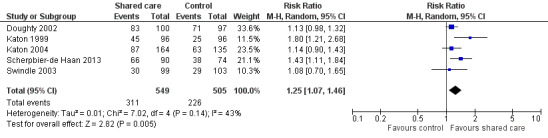
Forest plot of comparison: 5 Process outcomes ‐ medication prescribing, outcome: 5.1 Process outcomes ‐ % appropriate medication.
Holm 2002 reported benefit for shared care in relation to participants given oral anticoagulation therapy, with shared care participants spending a higher percentage of time within the therapeutic interval for the international normalised ratio (INR) ‐ a measure of anticoagulation control. We carried out meta‐analysis for the four studies with available data and found benefit for shared care in relation to the proportions of participants receiving appropriate medication (Analysis 5.1)
5.1. Analysis.
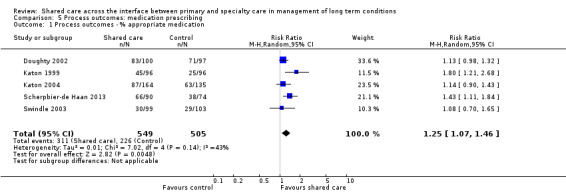
Comparison 5 Process outcomes: medication prescribing, Outcome 1 Process outcomes ‐ % appropriate medication.
Two studies (Drummond 1994; Llewelyn‐Jones 1999) reported on the mean number of appropriate drugs prescribed or mean daily dose. Neither study found a difference between groups. Llewelyn‐Jones 1999 also considered the use of inappropriate medication and reported the mean number of depressogenic drugs; this group found limited or no differences between groups at study completion (7% relative difference, with control participants receiving marginally less inappropriate medication).
Rea 2004 collected and compared a range of medications prescribed for 42 control and 63 intervention participants with COPD who were receiving primary care and found no evidence of change in prescribing for either group throughout the trial. We did not include these data in Table 7, as the information was too detailed and was impossible to interpret without additional clinical details.
4.2.2 Medication adherence and use
Eight studies (Callahan 2006; Fortney 2007; Goderis 2010; Katon 1999; Katon 2001; Katon 2004; Unutzer 2002; Van Orden 2009) considered measures of medication adherence and patient use. All except Van Orden 2009 found consistent benefit in favour of shared care across a variety of measures, including proportions adhering to medication and seeking antidepressant medication refills. We did not undertake meta‐analysis for these studies because of the high numbers of measures within studies, and because no single measures of adherence were identified as the primary outcome.
4.3 Risk factors for management, review or referral
Eight studies reported outcomes related to quality in the process of care provided (Byng 2004; DICE 1994; McGhee 1994; Menchetti 2013; Meulepas 2007; Smith 2004; Smith 2008; Swindle 2003). Five of these eight studies found benefit for some process of care measures used in shared care systems (Table 8). DICE 1994 and Smith 2004 reported multiple measures of the process of care, and each study presented the median value for process of care measures. DICE 1994 found improvements in the process of care for shared care participants, whereas Smith 2004 did not. McGhee 1994 reported proportions of participants with completed reviews for hypertension and found benefit favouring shared care. Swindle 2003 reported two separate measures ‐ the proportion of participants with a record of their depression diagnosis in their medical record, and the proportion referred to a mental health specialist at their index visit. The shared care group showed improvement in both measures. Byng 2004 and Smith 2008 reported a composite measure of the process of care and found limited or no differences between groups. Meulepas 2007 reported a difference in lung function measurement in favour of shared care but limited or no differences in recording of smoking. Menchetti 2013 found limited or no differences in proportions referred to mental health specialists.
7. Process outcomes: risk factor management, review or referral.
| Study (condition) | Study type | Outcome | Results | Notes |
| Byng (chronic mental illness) | RCT | Mean total score process of care | Int: 5.69. Con: 6.4. Absolute difference ‐0.71. Relative % difference 11%. | No standard deviations available |
| Dice (diabetes) | RCT | Median % recording of risk factors | Int: 115/124. Con: 62/111. Absolute difference 37%. Relative % difference 66%. | * |
| McGhee (hypertension) | RCT | % with completed hypertension review | Int: 220/267. Con: 146/270. Absolute difference 28%. Relative % difference 52%. | * |
| Smith 2004 (diabetes) | RCT | Median % of risk factors recorded in previous year | Int: 58/84. Con: 36/85. Absolute difference 26%. Relative % difference 61%. | Data from study author, no cluster analysis available |
| Meulepas (asthma) | RCT | Lung function measurement | Int: 58/87. Con: 14/79. Absolute difference 49%. Relative % difference 27%. | * |
| Meulepas (asthma) | RCT | Smoking advice recorded | Int: 87/87. Con: 46/79. Absolute difference 42%. Relative % difference 72%. | |
| Swindle (diabetes) | RCT | % with depression diagnosis recorded in chart | Int: 65/99. Con: 37/103. Absolute difference 30%. Relative % difference 83%. | * |
| Swindle (diabetes) | RCT | % referred to mental health specialist at index visit | Int: 30/99. Con: 12/103. Absolute difference 18%. Relative % difference 150%. | * |
| Menchetti (depression) | RCT | % referred for specialist visit | Int: 10/128. Con: 10/99. Absolute difference 2%. Relative % difference 20%. | |
| Smith 2008 (diabetes) | RCT | Process of diabetes care (ADA‐NCQA) median | Int: 56. Con: 58. Absolute difference ‐2. Relative % difference 3.4%. | No standard deviations provided |
ADA‐NCQA: American Diabetes Association ‐ National Committee for Quality Assurance
5. Default and participation rates
Seven studies reported measures related to participation in or default from services (Dey 2002; DICE 1994; Hoskins 1992; McGhee 1994; Smith 2004; Van Orden 2009; Warner 2000). Five of these seven studies reported improved participation rates for shared care participants (Table 9). Evidence of moderate certainty shows probably modest effects on participation and default rates, with most studies reporting this outcome showing benefit.
8. Participation and default rates.
| Study (condition) | Study type | Outcome | Results | Notes |
| Dey (opiate misusers) | RCT | Participation in shared care | Int: 18/75. Con: 0/80. Absolute difference 24%. | Control participant could not participate in shared care by definition |
| Dice (diabetes) | RCT | % lost to follow‐up | Int: 4/139. Con: 14/135. Absolute difference 7%. Relative % difference 70%. | |
| Hoskins (diabetes) | RCT | % non‐attenders | Int: 28/72. Con: 30/69. Absolute difference 4%. Relative % difference 9%. | * |
| McGhee (hypertension) | RCT | % dropped out of care | Int: 8/258. Con: 33/232. Absolute difference 11%. Relative % difference 79%. | * |
| Smith 2004 (diabetes) | RCT | % patients reporting defaulting from care | Int: 6/84. Con: 3/85. Absolute difference 3%. Relative % difference 85%. | *Comparison of change from baseline in shared care and control participants indicates benefit for shared care* |
| Warner (chronic mental illness) | RCT | Median number of clinic defaults | Int: 0.94. Con: 0.9. Absolute difference 0.04. Absolute % difference 4%. | |
| Van Orden (mental health) | RCT | % of patients no longer in treatment at 12 months | Int: 72%. Con: 54%. Absolute difference 18. Relative % difference 33.3%. | * |
Dey 2002 found increased participation in shared care, but, by definition, control patients could not participate, and, in fact, even intervention group patients appeared to have had low participation rates, with only 24% participating. DICE 1994 reported proportions lost to follow‐up and found limited or no differences between groups. Three studies (Hoskins 1992; McGhee 1994; Warner 2000) reported drop‐out or default rates. Hoskins 1992 and McGhee 1994 found benefits favouring shared care participants, although Warner 2000 found limited or no differences. Smith 2004 reported differences among participants described as defaulting from care at study completion, including a drop from baseline of 8% in the shared care group and an increase of 7% in the control group (the paper provided no raw data). Van Orden 2009 reported a larger number of participants in the intervention group no longer in treatment for depression owing to remission.
Warner 2000 reported another aspect of the uptake of shared care; 44% of the 55 participants given a shared record card recalled ever using it, and only half of these returned the record card at the end of the study for analysis, indicating that the record card was not used as intended by most participants in the shared care group.
6. Satisfaction with treatment
Sixteen studies reported measures of treatment satisfaction (Table 10). The eight studies that reported mean treatment satisfaction scores were largely negative, whereas those reporting proportions satisfied with care were predominantly positive. Studies provided no clear reason for this inconsistency, which may be related to differences in the way questions regarding treatment satisfaction are framed.
9. Treatment satisfaction.
| Study (condition) | Design | Outcome | Results | Notes |
| Byng (chronic mental illness) | RCT | Mean total satisfaction score | Int: 3.71. Con: 3.66. Absolute difference 0.05. Relative % difference 1.4%. | No standard deviations available |
| Dice (diabetes) | RCT | Mean satisfaction score in patients with type 2 diabetes | Int: 42.3 (sd 5.6). Con: 41.1 (sd 6.2). Absolute difference 1.2. Relative % difference 3%. | SES = 0.21 |
| Dice (diabetes) | RCT | Mean satisfaction score in type 1 patients with type 1 diabetes | Int: 51.9 (sd 7.5). Con: 49.8 (sd 7.5). Absolute difference 2.1. Relative % difference 4%. | SES = 0.28 |
| Swindle (depression) | RCT | Overall satisfaction score | Int: 3.2 (sd 0.9). Con: 3.2 (sd 0.9). Absolute difference 0. Relative % difference 0. | SES = 0 |
| Warner (depression) | RCT | Mean client satisfaction score | Int: 22.3 (sd 6.5). Con: 23.4 (sd 4.4). Absolute difference 1.1. Relative % difference 4.7%. | SES = 0.2 |
| Richards (depression) | RCT | Mean CSQ‐8 score | Int: 25.3 (sd 5.8). Con: 22.1 (sd 6.2). Absolute difference 3.2. Relative % difference 14.5%. | SES = 0.52* |
| Solberg (depression) | RCT | Mean treatment satisfaction score | Int: 3.95. Con: 3.44. Absolute difference 0.51. Relative % difference 15%. | *No standard deviations available |
| Drummond (asthma) | RCT | % patients very satisfied with care | Int: 256/333. Con: 286/333. Absolute difference ‐9%. Relative % difference ‐10%. | *Favours control |
| Katon 1999 (depression) | RCT | % rating care as very good to excellent | Int: 68/86. Con: 51/80. Absolute difference 16%. Relative % difference 25%. | * |
| Katon 2004 (depression) | RCT | % moderately or very satisfied with treatment | Int: 106/146. Con: 76/141. Absolute difference 0.19. Relative % difference 35%. | * |
| Smith 2004 (diabetes) | RCT | % very satisfied on diabetes treatment satisfaction measure | Int: 49/87. Con: 22/83. Absolute difference 29%. Relative % difference 107%. | * |
| Unutzer (depression) | RCT | % rating depression care as very good/excellent | Int: 676/889. Con: 409/870. Absolute difference 29%. Relative % difference 62%. | * |
| Fortney (depression) | RCT | % satisfied with care | Int: 100/146. Con: 113/189. Absolute difference 10%. Relative % difference 16%. | * |
| Katon 2010 (diabetes/CHD/depression) | RCT | % satisfied with diabetes/CHD/depression care | Int: 77/92. Con: 62/88. Absolute difference 13.2%. Relative % difference 18.7%. | * |
| Dobscha (chronic pain) | RCT | Mean global treatment satisfaction | Int: 2.7 (sd 1.05). Con: 2.6 (sd 1.12). Absolute difference 0.1. Relative % difference 3.8%. | SES = 0.09 |
| Fihn (ischaemic heart disease) | RCT | Adjusted difference satisfaction with provider | Intervention effect coefficient 1.54. | |
| Fihn (ischaemic heart disease) | RCT | Adjusted difference treatment satisfaction (SAQ) | Intervention effect coefficient 1.22. | |
| Van Orden (mental health) | RCT | Mean patient satisfaction | Int: 6.6 (sd 1.5). Con: 6.7 (sd 1.5). Absolute difference ‐0.1. Relative % difference 1.5%. | SES = 0.06 |
| Van Orden (mental health) | RCT | Mean GP satisfaction | Int: 4.0 (sd 0.7). Con: 3.7 (sd 0.7). Absolute difference 0.3. Relative % difference 8.1%. | SES = 0.43* |
CSQ‐8: Client Satisfaction Questionnaire.
CHD: coronary Heart Disease.
SAQ: Seattle Angina Questinnaire.
6.1 Mean treatment satisfaction scores
Eight studies reported mean satisfaction scores (Byng 2004; DICE 1994; Dobscha 2009; Richards 2008; Solberg 2015; Swindle 2003; Van Orden 2009; Warner 2000). Six of the eight studies found limited or no differences between shared care and control groups. We included these in a meta‐analysis with pooled estimates not displayed owing to high statistical heterogeneity (Analysis 4.1;Figure 11). Byng 2004 provided no standard deviations, so could not be included in the meta‐analysis. We did not include Solberg 2015 in this meta‐analysis owing to the high risk of selection bias evident in this non‐randomised study.
4.1. Analysis.
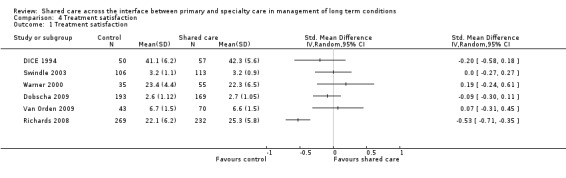
Comparison 4 Treatment satisfaction, Outcome 1 Treatment satisfaction.
11.
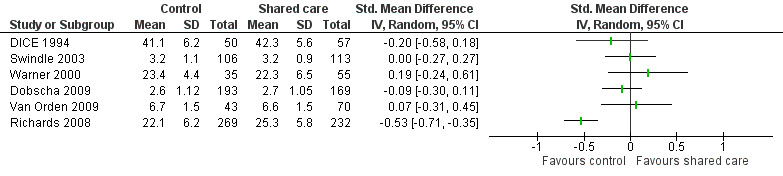
Forest plot of comparison: 4 Treatment satisfaction, outcome: 4.1 Treatment satisfaction.
6.2 Proportions satisfied with care
Seven studies reported proportions of participants moderately or very satisfied with care or rating care as 'very good to excellent'; six of these found improvements favouring shared care. In Drummond 1994, control participants were more satisfied with their usual hospital clinic‐based care.
7. Patient health behaviours
Eight of the included studies reported outcomes related to patient health behaviours. Outcomes were predominantly negative and were based on evidence of moderate certainty; investigators found little or no effect on these outcomes, which we have summarised in Table 11.
10. Patient health behaviours.
| Study (condition) |
Study Type |
Outcome | Results | Notes |
| Katon 2010 (Diabetes/CHD/depression) | RCT | Adherence to diet | Int: 68/79. Con: 63/78. Absolute difference 5%. Absolute % difference 6%. | |
| Katon 2010 (Diabetes/CHD/depression) | RCT | Adherence to exercise | Int: 43/79. Con: 34/78. Absolute difference 10.8%. Absolute % difference 25%. | |
| Joubert (stroke) | RCT | % taking > 1 drink alcohol per day | Int: 13/91. Con: 21/95. Absolute difference 8%. Absolute % difference 36%. | |
| Joubert (stroke) | RCT | % smoking | Int: 14/91. Con: 10/92. Absolute difference 4%. Absolute % difference 36%. | |
| Meulepas (asthma) | RCT | % smoking | Int: 81/87. Con: 21/95. Absolute difference 71%. Absolute % difference 322%. | |
| Goderis (diabetes) | RCT | % smoking | Int: 12%. Con: 12%. Absolute difference 0%. Absolute % difference 0%. | |
| Duran (diabetes) | RCT | % current smokers | Int: 7/57. Con: 7/59. Absolute difference 0. Relative % difference 0%. | |
| Scherpbier de Hann (CKD+) | RCT | % smoking | Int: 11/90. Con: 10/74. Absolute difference 1.4%. Relative % difference 10%. | |
| Fihn (ischaemic heart disease) | RCT | Adjusted difference AUDIT‐C alcohol | Intervention effect coefficient 0.15 | |
| Smith 2008 (diabetes) | RCT | % not smoking/advised to quit | Int: 343/358. Con: 257/277. Absolute difference 3. Relative % difference 3.2%. | * |
AUDIT‐C: Alcohol Use Disorders Identification Test.
Four studies reported on proportions smoking, and three showed limited or no differences (Joubert 2009; Meulepas 2007; Scherpbier‐de Haan 2013). The fourth study (Smith 2008) reported a difference in proportions smoking combined with proportions given advice to quit; this smoking outcome is different from those reported in the other three studies. Fihn 2011 and Joubert 2009 found limited or no differences in alcohol‐related behaviours. Katon 2010 reported limited or no differences in adherence to diet or exercise. Meulepas 2007 reported improvement in inhaler technique among participants in the shared care group. Joubert 2009 reported improvement in five of seven outcomes related to patient recall of advice regarding risk factor management in the shared care group.
8. Cost
Fifteen studies reported cost data; we have presented data from these studies in Table 12. Results were mixed and comparison between studies was difficult, as investigators reported costs in different currencies and at different time points, and most did not clearly state the year of pricing. Results showed variation in costs allocated to each sector depending on how health systems were organised within each country.
11. Costs.
| Study (condition) | Study type | Outcome | Result |
Notes * |
| Fortney/Pyne (depression) |
RCT | Depression‐free days and incremental QALYs | Non‐significant increase in incremental depression‐free days and significant incremental QALY outcome with mean base case incremental cost‐effectiveness ratio of $85,634/QALY. | |
| Katon 1999 (depression) | RCT | Incremental cost per depression‐free day | $35 | |
| Katon 2001 (depression) | RCT | Incremental cost‐effectiveness per additional depression‐free day | $24 | |
| Unutzer (depression) | RCT | Total outpatient cost per additional depression‐free day | $1.92 | |
| Donohue (diabetes) | RCT | Total cost of intervention | £4216 | Costs related to delivery of intervention to 5 practices with 981 patients |
| McGhee (hypertension) | RCT | Cost per complete review in year 2 | Int: £40.86. Con: £71.32. Absolute difference £30.46. Relative % difference 43%. | |
| Smith 2004 (diabetes) | RCT | Total healthcare cost per patient per year | £127.37 | 1999 prices |
| Byng (chronic mental illness) | RCT | Direct costs to healthcare system per patient | Int: £78‐101. Con: £55. Absolute difference £23‐46. Relative % difference 42%‐83%. | Costs varied for each practice. Costs reported 1994. |
| DICE (diabetes) | RCT | Direct costs to patient per year | Int: £1.70. Con: £8. Absolute difference £6.30. Relative % difference 79%. | * |
| Drummond (asthma) | RCT | Amount saved per intervention group per patient per year | Hospital: £3.06. GP: £2.41. Patients: £39.42. | |
| Hoskins (diabetes) | RCT | Relative costs per patient per year in each group | Hospital: $205. Shared care: $135. GP care: $105. | |
| Huijbregts | RCT | Cost‐effectiveness | ICER: €53,717 per QALY. | |
| Katon 1999 (depression) | RCT | Total healthcare costs | Int: $2466. Con: $2110. Absolute difference $356. Relative % difference 17%. | Difference in pattern of costs |
| Katon 2001 (depression) | RCT | Total healthcare cost per patient per year | Int: $2691. Con: $2619. Absolute difference $72. Relative % difference 3%. | |
| Katon 2010 (depression and diabetes/IHD) |
RCT | Cost‐effectiveness | Mean reduction of 114 days in depression‐free days and estimated difference of 0.335 QALYs (95% CI ‐0.18 to 0.85). Intervention associated with lower OPD costs with reduction of $594 per patient (95% CI ‐$3241 to $2053). | Non‐significant but 99.7% probability that intervention met threshold of < $20,000 per QALY |
| Muntingh | RCT | Cost‐effectiveness | ICER: €6965 per QALY. | * |
| Swindle (depression) | RCT | Total healthcare cost per patient per year | Int: $2183. Con: $1760. Absolute difference $423. Relative % difference 24%. | CNS salaries excluded from intervention costs |
| Unutzer (depression) | RCT | Mean direct costs of intervention per patient per year | $553 | |
| Smith 2008 (diabetes) | RCT | Mean total cost | Int: 6252. Con: 8564. Absolute difference ‐2312. | * |
| Smith 2008 (diabetes) | RCT | Mean outpatient cost | Int: 1842. Con: 2129. Absolute difference ‐288. Relative % difference 14%. | * |
| Van Orden (mental health) | RCT | % mean total cost | Int: 1199 (sd 1621). Con: 1762 (sd 1683). Absolute difference ‐563. Relative % difference 32%. | * |
QALY: Quality Adjusted Life Years.
8.1 Economic analyses
Fifteen studies reported cost data. Seven of the 15 studies incorporated full economic analyses relating cost data to clinical outcomes (Fortney 2007;Huijbregts 2013; Katon 1999; Katon 2001; Katon 2010; Muntingh 2013; Unutzer 2002). Two of the economic analyses reported incremental total costs per additional depression‐free day in the shared care group ranging from $24 (Katon 2001) to $35 (Katon 1999). The third study reported a total outpatient cost per additional depression‐free day of $1.92 per participant (Unutzer 2002) (data from study authors). Katon 2010 reported direct mean medical costs related to the TeamCare intervention over a 12‐month period as $1224 per participant. This study reported on an effective intervention, and investigators published a subsequent economic analysis (Katon 2012), which showed that the intervention led to a mean increase of 114 depression‐free days and an estimated difference of 0.335 quality‐adjusted life‐years (QALYs; 95% CI ‐0.18 to 0.85). The intervention was associated with lower outpatient department (OPD) costs and a reduction of $594 per participant (95% CI ‐$3241 to $2053). Results showed a 99.7% probability that the intervention met the threshold of < $20,000 per QALY. Study authors interpreted this as a high‐value intervention, but results must be interpreted with caution given the wide confidence intervals among estimates and lack of statistical significance. Pyne 2010 performed a cost‐effectiveness analysis of RCT findings reported in Fortney 2007, which examined telemedicine‐based shared care for depression and reported an increase in incremental depression‐free days and an incremental QALY outcome with a mean base case incremental cost‐effectiveness ratio of $85,634/QALY, which researchers interpreted as effective but expensive. Goorden 2013 reported on the cost‐effectiveness of Muntingh 2013 findings and indicated that the shared care intervention was cost‐effective, with an incremental cost‐effectiveness ratio (ICER) per QALY of €6965. Goorden 2014 reported on the cost‐effectiveness of Huijbregts 2013 and found that shared care was less cost‐effective owing to higher costs, with an ICER of €53,717 per QALY. Investigators reported that shared care was dominant to care as usual and offered a promising intervention for depression.
8.2 Direct costs
Thirteen studies reported direct costs of shared care, either alone (Donohoe 2000; McGhee 1994; Smith 2004; Unutzer 2002) or relative to costs among control groups (Byng 2004; DICE 1994; Drummond 1994; Hoskins 1992; Katon 1999; Katon 2001; Smith 2008; Swindle 2003; Van Orden 2009). Byng 2004 reported a range of cost data that are difficult to interpret but stated that its main economic finding was an additional mean direct cost of £63 per participant for those receiving shared care compared with controls (no data were suitable for presentation in Table 12). The other eight studies presented relative costs of shared care and reported mixed results, with four indicating that shared care was more expensive (DICE 1994; Katon 1999; Katon 2001; Swindle 2003) and four reporting savings or lower costs in the shared care group (Drummond 1994; Hoskins 1992; Smith 2008; Van Orden 2009).
Two of these studies reported direct patient costs (DICE 1994; Drummond 1994) and indicated that participant costs were lower when shared care was compared with usual specialty care, mainly as the result of reduced travel costs for the shared care group.
Discussion
Summary of main results
Overview of studies
This review identified 42 studies examining shared care across the primary/specialty interface in chronic disease management. These studies were carried out in a variety of healthcare settings and ranged in duration from three months to three years, with most lasting 12 months. Most of these studies examined complex multi‐faceted interventions for a variety of common chronic diseases, particularly diabetes and depression. Shared care was introduced for several purposes and generally aimed to improve patient care through a variety of mechanisms. Hoskins 1992 described that the intervention (a shared care service for diabetes) was provided to relieve pressure on specialist services and to contain costs. However, increasing activity in primary care may increase the demand for specialist services; more cases and complications are detected as the quality of care improves.
Ten of the 42 included studies reported an information communication technology (ICT) element of the intervention. Only two of these studies used Web‐based discussion platforms for communication between primary and specialty care providers, and three described a telemedicine element of the intervention. Most studies relied on personal or telephone communication, which is surprising given the investment in and development of information technology reported by healthcare systems in industrialised countries.
Only one study (Smith 2004) reported a parallel qualitative exploration of participants' experiences with the newly introduced service (Smith 2003) and only minimally considered provider outcomes or satisfaction with services. The search terms used for the current review may not have revealed parallel qualitative evaluations performed by more recent studies that may be awaiting publication. Consumer involvement in designing or introducing shared care services seemed very limited.
The protocol defined interventions in relation to the taxonomy of Hickman 1994 and added an additional category titled 'other', in case any other shared care‐type interventions were found. Only one study involved a simple shared care intervention ‐ a shared record card (Warner 2000) ‐ and this was the only study that could be fitted into the original taxonomy. The remaining included studies involved complex multi‐faceted interventions so would have to be classified within the 'other' category of the protocol definition of shared care interventions. This suggests that service development has become more complex since the taxonomy was devised. The main strength of the original taxonomy was that it highlighted the types of interventions that could be regarded as involving shared care.
Effectiveness of shared care
An overview of all study results suggests that shared care is effective for depression, but consistent evidence for the effectiveness of shared care in other chronic conditions is lacking. Studies included in this review looked at a variety of outcomes, the most important of which were related to clinical outcomes, mental health outcomes and patient‐reported outcome measures (PROMs). Researchers observed limited or no effect on clinical outcomes generally, apart from some benefit for blood pressure in studies that focused on hypertension, chronic kidney disease and stroke. However, other clinical outcomes including control of mean glycosylated haemoglobin (HBa1c), cholesterol and weight showed no benefit conferred by shared care.
Shared care leads to improvement in mental health outcomes for depression, with improvement in the proportions of shared care patients responding to depression treatment and achieving remission or recovery. These findings were driven by studies examining stepped collaborative care models originally undertaken by Wayne Katon and colleagues (Katon 1999; Katon 2001; Katon 2004; Katon 2010) but now conducted in other settings for several of the depression studies included in this review.
Shared care led to modest effects on PROMs, predominantly health‐related quality of life and functional limitations, with only about half of studies that examined these outcomes showing positive effects. Shared care had modest effects on treatment satisfaction. Results showed limited or no effect on mean treatment satisfaction scores but an effect favouring shared care in most studies that looked at proportions rating their care as good or excellent. Drummond 1994 recruited patients from the specialty sector to participate in shared care and suggested that lack of improvement in mean satisfaction scores may be related to a 'credibility gap' reflecting patients' initial lack of confidence in primary care when they have been used to receiving regular specialist care. Smith 2003 performed a qualitative evaluation and found that patients do value shared care, identifying it particularly with the liaison nurse and practice nurses involved. Mixed results related to treatment satisfaction may reflect the fact that measurement of the quality of health services is complex and should not be approached primarily through the "reductionist filter of user satisfaction" (Beaulieu 2000).
Shared care had little to no effect on hospital admissions, but results reported by a small number of included studies suggested that admissions can be reduced for older patients with cancer and for those with conditions with high baseline morbidity such as heart failure. Investigators found little or no effect on outcomes related to the process of care and service utilisation, but these findings are difficult to interpret, as it may be appropriate or inappropriate to alter visiting rates in either sector, depending on the setting. Generally, studies did not provide sufficient information to permit these judgements.
Shared care showed moderate improvement in appropriate prescribing in the meta‐analysis that examined this outcome, with limited effect on medication adherence. Greater activity in relation to medication prescribing should have an important effect on outcomes of most chronic diseases, as long as no ceiling effects are noted (i.e. participants already have good risk factor management at baseline), as occurred in several of the diabetes studies included in this review. Researchers found a modest effect on recording of risk factors, which was improved in five of the eight studies measuring this outcome. However, recording of risk factors and improvements in prescribing may not lead to improved physical health outcomes for some time, and the relatively short duration of included studies means that this potential effect of shared care was not detected.
Shared care had a modest effect on participation, with improved default or drop‐out rates in five of the seven studies examining this measure. This may be related to the fact that most of the studies measuring this outcome compared shared care with specialist care in hospital settings. A Cochrane systematic review of diabetes care (Griffin 2005) indicated that general practice‐based care is associated with higher patient follow‐up and lower default rates than are seen with outpatient care, which may explain in part findings of the present review related to patient participation.
In summary, we found that shared care improved outcomes of depression but had more limited or modest effects on a range of other outcomes. Results suggest that shared care may be more effective for certain patient groups. Conditions that seem to be improved by shared care include depression and other serious chronic health conditions with high levels of morbidity at baseline, such as congestive cardiac failure (CCF). However, results regarding CCF were based on a small number of studies reporting these outcomes and were not consistent across studies. Other evidence regarding management of interventions for CCF suggests that organisation‐type interventions lead to reduced admissions and mortality (McAlister 2004).
We were not able to identify a simple reason for the modest effects of shared care. The interventions that we examined were of a complex nature, making it difficult to disentangle the components likely to be most effective. The fundamental aspect of shared care is that it should involve a genuine collaboration between primary care and specialty care. It was usually difficult to determine whether this had indeed happened. The depression studies included and their generally positive results suggest that stepped care models of shared care with very clear structures and protocols and co‐ordination by clinical nurse managers may be more effective. However, considerable heterogeneity may be noted among participants with depression across these studies, with some detecting depression and others coding persistent depression in their primary care records. However, all patients were recruited in primary care settings, and this limits potential variation around depression diagnoses (O'Dowd 2014).
The secondary aim of this review was to consider which shared care interventions, or which components of shared care interventions, were most effective. However, it was often difficult to determine the exact contribution of each component and to identify the 'active ingredient' within the range of interventions constituting the full shared care service (Craig 2008). Among studies that considered the complex nature of the interventions examined, three stated that they were unable to define which elements of the intervention were effective (Holm 2002; Katon 1999; Llewelyn‐Jones 1999). Swindle 2003 considered the fact that clinical nurse specialists seem to have undertreated individuals with depression; further exploration of this revealed that clinical nurse specialists did not agree with many of the depression diagnoses that patients had received on the basis of a depression screening questionnaire upon recruitment into the study. Byng 2004 considered that earlier detection of relapse in patients with chronic mental illness in the shared care group could be attributed to improvements in collaboration between primary and specialty care, although investigators did not attempt to measure whether this had happened. Smith 2004 considered that their diabetes shared care intervention may have lacked effectiveness, as the intervention did not incorporate access to a community dietician or funding for protected time for general practitioners (GPs).
We were unable to address the additional secondary aim, which was to consider what the most effective systems had in common, other than the finding that stepped care shared care models are effective for depression. For other chronic conditions, review authors noted heterogeneity between systems in terms of complexity of design, settings and variation in outcomes.
Costs of shared care
It was difficult to compare cost data across the included studies, as they were conducted in different settings, incorporated different costs and, in most cases, did not specify the year of pricing. Despite increasing recognition of the importance of a parallel health economic analysis when a randomised controlled trial is conducted to examine an intervention with potential to improve health outcomes (Smith 2002), only four studies reported an economic analysis linking costs to outcomes. Analysis of costs of shared care was limited by varying effects on effectiveness, but study findings suggested that shared care for depression is cost‐effective. The only conclusion that can be drawn from the economic data is that patient direct costs are lower with shared care than with hospital outpatient care, mainly owing to reduced travel costs.
No study addressed the important area of reimbursement for participating providers or re‐allocation of resources when new services are introduced. These topics require consideration as they are likely to have an impact on sustainability as well as on effectiveness of services. Many reports indicate that primary care practitioners believe they are being asked to take on more services without access to appropriate resources and will resist such developments without adequate resourcing (Hippesley‐Cox 2001).
Overall completeness and applicability of evidence
This updated review includes 42 studies, 39 of which are randomised controlled trials (RCTs), examining a specific model of shared care between primary care and specialty care physicians. Since the review was first undertaken, several other models of shared or collaborative care have been developed (Kings Fund 2015). Many of these involve collaboration or integrated care between different primary care professionals or collaboration between specialty nurses or pharmacists and primary care physicians or nurses. These models of care were not eligible for inclusion in this review, thus limiting its generalisability to all types of collaborative care.
Quality of the evidence
Most included studies were RCTs that showed variable risk of bias. Only five of the 39 included RCTs met all Cochrane Effective Practice and Organisation of Care (EPOC) quality criteria, and 17 other studies met all quality criteria except protection against contamination. Potential contamination of control patients in primary care was not generally considered by investigators conducting studies with individual participant randomisation, although participants receiving usual care could have had contact with intervention practitioners.
Nineteen of the included RCTs used a cluster design, which may be the most appropriate design for studies examining interventions that involve changes in provider behaviour and systems within primary care, although not all of these studies incorporated clustering effects in their power calculations and analyses. Few studies provided more than a minimal description of activities in the comparison group, making it difficult to assess results for control groups. The two controlled before‐after (CBA) studies met all EPOC quality criteria but reported only limited results, stating that a full paper with health outcomes would be published (Wood 1994). Unfortunately, we were unable to identify this follow‐up paper or to make contact with study authors.
Assessment of study quality raised several methodological issues, including those related to clustering effects, as mentioned above. Patient recruitment varied across studies, with some studies recruiting patients through specialty clinics and some recruiting patients through their primary care practitioner. The former approach automatically fails to detect patients not referred to specialists or patients who have already defaulted from specialist care. This raises questions about external validity, that is, it suggests that results may be applicable only to patients who regularly visit their specialist. External validity is also an issue in relation to the difference between creating practice disease registers to identify eligible patients rather than using existing, established registers; new registers are more likely to include patients currently or frequently attending the practice, for whatever reason.
Two studies (DICE 1994; Drummond 1994) regarded lack of difference between shared care patients and patients continuing to attend a specialist outpatient clinic as implying equivalence between the two systems, although they were not designed or powered as equivalence studies.
Few studies reported rates of participation in the intervention, making it difficult for review authors to estimate whether the interventions were actually implemented successfully in practice. No study specifically considered treatment fidelity, although this may reflect the fact that this is a relatively recent explicit improvement in analysis of complex interventions.
Potential biases in the review process
Few studies provided adequate information on participating primary care practitioners, making it difficult to determine whether services introduced could be generalisable to the full range of primary care practitioners in each region. In the only study of a simple shared care intervention, Warner 2000 indicated that most specialists in the catchment area were sceptical about shared care and did not participate.
We noted other quality‐related limitations regarding study reporting. For example, Johannson 2001 used the age of 70 years to subdivide participating patients and found benefits for older patients. It is not clear from the paper whether this subdivision was prespecified in the study protocol.
Most included studies lasted for one year, making it difficult to determine whether shared care services can be sustained over longer periods. We identified one follow‐up paper (Katon 2002) that confirmed sustained improvement over time, although extended follow‐up looked only at the 28‐month effect of the intervention. Another follow‐up study (Hunkeler 2006) looked at one‐year follow‐up after the 12‐month intervention had ceased for participants in the Unutzer 2002 study. Results showed sustained improvement in collaborative care for patients but did not indicate the proportion of participants receiving follow‐up. The included studies that have been published relatively recently may be planning to present follow‐up data in the future.
A further limitation of this review is that only one review author screened the first round of abstracts, although an approach was taken to include any study with potential relevance for double review author screening. An additional methodological issue involved results of the search strategy, as outlined in the protocol and the review. We specifically included a term for chronic disease but also included specific chronic diseases that had been identified in the Hickman 1994 study on shared care. Use of the chronic disease term combined with additional search strategy terms related to shared or collaborative care revealed studies that dealt with chronic conditions such as congestive cardiac failure and patients receiving chronic oral anticoagulation therapy for increased risk of thrombosis. Although we searched the grey literature for the original review, we did not do so for this review update.
Agreements and disagreements with other studies or reviews
Since this review was first published, other reviews of collaborative care have been undertaken, but primarily in relation to depression and other mental health illnesses. These reviews have applied broader inclusion criteria regarding the definition of shared care and have included other integrated care models such as multi‐disciplinary shared care within primary care settings. Our review findings are consistent with the findings of these other reviews in relation to depression. The Cochrane review of collaborative care for patients with depression and anxiety included 79 RCTs (with 90 relevant comparisons) involving 24,308 participants. That review defined collaborative care as fulfilling four key criteria: a multi‐professional approach to patient care; a structured management plan; scheduled patient follow‐up; and enhanced interprofessional communication. Review authors concluded that collaborative care is associated with greater improvement in depression and anxiety outcomes when compared with usual care, and that it represents a useful addition to clinical pathways for adults with depression and anxiety (Archer 2012).
A recent review of integrated models of primary care and mental health and substance use care in the community undertaken in Canada identified challenges around the definitions of shared and collaborative and integrated care and stated that although these terms tend to be used synonymously, they 'represent different approaches to multi‐provider, co‐ordinated service delivery' (Flexhaug 2012). This review did not aim to determine the effectiveness of shared care but rather to provide information for local policy makers who plan services. Review authors identified nine models of shared care ranging from fully integrated care across a health system to co‐location shared care models based in primary care with specialist input, or what they termed 'reverse shared care', which refers to care based in the specialist sector with primary care provider input. This would include more recent models of care for people with severe and enduring mental health conditions who have difficulty accessing primary health care but need to remain under the close supervision of specialist teams.
Although our review of shared care interventions included cost data and reported on outcomes of economic analyses when available, the current review was not designed primarily to undertake an evaluation of the cost‐effectiveness of shared care. This is currently being done by another group based in the UK, and the final report is awaited (Hardwick 2013). Those review authors have highlighted the challenges inherent to economic evaluations in incorporating 'contextual differences that impact on resource use and opportunity costs'. They will use realist review methods to overcome some of these issues.
Authors' conclusions
Implications for practice.
This review suggests that shared care is effective for depression but does not provide evidence to support the introduction of shared care for treatment of patients with other chronic conditions. Most included studies were of relatively short duration. This review suggests that shared care may have the potential to provide longer‐term benefit at an earlier stage in the disease process by ensuring improved and appropriate prescribing. We conclude that current evidence indicates that shared care is applicable in routine settings for depression, but that further research is needed before shared care can be routinely implemented for other conditions.
Implications for research.
Methodological issues
This review has highlighted several areas related to study design and quality, including clustering effects, patient identification and recruitment of patients with chronic diseases.
We have provided minimal description of care carried out in control groups, which is particularly important given the variation in care delivery seen in different healthcare systems. Researchers need to anticipate potential improvements in control group patients. Unless these are incorporated in power calculations, the potential effectiveness of an intervention may be missed. Shared care has been compared with both ongoing routine specialist care and ongoing structured or unstructured primary care, suggesting clinical heterogeneity between studies. Researchers need to consider whether a successful shared care service is equivalent to current service delivery, or whether it improves upon service delivery at an acceptable cost. Although many included studies did consider cost data, only a small minority carried out economic analyses. More sophisticated economic analyses are needed in this area, as major resources may be affected by changing care delivery in this way. It is important that investigators consider and present exact costs incorporated in the analyses, and that they provide the year of pricing, along with appropriate sensitivity analyses, to enable comparisons between studies.
Future studies should incorporate qualitative evaluations and should consider treatment fidelity for interventions involving behaviour change among patients or practitioners (Bellg 2004). These evaluations may provide a deeper understanding of the views and beliefs of participating patients and providers and can be used to prepare an in‐depth description of actual care delivered, both in the control group and in relation to adherence to protocols in the intervention group (Bradley 1999). Qualitative evaluations are a single component of process evaluations of RCTs, which, along with consideration of treatment fidelity, enhance understanding of what actually happened when the intervention was tested in a clinical setting. These evaluations are particularly important for trials with negative results, but they also enable replication of successful interventions in other settings.
Most of the studies included in this review involved complex, multi‐faceted interventions. The UK Medical Research Council has provided a framework for RCTs of complex multi‐faceted interventions that highlights the importance of identifying the components of complex interventions and considering which elements may be most effective (Craig 2008). In the future, researchers should consider reporting studies in a way that reflects these issues and includes outcome measurements for each potentially effective component of the overall intervention. This, in turn, would enable more comprehensive analysis and understanding when the results of such studies are combined for systematic reviews (Grimshaw 1995).
Few of the included studies lasted longer than 12 months, and only one follow‐up study has been reported to date. Lack of evidence of effectiveness of shared care may be due in part to inadequate length of follow‐up. Future studies should be longer in duration to address this issue and to evaluate the longer‐term sustainability of shared care. Investigators will need to consider issues such as drift away from shared care protocols and will need to devise strategies for longer‐term follow‐up of participating patients and longer‐term evaluation of services.
Designing shared care interventions
This review has highlighted issues for consideration by those interested in the development of shared care interventions. It is important to consider the purpose of such interventions, that is, to improve patient care, rather than to shift care between sectors in an effort to reduce costs. This review provides no evidence that shared care will reduce activity in either sector, or that it offers opportunities for cost containment. Most of the excluded studies examined interventions that did not involve genuine collaboration across the care divide. This highlights the importance of ensuring genuine involvement of all sectors. Such involvement must be supported through appropriate resourcing of providers in both sectors. Appropriate economic analyses should be performed to address these issues.
Most of the included studies lacked patient or client involvement. It would make sense to involve service users at the planning stage.
Included studies generally made limited use of information technology to increase the effectiveness of the organisation of shared care. This factor should be considered by those designing future shared care interventions. In addition, most studies specifically appointed a liaison worker at the interface, usually a clinical nurse specialist, or used study personnel to fulfil this role. This review does not provide conclusive evidence regarding the potential effectiveness of liaison workers, but use of study personnel to fulfil this role raises questions about the long‐term sustainability of shared care services once the evaluation phase has been completed.
What's new
| Date | Event | Description |
|---|---|---|
| 16 February 2016 | New citation required and conclusions have changed | The addition of 22 new studies provides greater certainty around some of the results and conclusions, which now suggest that shared care improves depression outcomes but has a less clear effect on other conditions. This review includes 42 studies. Since the review was last published, two new review authors joined the review author team. Updated methods include the addition of a 'Summary of findings' table. |
| 12 October 2015 | New search has been performed | We revised and updated searches and added 22 new studies to the review. |
History
Protocol first published: Issue 3, 2004 Review first published: Issue 3, 2007
| Date | Event | Description |
|---|---|---|
| 1 December 2014 | New search has been performed | We made minor edits. |
| 24 June 2008 | Amended | We converted the review to new review format. |
| 28 March 2007 | New citation required and conclusions have changed | We made substantive amendments. |
Acknowledgements
The Health Research Board of Ireland funded a Cochrane Fellowship for Susan Smith for the first draft of this review. The review authors would like to thank Hugh Brazier for his contribution to the search strategy for the first draft. We would like to acknowledge the administrative support that we received from Ailbhe Mealy and Trish Doherty. We would like to thank our previous contact editors Jeremy Grimshaw and Sasha Shepherd; our previous referee editor Martin Eccles; our current contact editor Janet Squire; our internal associate editor Signe Flottorp; our information specialist Paul Miller; our EPOC statistician Orlaith Burke; our external referee Eivind Aakhus; and our managing editor Julia Worswick, as well as other members of the EPOC Review Group for advice and support provided throughout the preparation of this review. We would also like to acknowledge the feedback we received from Netwon Opiyo in the Cochrane Editorial Unit.
We would like to acknowledge the National Institute for Health Research (NIHR) for Cochrane Infrastructure funding to the Effective Practice and Organisation of Care (EPOC) Group. The views and opinions expressed therein are those of the review authors and do not necessarily reflect those of the Systematic Reviews Programme, NIHR, the National Health Service (NHS) or the Department of Health.
Appendices
Appendix 1. Search strategies (12 October 2015)
MEDLINE (Ovid)
| 1 | (shared care or collaborat$ care).ti,ab. |
| 2 | (integrated care or coordinated care or co‐ordinated care).ti. |
| 3 | (specialist? and (primary adj2 (care or healthcare or health care))).ti. |
| 4 | (specialist? adj4 (community or family doctor? or generalist? or family physician? or general practitioner? or family practice)).ti. |
| 5 | or/1‐3 [Combine with filters] |
| 6 | (shared adj2 care).ti,ab. |
| 7 | (specialist? adj4 (community or family doctor? or generalist? or family physician? or general practitioner? or family practice)).ti,ab. |
| 8 | (specialist? adj4 (continuity adj2 care)).ti,ab. |
| 9 | ((family doctor? or family physician? or general practitioner? or general practice?) adj13 team?).ti,ab. |
| 10 | ((collaborat$ or cooperativ$ or co‐operativ$) adj3 (care or disease management or patient management or health care or healthcare or specialist?)).ti,ab. |
| 11 | (integrated adj4 (care or treatment or management)).ti. or (integrated adj2 (care or treatment or management)).ab. |
| 12 | (integrati$ adj2 (nurse or nurses or pharmacist? or primary care or general practitioner? or family doctor? or family physician? or assistant? or therapist? or allied)).ti,ab. |
| 13 | (integrative adj3 (care or management or practice or practices or treatment)).ti. |
| 14 | ((integrated or integrative) adj3 (care or management or treatment)).ti. |
| 15 | ((collaborativ$ or cooperativ$ or co‐operativ$) and (model? or practice?)).ti. or ((collaborative or cooperative or co‐operative) adj2 (model? or practice)).ab. |
| 16 | ((collaborat$ or cooperativ$ or co‐operativ$) adj12 (family practioner? or family physician? or family doctor? or general practitioner? or primary care physician? or primary care doctor? or primary care practitioner?)).ti,ab. |
| 17 | ((continuation adj3 treatment) or maintenance‐phase treatment?).ti,ab. |
| 18 | (intensif$ adj3 (primary adj2 (care or healthcare))).ti,ab. |
| 19 | (assertive adj2 treatment).ti,ab. |
| 20 | (((relapse adj2 prevent$) or reduce? specialist? or reducing specialist? or reduc$ readmission? or reduc$ re‐admission?) and (primary adj2 (care or health care or healthcare))).ti. |
| 21 | (((relapse adj2 prevent$) or reduce? specialist? or reducing specialist? or reduc$ readmission? or reduc$ re‐admission?) adj5 (primary adj2 (care or health care or healthcare))).ab. |
| 22 | ((interdisciplin$ or inter‐disciplin$) adj2 (assessment? or care or treatment or team? or primary care or specialist? or comorbid$ or chronic or plan)).ti,ab. |
| 23 | *practice guidelines as topic/ |
| 24 | ((coordinat$ or co‐ordinat$ or team) adj9 care).ti,ab. |
| 25 | (integrated and (care or healthcare or management or treatment)).ti. |
| 26 | (collaborat$ adj3 care).ti. or (collaborative adj2 (approach or approaches)).ti,ab. |
| 27 | (integrat$ adj4 (care or healthcare or treatment or management)).ti. |
| 28 | (integrat$ and (primary adj2 care)).ti. |
| 29 | *Health Services/ut [Utilization] |
| 30 | ((care or healthcare or healthcare or system) adj2 utili?ation).ti,hw. |
| 31 | (prevention program or management program).ti. |
| 32 | (multidisciplin$ or quality improvement).ti. or (multidisciplinary adj2 management).ab. |
| 33 | community oriented.ti,ab. |
| 34 | (*Quality Assurance, Health Care/ or quality improvement.ti,ab,hw. or quality of health care/) and treatment outcome/ |
| 35 | Cooperative Behavior/ |
| 36 | interdisciplinary communication/ or interprofessional relations/ |
| 37 | Patient Care Team/og or (Patient Care Team/ and "Organization and administration"/) |
| 38 | or/6‐37 [Shared Care & Proxy Terms] |
| 39 | Chronic Disease/ |
| 40 | (chronic adj3 (asthma or arthritis or cardiovascular$ or condition or depression or disease or diseases or fatigue or headache? or heart or hyperten$ or kidney or liver or lung or mental or pain or program? or pulmonary or schizophren$)).ti. |
| 41 | ((chronic adj illness$) or chronically ill).ti,ab. |
| 42 | comorbidity/ |
| 43 | diabetes.ti. |
| 44 | (Chronic adj2 (condition? or medical or disease?)).ab. |
| 45 | depression.ti. |
| 46 | *pulmonary disease, chronic obstructive/ or *bronchitis, chronic/ or *pulmonary emphysema/ |
| 47 | *renal insufficiency, chronic/ or *kidney failure, chronic/ |
| 48 | *Chronic Pain/ |
| 49 | *Pancreatitis, Chronic/ |
| 50 | *Fatigue Syndrome, Chronic/ |
| 51 | *Brain Damage, Chronic/ |
| 52 | *heart failure/ and chronic.ti,ab. |
| 53 | or/39‐52 [Chronic Disease] |
| 54 | (38 and 53) not 5 [Chronic Disease & Shared Care Terms] |
| 55 | (randomized controlled trial or controlled clinical trial).pt. or randomized.ab. or placebo.ab. or clinical trials as topic.sh. or randomly.ab. or trial.ti. |
| 56 | exp animals/ not humans.sh. |
| 57 | 55 not 56 [Cochrane RCT Filter 6.4.d Sens/Precision Maximizing] |
| 58 | (5 or (and/38,53)) and 57 [RCT Results] |
| 59 | remove duplicates from 58 |
| 60 | Primary Health Care/ or General Practice/ or Family practice/ or General Practice, Dental/ or Primary Care Nursing/ |
| 61 | ((primary adj4 (care or healthcare)) or ((General or family) adj2 practice)).ti,ab. |
| 62 | (primary care or family medic$ or general practice or family practi$).jn. |
| 63 | Community medicine/ or community health nursing/ or community health services/ or community health centers/ or home care services/ |
| 64 | (community adj2 (care or healthcare or health care or clinic?)).ti,ab. |
| 65 | Ambulatory Care Facilities/ |
| 66 | ((ambulatory or walk‐in or neighbo?rhood or community) adj2 (clinic? or care centre or care centres or care center? or health$ centre or health$ centres or health$ center?)).ti,ab. |
| 67 | or/60‐66 [Primary/Community Care‐‐use to focus results when combining with EPOC Filter for non‐RCT designs] |
| 68 | intervention?.ti. or (intervention? adj6 (clinician? or collaborat$ or community or complex or DESIGN$ or doctor? or educational or family doctor? or family physician? or family practitioner? or financial or GP or general practice? or hospital? or impact? or improv$ or individuali?e? or individuali?ing or interdisciplin$ or multicomponent or multi‐component or multidisciplin$ or multi‐disciplin$ or multifacet$ or multi‐facet$ or multimodal$ or multi‐modal$ or personali?e? or personali?ing or pharmacies or pharmacist? or pharmacy or physician? or practitioner? or prescrib$ or prescription? or primary care or professional$ or provider? or regulatory or regulatory or tailor$ or target$ or team$ or usual care)).ab. |
| 69 | (pre‐intervention? or preintervention? or "pre intervention?" or post‐intervention? or postintervention? or "post intervention?").ti,ab. [added 2.4] |
| 70 | patient?.hw. and (study or studies or care or health$ or practitioner? or provider? or physician? or nurse? or nursing or doctor?).ti,hw. [REMOVED HOSPITAL from HW search] |
| 71 | demonstration project?.ti,ab. |
| 72 | (pre‐post or "pre test$" or pretest$ or posttest$ or "post test$" or (pre adj5 post)).ti,ab. |
| 73 | (pre‐workshop or post‐workshop or (before adj3 workshop) or (after adj3 workshop)).ti,ab. |
| 74 | trial.ti. or ((study adj3 aim?) or "our study").ab. |
| 75 | (before adj10 (after or during)).ti,ab. |
| 76 | ("quasi‐experiment$" or quasiexperiment$ or "quasi random$" or quasirandom$ or "quasi control$" or quasicontrol$ or ((quasi$ or experimental) adj3 (method$ or study or trial or design$))).ti,ab,hw. |
| 77 | ("time series" adj2 interrupt$).ti,ab,hw. |
| 78 | (time points adj3 (over or multiple or three or four or five or six or seven or eight or nine or ten or eleven or twelve or month$ or hour? or day? or "more than")).ab. |
| 79 | pilot.ti. |
| 80 | Pilot projects/ |
| 81 | (clinical trial or controlled clinical trial or multicenter study).pt. |
| 82 | (multicentre or multicenter or multi‐centre or multi‐center).ti. |
| 83 | random$.ti,ab. or controlled.ti. |
| 84 | (control adj3 (area or cohort? or compare? or condition or design or group? or intervention? or participant? or study)).ab. not (controlled clinical trial or randomized controlled trial).pt. |
| 85 | (control year? or experimental year? or (control period? or experimental period?)).ti,ab. [Added May 30‐2013] |
| 86 | evaluation studies as topic/ or prospective studies/ or retrospective studies/ [Added Jan 2013] |
| 87 | (utili?ation or programme or programmes).ti. [Added Jan 2013] |
| 88 | (during adj5 period).ti,ab. [Added Jan 2013] |
| 89 | ((strategy or strategies) adj2 (improv$ or education$)).ti,ab. [Added Jan 2013] |
| 90 | (purpose adj3 study).ab. |
| 91 | "comment on".cm. or review.pt. or (review not "peer review$").ti. or randomized controlled trial.pt. [Changed Jan 2013] |
| 92 | (rat or rats or cow or cows or chicken? or horse or horses or mice or mouse or bovine or animal?).ti,hw. or veterinar$.ti,ab,hw. [Edited May 2013] |
| 93 | exp animals/ not humans.sh. |
| 94 | (or/68‐90) not (or/91‐93) [EPOC Methods Filter 2.6‐added Evaluation Studies line forward‐‐Jan 20130 Medline] |
| 95 | (and/5,94) not 58 [EPOC Results Set 1] |
| 96 | (and/38,53,67,94) not (or/58,95) [EPOC Results Set 2‐‐Shared care & chronic terms & Primary Care] |
| 97 | 59 or 95 or 96 |
Embase (Ovid)
| 1 | (shared care or collaborat$ care).ti,ab. |
| 2 | (integrated care or coordinated care or co‐ordinated care).ti. |
| 3 | (specialist? and (primary adj2 (care or healthcare or health care))).ti. |
| 4 | (specialist? adj4 (community or family doctor? or generalist? or family physician? or general practitioner? or family practice)).ti. |
| 5 | or/1‐3 |
| 6 | (shared adj2 care).ti,ab. |
| 7 | (specialist? adj4 (community or family doctor? or generalist? or family physician? or general practitioner? or family practice)).ti,ab. |
| 8 | (specialist? adj4 (continuity adj2 care)).ti,ab. |
| 9 | ((family doctor? or family physician? or general practitioner? or general practice?) adj13 team?).ti,ab. |
| 10 | ((collaborat$ or cooperativ$ or co‐operativ$) adj3 (care or disease management or patient management or health care or healthcare or specialist?)).ti,ab. |
| 11 | (integrated adj4 (care or treatment or management)).ti. or (integrated adj2 (care or treatment or management)).ab. |
| 12 | (integrati$ adj2 (nurse or nurses or pharmacist? or primary care or general practitioner? or family doctor? or family physician? or assistant? or therapist? or allied)).ti,ab. |
| 13 | (integrative adj3 (care or management or practice or practices or treatment)).ti. |
| 14 | ((integrated or integrative) adj3 (care or management or treatment)).ti. |
| 15 | ((collaborativ$ or cooperativ$ or co‐operativ$) and (model? or practice?)).ti. or ((collaborative or cooperative or co‐operative) adj2 (model? or practice)).ab. |
| 16 | ((collaborat$ or cooperativ$ or co‐operativ$) adj12 (family practioner? or family physician? or family doctor? or general practitioner? or primary care physician? or primary care doctor? or primary care practitioner?)).ti,ab. |
| 17 | ((continuation adj3 treatment) or maintenance‐phase treatment?).ti,ab. |
| 18 | (intensif$ adj3 (primary adj2 (care or healthcare))).ti,ab. |
| 19 | (assertive adj2 treatment).ti,ab. |
| 20 | (((relapse adj2 prevent$) or reduce? specialist? or reducing specialist? or reduc$ readmission? or reduc$ re‐admission?) and (primary adj2 (care or health care or healthcare))).ti. |
| 21 | (((relapse adj2 prevent$) or reduce? specialist? or reducing specialist? or reduc$ readmission? or reduc$ re‐admission?) adj5 (primary adj2 (care or health care or healthcare))).ab. |
| 22 | ((interdisciplin$ or inter‐disciplin$) adj2 (assessment? or care or treatment or team? or primary care or specialist? or comorbid$ or chronic or plan)).ti,ab. |
| 23 | ((coordinat$ or co‐ordinat$ or team) adj9 care).ti,ab. |
| 24 | (integrated and (care or healthcare or management or treatment)).ti. |
| 25 | (collaborat$ adj3 care).ti. or (collaborative adj2 (approach or approaches)).ti,ab. |
| 26 | (integrat$ adj4 (care or healthcare or treatment or management)).ti. |
| 27 | (integrat$ and (primary adj2 care)).ti. |
| 28 | ((care or healthcare or healthcare or system) adj2 utili?ation).ti,hw. |
| 29 | (prevention program or management program).ti. |
| 30 | (multidisciplin$ or quality improvement).ti. or (multidisciplinary adj2 management).ab. |
| 31 | community oriented.ti,ab. |
| 32 | (*quality control/ or *medical audit/ or *total quality management/) and *treatment outcome/ |
| 33 | *cooperation/ |
| 34 | *interdisciplinary communication/ |
| 35 | *teamwork/ |
| 36 | *patient care/ and *"organization and management"/ |
| 37 | or/6‐36 |
| 38 | (chronic adj3 (asthma or arthritis or cardiovascular$ or condition or depression or disease or diseases or fatigue or headache? or heart or hyperten$ or kidney or liver or lung or mental or pain or program? or pulmonary or schizophren$)).ti. |
| 39 | ((chronic adj illness$) or chronically ill).ti,ab. |
| 40 | diabetes.ti. |
| 41 | (Chronic adj2 (condition? or medical or disease?)).ab. |
| 42 | depression.ti. |
| 43 | *chronic disease/ |
| 44 | *chronic pain/ |
| 45 | chronic patient/ |
| 46 | *chronic fatigue syndrome/ |
| 47 | (*heart failure/ or *heart disease/) and chronic.ti,ab. |
| 48 | *cardiovascular disease/ and chronic.ti. |
| 49 | *chronic obstructive lung disease/ |
| 50 | *chronic liver failure/ or *chronic lung disease/ or *chronic arthritis/ or *chronic cluster headache/ or *chronic daily headache/ or *chronic liver disease/ or *chronic gastritis/ or *chronic respiratory failure/ or *chronic brain disease/ or *chronic sinusitis/ or *chronic kidney failure/ or *chronic pancreatitis/ or *chronic kidney disease/ or *chronic respiratory tract disease/ or *chronic rhinosinusitis/ or *chronic bronchitis/ |
| 51 | *major depression/ |
| 52 | depressed.ti. |
| 53 | or/38‐52 |
| 54 | 5 |
| 55 | (and/37,53) not 5 |
| 56 | randomized controlled trial/ |
| 57 | "major clinical study"/ |
| 58 | randomi?ed.ti,ab. |
| 59 | controlled study/ |
| 60 | (controlled adj3 study).ti. |
| 61 | (exp animals/ or exp invertebrate/ or animal experiment/ or animal model/ or animal tissue/ or animal cell/ or nonhuman/) not ((exp animals/ or exp invertebrate/ or animal experiment/ or animal model/ or animal tissue/ or animal cell/ or nonhuman/) and (human/ or normal human/ or human cell/)) |
| 62 | (conference or conference proceeding or conference proceeding article or conference proceeding conference paper or conference proceeding editorial or conference proceeding note or "conference proceeding review" or journal conference abstract or journal conference paper).pt. |
| 63 | (multicentre or multicenter or multi‐centre or multi‐center).ti. |
| 64 | (or/56‐60,63) not 61 |
| 65 | 54 and 64 |
| 66 | 65 and 62 |
| 67 | 65 not 66 |
| 68 | *primary medical care/ |
| 69 | *general practitioner/ |
| 70 | *general practice/ |
| 71 | ((primary adj4 (care or healthcare)) or ((General or family) adj2 practice)).ti,ab. |
| 72 | ((ambulatory or walk‐in or neighbo?rhood or community) adj2 (clinic? or care centre or care centres or care center? or health$ centre or health$ centres or health$ center?)).ti,ab. |
| 73 | (community adj2 (care or healthcare or health care or setting?)).ti,ab. |
| 74 | *community care/ or exp *community health nursing/ or *community program/ |
| 75 | (primary care or family medic$ or general practice or family practi$).jn. |
| 76 | or/68‐75 |
| 77 | (and/55,64,76) not 65 |
| 78 | 77 and 62 |
| 79 | 77 not 78 |
| 80 | (and/54,64) not 62 |
| 81 | (and/54,64) not 80 |
| 82 | (and/55,64,76) not (or/62,80‐81) |
| 83 | (and/55,64,76) not 82 |
| 84 | or/81,83 |
| 85 | 80 or 82 or 84 |
Cochrane (Wiley)
| #1 | (shared care or collaborat* care):ti,ab |
| #2 | (integrated care or coordinated care or co‐ordinated care):ti |
| #3 | (specialist? and (primary near/2 (care or healthcare or health care))):ti |
| #4 | (specialist? near/4 (community or family doctor? or generalist? or family physician? or general practitioner? or family practice)):ti |
| #5 | {or #1‐#3} |
| #6 | (shared near/2 care):ti,ab |
| #7 | (specialist? near/4 (community or family doctor? or generalist? or family physician? or general practitioner? or family practice)):ti,ab |
| #8 | (specialist? near/4 continuity near/2 care):ti,ab |
| #9 | ((family doctor? or family physician? or general practitioner? or general practice?) near/13 team?):ti,ab |
| #10 | ((collaborat* or cooperativ* or co‐operativ*) near/3 (care or disease management or patient management or health care or healthcare or specialist?)):ti,ab |
| #11 | (integrated near/4 (care or treatment or management)):ti or (integrated near/2 (care or treatment or management)):ab |
| #12 | (integrati* near/2 (nurse or nurses or pharmacist? or primary care or general practitioner? or family doctor? or family physician? or assistant? or therapist? or allied)):ti,ab |
| #13 | (integrative near/3 (care or management or practice or practices or treatment)):ti |
| #14 | ((integrated or integrative) near/3 (care or management or treatment)):ti |
| #15 | ((collaborativ* or cooperativ* or co‐operativ*) and (model? or practice?)):ti or ((collaborative or cooperative or co‐operative) near/2 (model? or practice)):ab |
| #16 | ((collaborat* or cooperativ* or co‐operativ*) near/12 (family practioner? or family physician? or family doctor? or general practitioner? or primary care physician? or primary care doctor? or primary care practitioner?)):ti,ab |
| #17 | ((continuation near/3 treatment) or maintenance‐phase treatment?):ti,ab |
| #18 | (intensif* near/3 (primary near/2 (care or healthcare))):ti,ab |
| #19 | (assertive near/2 treatment):ti,ab |
| #20 | (((relapse near/2 prevent*) or reduce? specialist? or reducing specialist? or reduc* readmission? or reduc* re‐admission?) and (primary near/2 (care or health care or healthcare))):ti |
| #21 | (((relapse near/2 prevent*) or reduce? specialist? or reducing specialist? or reduc* readmission? or reduc* re‐admission?) near/5 (primary near/2 (care or health care or healthcare))):ab |
| #22 | ((interdisciplin* or inter‐disciplin*) near/2 (assessment? or care or treatment or team? or primary care or specialist? or comorbid* or chronic or plan)):ti,ab |
| #23 | [mh "practice guidelines as topic"] |
| #24 | ((coordinat* or co‐ordinat* or team) near/9 care):ti,ab |
| #25 | (integrated and (care or healthcare or management or treatment)):ti |
| #26 | (collaborat* near/3 care):ti or (collaborative near/2 (approach or approaches)):ti,ab |
| #27 | (integrat* near/4 (care or healthcare or treatment or management)):ti |
| #28 | (integrat* and (primary near/2 care)):ti |
| #29 | [mh ^"health services"/UT] |
| #30 | ((care or healthcare or healthcare or system) near/2 utili?ation):ti,kw |
| #31 | (prevention program or management program):ti |
| #32 | (multidisciplin* or quality improvement):ti or (multidisciplinary near/2 management):ab |
| #33 | community oriented:ti,ab |
| #34 | ([mh ^"Quality Assurance, Health Care"] or [mh ^"quality of health care"] or quality next improvement:ti,ab,kw) and [mh ^"treatment outcome"] |
| #35 | [mh ^"Cooperative Behavior"] |
| #36 | [mh ^"interdisciplinary communication"] or [mh ^"interprofessional relations"] |
| #37 | [mh ^"Patient Care Team"/OG] or ([mh ^"Patient Care Team"] and [mh ^"Organization and administration"]) |
| #38 | {or #6‐#37} |
| #39 | [mh ^"chronic disease"] |
| #40 | (chronic near/3 (asthma or arthritis or cardiovascular* or condition or depression or disease or diseases or fatigue or headache? or heart or hyperten* or kidney or liver or lung or mental or pain or program? or pulmonary or schizophren*)):ti |
| #41 | ((chronic near/1 illness*) or chronically ill):ti,ab |
| #42 | [mh ^comorbidity] |
| #43 | diabetes:ti |
| #44 | (chronic near/2 (condition? or medical or disease?)):ab |
| #45 | depression:ti |
| #46 | [mh ^"pulmonary disease, chronic obstructive"] or [mh ^"bronchitis, chronic"] or [mh ^"pulmonary emphysema"] |
| #47 | [mh ^"renal insufficiency, chronic"] or [mh ^"kidney failure, chronic"] |
| #48 | [mh ^"Chronic Pain"] |
| #49 | [mh ^"Pancreatitis, Chronic"] |
| #50 | [mh ^"Fatigue Syndrome, Chronic"] |
| #51 | [mh ^"Brain Damage, Chronic"] |
| #52 | [mh ^"heart failure"] and chronic:ti,ab |
| #53 | {or #39‐#52} |
| #54 | (#38 and #53) not #5 |
| #55 | #5 or #54 |
Data and analyses
Comparison 1. Clinical outcomes.
| Outcome or subgroup title | No. of studies | No. of participants | Statistical method | Effect size |
|---|---|---|---|---|
| 1 Health outcomes ‐ diabetes: HbA1c | 5 | Mean Difference (IV, Random, 95% CI) | Totals not selected | |
| 2 Health outcomes ‐ systolic blood pressure | 7 | 3024 | Mean Difference (IV, Random, 95% CI) | 3.47 [1.68, 5.25] |
| 2.1 Diabetes studies | 4 | 2184 | Mean Difference (IV, Random, 95% CI) | 2.09 [0.20, 3.97] |
| 2.2 Other studies | 3 | 840 | Mean Difference (IV, Random, 95% CI) | 5.35 [2.42, 8.29] |
Comparison 2. Mental health outcomes.
| Outcome or subgroup title | No. of studies | No. of participants | Statistical method | Effect size |
|---|---|---|---|---|
| 1 Mean depression scores | 6 | 3250 | Std. Mean Difference (IV, Random, 95% CI) | ‐0.29 [‐0.37, ‐0.20] |
| 2 Depression ‐ % with response to treatment | 6 | 1708 | Risk Ratio (M‐H, Random, 95% CI) | 1.40 [1.22, 1.62] |
| 3 Depression remission/recovery | 10 | Risk Ratio (M‐H, Random, 95% CI) | Totals not selected |
2.2. Analysis.
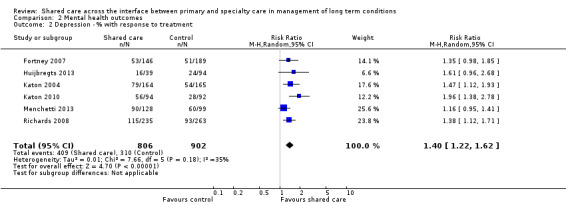
Comparison 2 Mental health outcomes, Outcome 2 Depression ‐ % with response to treatment.
2.3. Analysis.
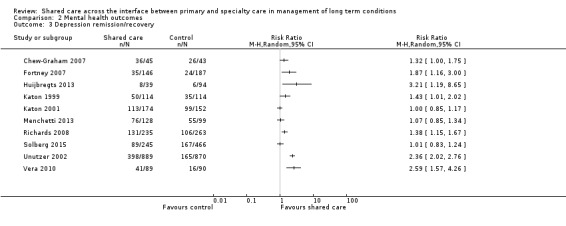
Comparison 2 Mental health outcomes, Outcome 3 Depression remission/recovery.
Comparison 3. Health‐related quality of life scores.
| Outcome or subgroup title | No. of studies | No. of participants | Statistical method | Effect size |
|---|---|---|---|---|
| 1 HRQoL mean scores | 6 | Std. Mean Difference (IV, Random, 95% CI) | Totals not selected |
3.1. Analysis.
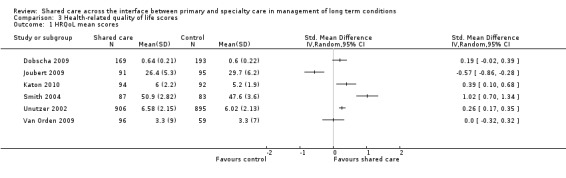
Comparison 3 Health‐related quality of life scores, Outcome 1 HRQoL mean scores.
Comparison 4. Treatment satisfaction.
| Outcome or subgroup title | No. of studies | No. of participants | Statistical method | Effect size |
|---|---|---|---|---|
| 1 Treatment satisfaction | 6 | Std. Mean Difference (IV, Random, 95% CI) | Totals not selected |
Comparison 5. Process outcomes: medication prescribing.
| Outcome or subgroup title | No. of studies | No. of participants | Statistical method | Effect size |
|---|---|---|---|---|
| 1 Process outcomes ‐ % appropriate medication | 5 | 1054 | Risk Ratio (M‐H, Random, 95% CI) | 1.25 [1.07, 1.46] |
Characteristics of studies
Characteristics of included studies [ordered by study ID]
Byng 2004.
| Methods | Cluster‐randomised controlled trial UK |
|
| Participants | 335 patients with long‐term mental illness; 1 regional specialist service; 24 general practices (96 GPs) | |
| Interventions | Mental Health Link intervention comprising local needs assessment; development shared care agreement and referral protocols; shared care toolkit (databases, register, recall and audit systems); aligned caseload link worker; multi‐disciplinary clinical review meetings Comparison: usual care |
|
| Outcomes |
Health outcomes
Primary outcomes Participant satisfaction and perception of met and unmet need Secondary outcomes General and mental health status Process outcomes Mental and physical care |
|
| Notes | Study duration 18‐24 months | |
| Risk of bias | ||
| Bias | Authors' judgement | Support for judgement |
| Random sequence generation (selection bias) | Low risk | 'Minimisation' carried out independently by statistician |
| Allocation concealment (selection bias) | Low risk | Adequate allocation concealment |
| Baseline characteristics | Low risk | Reported and similar |
| Blinding of participants and personnel (performance bias) All outcomes | Low risk | Not possible owing to cluster design but bias unlikely due to cluster design |
| Blinding of outcome assessment (detection bias) All outcomes | Low risk | Done for primary outcomes |
| Incomplete outcome data (attrition bias) All outcomes | Unclear risk | Follow‐up adequate for chart audits (> 90%) but not for patient questionnaires (65%‐70%) |
| Selective reporting (reporting bias) | Low risk | All outcomes in methods reported |
| Protection against contamination | Low risk | Cluster‐randomisation |
| Other bias | Low risk | |
Callahan 2006.
| Methods | Cluster‐randomised controlled trial USA |
|
| Participants | 153 older adults with Alzheimer's disease and their caregivers; 74 physicians | |
| Interventions | Collaborative care management was provided for a maximum of 12 months by a team led by a primary care physician and a geriatric nurse practitioner (care manager). Participants and caregivers received education on communication skills; caregiver coping skills; patient exercise guidelines with guidebook and video; caregiver guide provided by the local chapter of the Alzheimer's Association. Caregivers and participants were seen by a care manager bimonthly initially, then monthly for up to 1 year. Individualised management plans were based on caregivers' Memory and Behavior Problems Checklist. Protocols focused first on non‐pharmacological interventions; if these failed, the care manager collaborated with the primary care physician to institute drug therapy for depression, agitation, sleep disturbance or delusions. Cholinesterase inhibitors were given when indicated. Primary care physician and care manager support: (1) weekly meetings with support team comprising a geriatrician, a geriatric psychiatrist and a psychologist, who reviewed care of new and active patients; (2) Web‐based longitudinal tracking system that managed the schedule for patient contacts and tracked patient progress and current treatments Comparison: augmented usual care; written material and face‐to‐face counselling provided by geriatric nurse practitioner in primary care clinic (40‐90 minutes). Provided with written materials describing local community resources |
|
| Outcomes |
Health outcomes Primary outcomes Neuropsychiatric Inventory (NPI), activities of daily living, healthcare resource use Secondary outcomes Cornell Scale for Depression in Dementia (caregiver provided data for participant), caregiver portion of NPI, caregiver responses to Patient Health Questionnaire‐9 (assessment of caregiver's mood) Participants completed telephone interview for cognitive status (telephone version of the mini‐mental state examination (MMSE)). Process outcomes Frequency of initiation for any of the 8 protocols for caregiver education and non‐pharmacological management of behavioral symptoms (but process information available only for intervention group) |
|
| Notes | Study duration 12 months | |
| Risk of bias | ||
| Bias | Authors' judgement | Support for judgement |
| Random sequence generation (selection bias) | Low risk | Random number table used |
| Allocation concealment (selection bias) | Low risk | Done |
| Baseline characteristics | Low risk | Reported and similar |
| Blinding of participants and personnel (performance bias) All outcomes | High risk | Not possible owing to cluster design but bias possible, as unit of randomisation was physician ‐ not practice |
| Blinding of outcome assessment (detection bias) All outcomes | Low risk | Outcomes assessed by telephone interviewers who were blinded to participants' randomisation status |
| Incomplete outcome data (attrition bias) All outcomes | Low risk | Attrition due to death (7 augmented usual care vs 5 intervention), nursing home placement (5 vs 7) or dropping out of study or inability to contact (8 vs 4 participants) was not significantly different across 2 groups. |
| Selective reporting (reporting bias) | Low risk | All outcomes reported |
| Protection against contamination | Unclear risk | Contamination possible despite cluster design, as unit allocation was physician ‐ not practice. Also, usual care augmented by 40‐ to 90‐minute session with geriatric nurse specialist |
| Other bias | Low risk | |
Chew‐Graham 2007.
| Methods | Randomised controlled trial USA |
|
| Participants | 105 people 60 years of age or older who scored 5 or higher on the Geriatric Depression Scale | |
| Interventions | Care managed by a community psychiatric nurse involved a facilitated self‐help programme with close liaison with primary care professionals and old age psychiatrist Comparison: usual care |
|
| Outcomes |
Health outcomes Depression (% with ≥ 5 symptoms on the SCID (structured clinical interview for DSM‐5) Secondary outcomes Depression symptoms: HSCL‐20 (Hopkins symptom checklist) Pain and disability: HAQ (health assessment questionnaire) Burnville physical illness scale (acute and chronic ill health) |
|
| Notes | Study duration 16‐week follow‐up | |
| Risk of bias | ||
| Bias | Authors' judgement | Support for judgement |
| Random sequence generation (selection bias) | Low risk | Randomisation using a computer programme for stochastic minimisation with control for factors such as age ≥ 80, sex and SCID depression score (≥ 5) |
| Allocation concealment (selection bias) | Low risk | Done independently by trial secretary |
| Baseline characteristics | Low risk | |
| Blinding of participants and personnel (performance bias) All outcomes | High risk | Not possible, as intervention nurse aware of randomisation status and individual participant randomisation design |
| Blinding of outcome assessment (detection bias) All outcomes | Low risk | Research associate blind to randomisation |
| Incomplete outcome data (attrition bias) All outcomes | Low risk | Attrition due to death (3 intervention, 4 control), secondary care (1 intervention) or dropping out of study (4 intervention, 5 control) was not different across 2 groups. |
| Selective reporting (reporting bias) | Unclear risk | Selective outcome reporting, as Burville physical illness scale identified as secondary outcome, but no data reported in paper |
| Protection against contamination | Unclear risk | Protection against contamination unclear |
| Other bias | Low risk | |
Conradi 2007.
| Methods | Randomised controlled trial Netherlands |
|
| Participants | 267 adults receiving GP treatment for a depressive episode | |
| Interventions | Three intervention groups: 1. Usual care provided by GP enhanced by a psychoeducational prevention programme (PEP) 2. Psychiatric consultation followed by PEP (psychiatrist‐enhanced PEP) 3. Brief CBT followed by PEP (CBT enhanced PEP) Comparison: usual care |
|
| Outcomes |
Health outcomes Depression Time from remission of the index episode to recurrence (CIDI); severity of depression during follow‐up (BDI); proportion of depressive free time ‐ time during follow‐up that participant did not meet DSM‐IV criteria for major depression (CIDI); proportion of depressive symptom‐free time; percentage of participants with ≥ 1 relapse/recurrence during follow‐up (CIDI) |
|
| Notes | Study duration: Most participants were followed up for 3 years, a minority for 24 to 33 months. | |
| Risk of bias | ||
| Bias | Authors' judgement | Support for judgement |
| Random sequence generation (selection bias) | Low risk | Randomly allocated to 1 of 4 conditions by a computer‐generated random allocation list |
| Allocation concealment (selection bias) | Low risk | Done independently |
| Baseline characteristics | Low risk | Reported and similar |
| Blinding of participants and personnel (performance bias) All outcomes | Unclear risk | Not reported |
| Blinding of outcome assessment (detection bias) All outcomes | Unclear risk | Not reported |
| Incomplete outcome data (attrition bias) All outcomes | Low risk | Levels of attrition similar across study arms |
| Selective reporting (reporting bias) | Low risk | All outcomes reported |
| Protection against contamination | Unclear risk | Possible but unclear |
| Other bias | Low risk | |
Dendale 2012.
| Methods | Randomised controlled trial Belgium |
|
| Participants | 160 patients with CHF | |
| Interventions | Intensive follow‐up of participants through a telemonitoring‐facilitated collaboration between GP and heart failure clinic. Daily measurement of blood pressure, heart rate and body weight; email alerts to GP and HF clinic to intervene when predefined limits of indicators above exceeded Website available for GPs to communicate with specialist Specialist clinic reviews at 3 and 6 months Comparison: usual care ‐ participant followed up by GP, who could refer to cardiologist if needed |
|
| Outcomes |
Health outcomes Primary outcome All‐cause mortality Secondary outcomes Days lost to death Days lost to hospitalisation Days lost to dialysis Number of hospitalisations |
|
| Notes | Study duration 6‐month (180‐day) follow‐up | |
| Risk of bias | ||
| Bias | Authors' judgement | Support for judgement |
| Random sequence generation (selection bias) | Unclear risk | Not specified |
| Allocation concealment (selection bias) | Low risk | Block randomisation via sealed envelopes |
| Baseline characteristics | Low risk | Reported and similar |
| Blinding of participants and personnel (performance bias) All outcomes | High risk | Reported as unblinded for personnel; participants could not be blinded |
| Blinding of outcome assessment (detection bias) All outcomes | Low risk | Data collected by data manager not involved in participant care, and not stationed at a participating hospital |
| Incomplete outcome data (attrition bias) All outcomes | Low risk | Four participants quit the study early for motivational reasons. |
| Selective reporting (reporting bias) | Low risk | All outcomes reported |
| Protection against contamination | Unclear risk | Protection against contamination unclear |
| Other bias | Low risk | |
Dey 2002.
| Methods | Cluster‐randomised controlled trial UK |
|
| Participants | 167 Community Drug Team (CDT) patients with a history of regular opiate misuse; median age 29, 25% female; GPs belonging to 50 local primary healthcare trusts; Stockport CDT | |
| Interventions | Primary healthcare liaison worker (PHCLW) carried out practice‐based reviews and participant assessments, practice‐based chart reviews and early intervention for chaotic users; support and training for GPs; practice‐wide shared care agreement; and ongoing support and care delivered by CDT. Comparison: CDT case worker wrote to GPs to offer shared care, but services of the PHCLW were not available to control practices. One education session was offered to GPs during the study period. |
|
| Outcomes | Process outcomes Participation in shared care (defined by number and nature of visits to CDT, communication between sectors, care plans, division of responsibilities and written evidence of a shared care agreement) | |
| Notes | Study duration 1 year Participants described as dynamic cohort (58 cases closed during study; 46 new patients entered service with unknown outcomes in all cases) Unit of analysis error: cluster‐randomisation but analysis at individual participant level | |
| Risk of bias | ||
| Bias | Authors' judgement | Support for judgement |
| Random sequence generation (selection bias) | Unclear risk | Methods not reported |
| Allocation concealment (selection bias) | Low risk | Allocation by primary care trust |
| Baseline characteristics | Low risk | Reported |
| Blinding of participants and personnel (performance bias) All outcomes | Unclear risk | Not reported but low risk due to cluster design |
| Blinding of outcome assessment (detection bias) All outcomes | Unclear risk | Not reported |
| Incomplete outcome data (attrition bias) All outcomes | Unclear risk | Reported 100% follow‐up, but 58 cases closed and no follow‐up data provided for these |
| Selective reporting (reporting bias) | Low risk | All outcomes in methods reported |
| Protection against contamination | Low risk | Allocation by cluster |
| Other bias | Low risk | |
DICE 1994.
| Methods | Randomised controlled trial UK |
|
| Participants | 274 adult patients with diabetes mellitus attending a specialist clinic and 1 of 3 general practices; mean age 58 years; 44% female; mean duration of diabetes 9 years; 32% with insulin‐dependent diabetes; 1 specialist clinic; 3 general practices (2 ran diabetes mini‐clinics, and the third spread consultations throughout routine surgeries) | |
| Interventions | GPs provided with practice guidelines and protocols for care; 3‐4 monthly GP visits; annual specialist review; computer‐generated appointments and reminders for clinics, GPs and participants; computerised system to synchronise records between hospital and GPs Comparison: conventional specialist care, 4‐monthly reviews, no protocols or guidelines provided |
|
| Outcomes |
Health outcomes
Metabolic control (HBA1c, blood pressure, body mass index, creatinine); depression; diabetes knowledge scores; beliefs about control of diabetes; diabetes clinic satisfaction scores; disruption of normal activities Process outcomes Numbers of consultations and admissions; frequency of metabolic monitoring Costs Direct costs to patients and healthcare system (NHS) |
|
| Notes | Study duration 2 years No account taken of clustering effect in power calculation or analysis | |
| Risk of bias | ||
| Bias | Authors' judgement | Support for judgement |
| Random sequence generation (selection bias) | Unclear risk | Method not reported |
| Allocation concealment (selection bias) | Unclear risk | Reported as 'pragmatic' |
| Baseline characteristics | Low risk | Reported and similar |
| Blinding of participants and personnel (performance bias) All outcomes | Unclear risk | Not possible owing to nature of the intervention |
| Blinding of outcome assessment (detection bias) All outcomes | Low risk | Assessors blinded |
| Incomplete outcome data (attrition bias) All outcomes | Low risk | 86% follow‐up |
| Selective reporting (reporting bias) | Low risk | Outcomes in methods reported |
| Protection against contamination | Unclear risk | Protection against contamination unclear and possible owing to nature of the intervention |
| Other bias | Low risk | |
Dobscha 2009.
| Methods | Cluster‐randomised controlled trial USA |
|
| Participants | 401 patients with musculoskeletal pain diagnosis, pain of at least 12 weeks' duration, moderate to severe pain (CPG, RMDQ) | |
| Interventions | Assistance with pain treatment included a 2‐session clinician education programme, participant assessment, education and activation, symptom monitoring, feedback and recommendations to clinicians and facilitation of specialty care. Care co‐ordinated by clinical psychologist Comparison: usual care and access to specialty pain clinic |
|
| Outcomes |
Health outcomes Pain Self‐reported pain‐related disability over 12 months (RMDQ) Pain intensity (CPG pain intensity subscale) Pain interference subscale of CPG Proportion of participants with 30% reduction in RMDQ scores over 12 months Depression Depression severity (PHQ‐9) Satisfaction Global VA healthcare satisfaction QOL Health‐related quality of life (EQ5D) Healthcare utilisation Appointment attendance over 12‐month period Medication prescriptions for 12‐month period (opioid; antidepressant; NSAID) |
|
| Notes | Study duration 12 months | |
| Risk of bias | ||
| Bias | Authors' judgement | Support for judgement |
| Random sequence generation (selection bias) | Low risk | Stratified random assignment |
| Allocation concealment (selection bias) | Low risk | Allocation conducted by statistician who did not know the clinicians |
| Baseline characteristics | Low risk | Reported and similar |
| Blinding of participants and personnel (performance bias) All outcomes | Low risk | Not possible but low risk owing to design |
| Blinding of outcome assessment (detection bias) All outcomes | Low risk | Research assistants, blinded to study group status, collected participant data at all time points |
| Incomplete outcome data (attrition bias) All outcomes | Low risk | 90% of participants were retained in both arms at 12‐month follow‐up |
| Selective reporting (reporting bias) | Low risk | All outcomes reported |
| Protection against contamination | Low risk | Cluster design |
| Other bias | Low risk | |
Donohoe 2000.
| Methods | Cluster‐randomised controlled trial UK |
|
| Participants | 1939 adult patients with diabetes mellitus from general practice registers; 81% type 2 diabetes; mean age 66 years; mean HBA1c 7.3; 47% female; median 7.5 years diagnosed 150 healthcare professionals from 10 general practices (mean 7 GP partners; all with diabetes registers and designated GP or nurse providing diabetes care; all with structured relationship with a community chiropodist) | |
| Interventions | Primary care‐based annual review with foot examination; education pack for professionals; referral criteria and definitions of responsibilities of professionals; foot care education for patients supported by patient education leaflet; regular practice visits by member of specialist foot care team Comparison: continued with current care plus received an educational outreach visit on diabetic nephropathy |
|
| Outcomes |
Provider behaviour
Appropriateness of referral to specialist foot clinic and community chiropodist Costs Direct costs of the intervention reported |
|
| Notes | Study duration 6 months Unit of analysis error; results analysed at participant level despite cluster‐randomisation Primary outcomes related to participant and professional knowledge and attitude outcomes (ineligible for inclusion in the review) | |
| Risk of bias | ||
| Bias | Authors' judgement | Support for judgement |
| Random sequence generation (selection bias) | Unclear risk | Not reported |
| Allocation concealment (selection bias) | Low risk | Cluster |
| Baseline characteristics | Low risk | Reported and similar |
| Blinding of participants and personnel (performance bias) All outcomes | Low risk | Not possible but low risk owing to design |
| Blinding of outcome assessment (detection bias) All outcomes | Low risk | Done |
| Incomplete outcome data (attrition bias) All outcomes | High risk | Follow up 56%‐70% depending on outcome |
| Selective reporting (reporting bias) | Low risk | All outcomes in methods reported |
| Protection against contamination | Low risk | Protection against contamination due to design |
| Other bias | Low risk | |
Doughty 2002.
| Methods | Cluster‐randomised controlled trial New Zealand |
|
| Participants | 197 patients with heart failure admitted to Auckland Hospital; mean age 73 years; 40% female; 78% NZ Europeans; 75% classified as NYHA functional class IV on admission 132 GPs of eligible patients were invited to participate; all agreed. Specialist care provided in hospital heart failure clinic and education provided by study nurse | |
| Interventions | Specialist review 2 weeks post discharge; 1‐to‐1 education with study nurse; participant diary; education booklet; 6‐weekly alternating visits between GP and specialist clinic; GP education sessions provided by study team; study team available to GPs and participants during office hours Comparison: usual care GP follow‐up and specialist care follow‐up recommended by medical team responsible for care during initial admission | |
| Outcomes |
Health outcomes
Primary outcomes Time to first event (combined death or hospital re‐admission); quality of life Secondary outcomes All‐cause re‐admissions; heart failure re‐admissions; all‐cause bed days Process outcomes Prescribing of medication (ACE inhibitors) |
|
| Notes | Study duration 1 year | |
| Risk of bias | ||
| Bias | Authors' judgement | Support for judgement |
| Random sequence generation (selection bias) | Unclear risk | Used computer‐generated random numbers |
| Allocation concealment (selection bias) | Low risk | Allocation by cluster |
| Baseline characteristics | Low risk | Relevant outcomes reported and similar |
| Blinding of participants and personnel (performance bias) All outcomes | Low risk | Not possible but low risk owing to nature of the design |
| Blinding of outcome assessment (detection bias) All outcomes | Low risk | Done for all outcomes except quality of life outcome |
| Incomplete outcome data (attrition bias) All outcomes | Low risk | 99% follow‐up |
| Selective reporting (reporting bias) | Low risk | Outcomes in methods reported |
| Protection against contamination | Low risk | Protection against contamination due to nature of the design |
| Other bias | Low risk | |
Drummond 1994.
| Methods | Randomised controlled trial UK |
|
| Participants | 712 adults attending specialist clinic with a diagnosis of asthma confirmed by a chest physician GPs of participating patients Asthma specialists at 4 outpatient clinics in Grampian region of Scotland | |
| Interventions | Annual specialist review and 3‐monthly GP reviews; computer‐based patient record system; computer‐generated appointment reminders and symptom questionnaires; computer‐generated reminders to GP with questionnaire regarding asthma care Comparison: usual outpatient care of 3‐monthly reviews with extra visits at discretion of specialist and GP |
|
| Outcomes |
Health outcomes
Primary outcomes Asthma symptoms (sleep disturbance and restriction of normal activities); perceived control and anxiety component of HAD scale; treatment satisfaction Secondary outcomes Peak flow rates; forced expiratory volume Process outcomes Medication use (inhaled bronchodilators, inhaled steroids and oral steroids); GP visits for asthma; hospital admissions for asthma Costs Direct costs to healthcare service and participants |
|
| Notes | Study duration 12 months Equivalence presumed when limited or no differences in outcomes, although not designed as an equivalence study Additional study regarding effectiveness of peak flow self‐monitoring within this study as 2 × 2 × 2 factorial design (this element not included in this review) | |
| Risk of bias | ||
| Bias | Authors' judgement | Support for judgement |
| Random sequence generation (selection bias) | Unclear risk | Method not reported |
| Allocation concealment (selection bias) | Unclear risk | Allocation done by entering physician |
| Baseline characteristics | High risk | Not reported |
| Blinding of participants and personnel (performance bias) All outcomes | High risk | Not possible owing to nature of the intervention and individual participant randomisation |
| Blinding of outcome assessment (detection bias) All outcomes | Unclear risk | Not reported |
| Incomplete outcome data (attrition bias) All outcomes | Low risk | 95% follow‐up |
| Selective reporting (reporting bias) | Low risk | Outcomes in methods reported |
| Protection against contamination | Unclear risk | Protection against contamination unclear |
| Other bias | Low risk | |
Duran 2008.
| Methods | Randomised controlled trial Spain |
|
| Participants | 126 patients with diabetes and peripheral vascular disease | |
| Interventions | After a treatment period of 3 months by Diabetes team at hospital, participants randomised to treatment by family physician at primary care level with continuous diabetes team co‐ordination Comparison: after a treatment period of 3 months by Diabetes team at hospital, participants randomised to continue follow‐up by Diabetes team |
|
| Outcomes |
Health outcomes Proportion of participants meeting ATP III and Steno goals for HbA1c Cholesterol ‐ HDL, LDL, triglycerides Blood pressure Albumin‐to‐creatinine excretion ratio (ACR) BMI Waist circumference Medication: antiaggregation treatment Smoking status |
|
| Notes | Study duration 30 months | |
| Risk of bias | ||
| Bias | Authors' judgement | Support for judgement |
| Random sequence generation (selection bias) | Unclear risk | Not reported (states only that participants were 'randomised') |
| Allocation concealment (selection bias) | Unclear risk | Not reported (states only that participants were 'randomised') |
| Baseline characteristics | Low risk | Reported and similar |
| Blinding of participants and personnel (performance bias) All outcomes | Unclear risk | Not clearly reported ("two nurses were responsible for follow‐up visits at 30 months") |
| Blinding of outcome assessment (detection bias) All outcomes | Unclear risk | Not reported |
| Incomplete outcome data (attrition bias) All outcomes | Low risk | 90% of intervention and control groups followed up at 30 months |
| Selective reporting (reporting bias) | Low risk | Outcomes in methods reported |
| Protection against contamination | Unclear risk | Protection against contamination unclear |
| Other bias | Low risk | |
Fihn 2011.
| Methods | Cluster‐randomised controlled trial USA |
|
| Participants | 183 primary care providers and 703 patients with ischaemic heart disease (scoring ≤ 70 on Seattle Angina Questionnaire ‐ SAQ) | |
| Interventions | Collaborative care team (cardiologist, general internist, research assistant and clinical nurse specialist or pharmacist) met twice monthly to review participants' records, develop diagnostic and treatment plans and evaluate progress. Recommendations sent to PCP via electronic health record ‐ to sign/modify/reject Comparison: usual care |
|
| Outcomes |
Health outcomes Seattle Angina Questionnaire (again frequency; physical limitation; treatment satisfaction; disease perception; anginal stability) Veterans Rand 12‐Item Health Survey Seattle Outpatient Satisfaction Questionnaire Depression (Patient Health Questionnaire) Death |
|
| Notes | Study duration 12 months | |
| Risk of bias | ||
| Bias | Authors' judgement | Support for judgement |
| Random sequence generation (selection bias) | Unclear risk | Not reported |
| Allocation concealment (selection bias) | Low risk | Cluster level |
| Baseline characteristics | Low risk | Reported and similar |
| Blinding of participants and personnel (performance bias) All outcomes | Low risk | Cluster design |
| Blinding of outcome assessment (detection bias) All outcomes | Unclear risk | Not reported |
| Incomplete outcome data (attrition bias) All outcomes | Low risk | 670/703 at 12‐month follow‐up |
| Selective reporting (reporting bias) | Low risk | Outcomes in methods reported |
| Protection against contamination | Low risk | Protection against contamination due to nature of the design |
| Other bias | Low risk | |
Fortney 2007.
| Methods | Cluster‐randomised controlled trial USA (VA healthcare system) |
|
| Participants | 395 patients with depression, mean age 59, 94% male | |
| Interventions |
TEAM intervention Telemedicine‐enhanced antidepressant management Stepped care model using off‐site depression care team (nurse case manager, pharmacist, psychiatrist and PCPs), with weekly team meetings Protocol: All had psychotherapy, medication if indicated with pharmacist support, if no response to 2 or more medications ‐ psychiatry referral CDSS with recommendations via EHR Provider education (off‐site videos) Patient education Comparison: usual care plus provider and patient education |
|
| Outcomes | Medication adherence Depression (SCL‐20 scores: response (50% improvement in SCL‐20), remission (SCL‐20 < 0.5)) Treatment satisfaction HRQoL (SF‐12, QWB scores) Costs |
|
| Notes | Study duration 12 months | |
| Risk of bias | ||
| Bias | Authors' judgement | Support for judgement |
| Random sequence generation (selection bias) | Unclear risk | Not reported |
| Allocation concealment (selection bias) | Low risk | Cluster |
| Baseline characteristics | Low risk | Reported and similar |
| Blinding of participants and personnel (performance bias) All outcomes | Low risk | Not possible owing to nature of the intervention but low risk based on cluster design |
| Blinding of outcome assessment (detection bias) All outcomes | Low risk | 'Blinded telephone interviews' |
| Incomplete outcome data (attrition bias) All outcomes | Low risk | 85% follow‐up |
| Selective reporting (reporting bias) | Low risk | Outcomes in methods reported |
| Protection against contamination | Low risk | Protection against contamination due to nature of the design |
| Other bias | Low risk | |
Goderis 2010.
| Methods | Cluster‐randomised controlled trial Belgium |
|
| Participants | 2256 patients with type 2 diabetes; 74 practices | |
| Interventions | Advanced quality improvement programme, which included usual QIP (evidence‐based treatment protocol; annual benchmarking; postgraduate education, case‐coaching for GPs; patient education) with additional intensified follow‐up, shared care, participant behavioural change Comparison: usual QIP |
|
| Outcomes |
Health outcomes Primary outcomes Improvement in HbA1c; SBP; LDL‐C Secondary outcomes Improvement in HDL‐C; total cholesterol; DBP: BMI; smoking status; statin and antiplatelet therapy efficacy |
|
| Notes | Intervention 18 months | |
| Risk of bias | ||
| Bias | Authors' judgement | Support for judgement |
| Random sequence generation (selection bias) | Low risk | Computer‐generated numbers used to randomly assign practices |
| Allocation concealment (selection bias) | Low risk | Allocation at practice level |
| Baseline characteristics | Low risk | Reported and similar |
| Blinding of participants and personnel (performance bias) All outcomes | Low risk | Participants blinded to study design but not possible to blind physicians |
| Blinding of outcome assessment (detection bias) All outcomes | Low risk | Not reported, but primary outcomes were objective measures |
| Incomplete outcome data (attrition bias) All outcomes | Low risk | < 10 incomplete outcome data |
| Selective reporting (reporting bias) | Low risk | Outcomes in methods reported |
| Protection against contamination | Low risk | Cluster design |
| Other bias | Unclear risk | GPs and participants free to choose their level of participation in offered services ‐ 84% of PCPs and 12.5% of participants made use of interdisciplinary care teams |
Holm 2002.
| Methods | Cluster‐randomised controlled trial Denmark |
|
| Participants | 343 patients on oral anticoagulation therapy (OAT) (50% with atrial fibrillation; 18% with prosthetic heart valve; and 16% with thromboembolism); median age 70; 45% female 127 GPs 4 specialist physicians at a hospital outpatient clinic in Aarhis County, Denmark, covering population of 310,300 | |
| Interventions | Specialists' initial education programme for GPs; patient education; OAT telephone hotline for GPs; annual evaluation of all OAT patients; mailing of anonymised OAT quality reports to GPs GP referral of OAT patients to hospital clinics for evaluation of OAT; routine monitoring of OAT Comparison: usual care GPs monitoring OAT; no education or specialist support/evaluation | |
| Outcomes |
Health outcomes
Primary outcomes Median time spent within therapeutic interval of INR (optimal OAT control) Secondary outcomes Clinical outcomes: major and minor haemorrhage; recurrent thrombosis; death |
|
| Notes | Study reports results for patients entering and leaving shared care service. This review includes only data related to patients maintained on OAT throughout the study period. Study duration 2 years with immediate follow‐up Study includes data on non‐randomised group (patients of non‐responder GPs) not included in this review | |
| Risk of bias | ||
| Bias | Authors' judgement | Support for judgement |
| Random sequence generation (selection bias) | Unclear risk | Method not reported |
| Allocation concealment (selection bias) | Low risk | Cluster allocation |
| Baseline characteristics | Low risk | Reported and similar |
| Blinding of participants and personnel (performance bias) All outcomes | Low risk | Not possible owing to nature of the intervention but low risk due to cluster design |
| Blinding of outcome assessment (detection bias) All outcomes | Low risk | Done |
| Incomplete outcome data (attrition bias) All outcomes | Low risk | Complete follow‐up for participants maintained on oral anticoagulant therapy (OAT) throughout study period |
| Selective reporting (reporting bias) | Low risk | Outcomes in methods reported |
| Protection against contamination | Low risk | Protection against contamination due to nature of the design |
| Other bias | Low risk | |
Hoskins 1992.
| Methods | Randomised controlled trial Australia |
|
| Participants | 206 patients with diabetes mellitus referred to the specialist centre by their GP for assessment and management; mean age 54; 36% female; 93% type 2 diabetes; 59% non‐English speaking; mean diabetes duration 3.2 years; 31% with health insurance. All participants received outpatient stabilisation and education for 3‐6 weeks before randomisation by specialist physicians, nurse educators and dieticians. Forty participants were excluded owing to significant complications. GPs of participating patients were not informed that the study was ongoing, although they were aware of the shared care arrangement. | |
| Interventions | Intervention 1: shared care. Individual patient management plans; liaison nurse co‐ordinated participant and GP reminders re appointments; 4‐monthly GP reviews; annual clinic reviews Intervention 2: GP care. Letter to GP recommending 4‐monthly visits; annual clinic review Comparison: clinic care, 4‐monthly specialist clinic attendance | |
| Outcomes |
Health outcomes
Metabolic control (HBA1c, blood pressure, weight) Process outcomes Attendance rates; data collection rates Costs Relative direct costs of each model of care |
|
| Notes | Study duration 1 year Training and awareness of GPs in shared group unclear | |
| Risk of bias | ||
| Bias | Authors' judgement | Support for judgement |
| Random sequence generation (selection bias) | Unclear risk | Reported as 'patients randomised'; no details |
| Allocation concealment (selection bias) | Unclear risk | Not reported |
| Baseline characteristics | Low risk | Reported and similar |
| Blinding of participants and personnel (performance bias) All outcomes | Unclear risk | Not reported |
| Blinding of outcome assessment (detection bias) All outcomes | Low risk | Automated test |
| Incomplete outcome data (attrition bias) All outcomes | High risk | Data on 98% of the 53% of participants who attended follow‐up visit |
| Selective reporting (reporting bias) | Low risk | Outcomes in methods reported |
| Protection against contamination | Unclear risk | Protection against contamination unclear |
| Other bias | Low risk | |
Huijbregts 2013.
| Methods | Cluster‐randomised controlled trial Netherlands |
|
| Participants | 150 patients with major depressive disorder | |
| Interventions | Patients entered intervention group after screening or after identification by their GP. Target‐driven collaborative care model. Target to achieve remission (PHQ‐9 < 5) within 18‐14 weeks of treatment. If not achieved, referral to specialty mental health care advised Depression care manager In case of suicidality, a protocol that included consultation with a psychiatrist was followed. Comparison: patients informed of their diagnosis and advised to seek treatment from their GP |
|
| Outcomes |
Health outcomes Depression 1. Whether participant reached a clinically relevant response on the PHQ‐9 (decrease ≥ 50% on PHQ‐9 compared with baseline on a follow‐up questionnaire, defined as clinically relevant response to treatment) 2. Remission ‐ score < 5 on the PHQ‐9 |
|
| Notes | Study duration 18‐24 months High loss to follow‐up, particularly at 12 months and in the collaborative care group and those identified by GP (i.e. not screened) |
|
| Risk of bias | ||
| Bias | Authors' judgement | Support for judgement |
| Random sequence generation (selection bias) | Low risk | Randomly assigned...by an independent statistician using a computer algorithm for allocation |
| Allocation concealment (selection bias) | Low risk | Cluster allocation |
| Baseline characteristics | Low risk | Reported and similar |
| Blinding of participants and personnel (performance bias) All outcomes | Unclear risk | Not reported |
| Blinding of outcome assessment (detection bias) All outcomes | Unclear risk | Not reported |
| Incomplete outcome data (attrition bias) All outcomes | High risk | High loss to follow‐up (44.6% of CC ‐ identified by GP group; 73.3% of CC ‐ screened and followed up at 12 months; 65 CAU followed up at 12 months (overall 60% follow‐up at 12 months ‐ 90/150) |
| Selective reporting (reporting bias) | Low risk | Outcomes in methods reported |
| Protection against contamination | Low risk | Protection against contamination due to design |
| Other bias | Low risk | |
Johannson 2001.
| Methods | Randomised controlled trial Sweden |
|
| Participants | 416 patients with newly diagnosed cancer (breast cancer 47%; GI cancer 30%; prostate cancer 23%); mean age 63; 57% female Specialist multi‐disciplinary oncology team (psychologist, dietician, physiotherapist, urotherapist and specialist nurse) GPs and home care nurses (HCNs) of intervention participants | |
| Interventions | Individual support intervention (intensified primary care; nutritional support; and individual psychological support); extended information routine between specialist and primary care; regular supervision of HCN by specialist team; GP and HCN education (12 seminars); additional nutritional support for participants with GI cancer Comparison: usual care | |
| Outcomes |
Health outcomes
Weight loss; depression/anxiety Process outcomes Utilisation of specialist care within 3 months (number of admissions; days of hospitalisation; number of outpatient visits) |
|
| Notes | Study duration 3 months After 3 months, additional intervention of group rehabilitation introduced | |
| Risk of bias | ||
| Bias | Authors' judgement | Support for judgement |
| Random sequence generation (selection bias) | Low risk | Computer‐generated number |
| Allocation concealment (selection bias) | Low risk | Computer allocation schedule |
| Baseline characteristics | Low risk | Reported and similar |
| Blinding of participants and personnel (performance bias) All outcomes | Low risk | Not possible owing to nature of the intervention but low risk as intervention service not available to control participants |
| Blinding of outcome assessment (detection bias) All outcomes | Low risk | Reported |
| Incomplete outcome data (attrition bias) All outcomes | Low risk | 81% follow‐up |
| Selective reporting (reporting bias) | Low risk | Outcomes in methods reported |
| Protection against contamination | Unclear risk | Protection against contamination unclear |
| Other bias | Low risk | |
Joubert 2009.
| Methods | Randomised controlled trial Australia |
|
| Participants | 186 patients with TIA (15%) or CVA (85%) confirmed by CT scan and survived to discharge home; 55% male; mean age 65 years GPs; nurse co‐ordinator; stroke specialist Setting: Stroke Unit at 2 Melbourne hospitals in Australia with GPs (at least 14 included, full number not reported) of participating patients |
|
| Interventions | ICARUSS model: GP visits 3‐monthly with structured care and targeted management of 7 risk factors; flow charts with individual participant risk factor information sent to GP before each participant visit; ready telephone access to stroke specialist for GPs; clinical co‐ordinator and periodic telephone calls to participants screening for depression and after GP visits; patient and caregiver educational materials Comparison: usual GP care |
|
| Outcomes |
Health outcomes Primary outcomes BP Secondary outcomes Risk factors (smoking and alcohol); atrial fibrillation; cholesterol; disability (Rankin scale); activities of daily living (Barthel Index); quality of life (QOL); weight and physical activity |
|
| Notes | Study duration 12 months | |
| Risk of bias | ||
| Bias | Authors' judgement | Support for judgement |
| Random sequence generation (selection bias) | Unclear risk | Computerised randomisation schedule used after consent obtained |
| Allocation concealment (selection bias) | Low risk | Done |
| Baseline characteristics | Low risk | Reported and similar |
| Blinding of participants and personnel (performance bias) All outcomes | Unclear risk | Not reported |
| Blinding of outcome assessment (detection bias) All outcomes | Unclear risk | Not reported |
| Incomplete outcome data (attrition bias) All outcomes | Low risk | 80% follow‐up of participants |
| Selective reporting (reporting bias) | Low risk | Outcomes in methods reported |
| Protection against contamination | Low risk | If second patient from previously enrolled GP presented, that patient was allocated to that GP to avoid contamination. This occurred in only 14 cases. |
| Other bias | Low risk | |
Katon 1999.
| Methods | Randomised controlled trial USA |
|
| Participants | 229 patients with persistent symptoms of depression after 6‐8 weeks of treatment provided by their primary care physician (PCP); mean age 47 years; 68% female (intervention group) vs 82% female (UC group); 80% white ethnic group 73 PCPs at 4 primary care clinics, with 88,000 enrollees in an HMO in USA 4 intervention psychiatrists | |
| Interventions | Augmented treatment of persistently depressed patients by an on‐site psychiatrist in collaboration with a PCP ‐ 2 sessions with psychiatrist with immediate verbal consultation with PCP involving adjustment of pharmacotherapy and proactive monitoring of outcomes. Psychiatrist monitored medication adherence using automated pharmacy data and communicated with PCP if medication discontinued; patient education (booklet and videotape) Comparison: usual care with PCP (prescription of antidepressant medication; 2‐3 visits in 3 months and option to refer to mental health specialist). Both groups could self‐refer to mental health specialist. | |
| Outcomes |
Health outcomes
SCL‐20 depression scores; proportion recovered from depression; treatment satisfaction; disability; social functioning (data from Lin 2000) Process outcomes PCP visits; psychiatrist visits (intervention group only); proportion seen by non‐study mental health professional; antidepressant medication refills Costs Incremental cost‐effectiveness of the intervention per additional depression‐free day (data from Simon 2001) |
|
| Notes | Study duration 12 months Follow‐up paper gives outcomes at 28 months (Katon 2002); 2 companion papers reported disability and costs (Lin 2000 and Simon 2001) | |
| Risk of bias | ||
| Bias | Authors' judgement | Support for judgement |
| Random sequence generation (selection bias) | Low risk | Computer‐generated sequence |
| Allocation concealment (selection bias) | Low risk | Done |
| Baseline characteristics | Low risk | Reported and similar |
| Blinding of participants and personnel (performance bias) All outcomes | Unclear risk | Not reported |
| Blinding of outcome assessment (detection bias) All outcomes | Low risk | Telephone assessors blinded |
| Incomplete outcome data (attrition bias) All outcomes | Low risk | 82% follow‐up |
| Selective reporting (reporting bias) | Low risk | Outcomes in methods reported |
| Protection against contamination | Unclear risk | Contamination risk unclear |
| Other bias | Low risk | |
Katon 2001.
| Methods | Randomised controlled trial USA |
|
| Participants | 386 patients with recurrent major depression or dysthymia who had largely recovered, having completed an 8‐week treatment programme with their primary care physician (PCP) 73 board‐certified PCPs from 4 primary care clinics, with 88,000 enrolled patients in a US HMO serving 400,000 people Three depression prevention specialists (psychologist, nurse practitioner and social worker). Psychiatrist preformed training and was available for consultation and referral. | |
| Interventions | Patient education book and videotape; depression specialist education; depression nurse specialist 2 visits followed up by telephone monitoring at 1, 4 and 8.5 months; personalised relapse prevention plan; personalised mailings at 2, 6, 10 and 12 months; nurse specialist alerted PCP if medications discontinued or if feedback indicated depression relapse; intermittent verbal and written feedback to PCPs Comparison: usual care provided by PCPs involving 2‐4 visits every 6 months; referral to specialists by PCPs or participants | |
| Outcomes |
Health outcomes
SCL‐20 depression score; occurrence of a major episode of depression during follow‐up Process outcomes Follow‐up rates; antidepressant medication refills; adequacy of antidepressant dosage Costs Incremental cost‐effectiveness (Simon 2002) |
|
| Notes | Study duration 12 months Additional intervention details including role of PCPs obtained from study authors | |
| Risk of bias | ||
| Bias | Authors' judgement | Support for judgement |
| Random sequence generation (selection bias) | Low risk | Computer generated |
| Allocation concealment (selection bias) | Low risk | Done |
| Baseline characteristics | Low risk | Reported and similar |
| Blinding of participants and personnel (performance bias) All outcomes | Unclear risk | Not reported |
| Blinding of outcome assessment (detection bias) All outcomes | Low risk | Outcome assessors blinded |
| Incomplete outcome data (attrition bias) All outcomes | Low risk | > 80% follow‐up |
| Selective reporting (reporting bias) | Low risk | Outcomes in methods reported |
| Protection against contamination | Unclear risk | Contamination possible as same providers |
| Other bias | Low risk | |
Katon 2004.
| Methods | Randomised controlled trial USA |
|
| Participants | 329 patients with diabetes and comorbid major depression and/or dysthymia Specialist service: 3 clinical nurse specialists (CNSs), a psychiatrist and a psychologist 9 primary care clinics | |
| Interventions | Pathways case management intervention comprising individualised stepped care treatment provided by depression CNS in collaboration with primary care physician. Step 1: Provide antidepressant medication or problem‐solving treatment (12 weeks). Step 2: If depression persisted, switch treatment or refer to psychiatrist. Step 3: Refer to specialty mental health system. Comparison: Participants were advised to consult their primary care physician regarding depression. | |
| Outcomes |
Health outcomes
Primary outcomes SCL‐20 depression scores; global improvement; satisfaction with treatment Secondary outcomes HbA1c Process outcomes Antidepressant medication refills; adequate dosage antidepressant medication; number of specialty visits |
|
| Notes | Study duration 12 months | |
| Risk of bias | ||
| Bias | Authors' judgement | Support for judgement |
| Random sequence generation (selection bias) | Low risk | Computer generated |
| Allocation concealment (selection bias) | Low risk | Done |
| Baseline characteristics | Low risk | Reported and similar |
| Blinding of participants and personnel (performance bias) All outcomes | Unclear risk | Not reported and difficult given nature of the intervention |
| Blinding of outcome assessment (detection bias) All outcomes | Low risk | Outcome assessor blinded |
| Incomplete outcome data (attrition bias) All outcomes | Low risk | 86% follow‐up |
| Selective reporting (reporting bias) | Low risk | Outcomes in methods reported |
| Protection against contamination | Unclear risk | Potential contamination as same providers |
| Other bias | Low risk | |
Katon 2010.
| Methods | Randomised controlled trial USA |
|
| Participants | 214 patients with depression and diabetes and/or coronary heart disease Primary care practitioners (PCPs) at 14 primary care clinics and 3 trained medically supervised nurses |
|
| Interventions | TEAMcare intervention integrating a treat‐to‐target programme with structured visits with nurses, individualised care plans and treatment targets, support for self‐care combined with pharmacotherapy, provision of self‐care materials for participants, weekly meetings to discuss case progression between nurses, PCPs, psychiatrist and psychologist, electronic registry used to track participant risk factors and depression scores Comparison: Control group had "enhanced primary care", i.e. usual care plus PCPs informed of depression diagnosis and of results at baseline and at 6 and 12 months; intervention duration 12 months; follow‐up data collection at 12 months |
|
| Outcomes |
Primary outcomes Composite measure of risk factor control incorporating HBA1c, LDL cholesterol, SBP, scores on the SCL‐20 depression scale Secondary outcomes SCL‐20 depression scores, patient global rating of improvement score (i.e. > 50% improvement in SCL‐20 score), medication adjustments, medication adherence, adherence with diet and exercise plans, quality of life, satisfaction with care |
|
| Notes | Study duration 12 months | |
| Risk of bias | ||
| Bias | Authors' judgement | Support for judgement |
| Random sequence generation (selection bias) | Low risk | Permuted block design |
| Allocation concealment (selection bias) | Low risk | Centrally randomised process |
| Baseline characteristics | Low risk | Reported and similar |
| Blinding of participants and personnel (performance bias) All outcomes | Unclear risk | Not possible owing to nature of the intervention |
| Blinding of outcome assessment (detection bias) All outcomes | Low risk | Research assistants who were unaware of the intervention status implemented study procedures. |
| Incomplete outcome data (attrition bias) All outcomes | Low risk | 12‐Month follow‐up > 83% all measures, majority > 90% |
| Selective reporting (reporting bias) | Low risk | Outcomes in methods reported |
| Protection against contamination | Unclear risk | Contamination possible as control group did not have access to study nurses but were managed by same group of PCPs as intervention group |
| Other bias | Low risk | |
Llewelyn‐Jones 1999.
| Methods | Randomised controlled trial Australia |
|
| Participants | 220 depressed residents over 65 years of age at a residential facility in Sydney without severe cognitive impairment living in self‐care units and hostels; mean age 84; 80% female; all English speaking; mean geriatric depression score 13.5 | |
| Interventions | Education for GPs and caregivers focusing on increasing detection rates for late life depression; health education and activity programmes for patients; volunteer programme to provide psychosocial support for patients; bimonthly newsletter for patients; provision of accessible depression treatment programme in residential care (care delivered by GPs and care staff supported by specialists; regular multi‐disciplinary meetings to ensure programme feasibility and acceptability; monthly liaison committee meetings) Comparison: routine care not defined but described as occurring within the context of limited specialist services | |
| Outcomes |
Health outcomes
Primary outcomes Geriatric depression scale Secondary outcomes Movement within groups toward being less depressed Process outcomes Mean daily dose of antidepressants; number of depressogenic drugs |
|
| Notes | Study duration 9.5 months Controversial RCT design ‐ sequential data collection | |
| Risk of bias | ||
| Bias | Authors' judgement | Support for judgement |
| Random sequence generation (selection bias) | Low risk | Computer generated |
| Allocation concealment (selection bias) | Low risk | Done |
| Baseline characteristics | Low risk | Reported and similar |
| Blinding of participants and personnel (performance bias) All outcomes | Low risk | Participants unaware in study |
| Blinding of outcome assessment (detection bias) All outcomes | Low risk | Researchers 'unaware' of allocation |
| Incomplete outcome data (attrition bias) All outcomes | High risk | 73% follow‐up for primary outcome |
| Selective reporting (reporting bias) | Low risk | Outcomes in methods reported |
| Protection against contamination | Unclear risk | Potential contamination although deliverers unaware in intervention study and same providers possibly for controls |
| Other bias | Unclear risk | Non‐contemporaneous data collection |
McGhee 1994.
| Methods | Randomised controlled trial UK |
|
| Participants | 554 outpatients with well‐controlled hypertension (as assessed by specialist); mean age 58 years; 52% female; 251 GPs (85% of eligible GPs participated). Two specialist clinics | |
| Interventions | Defined roles within each sector; clinical care protocols; follow‐up plans; centralised, computerised database that produced annual record for GPs, prompt letters for GP appointments and patient‐held summary record; results sent by local laboratories to registry and abnormal results reviewed by specialists; annual GP review with results sent to registry; specialist review when necessary. Comparison: continuing specialist outpatient care (not described) | |
| Outcomes |
Health outcomes
Blood pressure control; acceptability to participants and GPs (recorded only in shared care group) Process outcomes Proportion of participants with complete review in second year; drop‐out rates Costs Cost per complete review in year 2 to participants and health service (NHS) |
|
| Notes | Study duration 2 years Data also taken from McInnes et al, 1995 (paper related to same study) Third arm of 277 participants non‐randomly allocated to nurse‐led clinic, not included in analysis | |
| Risk of bias | ||
| Bias | Authors' judgement | Support for judgement |
| Random sequence generation (selection bias) | Unclear risk | Not reported |
| Allocation concealment (selection bias) | Unclear risk | Not reported |
| Baseline characteristics | Unclear risk | Demographic characteristics reported only ‐ not primary outcome |
| Blinding of participants and personnel (performance bias) All outcomes | Unclear risk | Not reported |
| Blinding of outcome assessment (detection bias) All outcomes | Unclear risk | Not reported |
| Incomplete outcome data (attrition bias) All outcomes | Low risk | > 86% follow‐up |
| Selective reporting (reporting bias) | Low risk | Outcomes in methods reported |
| Protection against contamination | Unclear risk | Potential contamination as same providers |
| Other bias | Low risk | |
Menchetti 2013.
| Methods | Cluster‐randomised controlled trial Italy |
|
| Participants | 227 adults with new‐onset depression 16 primary care groups at participating sites (30% of total in area) Consultant psychiatrist |
|
| Interventions | Enhanced primary care, with PCP acting as case manager, dedicated consultant psychiatrist, 2‐day PCP training, stepped care protocol with treatment algorithms, depression management toolkit, supervision sessions for PCP Comparison: usual care with referral to specialists as needed, 2‐hour meeting re study procedures for PCPs in comparison group |
|
| Outcomes |
Primary outcomes Clinical remission depression (PHQ‐9 score < 5 at follow‐up) Secondary outcomes Other depression measures (50% reduction in PHQ‐9 score, mean PHQ‐9 score, mean WSAS score) Healthcare utilisation |
|
| Notes | Study duration 12 months No nurse involvement as nurses in Italy not regularly involved in primary care |
|
| Risk of bias | ||
| Bias | Authors' judgement | Support for judgement |
| Random sequence generation (selection bias) | Low risk | Computer‐generated sequence |
| Allocation concealment (selection bias) | Low risk | Allocation by independent researcher and cluster design |
| Baseline characteristics | Low risk | Reported and similar |
| Blinding of participants and personnel (performance bias) All outcomes | Unclear risk | PCP blinding not possible owing to nature of the intervention |
| Blinding of outcome assessment (detection bias) All outcomes | High risk | Reported as no blinding |
| Incomplete outcome data (attrition bias) All outcomes | Low risk | Follow‐up: 93% intervention, 83% control |
| Selective reporting (reporting bias) | Low risk | Outcomes in methods reported |
| Protection against contamination | Low risk | Contamination unlikely owing to design |
| Other bias | Low risk | |
Meulepas 2007.
| Methods | Non‐randomised controlled trial (based on region with delayed intervention for control region) Netherlands |
|
| Participants | 260 patients with COPD Practice nurse at each GP clinic 44 GP (PCP) practices (all approached agreed) |
|
| Interventions | COPD support service offering registration, recall, annual history and tests. Specialist checked all results and communicated with GP. Patient education provided by GP and practice nurse including general COPD education and inhaler technique Comparison: usual care |
|
| Outcomes |
Primary outcomes Process of care: planned visits, lung function measurement, smoking advice Secondary outcomes Smoking status; number of exacerbations in 3 months; number of emergency medications needed; % with correct inhaler technique |
|
| Notes | Study duration 2 years No randomisation, practice allocation based on region |
|
| Risk of bias | ||
| Bias | Authors' judgement | Support for judgement |
| Random sequence generation (selection bias) | High risk | No randomisation (NRCT design) |
| Allocation concealment (selection bias) | High risk | Allocation by region but not randomised |
| Baseline characteristics | Low risk | Reported and similar |
| Blinding of participants and personnel (performance bias) All outcomes | Unclear risk | Blinding was not possible due to the nature of the intervention |
| Blinding of outcome assessment (detection bias) All outcomes | High risk | Reported as not blinded |
| Incomplete outcome data (attrition bias) All outcomes | High risk | Participant follow‐up 64% |
| Selective reporting (reporting bias) | Low risk | Outcomes in methods reported |
| Protection against contamination | Low risk | Contamination unlikely owing to allocation by practice and region |
| Other bias | Low risk | |
Muntingh 2013.
| Methods | Cluster‐randomised controlled trial Netherlands |
|
| Participants | 180 patients with panic disorder (PD) and generalised anxiety disorder (GAD); mean age 46 years; 68% female 43 primary care practices with 63 GPs and practice nurses 31 psychiatric nurses (care managers) in intervention practices |
|
| Interventions |
Stepped care 1. Guided self‐help sessions (5 sessions over 12 weeks) 2. CBT (6 sessions) 3. Medication (antidepressants) Training for professionals Practice nurse and GP could contact psychiatrist via email, by phone or in person when needed Comparison: usual care according to national primary care treatment guidelines for GAD |
|
| Outcomes |
Primary outcomes Anxiety (Beck's Anxiety Inventory (BAI) and Overall Anxiety Severity and Impairment Scale (OASIS)) Secondary outcomes Time to first remission (BAI < 11); first response to treatment (> 50% reduction in BAI); depression (PHQ‐9); HRQoL (SF‐36 and EQ5D) Process of care: checklist completed by GP and by care manager who was recording steps in treatment |
|
| Notes | Study duration 12 months | |
| Risk of bias | ||
| Bias | Authors' judgement | Support for judgement |
| Random sequence generation (selection bias) | Low risk | Computer sequence generation |
| Allocation concealment (selection bias) | Low risk | Undertaken by independent statistician |
| Baseline characteristics | Low risk | Reported. Some baseline imbalance in anxiety scores that was controlled for in analysis |
| Blinding of participants and personnel (performance bias) All outcomes | Low risk | Blinding not possible owing to nature of the intervention but cluster design minimised risk of bias |
| Blinding of outcome assessment (detection bias) All outcomes | Low risk | Questionnaires processed by RA blinded to allocation |
| Incomplete outcome data (attrition bias) All outcomes | Low risk | 28/31 clusters followed up; 75% patient follow‐up at 12 months |
| Selective reporting (reporting bias) | Low risk | Outcomes in methods reported |
| Protection against contamination | Low risk | Contamination unlikely owing to cluster design |
| Other bias | Low risk | |
Primdahl 2014.
| Methods | Randomised controlled trial Comparison of 2 arms only: shared care vs usual care (third arm not included as nurse‐led care) Denmark |
|
| Participants | 188 patients with rheumatoid arthritis with low disease activity (total number in full trial 187) Specialist rheumatological clinic |
|
| Interventions | Annual specialist review GP monitoring based on written guidelines Specialist, nurse‐led telephone hotline for patients and GPs Comparison: usual specialist care, 3‐monthly clinic reviews |
|
| Outcomes |
Primary outcomes Change in disease activity (DAS28‐CRP) Secondary outcomes Health assessment questionnaire, visual analogue scale (VAS) ‐ pain, fatigue, global health, confidence, satisfaction, quality of life (SF‐12), self‐efficacy (RA self‐efficacy questionnaire), patient‐reported disease activity, x‐rays |
|
| Notes | Study duration 2 years | |
| Risk of bias | ||
| Bias | Authors' judgement | Support for judgement |
| Random sequence generation (selection bias) | Low risk | Computer sequence generation |
| Allocation concealment (selection bias) | Unclear risk | 'Secretary randomised participants' |
| Baseline characteristics | Low risk | Reported and similar |
| Blinding of participants and personnel (performance bias) All outcomes | Unclear risk | Not possible owing to nature of the intervention |
| Blinding of outcome assessment (detection bias) All outcomes | Low risk | Done |
| Incomplete outcome data (attrition bias) All outcomes | Low risk | 96% follow‐up |
| Selective reporting (reporting bias) | Low risk | Outcomes in methods reported |
| Protection against contamination | Unclear risk | None apparent but possible owing to design |
| Other bias | Low risk | |
Rea 2004.
| Methods | Cluster‐randomised controlled trial New Zealand |
|
| Participants | 135 patients with moderate to severe chronic obstructive pulmonary disease (COPD) 1 specialist service (respiratory physician and respiratory nurse specialist) 51 general practices (116 GPs) | |
| Interventions | Initial assessment by specialist team followed by initiation of chronic disease management programme by GP and practice nurse; patient‐specific care plans; timetable for visits (≥ 3 monthly); action plan for symptom management; education on smoking cessation and inhaler use; annual influenza vaccination; recommendation for attendance at pulmonary rehab programme; 1 home visit from nurse specialist; hospital admission triggering further contact and shared discharge planning Comparison: initial assessment by specialist team followed by usual care with GPs having access to COPD guidelines | |
| Outcomes |
Health outcomes
Primary outcomes Hospital admissions Secondary outcomes Smoking; physical functioning (shuttle walk test and spirometry); well‐being (SF‐36 scores) Process outcomes Attendance at pulmonary rehab; COPD medication prescribing in primary care |
|
| Notes | Study duration 12 months All participants remunerated for COPD‐related visits | |
| Risk of bias | ||
| Bias | Authors' judgement | Support for judgement |
| Random sequence generation (selection bias) | Unclear risk | Not reported |
| Allocation concealment (selection bias) | Low risk | Cluster |
| Baseline characteristics | Low risk | Reported and similar |
| Blinding of participants and personnel (performance bias) All outcomes | Unclear risk | Not possible owing to nature of the intervention |
| Blinding of outcome assessment (detection bias) All outcomes | Unclear risk | Not reported |
| Incomplete outcome data (attrition bias) All outcomes | Low risk | 87% follow‐up |
| Selective reporting (reporting bias) | Low risk | Outcomes in methods reported |
| Protection against contamination | Low risk | Protection against contamination due to design |
| Other bias | Low risk | |
Richards 2008.
| Methods | Cluster‐randomised controlled trial UK |
|
| Participants | 581 adults with depression (meeting ICD‐10 diagnostic criteria), identified by GP record searches. Patients already seeing psychiatrist excluded | |
| Interventions | CADET: collaborative care model, including depression education, drug management, behavioural activation, relapse prevention and communication between primary care physician and care manager Six to 12 primary care contacts with participants over a 14‐week period, supervised by mental health specialists Comparison: usual care |
|
| Outcomes |
Primary outcomes Depression (mean PHQ‐9 scores) Secondary outcomes Depression recovery and remission (changes in PHQ‐9 scores) Worry and anxiety (GAD scores) Quality of life (SF‐36) Participant satisfaction (client satisfaction questionnaire 8 ‐ CSQ‐8) |
|
| Notes | Study duration 12 months; intervention duration within the 12‐month period 14 weeks for individual participants For consistency with all other included studies, we are reporting outcomes at study conclusion (i.e. 12 months). |
|
| Risk of bias | ||
| Bias | Authors' judgement | Support for judgement |
| Random sequence generation (selection bias) | Low risk | Managed by remote Clinical Trials Unit |
| Allocation concealment (selection bias) | Low risk | Allocation sequence was was administered centrally via Minim. |
| Baseline characteristics | Low risk | Reported and similar |
| Blinding of participants and personnel (performance bias) All outcomes | Unclear risk | Not possible to blind participants owing to nature of the intervention |
| Blinding of outcome assessment (detection bias) All outcomes | Low risk | Researchers, blind to allocation, assessed for eligibility and collected outcome measures using patient self‐report questionnaires to minimise effects of potential unblinding. |
| Incomplete outcome data (attrition bias) All outcomes | Low risk | 85% of intervention group and 86% of control group at 12‐month follow‐up |
| Selective reporting (reporting bias) | Low risk | Outcomes in methods reported |
| Protection against contamination | Low risk | Contamination unlikely owing to design |
| Other bias | Low risk | |
Scherpbier‐de Haan 2013.
| Methods | Cluster‐randomised controlled trial Netherlands |
|
| Participants | 181 patients with chronic kidney disease (CKD) and diabetes (30%) and/or hypertension (75%), mean age 73, 45% male | |
| Interventions |
Collaborative care programme with Training for GPs and practice nurses at baseline and during intervention period, delivered by nephrology team Clinical protocols and agreed treatments and targets Three‐monthly reviews with practice nurses for 20 minutes followed by GP review Digital environment for communication between GPs and specialists Comparison: usual care |
|
| Outcomes |
Primary outcomes Systolic BP Secondary outcomes Diastolic BP 26 biophysical markers (3 related to weight and 2 related to renal function) WONCA functional health status Proportion smoking Medication prescribing |
|
| Notes | Study duration 12 months | |
| Risk of bias | ||
| Bias | Authors' judgement | Support for judgement |
| Random sequence generation (selection bias) | Unclear risk | Not reported |
| Allocation concealment (selection bias) | Low risk | 'Randomisation at practice level' |
| Baseline characteristics | Low risk | Reported and similar |
| Blinding of participants and personnel (performance bias) All outcomes | Unclear risk | Professionals aware in trial but not aware of which patients were participating |
| Blinding of outcome assessment (detection bias) All outcomes | Low risk | Done |
| Incomplete outcome data (attrition bias) All outcomes | Unclear risk | 91% follow‐up overall but imbalance between groups, with 86% in intervention group and 99% in control group having available data at study completion |
| Selective reporting (reporting bias) | Low risk | Outcomes in methods reported |
| Protection against contamination | Low risk | Contamination unlikely owing to design |
| Other bias | Low risk | |
Smith 2004.
| Methods | Cluster‐randomised controlled trial Ireland |
|
| Participants | Adults with type 2 diabetes identified by diabetes registers of participating general practices; mean age 65 years; 45% female; mean 6 years diagnosed; mean HbA1c 6.7%; 30 participating general practices (50 GPs), 43% single‐handed; 23% with practice nurse One specialist centre | |
| Interventions | Education for GPs and practice nurses (6‐week distance learning course and 3 skills sessions); community diabetes nurse to support practices and co‐ordinate care; locally agreed clinical and referral guidelines; 3‐monthly general practice reviews; annual specialist review generating individualised management plans; structured record care that moved between sectors; fast‐track re‐referral to specialist if indicated Comparison: usual care. 76% of participants undergoing annual specialist review; no structured GP care | |
| Outcomes |
Health outcomes
Primary outcomes HbA1c Secondary outcomes BP; cholesterol; BMI; diabetes well‐being scores; treatment satisfaction; smoking status Information exchange between sectors (shared care group only); default from care Process outcomes Measures of diabetes care delivery in specialist and GP clinics; recording of risk factors; numbers of specialist and GP visits; information exchange between sectors (shared care group only) Costs Direct costs (data from study author) |
|
| Notes | Study duration 18 months Good glycaemic control at baseline |
|
| Risk of bias | ||
| Bias | Authors' judgement | Support for judgement |
| Random sequence generation (selection bias) | Low risk | Random number table used by independent researcher |
| Allocation concealment (selection bias) | Low risk | Done (cluster allocation) |
| Baseline characteristics | Low risk | Reported and similar |
| Blinding of participants and personnel (performance bias) All outcomes | Low risk | Not possible owing to nature of the intervention but unlikely owing to design |
| Blinding of outcome assessment (detection bias) All outcomes | Low risk | Automated test |
| Incomplete outcome data (attrition bias) All outcomes | Low risk | 93% follow‐up |
| Selective reporting (reporting bias) | Low risk | Outcomes in methods reported |
| Protection against contamination | Low risk | Contamination unlikely owing to design |
| Other bias | Low risk | |
Smith 2008.
| Methods | Cluster‐randomised controlled trial USA |
|
| Participants | 639 patients with diabetes (93% type 2 diabetes) 97 physicians Endocrinologists (completed 1361 specialty reviews) |
|
| Interventions | Telemedicine (specialist reviewed EHR and sent messages regarding management of medications and cardiovascular risk, timed 48 hours before next patient primary care visit) Comparison: usual care with periodic generic emails about cardiovascular risk reduction |
|
| Outcomes | Diabetes care processes; metabolic and vascular risk factor control (HBA1c, BP and LDL cholesterol); cost of care | |
| Notes | Good glycaemic and BP control at baseline Study duration 30 months |
|
| Risk of bias | ||
| Bias | Authors' judgement | Support for judgement |
| Random sequence generation (selection bias) | Low risk | Computerised randomisation |
| Allocation concealment (selection bias) | Low risk | Conducted centrally, cluster design |
| Baseline characteristics | Low risk | Reported and similar |
| Blinding of participants and personnel (performance bias) All outcomes | Unclear risk | Not possible given nature of the intervention |
| Blinding of outcome assessment (detection bias) All outcomes | Low risk | Done |
| Incomplete outcome data (attrition bias) All outcomes | Low risk | 97% follow‐up physicians; 96% follow‐up participants |
| Selective reporting (reporting bias) | Low risk | Outcomes in methods reported |
| Protection against contamination | Low risk | Cluster‐randomisation and specific management plan to avoid potential contamination |
| Other bias | Low risk | |
Solberg 2015.
| Methods | Non‐randomised controlled trial (2 arms from stepped wedge evaluation) USA |
|
| Participants | 2348 patients with depression; mean age 44 years; 73% female 75 primary care clinics |
|
| Interventions | The DIAMOND model (adopted from the IMPACT (Improving Mood: Promoting Access to Collaborative Treatment) study) included 7 components: 1. Use of the 9‐item Patient Health Questionnaire (PHQ‐9) depression scale for monitoring depression severity 2. Systematic participant follow‐up tracking and monitoring 3. Treatment intensification for participants not improving 4. Relapse prevention planning for participants achieving remission 5. On‐site care manager for educating, monitoring and co‐ordinating care 6. Scheduled weekly caseload review with a consulting psychiatrist 7. Monthly descriptive data submissions Comparison: usual care |
|
| Outcomes |
Primary outcomes Depression severity (PHQ‐9) Secondary outcomes Care received, work productivity (Work Productivity and Activity Impairment, WPAI), health status, satisfaction |
|
| Notes | Study duration 5 years | |
| Risk of bias | ||
| Bias | Authors' judgement | Support for judgement |
| Random sequence generation (selection bias) | High risk | No randomisation (NRCT design) |
| Allocation concealment (selection bias) | High risk | No randomisation (NRCT design) |
| Baseline characteristics | Low risk | Reported and similar |
| Blinding of participants and personnel (performance bias) All outcomes | Unclear risk | All sites received intervention at different time points but all sites had intervention training. |
| Blinding of outcome assessment (detection bias) All outcomes | Unclear risk | Not reported |
| Incomplete outcome data (attrition bias) All outcomes | High risk | 67% follow‐up |
| Selective reporting (reporting bias) | Low risk | Outcomes in methods reported |
| Protection against contamination | High risk | Risk of contamination due to non‐randomised design. Control data from 6 months before but training ongoing during this time |
| Other bias | Low risk | |
Swindle 2003.
| Methods | Cluster‐randomised controlled trial USA |
|
| Participants | 268 veterans with ≥ 2 clinic visits in the past year, screening positive for depression based on the PRIME‐MD depression diagnosis; mean age 56 years; 96% male; 85% Caucasian; mean Beck Depression Inventory score 21 Primary care physicians (PCPs) from 2 Veterans Affairs medical centres Mental health specialists (psychiatrists and 10 clinical nurse specialists(CNSs)) | |
| Interventions | Individual treatment plans implemented by CNS and PCP; treatment monitoring through clinic visits and telephone calls; education and training for CNSs and PCPs; agreed treatment protocols; specialist psychiatrist available for discussion; administrative support with appointment reminders to CNSs Comparison: usual care; participants' depression scores placed in charts if depressed and CNS available through normal referral channels; education for PCPs |
|
| Outcomes |
Health outcomes
Beck Depression Inventory score; treatment satisfaction Process outcomes Quality of care indicators (recording of diagnosis of depression; change in antidepressant medication; referral to mental health specialists) Health service utilisation (assessed via computerised medical record system and including all clinic visits, pharmacy visits and laboratory tests) Costs Total direct healthcare costs (excluding salary costs of CNSs) |
|
| Notes | Study duration 1 year Analysis took account of clustering effect but power calculation did not. 40% of CNSs disagreed with PRIME‐MD depression diagnosis. | |
| Risk of bias | ||
| Bias | Authors' judgement | Support for judgement |
| Random sequence generation (selection bias) | Unclear risk | Cluster allocation by 'coin flip' |
| Allocation concealment (selection bias) | Low risk | Done, by cluster |
| Baseline characteristics | Low risk | Reported and similar |
| Blinding of participants and personnel (performance bias) All outcomes | Low risk | Not possible owing to nature of the intervention but bias unlikely owing to design |
| Blinding of outcome assessment (detection bias) All outcomes | Low risk | Done |
| Incomplete outcome data (attrition bias) All outcomes | Low risk | > 83% follow‐up |
| Selective reporting (reporting bias) | Low risk | Outcomes in methods reported |
| Protection against contamination | Low risk | Contamination unlikely owing to design |
| Other bias | Low risk | |
Unutzer 2002.
| Methods | Randomised controlled trial Data also from follow‐up study (Hunkeler et al 2006) USA |
|
| Participants | 1801 patients aged > 60 years with late‐life depression identified by depression screen; mean age 71 years; 65% female; 23% from ethnic minorities 324 primary care practitioners (PCPs) at 7 study sites representing 8 diverse healthcare organisations, with a total of 18 primary care clinics in 5 states of the USA Impact care managers (nurses or psychologists trained as depression clinical specialists (DCSs)) Supervising team psychiatrist and liaison primary care physician | |
| Interventions | IMPACT participant education (video and booklet); DCS initial visits generating treatment plans based on recommended algorithm in conjunction with participants' and PCPs' included choice of antidepressant medication or 6‐ to 8‐session course of brief psychotherapy; follow‐up visits or telephone calls at least 2‐weekly; weekly meetings between DCSs, supervising team psychiatrist and liaison primary care physician Comparison: usual care with PCPs; 3‐, 6‐ and 12‐month follow‐up visits | |
| Outcomes |
Health outcomes
SCL‐20 depression score; proportion with major depression and proportion with remission of depressive symptoms in relation to baseline scores; quality of life scores; treatment satisfaction; functional impairment Process outcomes Antidepressant use; intervention implementation Costs Direct mean healthcare costs of the intervention |
|
| Notes | Study duration 12 months. Additional follow‐up paper at 24 months |
|
| Risk of bias | ||
| Bias | Authors' judgement | Support for judgement |
| Random sequence generation (selection bias) | Low risk | Computer‐generated sequence |
| Allocation concealment (selection bias) | Low risk | Done |
| Baseline characteristics | Low risk | Reported and similar |
| Blinding of participants and personnel (performance bias) All outcomes | Unclear risk | Potential due to design |
| Blinding of outcome assessment (detection bias) All outcomes | Low risk | Done |
| Incomplete outcome data (attrition bias) All outcomes | Low risk | 83% follow‐up original study |
| Selective reporting (reporting bias) | Low risk | Outcomes in methods reported |
| Protection against contamination | Unclear risk | Protection against contamination unclear as same providers |
| Other bias | Low risk | |
Van Orden 2009.
| Methods | Cluster‐randomised controlled trial Netherlands |
|
| Participants | 165 adults with a mental health condition | |
| Interventions | Intervention: Mental healthcare professionals worked on‐site at PCP and were available to provide a maximum of 5 appointments if referred by GP (based on CBT). Team of psychiatrists met with GPs and mental healthcare professionals. If indicated, referral to specialised mental health services followed. Comparison: usual care; if indicated, GP would refer participants to off‐site specialised mental health services |
|
| Outcomes |
Health outcomes Psychopathology based on symptom checklist (SCL‐90) overall psychoneuroticism score Quality of life: WHOQOL‐BREF Process outcomes Participant satisfaction with mental health care received (Dutch mental healthcare thermometer of satisfaction) GP 4‐item Likert scale on satisfaction (time saving; workload relief; change in participants' complaints; change in participants' QOL) Delay in seeing a mental health provider Duration of treatment Number of appointments Costs Mean cost per participant |
|
| Notes | Study duration 12 months | |
| Risk of bias | ||
| Bias | Authors' judgement | Support for judgement |
| Random sequence generation (selection bias) | Unclear risk | Method not reported |
| Allocation concealment (selection bias) | Low risk | Allocation by cluster |
| Baseline characteristics | Low risk | Reported and similar |
| Blinding of participants and personnel (performance bias) All outcomes | Unclear risk | Not reported |
| Blinding of outcome assessment (detection bias) All outcomes | Unclear risk | Not reported |
| Incomplete outcome data (attrition bias) All outcomes | Low risk | 94% followed up |
| Selective reporting (reporting bias) | Low risk | Outcomes in methods reported |
| Protection against contamination | Low risk | Contamination unlikely owing to design |
| Other bias | Low risk | |
Vera 2010.
| Methods | Randomised controlled trial Puerto Rico |
|
| Participants | 179 patients with major depression and a chronic medical condition (e.g. diabetes, heart disease, stroke) | |
| Interventions | Participants provided with education about depression and a choice of antidepressants or CBT. Care manager (CM) monitored treatment adherence, side effects and clinical response. CM communicated with GP and mental health specialist on antidepressant options in weekly sessions scheduled with psychiatrist. Recommendations from psychiatrist forwarded to GP Comparison: usual care; participants informed of their diagnosis of depression and of mental health resources available to them through their insurance |
|
| Outcomes |
Health outcomes Depression ‐ change in depression symptoms as assessed by 20‐item depression scale (HSCL‐20). Response to treatment at 6 months ‐ ≥ 50% reduction in depression score Health‐related social functioning ‐ social functioning subscale of SF‐36 |
|
| Notes | Study duration 6 months | |
| Risk of bias | ||
| Bias | Authors' judgement | Support for judgement |
| Random sequence generation (selection bias) | Low risk | Computer random number sequence |
| Allocation concealment (selection bias) | Low risk | Computerised random allocation |
| Baseline characteristics | Low risk | Reported and similar |
| Blinding of participants and personnel (performance bias) All outcomes | Unclear risk | Not reported |
| Blinding of outcome assessment (detection bias) All outcomes | Low risk | Assessments administered at baseline and at 8, 16 and 24 months by interviewer blinded to intervention status |
| Incomplete outcome data (attrition bias) All outcomes | Low risk | 93% followed up at 24 weeks |
| Selective reporting (reporting bias) | Low risk | Outcomes in methods reported |
| Protection against contamination | Unclear risk | Possible owing to design |
| Other bias | Low risk | |
Warner 2000.
| Methods | Cluster‐randomised controlled trial UK |
|
| Participants | 90 patients with long‐term mental illness (42% schizophrenia; 23% depression; 12% bipolar disorder; 10% personality disorder) 1 specialist service (team includes psychiatrist, social worker and key worker) 28 general practices (median number of 4.5 partners) | |
| Interventions | Shared care record card (participant‐held) Comparison: usual care in both sectors | |
| Outcomes |
Health outcomes
Behaviour and Symptoms Identification Scale (BASIS‐32); Brief Psychiatric Rating Scale (BPRS); treatment satisfaction Process outcomes Hospital admissions; outpatient attendances; default rates |
|
| Notes | Study duration 12 months Almost none of the specialist psychiatrists were prepared to participate. Only 44% of intervention group participants used the shared care record card; data were available for only half of these. | |
| Risk of bias | ||
| Bias | Authors' judgement | Support for judgement |
| Random sequence generation (selection bias) | Low risk | Computer‐generated algorithm |
| Allocation concealment (selection bias) | Low risk | Done, by cluster |
| Baseline characteristics | Low risk | Reported and similar |
| Blinding of participants and personnel (performance bias) All outcomes | Low risk | Not possible owing to nature of the intervention but unlikely owing to design |
| Blinding of outcome assessment (detection bias) All outcomes | Unclear risk | Not reported |
| Incomplete outcome data (attrition bias) All outcomes | Low risk | All included in final data analysis |
| Selective reporting (reporting bias) | Low risk | Outcomes in methods reported |
| Protection against contamination | Low risk | Contamination unlikely owing to design |
| Other bias | Low risk | |
Wood 1994.
| Methods | Non‐randomised controlled trial New Zealand |
|
| Participants | 11 patients with chronic mental illness (71% schizophrenia; 18% bipolar disorder; 10% depression; 5% other); age range 20‐65; 37% female; 63% single; 63% with 5 previous admissions 4 general practices (9 GPs) volunteered to participate. Specialist psychiatric service in Dunedin, New Zealand, covering population of 100,000 people | |
| Interventions | Multi‐disciplinary case management team attached to each participating practice (psychiatrist, social worker and domiciliary nurse) with 1 acting as a key worker for each individual participant; weekly team meetings; monthly meetings between team and GPs (informal contact at least twice weekly) Comparison: participants attending psychiatry outpatients (and non‐study GPs) and individually matched to an experimental participant for diagnostic group, age, sex, marital status and number of previous admissions. Control participants continued to receive standard outpatient treatment. | |
| Outcomes | Process outcomes Inpatient admission days; time to first re‐admission 2 years before and 2 years after case management | |
| Notes | Study duration 2 years This paper reports preliminary results of effects of the intervention on hospital admissions and attendance only (we have not been able to locate a follow‐up paper with additional results). Analysis included only experimental and matched control participants completing intervention at end of 3 months. | |
| Risk of bias | ||
| Bias | Authors' judgement | Support for judgement |
| Random sequence generation (selection bias) | High risk | No randomisation |
| Allocation concealment (selection bias) | High risk | Design NRCT |
| Baseline characteristics | Low risk | Reported and similar |
| Blinding of participants and personnel (performance bias) All outcomes | Unclear risk | Not possible owing to nature of the design; may have introduced bias |
| Blinding of outcome assessment (detection bias) All outcomes | Low risk | Done |
| Incomplete outcome data (attrition bias) All outcomes | Low risk | 88% follow‐up |
| Selective reporting (reporting bias) | Low risk | Outcomes in methods reported |
| Protection against contamination | Unclear risk | Contamination possible owing to design although unlikely as large number of GPs involved |
| Other bias | Low risk | |
Abbreviations used in tables:
ACE: angiotensin‐converting enzyme.
ACR: albumin‐to‐creatinine excretion ratio.
ATP III: Adult Treatment Panel III.
BAI: Beck's Anxiety Inventory.
BASIS‐32: Behaviour and Symptoms Identification Scale‐32.
BDI: Beck's Depression Inventory.
BMI: body mass index.
BP: blood pressure.
BPRS: Brief Psychiatric Rating Scale.
CAU: care as usual.
CBT: cognitive‐behavioural therapy.
CC: collaborative care.
CDSS: computerised decision support systems.
CDT: Community Drug Team.
CHF: congestive heart failure.
CIDI: Composite International Diagnostic Interview.
CM: care manager.
CNS: clinical nurse specialist.
COPD: chronic obstructive pulmonary disease.
CSQ‐8: Client Satisfaction Questionnaire‐8.
CT: computed tomography.
CVA: cerebrovascular accident
DAS28‐CRP: Disease Activity Score based on C‐reactive protein.
DBP: diastolic blood pressure.
DCS: depression clinical specialist.
DSM‐5: Diagnostic and Statistical Manual of Mental Disorders, 5th edition.
DSM‐IV: Fourth Edition of the Diagnostic and Statistical Manual of Mental Disorders.
EHR: electronic health record.
EQ5D: EuroQoL Group Quality of Life Questionnaire.
GAD: generalised anxiety disorder.
GI: gastrointestinal.
GP: general practitioner.
HAD: Hospital Anxiety and Depression Scale.
HAQ: Health Assessment Questionnaire.
HbA1c: glycosylated haemoglobin.
HCN: home care nurse.
HDL: high‐density lipoprotein.
HDL‐C: high‐density lipoprotein cholesterol.
HF: heart failure.
HMO: health maintenance organisation.
HRQoL: health‐related quality of life.
HSCL‐20: Hopkins Symptom Checklist.
ICARUSS: Integrated Care for the Reduction of Secondary Stroke.
ICD‐10: International Classification of Diseases, 10th edition.
IMPACT: Improving Mood: Promoting Access to Collaborative Treatment study.
INR: international normalised ratio.
LDL: low‐density lipoprotein.
LDL‐C: low‐density lipoprotein cholesterol.
MMSE: Mini Mental State Examination.
NHS: National Health Service.
NPI: Neuropsychiatric Inventory.
NRCT: non‐randomised controlled trial.
NSAID: non‐steroidal anti‐inflammatory drug.
NYHA: New York Heart Association.
OASIS: Overall Anxiety Severity and Impairment Scale.
OAT: oral anticoagulation therapy.
PCP: primary care physician.
PD: panic disorder.
PEP: psychoeducational prevention programme.
PHCLW: primary healthcare liaison worker.
PHQ‐9: Patient Health Questionnaire‐9.
QOL: quality of life.
QWB: Quality of Well‐being
RA: research assistant.
RMDQ: Roland Morris Disability Questionnaire.
SAQ: Seattle Angina Questionnaire.
SBP: systolic blood pressure.
SCID: severe combined immunodeficiency.
SCL‐20: Symptom Checklist Depression Scale‐20.
SF‐12: Short Form‐12.
SF‐36: Short Form‐36.
TIA: transient ischaemic attack.
UC: usual care
VA: Veterans Administration.
VAS: visual analogue scale.
WHOQOL‐BREF: Short Version of World Health Organization Quality of Life Questionnaire.
WONCA: World Organization of National Colleges and Academies.
WPAI: Work Productivity and Activity Impairment.
WSAS: Work and Social Adjustment Scale.
Characteristics of excluded studies [ordered by study ID]
| Study | Reason for exclusion |
|---|---|
| Aragones 2014 | Not shared care by review definition |
| Aragones 2014(a) | Not shared care by review definition |
| Armstrong 2012 | Not shared care by review definition |
| Boland 2014 | Not shared care by review definition |
| Bruce 2015 | Not shared care by review definition |
| Bura 2007 | No appropriate data available to determine eligibility |
| Burian 2010 | No appropriate data available to determine eligibility |
| Callahan 2012 | Not shared care by review definition |
| Casa 2012 | No appropriate data available to determine eligibility |
| Casas 2012 | Not shared care by review definition |
| Chan 2014 | Not shared care by review definition |
| Chaney 2011 | Not shared care by review definition |
| Chao 2015 | Not shared care by review definition |
| Curran 2011 | Not shared care by review definition |
| Davies 2014 | Not shared care by review definition |
| Ell 2010 | Not shared care by review definition |
| Ell 2011 | Not shared care by review definition |
| Ell 2014 | Not shared care by review definition |
| Emery 2014 | Not shared care by review definition |
| Engel 2014 | Ineligible setting |
| Fortney 2015 | Ineligible setting |
| Garcia‐Aymerich 2007 | Not shared care by review definition |
| Gerritsen 2014 | Not shared care by review definition |
| Graham 2014 | Ineligible setting |
| Green 2014 | Not shared care by review definition |
| Gureje 2015 | Not shared care by review definition |
| Haggarty 2008 | No appropriate data available to determine eligibility (despite email to study author) |
| Haggarty J 2008 | No appropriate data available to determine eligibility (despite email to study author) |
| Hernandez 2015 | Not shared care by review definition |
| Ho 2008 | Not shared care by review definition |
| Ho 2012 | Not shared care by review definition |
| ISRCTN 2015 | Not shared care by review definition |
| Jannik Buus Bertelsen 2014 | Not shared care by review definition |
| Jiamjariyaporn 2014 | Not shared care by review definition |
| Ko 2014 | Not shared care by review definition |
| Koike 2002 | Randomised controlled trial of quality improvement programme for care for depression in patients with comorbid conditions. Study author indicated that shared care review criteria not fulfilled |
| Kroenke 2014 | Not shared care by review definition |
| Kruis 2015 | Not shared care by review definition |
| Lester 2003 | Randomised controlled trial of patient‐held record for people with schizophrenia receiving shared care. Study author indicated that all intervention and control participants received shared care and only patient‐held record card was evaluated. |
| Liu 2010 | Not shared care by review definition |
| Meese 1997 | Randomised controlled trial of effect of patient‐held record on communication with general practitioners among patients with human immunodeficiency virus (HIV). Inappropriate analysis for randomised controlled trial: patients analysed as treated rather than as randomised |
| Mills 2003 | Study author indicated that intervention was designed to improve service delivery processes, reduce costs and reduce duplication of work in each sector. It was not specifically a shared care intervention across the primary/specialty care interface. |
| Ober 2014 | Not shared care by review definition |
| Peter Ray Byrne 2010 | Not shared care by review definition |
| Peterson 2014 | Not shared care by review definition |
| Richman 1996 | Shared care approach for obesity. Intervention was focused primarily on specialist management with no clear role for general practitioners (GPs). |
| Rojas 2014 | Not shared care by review definition |
| Schapira 2010 | No appropriate data available to determine eligibility |
| Schouten 2010 | Ineligible design (economic analysis of ineligible study) |
| Seekles 2009 | Not shared care between general practitioners and specialists by review definition |
| Sharpe 2014 | Not shared care by review definition |
| Siaw 2015 | Ineligible setting |
| Srinivasan 2002 | No available data to determine eligibility |
| Stewart 1999 | Randomised controlled trial of home‐based intervention to improve outcomes in patients with congestive cardiac failure. Limited general practitioner (GP) involvement with no collection of data related to GP component of care |
| Stewart 2011 | Not shared care by review definition |
| van Gils 2012 | Specialist setting |
| Wang 2010 | No data available (despite email to study author) |
| Wells 2000 | Randomised controlled trial of quality improvement programme for depression in managed primary care. Study author indicated that intervention did not fulfil shared care criteria of review. |
| Wootton 2009 | Not shared care by review definition |
| Zhang 2013 | Not shared care by review definition |
| Zwar 2008 | Not shared care by review definition |
Characteristics of ongoing studies [ordered by study ID]
Furler 2014.
| Trial name or title | Stepping Up to Insulin Trial |
| Methods | Cluster randomised controlled trial (RCT) |
| Participants | 224 adults with type 2 diabetes |
| Interventions | Stepping Up Program to enhance the role of the general practitioner (GP)‐practice nurse (PN) team in initiating insulin and improving glycaemic outcomes for people with type 2 diabetes |
| Outcomes | Glycosylated haemoglobin (HbA1c) |
| Starting date | 2014 |
| Contact information | j.furler@unimelb.edu.au |
| Notes |
Differences between protocol and review
Two new review authors joined the team for the current update. Otherwise, we made no substantial changes to review methods since the original 2007 review (Smith 2007). For this review update, we amended the title to use the term 'long term conditions' as opposed to chronic conditions. We added a 'Summary of findings' table and revised the description of outcomes in the Methods section to ensure consistency in reporting of outcomes throughout the review. Although we searched the grey literature for the original review, we did not do so for this update. In addition, we edited outcome measures as presented in the Methods to ensure consistency across the review.
Contributions of authors
All review authors contributed to planning of this review and writing of the protocol.
Susan Smith screened records for eligibility. Susan Smith, Gráinne Cousins, Barbara Clyne, Shane Allwright and Tom O'Dowd considered studies for inclusion and extracted study data. Susan Smith wrote the main draft of the review. Gráinne Cousins, Barbara Clyne, Shane Allwright and Tom O'Dowd assisted in writing drafts of the review.
Sources of support
Internal sources
No sources of support supplied
External sources
S. Smith: Cochrane Fellowship 2003 to 2004, Ireland.
Health Research Board, Ireland.
Declarations of interest
Susan Smith has been involved in developing diabetes shared care services in Irish general practice but has not been active in primary research on shared care for over 13 years.
Gráinne Cousins, Barbara Clyne, Shane Allwright and Tom O'Dowd declare that they have no conflicts of interest.
New search for studies and content updated (conclusions changed)
References
References to studies included in this review
Byng 2004 {published data only}
- Byng R, Jones R, Leese M, Hamilton B, McCrone P, Craig T. Exploratory cluster randomised controlled trial of shared care development for long‐term mental illness. British Journal of General Practice 2004;54:259‐66. [PMC free article] [PubMed] [Google Scholar]
Callahan 2006 {published data only}
- Callahan C, Boustani MA, Unverzagt FW, Austrom MG, Damush TD, Perkins AJ, et al. Effectiveness of collaborative care for older adults with Alzheimer disease in primary care. A randomized controlled trial. JAMA 2006;295(18):2148‐57. [DOI] [PubMed] [Google Scholar]
Chew‐Graham 2007 {published data only}
- Chew‐Graham CA, Lovell K, Roberts C, Baldwin R, Morley M, Burns A, et al. A randomised controlled trial to test the feasibility of a collaborative care model for the management of depression in older people. British Journal of General Practice 2007;57:364‐70. [PMC free article] [PubMed] [Google Scholar]
Conradi 2007 {published data only}
- Conradi HJ, Jonge P, Kluiter H, Smit A, Meer K, Jenner JA, et al. Enhanced treatment for depression in primary care: long‐term outcomes of a psycho‐educational prevention program alone and enriched with psychiatric consultation or cognitive behavioral therapy. Psychological Medicine 2007;37:849‐62. [DOI] [PubMed] [Google Scholar]
Dendale 2012 {published data only}
- Dendale P, Keulenaer G, Troisfontaines P, Weytjens C, Mullens W, Elegeert I, et al. Effect of a telemonitoring‐facilitated collaboration between general practitioner and heart failure clinic on mortality and rehospitalization rates in severe heart failure: the TEMA‐HF1 (TElemonitoring in the MAnagement of Heart Failure) study. European Journal of Heart Failure 2012;14:333‐40. [DOI] [PubMed] [Google Scholar]
Dey 2002 {published data only}
- Dey P, Roaf E, Collins S, Shaw H, Steele R, Donmall M. Randomized controlled trial to assess the effectiveness of a primary health care liaison worker in promoting shared care for opiate users. Journal of Public Health Medicine 2002;24(1):38‐42. [DOI] [PubMed] [Google Scholar]
DICE 1994 {published data only}
- Diabetes Integrated Care Evaluation Team. Integrated care for diabetes: clinical, psychosocial, and economic evaluation. BMJ 1994;308:1208‐12. [PMC free article] [PubMed] [Google Scholar]
Dobscha 2009 {published data only}
- Dobscha SK, Corson K, Perrin NA, Hanson GC, Leibowitz RQ, Doak MN, et al. Collaborative care for chronic pain in primary care: a cluster randomized trial. JAMA 2009;301(12):1242‐52. [DOI] [PubMed] [Google Scholar]
Donohoe 2000 {published data only}
- Donohoe ME, Fletton JA, Hook A, Powell R, Robinson I, Stead JW, et al. Improving foot care for people with diabetes mellitus ‐ A randomized controlled trial of an integrated care approach. Diabetic Medicine 2000;17(8):581‐7. [DOI] [PubMed] [Google Scholar]
Doughty 2002 {published data only}
- Doughty RN, Wright SP, Pearl A, Walsh HJ, Muncaster S, Whalley GA, et al. Randomized controlled trial of integrated heart failure management: the Auckland Heart Failure Management Study. [see comment]. European Heart Journal 2002;23(2):139‐46. [DOI] [PubMed] [Google Scholar]
Drummond 1994 {published data only}
- Drummond N, Abdalla M, Buckingham JK, Beattie JAG, LIndsay T, Osmann LM, et al. Integrated care for asthma: a clinical, social, and economic evaluation. BMJ 1994;308:559‐64. [PMC free article] [PubMed] [Google Scholar]
Duran 2008 {published data only}
- Duran A, Runkle I, Matia P, Miguel MP, Garrido S, Cervera E, et al. Family physician and endocrinologist coordination as the basis for diabetes care in clinical practice. BMC Endocrine Disorders 2008;8(9):1‐9. [DOI] [PMC free article] [PubMed] [Google Scholar]
Fihn 2011 {published data only}
- Fihn SD, Bucher JB, McDonell M, Diehr P, Rumsfeld JS, Doak M, et al. Collaborative care intervention for stable ischemic heart disease. Archives of Internal Medicine 2011;171(16):1471‐9. [DOI] [PubMed] [Google Scholar]
Fortney 2007 {published data only}
- Fortney JC, Pyne JM, Edlund MJ, Williams DK, Robinson DE, Mittal D. A randomized trial of telemedicine‐based collaborative care for depression. Journal of General Internal Medicine 2007;22(8):1086‐93. [DOI] [PMC free article] [PubMed] [Google Scholar]
Goderis 2010 {published data only}
- Goderis G, Borgermans L, Grol R, Broeke C, Boland B, Verbeke G, et al. Start improving the quality of care for people with type 2 diabetes through a general practice support program: a cluster randomized trial. Diabetes Research and Clinical Practice 2010;1:56‐64. [DOI] [PubMed] [Google Scholar]
Holm 2002 {published data only}
- Holm T, Lassen JF, Husted SE, Christensen P, Heickendorff L. A randomized controlled trial of shared care versus routine care for patients receiving oral anticoagulant therapy. Journal of Internal Medicine 2002;252(4):322‐31. [DOI] [PubMed] [Google Scholar]
Hoskins 1992 {published data only}
- Hoskins PL, Fowler PM, Constantino M, Forrest J, Yue DK, Turtle JR. Sharing the care of diabetic patients between hospital and general practitioners: does it work?. Diabetic Medicine 1993;10(1):81‐6. [DOI] [PubMed] [Google Scholar]
Huijbregts 2013 {published data only}
- Huijbregts KML, Jong FJ, Marwijk HWJ, Beekman ATF, Ader HJ, Hakkaart‐van Roijen L, et al. A target‐driven collaborative care model for major depressive disorder is effective in primary care in the Netherlands. A randomized clinical trial from the Depression Initiative. Journal of Affective Disorders 2013;146:328‐37. [DOI] [PubMed] [Google Scholar]
Johannson 2001 {published data only}
- Johannson B, Holmberg L, Berglund G, Brandberg Y, Hellborn M, Persson C, et al. Reduced utilisation of specialist care among elderly cancer patients: a randomised study of a primary care intervention. European Journal of Cancer Care 2001;37(17):2161‐8. [DOI] [PubMed] [Google Scholar]
Joubert 2009 {published data only}
- Joubert J, Reid C, Barton D, Cumming T, McLean A, Joubert L, et al. Integrated care improve risk‐factor modification after stroke: initial results of the Integrated Care for the Reduction of Secondary Stroke model. Journal of Neurology Neurosurgery and Psychiatry 2009;80:279‐84. [DOI] [PubMed] [Google Scholar]
Katon 1999 {published data only}
- Katon W, Korff M, Lin E, Simon G, Walker E, Unutzer J, et al. Stepped collaborative care for primary care patients with persistent symptoms of depression: a randomized trial. Archives of General Psychiatry 1999;56(12):1109‐15. [DOI] [PubMed] [Google Scholar]
Katon 2001 {published data only}
- Katon W, Rutter C, Ludman EJ, Korff M, Lin E, Simon G, et al. A randomized trial of relapse prevention of depression in primary care. Archives of General Psychiatry 2001;58(3):241‐7. [DOI] [PubMed] [Google Scholar]
Katon 2004 {published data only}
- Katon W, Korff M, Lin E, Simon G, Ludman E, Russo J, et al. The Pathways study: a randomized controlled trial of collaborative care in patients with diabetes and depression. Archives of General Psychiatry 2004;61:1042‐9. [DOI] [PubMed] [Google Scholar]
Katon 2010 {published data only}
- Katon W, Lin EHB, Korff M, Ciechanowski P, Ludman E, Young B, et al. Collaborative care for patients with depression and chronic illnesses. New England Journal of Medicine 2010;363:2611‐20. [DOI] [PMC free article] [PubMed] [Google Scholar]
Llewelyn‐Jones 1999 {published data only}
- Llewellyn‐Jones RH, Baikie KA, Smithers H, Cohen J, Snowdon J, Tennant CC. Multifaceted shared care intervention for late life depression in residential care: randomised controlled trial. [see comment]. British Medical Journal 1999;319(7211):676‐82. [DOI] [PMC free article] [PubMed] [Google Scholar]
McGhee 1994 {published data only}
- McGhee SM, McInnes GT, Hedley AJ, Murray TS, Reid JL. Co‐ordinating and standardizing long‐term care: evaluation of the west of Scotland shared‐care scheme for hypertension. British Journal of General Practice 1994;44(387):441‐5. [PMC free article] [PubMed] [Google Scholar]
Menchetti 2013 {published data only}
- Menchetti M, Sighinolfi C, MIchele V, Pelosa P, Nespaca S, Bandieri PV, et al. Effectiveness of collaborative care for depression in Italy. A randomised controlled trial. General Hospital Psychiatry 2013;35:579‐86. [DOI] [PubMed] [Google Scholar]
Meulepas 2007 {published data only}
- Muelepas MS, Jacobs JE, Smeenk FWJM, Smeele I, Lucas AEM, Bottema BJAM, et al. Effect of an integrated primary care model on the management of middle‐aged and old patients with obstructive lung diseases. Scandinavian Journal of Primary Health Care 2007;25:186‐92. [DOI] [PMC free article] [PubMed] [Google Scholar]
Muntingh 2013 {published data only}
- Muntingh A, Feltz‐Cornelis C, Marwijk H, Spinhoven P, Assendelft W, Waal M, et al. Effectiveness of collaborative stepped care for anxiety disorders in primary care: a pragmatic cluster randomised controlled trial. Psychotherapy and Psychosomatics 2013;83:37‐44. [DOI] [PubMed] [Google Scholar]
Primdahl 2014 {published data only}
- Primdahl J, Sorensen J, Horn HC, Petersen R, Horslev‐Petersen K. Shared care or nursing consultations as an alternative to rheumatologist follow up for rheumatoid arthritis outpatients with low disease activity ‐ patient outcomes from a 2‐year randomised controlled trial. Clinical and Epidemiological Research 2014;73:357‐64. [DOI] [PubMed] [Google Scholar]
Rea 2004 {published data only}
- Rea H, McAuley S, Stewart A, Lamont C, Roseman P, Didsbury P. A chronic disease managment programme can reduce days in hospital for patients with chronic obstructive pulmonary disease. Internal Medicine Journal 2004;34:608‐14. [DOI] [PubMed] [Google Scholar]
Richards 2008 {published data only}
- Richards DA, Hill JJ, Gask L, Lovell K, Chew‐Graham C, Bower P, et al. Clinical effectiveness of collaborative care for depression in UK primary care (CADET): cluster randomised controlled trial. BMJ 2013;347:f4913. [DOI] [PMC free article] [PubMed] [Google Scholar]
Scherpbier‐de Haan 2013 {published data only}
- Scherpbier‐de Haan ND, Vervoort GM, Van WC, Braspenning JC, Mulder J, Wetzels JF, et al. Effect of shared care on blood pressure in patients with chronic kidney disease: a cluster randomised controlled trial. British Journal of General Practice 2013;63(617):e798‐e806. [DOI] [PMC free article] [PubMed] [Google Scholar]
Smith 2004 {published and unpublished data}
- Smith SM, Bury G, O'Leary M, Shannon W, Tynan A, Staines A, et al. The North Dublin randomized controlled trial of structural diabetes shared care. Family Practice 2004;21(1):39‐45. [DOI] [PubMed] [Google Scholar]
Smith 2008 {published data only}
- Smith SA, Shah ND, Bryant SC, Christianson TJH, Bjornsen SS, Giesler PD, et al. Chronic care model and shared care in diabetes: randomized trial of an electronic decision support system. Mayo Clinic Proceedings 2008;83(7):747‐57. [DOI] [PubMed] [Google Scholar]
Solberg 2015 {published data only}
- Solberg LI, Crain AL, Maciosek MV, Unützer J, Ohnsorg KA, Beck A, et al. A stepped‐wedge evaluation of an initiative to spread the collaborative care model for depression in primary care. Annals of Family Medicine 2015;13(5):412‐20. [DOI] [PMC free article] [PubMed] [Google Scholar]
Swindle 2003 {published data only}
- Swindle RW, Rao JK. Helmy A, Plue L, Zhou XH, Eckert GJ, et al. Integrating clinical nurse specialists into the treatment of primary care patients with depression. International Journal of Psychiatry in Medicine 2003;33(1):17‐37. [DOI] [PubMed] [Google Scholar]
Unutzer 2002 {published data only}
- Unutzer J, Katon W, Callahan CM, Williams JW Jr, Hunkeler E, Harpole L, et al. Collaborative care management of late‐life depression in the primary care setting: a randomized controlled trial. Journal of American Medical Association 2002;288(22):2836‐45. [DOI] [PubMed] [Google Scholar]
Van Orden 2009 {published data only}
- Orden M, Hoffman T, Haffmans J, Spinhoven P, Hoencamp E. Collaborative mental health care versus care as usual in a primary care setting: a randomised controlled trial. Psychiatric Services 2009;60:74‐9. [DOI] [PubMed] [Google Scholar]
Vera 2010 {published data only}
- Vera M, Perez‐Pedrogo C, Huertas SE, Reyes‐Rabanillo ML, Juarbe D, Huertas A, et al. Collaborative care for depressed patients with chronic medical conditions: a randomized trial in Puerto Rico. Psychiatric Services 2010;61(2):144‐50. [DOI] [PMC free article] [PubMed] [Google Scholar]
Warner 2000 {published data only}
- Warner JP, King M, Blizard R, McClenahan Z, Tang S. Patient‐held shared care records for individuals with mental illness: randomised controlled evaluation. British Journal of Psychiatry 2000;177:319‐24. [DOI] [PubMed] [Google Scholar]
Wood 1994 {published data only}
- Wood K, Anderson J. The effect on hospital admissions of psychiatric case management involving general practitioners: preliminary results. Australian and New Zealand Journal of Psychiatry 1995;29(2):223‐9. [DOI] [PubMed] [Google Scholar]
References to studies excluded from this review
Aragones 2014 {published data only}
- Aragones E, Caballero A, Pinol JL, Lopez‐Cortacans G. Persistence in the long term of the effects of a collaborative care programme for depression in primary care. Journal of Affective Disorders 2014;166:36‐40. [DOI] [PubMed] [Google Scholar]
Aragones 2014(a) {published data only}
- Aragones E, Lopez‐Cortacans G, Sanchez‐Iriso E, Pinol JL, Caballero A, Salvador‐Carulla L, et al. Cost‐effectiveness analysis of a collaborative care programme for depression in primary care. Journal of Affective Disorders 2014;159:85‐93. [DOI] [PubMed] [Google Scholar]
Armstrong 2012 {published data only}
- Armstrong N, Baines D, Baker R, Crossman R, Davies M, Hardy A, et al. A cluster randomized controlled trial of the effectiveness and cost‐effectiveness of intermediate care clinics for diabetes (ICCD): study protocol for a randomized controlled trial. Trials 2012;13:164. [DOI] [PMC free article] [PubMed] [Google Scholar]
Boland 2014 {published data only}
- Boland M, Kruis A, Tsiachristas A, Assendelft W, Gusselkoo J, Blom C. Cost‐effectiveness of an integrated care program for COPD: the RECODE cluster randomized trial [Abstract]. European Respiratory Journal 2014;44(Suppl 58):1980. [Google Scholar]
Bruce 2015 {published data only}
- Bruce ML, Raue PJ, Reilly CF, Greenberg RL, Meyers BS, Banerjee S, et al. Clinical effectiveness of integrating depression care management into Medicare home health: the Depression CAREPATH randomized trial. JAMA Internal Medicine 2015;175:55‐64. [DOI] [PMC free article] [PubMed] [Google Scholar]
Bura 2007 {published data only}
- Bura A, Mismetti P, Quenet S, Cambus J, Boccalon H. Anticoagulant clinics‐based shared‐care versus general practitioners management of oral anticoagulants: a prospective, randomised, controlled study. XXIst Congress of the International Society on Thrombosis and Haemostasis. 2007.
Burian 2010 {published data only}
- Burian R, Lehmann D, Barrett B, Diefenbacher A. Cooperation between C/L psychiatrists in a general hospital and general practitioners in private practice. Journal of Psychosomatic Research. Conference: 13th Annual Meeting of the European Association for Consultation‐Liaison Psychiatry and Psychosomatics. 2010.
Callahan 2012 {published data only}
- Callahan CM, Boustani MA, Schmid AA, Austrom MG, Miller DK, Gao S, et al. Alzheimer's disease multiple intervention trial (ADMIT): study protocol for a randomized controlled clinical trial. Trials [Electronic Resource] 2012;13:92. [DOI] [PMC free article] [PubMed] [Google Scholar]
Casa 2012 {published data only}
- Casa A, Troosters T, Roca J, Hernnadez C, Garcia J, Anto JM. Integrated care reduces hospitalization in COPD patients. European Respiratory Journal 2012;22:45. [Google Scholar]
Casas 2012 {published data only}
- Casas MF. Integrated care of chronic obstructive pulmonary disease exacerbations: primary care and specialised care working together. Semergen Sociedad Espanola de Medicina Rural y Generalista 2012;38(6):345‐7. [DOI] [PubMed] [Google Scholar]
Chan 2014 {published data only}
- Chan JCN, Jia W, Li W, Guo X, Zhang Y, Li X, et al. The effects of a web‐based integrated care program with or without a nurse coordinator on cardiometabolic control in type 2 diabetes ‐ the Chinajade (Joint Asia Diabetes Evaluation) program. Diabetes 2014;63:A301. [Google Scholar]
Chaney 2011 {published data only}
- Chaney EF, Rubenstein LV, Liu CF, Yano EM, Bolkan C, Lee M, et al. Implementing collaborative care for depression treatment in primary care: a cluster randomized evaluation of a quality improvement practice redesign. Implementation Science 2011;6:121. [DOI] [PMC free article] [PubMed] [Google Scholar]
Chao 2015 {published data only}
- Chao J, Yang L, Xu H, Yu Q, Jiang L, Zong M. The effect of integrated health management model on the health of older adults with diabetes in a randomized controlled trial. Archives of Gerontology and Geriatrics 2015;60(1):82‐8. [DOI] [PubMed] [Google Scholar]
Curran 2011 {published data only}
- Curran GM, Pyne J, Fortney JC, Gifford A, Asch SM, Rimland D, et al. Development and implementation of collaborative care for depression in HIV clinics. AIDS Care 2011;23(12):1626‐36. [DOI] [PubMed] [Google Scholar]
Davies 2014 {published data only}
- Davies LM, Fargher EA, Tricker K, Dawes P, Scott DL, Symmons D. Is shared care with annual hospital review better value for money than predominantly hospital‐based care in patients with established stable rheumatoid arthritis?. Annals of the Rheumatic Diseases 2014;66(5):658‐63. [DOI] [PMC free article] [PubMed] [Google Scholar]
Ell 2010 {published data only}
- Ell K, Katon W, Xie B, Lee PJ, Kapetanovic S, Guterman J, et al. Collaborative care management of major depression among low‐income, predominantly Hispanic subjects with diabetes: a randomized controlled trial. Diabetes Care. 2010;33(4):706‐13. [DOI] [PMC free article] [PubMed] [Google Scholar]
Ell 2011 {published data only}
- Ell K, Katon W, Xie B, Lee PJ, Kapetanovic S, Guterman J, et al. One‐year postcollaborative depression care trial outcomes among predominantly Hispanic diabetes safety net patients. General Hospital Psychiatry 2011;33(5):436‐42. [DOI] [PMC free article] [PubMed] [Google Scholar]
Ell 2014 {published data only}
- Ell K, Oh H, Lee PJ, Guterman J. Collaborative health literate depression care among predominantly Hispanic patients with coronary heart disease in safety net care. Psychosomatics 2014;55(6):555‐65. [DOI] [PubMed] [Google Scholar]
Emery 2014 {published data only}
- Emery J, Schofield P, Jefford M, King M, Pirotta M, Hayne D, et al. The Procare trial: a phase II randomised controlled trial of shared care for follow‐up of men with prostate cancer. Asia‐Pacific Journal of Clinical Oncology 2014;10:157. [Google Scholar]
Engel 2014 {published data only}
- Engel CC, Bray RM, Jaycox LH, Freed MC, Zatzick D, Lane ME, et al. Implementing collaborative primary care for depression and post traumatic stress disorder: design and sample for a randomized trial in the U.S. military health system. Contemporary Clinical Trials 2014;39(2):310‐9. [DOI] [PubMed] [Google Scholar]
Fortney 2015 {published data only}
- Fortney JC, Pyne JM, Kimbrell TA, Hudson TJ, Robinson DE, Schneider R, et al. Telemedicine‐based collaborative care for post traumatic stress disorder: a randomized clinical trial. JAMA Psychiatry 2015;72(1):58‐67. [DOI] [PubMed] [Google Scholar]
Garcia‐Aymerich 2007 {published data only}
- Garcia‐Aymerich J, Hernandez C, Alonso A, Casas A, Rodriguez‐Roisin R, Anto JM, et al. Effects of an integrated care intervention on risk factors of COPD readmission. Respiratory Medicine 2007;101(7):1462‐9. [DOI] [PubMed] [Google Scholar]
Gerritsen 2014 {published data only}
- Gerritsen DL, Leontjevas R, Smalbrugge M, Vernooij‐Dassen M, Koopmans RTCM. Act in case of depression: a care program for reducing depression in nursing homes. European Geriatric Medicine 2014;5:S3‐S4. [Google Scholar]
Graham 2014 {published data only}
- Graham L, West C, Bauer D. Faculty development focused on team‐based collaborative care. Education 2014;25(4):227‐9. [PubMed] [Google Scholar]
Green 2014 {published data only}
- Green C, Richards DA, Hill JJ, Gask L, Lovell K, Chew‐Graham C, et al. Cost‐effectiveness of collaborative care for depression in UK primary care: economic evaluation of a randomised controlled trial (CADET). PLoS ONE 2014;9(8):e104225. [DOI] [PMC free article] [PubMed] [Google Scholar]
Gureje 2015 {published data only}
- Gureje O, Oladeji BD, Araya R, Montgomery AA. A cluster randomized clinical trial of a stepped care intervention for depression in primary care (STEPCARE) ‐ study protocol. BMC Psychiatry 2015;15:1. [DOI] [PMC free article] [PubMed] [Google Scholar]
Haggarty 2008 {published data only}
- Haggarty J, Haslam D, Houlding C, Armstrong D. Clinical findings of a cluster randomised control pilot trial of a Canadian shared care service for those with chronic mental illness. Primary Care and Community Psychiatry 2008;13(1):19‐25. [Google Scholar]
Haggarty J 2008 {published data only}
- Haggarty J, Klein R, Chaudhuri B, Boudreau D, McKinnon T. After shared care: patients' symptoms and functioning 3 to 6 months following care at a rural shared mental health care clinic. Canadian Journal of Community Mental Health 2008;27(4):47‐54. [Google Scholar]
Hernandez 2015 {published data only}
- Hernandez C, Alonso A, Garcia‐Aymerich J, Serra I, Marti D, Rodriguez‐Roisin R, et al. Effectiveness of community‐based integrated care in frail COPD patients: a randomised controlled trial. NPJ Primary Care Respiratory Medicine 2015;25:15022. [DOI] [PMC free article] [PubMed] [Google Scholar]
Ho 2008 {published data only}
- Ho SB, Groessl EJ, Brau N, Cheung RC, Weingart KR, Ward MA. Prospective multisite randomized trial of integrated care (IC) vs. usual care (UC) for improving access to antiviral therapy for high risk patients with chronic HCV. Journal of Hepatology 2008;56:S386. [Google Scholar]
Ho 2012 {published data only}
- Ho SB, Groessl EJ, Brau N, Cheung R, Weingart KR, Ward M. Multisite randomized trial of an integrated care (IC) model for HCV patients with psychiatric and substance use co‐morbidities: final results of impact on treatment initiation. Hepatology 2012; Conference: 63rd Annual Meeting of the American Association for the Study of Liver Diseases: The Liver Meeting 2012, Boston, MA, United States. 2012:56‐1001.
ISRCTN 2015 {published data only}
- ISRCTN. Clinical and cost effectiveness of short‐term integrated palliative care services to optimise care for people with advanced long‐term neurological conditions. ISRCTN 2015:[http://isrctncom/ISRCTN18337380].
Jannik Buus Bertelsen 2014 {published data only}
- Jannik Buus Bertelsen JB, Kanstrup H, Qvist I, Refsgaard J, Johnsen SP, Christensen B, et al. Does care sharing early after acute coronary syndrome between hospital, general practice and municipality improve attendance and outcome?. European Journal of Preventive Cardiology 2014;21(1 Suppl 1):S33. [Google Scholar]
Jiamjariyaporn 2014 {published data only}
- Jiamjariyaporn T, Ingsathit A, Tungsanga K, Banchuin C, Vipattawat K, Kanchanakorn S, et al. Effectiveness of integrated care on delaying chronic kidney disease progression in rural communities of Thailand (ESCORT study): rationale and design of the study. BMC Nephrology 2014;15:99. [DOI] [PMC free article] [PubMed] [Google Scholar]
Ko 2014 {published data only}
- Ko GT, Yeung CY, Leung WY, Chan KW, Chung CH, Fung LM, et al. Cost implication of team‐based structured versus usual care for type 2 diabetic patients with chronic renal disease. Hong Kong Medical Journal 2014;17(6):9‐12. [PubMed] [Google Scholar]
Koike 2002 {published data only}
- Koike AK, Unützer J, Wells KB. Improving the care for depression in patients with comorbid medical illness. [Erratum appears in Am J Psychiatry 2003 Jan;160(1):204]. American Journal of Psychiatry 2002;159(10):1738‐45. [DOI] [PubMed] [Google Scholar]
Kroenke 2014 {published data only}
- Kroenke K, Krebs EE, Wu J, Yu Z, Chumbler NR, Bair MJ. Telecare collaborative management of chronic pain in primary care: a randomized clinical trial. Journal of the American Medical Association 2014;312(3):240‐8. [DOI] [PubMed] [Google Scholar]
Kruis 2015 {published data only}
- Kruis AL, Boland MR, Assendelft WJ, Gussekloo J, Tsiachristas A, Stijnen T, et al. Effectiveness of integrated disease management for primary care chronic obstructive pulmonary disease patients: results of cluster randomised trial. British Medical Journal 2014;349:g5392. [DOI] [PMC free article] [PubMed] [Google Scholar]
Lester 2003 {published data only}
- Lester H, Allan T, Wilson S, Jowett S, Roberts L. A cluster randomised controlled trial of patient‐held medical records for people with schizophrenia receiving shared care. British Journal of General Practice 2003;53(448):197‐203. [PMC free article] [PubMed] [Google Scholar]
Liu 2010 {published data only}
- Liu SI, Huang HC, Huang CR. RCT of collaborative care for depression in primary care in Taiwan. International Journal of Neuropsychophamracology. 2012.
Meese 1997 {published data only}
- Meese P, Vujovic O, Fairley C. Randomised trial of a patient held record on the communication with general practitioners in patients with HIV infection. Venereology 1997;10(4):226‐7. [Google Scholar]
Mills 2003 {published data only}
- Mills PD, Harvey PW. Beyond community based diabetes management and the COAG co‐ordinated care trial. Australian Journal of Rural Health 2003;11(3):131‐7. [PubMed] [Google Scholar]
Ober 2014 {published data only}
- Ober AJ, Watkins KE, Hunter SB, Lamp K, Lind M, Setodji CM. An organizational readiness intervention and randomized controlled trial to test strategies for implementing substance use disorder treatment into primary care: SUMMIT study protocol. Implementation Science 2015;10:66. [DOI] [PMC free article] [PubMed] [Google Scholar]
Peter Ray Byrne 2010 {published data only}
- Ray Byrne P, Craske MG, Sullivan G, Rose RD, Edlund MJ, Lang AJ, et al. Delivery of evidence‐based treatment for multiple anxiety disorders in primary care. Journal of the American Medical Association 2010;303(19):1921‐8. [DOI] [PMC free article] [PubMed] [Google Scholar]
Peterson 2014 {published data only}
- Peterson JJ, Konig J, Paulitsch MA, Mergenthal K, Rauck S, Pagitz M, et al. Long‐term effects of a collaborative care intervention on process of care in family practices in Germany: a 24‐month follow up study of a cluster randomized controlled trial. General Hospital Psychiatry 2014;36(6):570‐4. [DOI] [PubMed] [Google Scholar]
Richman 1996 {published data only}
- Richman RM, Webster P, Salgo AR, Mira M, Steinbeck KS, Caterson ID. A shared care approach in obesity management: the general practitioner and a hospital based service. International Journal of Obesity and Related Metabolic Disorders 1996;20(5):413‐9. [PubMed] [Google Scholar]
Rojas 2014 {published data only}
- Rojas G, Castro A, Guajardo V, Alvarado R, Isamit C, Fritsch R. Assessment of a distant collaborative program for the treatment of depression in primary care. Revista Médica de Chile 2014;142(9):1142‐9. [DOI] [PubMed] [Google Scholar]
Schapira 2010 {published data only}
- Schapira M, Camera L, Finkelsztein C, Matusevich D, Smietniansky M, Esteban J, et al. A multidisciplinary program for the treatment and follow up of depression in ambulatory elderly. Vertex: Revista Argentina de Psiquiatria 2010;21(92):284‐90. [PubMed] [Google Scholar]
Schouten 2010 {published data only}
- Schouten LM, Niessen LW, Pas JW, Grol RP, Hulscher ME. Cost effectiveness of a quality improvement collaborative focusing on patients with diabetes. Medical Care 2010;48(10):884‐91. [DOI] [PubMed] [Google Scholar]
Seekles 2009 {published data only}
- Seekles W, Straten A, Beekman A, Marwijk H, Cuijpers P. Stepped care for depression and anxiety: from primary care to specialized mental health care: a randomised controlled trial testing the effectiveness of a stepped care program among primary care patients with mood or anxiety disorders. BMC Health Services Research 2009;90:9. [DOI] [PMC free article] [PubMed] [Google Scholar]
Sharpe 2014 {published data only}
- Sharpe M, Walker J, Holm Hansen C, Martin P, Symeonides S, Gourley C, et al. Integrated collaborative care for comorbid major depression in patients with cancer (SMaRT Oncology‐2): a multicentre randomised controlled effectiveness trial. Lancet 2014;384(9948):1099‐108. [DOI] [PubMed] [Google Scholar]
Siaw 2015 {published data only}
- Siaw M, Ng P, Lee J. Impact of collaborative care on treatment satisfaction and diabetes distress: a prospective, randomized, controlled study. Diabetes 2015;64:A53. [Google Scholar]
Srinivasan 2002 {published data only}
- Srinivasan KS, Yeung AC, Pantin CF, Allen MB. Impact of integrated care on health status in chronic obstructive pulmonary disease (COPD). European Respiratory Society Annual Congress. 2002:2345p.
Stewart 1999 {published data only}
- Stewart S, Marley J, Horowitz J. Effects of multidisciplinary, home‐based intervention on unplanned readmissions and survival among patients with chronic congestive cardiac failure: a randomised controlled study. Lancet 1999;354(9184):1077‐83. [DOI] [PubMed] [Google Scholar]
Stewart 2011 {published data only}
- Stewart S, Carrington MJ, Marwick T, Davidson PM, Macdonald P, Horowitz J, et al. The WHICH? trial: rationale and design of a pragmatic randomized, multicentre comparison of home‐ vs. clinic‐based management of chronic heart failure patients. European Journal of Heart Failure 2011;13(8):909‐16. [DOI] [PubMed] [Google Scholar]
van Gils 2012 {published data only}
- Gils RF, Boot CR, Knol DL, Rustemeyer T, Mechelen W, Valk PG, et al. The effectiveness of integrated care for patients with hand eczema: results of a randomized, controlled trial. Contact Dermatitis 2012;66(4):197‐204. [DOI] [PubMed] [Google Scholar]
Wang 2010 {published data only}
- Wang ZW, Fang F, Lu ZP, Wang P, Chen YD, Zhang SP. Efficacy of integrated‐model management on chronic depression. Journal of Shanghai Jiaotong University (Medical Science) 2010;30(6):639‐42. [Google Scholar]
Wells 2000 {published data only}
- Wells KB, Sherbourne C, Schoenbaum M, Duan N, Meredith L, Unützer J, et al. Impact of disseminating quality improvement programs for depression in managed primary care: a randomized controlled trial. [Erratum appears in JAMA 2000 Jun 28;283(24):3204]. Journal of American Medical Association 2000;283(2):212‐20. [DOI] [PubMed] [Google Scholar]
Wootton 2009 {published data only}
- Wootton R, Gramotnev H, Hailey D. A randomized controlled trial of telephone‐supported care coordination in patients with congestive heart failure. Journal of Telemedicine & Telecare 2009;15(4):182‐6. [DOI] [PubMed] [Google Scholar]
Zhang 2013 {published data only}
- Zhang J, Burridge L, Baxter KA, Donald M, Foster MM, Hollingworth SA, et al. A new model of integrated primary‐secondary care for complex diabetes in the community: study protocol for a randomised controlled trial. Trials [ElectronicResource] 2013;14:382. [DOI] [PMC free article] [PubMed] [Google Scholar]
Zwar 2008 {published data only}
- Zwar N, Hermiz O, Hasan I, Comino E, Middleton S, Vagholkar S, et al. A cluster randomised controlled trial of nurse and GP partnership for care of chronic obstructive pulmonary disease. BMC Pulmonary Medicine 2008;8:8. [DOI] [PMC free article] [PubMed] [Google Scholar]
References to ongoing studies
Furler 2014 {published data only}
- Furler JS, Young D, Best J, Patterson E, O'Neal D, Liew D, et al. Can primary care team‐based transition to insulin improve outcomes in adults with type 2 diabetes: the stepping up to insulin cluster randomized controlled trial protocol. Implementation Science 2014;9(1):20. [DOI] [PMC free article] [PubMed] [Google Scholar]
Additional references
Archer 2012
- Archer J, Bower P, Gilbody S, Lovell K, Richards D, Gask L, et al. Collaborative care for depression and anxiety problems. Cochrane Database of Systematic Reviews 2012, issue DOI 10.1002/14651858.CD006525.pub2. [DOI] [PMC free article] [PubMed]
Atun 2013
- Atun R, Jaffar S, Nishtar S, Knaul FM, Barretto ML, Nyirenda M, et al. Improving responsiveness of health systems to non‐communicable diseases. The Lancet 2013;381:690‐7. [DOI] [PubMed] [Google Scholar]
Bartels 2014
- Bartels SJ. Why collaborative care matters for older adults in China. The Lancet 2014;2(4):286‐7. [DOI] [PubMed] [Google Scholar]
Bauer 2014
- Bauer UE, Briss PA, Goodman R, Bowman BA. Prevention of chronic disease in the 21st century: elimination of the leading preventable causes of premature death and disability in the USA. Lancet 2014;384:45‐52. [DOI] [PubMed] [Google Scholar]
Beaulieu 2000
- Beaulieu M. What do patients want from their GP? Common expectations beyond cultural differences. British Journal of General Practice 2000;50(460):860‐1. [PMC free article] [PubMed] [Google Scholar]
Bellg 2004
- Bellg A, Resnick B, Minicucci D, Ogedegbe G, Ernst D, Borrelli B, et al. Enhancing treatment fidelity in health behaviour change studies: best practices and recommendations from the NIH behaviour change consortium. Health Psychology 2004;5:443‐51. [DOI] [PubMed] [Google Scholar]
Bradley 1999
- Bradley F, Wiles R, Kinmonth A‐L, Mant D, Gantley M. Development and evaluation of complex interventions in health services research: case study of the Southampton heart integrated care project (SHIP). British Medical Journal 1999;318:711‐5. [DOI] [PMC free article] [PubMed] [Google Scholar]
Chen 2009
- Chen AH, Yee HF. Improving the primary care–specialty care interface: getting from here to there. Archives of Internal Medicine 2009;169:1024‐6. [DOI] [PubMed] [Google Scholar]
Craig 2008
- Craig P, Dieppe P, McIntyre S, Michie S, Nazareth I, Petticrew M. Developing and evaluating complex interventions: the new Medical Research Council guidance. BMJ 2008;337:a1655. [DOI] [PMC free article] [PubMed] [Google Scholar]
Deeks 1999
- Deeks JJ, Juszcak E. Commentary: beyond the boundary for a randomised controlled trial?. BMJ 1999;319:682. [Google Scholar]
EndNote [Computer program]
- Thomson Reuters. EndNote Reference Manager X7. Thomson Reuters, 2016.
EPOC 2013
- Effective Practice, Organisation of Care (EPOC). EPOC worksheets for preparing a Summary of findings (SoF) table using GRADE. EPOC resources for review authors. Oslo: Norwegian Knowledge Centre for the Health Services. http://epoc.cochrane.org/epoc‐specific‐resources‐review‐authors, 2013.
EPOC 2013b
- Effective Practice and Organisation of Care (EPOC). Data extraction and management. EPOC resources for review authors. Oslo: Norwegian Knowledge Centre for the Health Services. http://epoc.cochrane.org/epoc‐specific‐resources‐review‐authors, 2013.
EPOC 2015
- Effective Practice, Organisation of Care (EPOC). Suggested risk of bias criteria for EPOC reviews. EPOC resources for review authors. Oslo: Norwegian Knowledge Centre for the Health Services. http://epoc.cochrane.org/epoc‐specific‐resources‐review‐authors, 2015.
Flexhaug 2012
- Flexhaug M, Noyes S, Phillips R. Integrated models of primary care and mental health & substance use care in the community: literature review and guiding document. British Columbia Ministry of Health, 2012.
Goorden 2013
- Goorden M, Muntingh ADT, Marwijk HWJ, Spinhoven P, Ader HJ, Balkom AJLM, et al. Cost‐utility analysis of a collaborative stepped care intervention for panic and generalized anxiety disorder in primary care. Journal of Psychosomatic Research 2014;77:57‐63. [DOI] [PubMed] [Google Scholar]
Goorden 2014
- Goorden M, Hiujbregts KLM, Marwijk HWJ, Beekman ATF, Feltz‐Cornelis CM, Hakkart‐van Roijen L. Cost‐utility of collaborative care for major depressive disorder in primary care in the Netherlands. Journal of Psychosomatic Research 2014;77:57‐63. [DOI] [PubMed] [Google Scholar]
Greenhalgh 1994
- Greenhalgh PM. Shared Care for Diabetes: A Systematic Review. Shared Care for Diabetes: A Systematic Review. Vol. 34, London: The Royal College of General Practitioners, 1994. [PMC free article] [PubMed] [Google Scholar]
Griffin 2005
- Griffin S, Kinmonth AL. Diabetes Care: the effectiveness of systems for routine surveillance for people with diabetes. Cochrane Database of Systematic Reviews 2005, Issue 1. [DOI: 10.1002/14651858.CD000541] [DOI] [PubMed] [Google Scholar]
Grimshaw 1995
- Grimshaw J, Freemantle N, Langhorne P, Song F. Complexity and systematic reviews. Report to the US Congress Office of Technology Assessment, 1995.
Gruen 2004
- Gruen RL, Weeramanthri TS, Knight SE, Baillie RS. Specialist outreach clinics in primary care and rural hospital settings. Cochrane Database of Systematic Reviews 2003, Issue 4. [DOI: 10.1002/14651858.CD003798.pub2] [DOI] [PMC free article] [PubMed] [Google Scholar]
Hardwick 2013
- Hardwick R, Pearson M, Byng R, Anderson R. The effectiveness and cost‐effectiveness of shared care: protocol for a realist review. Systematic Reviews 2013;12:12. [DOI] [PMC free article] [PubMed] [Google Scholar]
Hickman 1994
- Hickman M, Drummond N, Grimshaw J. A taxonomy of shared care of chronic disease. Journal of Public Health Medicine 1994;16(4):447‐54. [DOI] [PubMed] [Google Scholar]
Hippesley‐Cox 2001
- Hippesley‐Cox J, Pringle M. General practice workload implications of the National Service Framework for coronary heart disease: a cross sectional survey. BMJ 2001;323:269‐70. [DOI] [PMC free article] [PubMed] [Google Scholar]
Hunkeler 2006
- Hunkeler EM, Katon W, Tang L, Williams JW, Kroenke K, Lin EHB, et al. Long term outcomes from the Impact randomised controlled trial for depressed elderly patients in primary care. BMJ 2006;332:259‐63. [DOI] [PMC free article] [PubMed] [Google Scholar]
Katon 2002
- Katon W, Russo J, Korff M, Lin E, Simon G, Bush T, et al. Long‐term effects of a collaborative care intervention in persistently depressed primary care patients. Journal of General Internal Medicine 2002;17:741‐8. [DOI] [PMC free article] [PubMed] [Google Scholar]
Katon 2012
- Katon W, Russo J, Lin EH, Schmittdiel J, Ciechanowski P, Ludman E, et al. Cost‐effectiveness of a multicondition collaborative care intervention: a randomized controlled trial. Archives of General Psychiatry 2012;69(5):506‐14. [DOI] [PMC free article] [PubMed] [Google Scholar]
Kings Fund 2015
- Naylor C, Alderwick H, Honeyman M. Acute hospitals and integrated care: from hospitals to health systems. King's Fund, March 2015.
McAlister 2004
- McAlister F, Stewart S, Ferrua S, McMurray JJV. Multidisciplinary strategies for the management of heart failure patients at high risk for admission: a systematic review of randomized trials. Journal of the American College of Cardiology 2004;44:810‐9. [DOI] [PubMed] [Google Scholar]
O'Dowd 2014
- O'Dowd T. Depression and multimorbidity in psychiatry and primary care. Journal of Clinical Psychiatry 2014;75:e1319–e1320. [DOI] [PubMed] [Google Scholar]
Pyne 2010
- Pyne JM, Fortney JC, Tripathi SP, Maciejewski ML, Edlund MJ, Williams K. Cost‐effectiveness analysis of a rural telemedicine collaborative care intervention for depression. Archives of General Psychiatry 2010;67(8):812‐21. [DOI] [PubMed] [Google Scholar]
Smith 2002
- Smith R. New BMJ policy on economic evaluations. BMJ 2002;325:1124. [DOI] [PMC free article] [PubMed] [Google Scholar]
Smith 2003
- Smith SM, O'Leary M, Bury G, Staines A, Tynan A, Shannon W, et al. The North Dublin Diabetes Shared Care (DiSC) Project: a qualitative investigation of the views and health beliefs of patients with type 2 diabetes. Diabetic Medicine 2003;20:853‐7. [DOI] [PubMed] [Google Scholar]
Starfield 2003
- Starfield B. Primary and speciality care interfaces: the imperative of disease continuity. British Journal of General Practice 2003;53:723‐9. [PMC free article] [PubMed] [Google Scholar]
Vaneslow 1995
- Vanselow N, Donaldson M, Yordy K. A new definition of primary care. Journal of Americal Medical Association 1995;272(3):192. [Google Scholar]
Wagner 2002
- Wagner EH, Groves T. Care for chronic diseases. BMJ 2002;325:913‐4. [DOI] [PMC free article] [PubMed] [Google Scholar]
WHO
- Global status report on noncommunicable diseases. World Health Organization, 2014.
References to other published versions of this review
Smith 2007
- Smith SM, Allwright S, O'Dowd T. Effectiveness of shared care across the interface between primary and specialty care in chronic disease management. Cochrane Database of Systematic Reviews 2007, Issue CD004910. [DOI: 10.1002/14651858.CD004910.pub2] [DOI] [PubMed] [Google Scholar]