Abstract
Particle injection, a major mode of plasma transport and energization throughout the magnetosphere, has been studied for decades. Nonetheless, the physical processes that lead to the acceleration and transport of very energetic ions in the inner magnetosphere during injection events are still under debate. In this paper, we analyze several injection events occurring near the Van Allen Probes apogee. Our analysis shows that the highest energy of an injected ion population depends on the charge state of that population. We show that most of the helium injected is doubly ionized (He++), while oxygen charge states are consistent with the presence of both ionospheric (O+) and solar wind (O6+) source populations. Based on the findings of our data analysis and with the use of a simple model, we demonstrate that the behavior of each injection of energetic ions near the Van Allen Probes apogee (5 < L < 7 R E) is well explained by simple adiabatic or nearly adiabatic transport within flow channels from higher L (≥10 R E) with velocities at 10 R E ranging between ~200 and 2,000 km/s and falling with inward transport consistent with fixed potential drops across the flow channels. Gradient/curvature drift during transport limits the highest energy/charge observed for each injection at the Van Allen Probes. Even at the highest measured ion energies where gyroradius and scattering effects might be expected to appear, energization depends on charge state but not on ion mass.
Key Points
Energetic ion acceleration in injections is proportional to charge state and independent of mass
Peak energy of high energy ions injected inside geosynchronous can be modeled as radial flow channels parameterized by their width and flow velocity
Ion composition measurements are critical to unraveling ion energization and drifts in injections
1. Introduction
Energetic electron and ion injections from the plasma sheet into the magnetospheric region at and inside geosynchronous have been observed since early in the space age (e.g., Lanzerotti et al., 1967). McIlwain (1974), Konradi et al. (1975), and Mauk and Meng (1983) showed that many of these injections of ions and electrons could be described phenomenologically using an “injection boundary” model, whereby the near‐Earth plasma sheet was shown to be the source of the injected particles. Most observations of these energetic ions have been made with either electrostatic analyzers (for energies between tens of electron Volts/charge (eV/q) to ~30–50 keV/q) or solid‐state detector telescopes for energies from 30 to 50 keV up to several MeV. In the earlier measurements, many of those sensors were not capable of discriminating among ion species, and it was common to assume that the data were dominated by protons. As mass‐resolving instruments were developed and flown, it was demonstrated that whereas protons typically did dominate the plasmas and energetic particle populations by number, there were significant fractions of other species represented in the plasma sheet, especially helium and oxygen. In terms of number density, helium was present at abundances similar to solar wind abundances (~5% typically), while oxygen (identified by plasma composition measurements as singly ionized oxygen) was present at variable abundances that depend strongly on geomagnetic activity and solar cycle (e.g., Gloeckler & Hamilton, 1987; Young, 1980; also see Allen et al., 2016, and references therein). The oxygen dependence on solar cycle was inferred to derive from increased solar ultraviolet intensity driving atmospheric and ionospheric oxygen scale heights (resulting in more oxygen available at higher altitudes where magnetospheric coupling can extract it), while increased geomagnetic activity and the accompanying strong magnetosphere‐ionosphere coupling currents produced additional localized neutral and ion heating (leading to even larger oxygen scale heights). The solar wind disturbance‐driven geomagnetic activity also produced stronger high‐latitude electric fields and electrostatic wave activity at low altitude resulting in additional heating and acceleration of ionospheric oxygen to energies where it can escape from the ionosphere and be transported into the near‐Earth plasma sheet (see Allen et al., 2016; Kistler et al., 1989; Korth et al., 2001, 2003; Kremser et al., 1985; Sharp et al., 1983, and references therein).
Most of the literature discussing the composition of energetic ions in the plasma sheet and their subsequent presence in storm and substorm injections, both earlier and within the last few years, has focused on the relative abundances of the singly ionized H+, He+, and O+ (e.g., Fok et al., 2006; Keika et al., 2013; Kronberg et al., 2012; Maggiolo & Kistler, 2014; Mitchell et al., 2005; Mouikis et al., 2010; Nosé et al., 2000; Ohtani et al., 2011). Some publications have touched on He++ (e.g., Daglis et al., 1994, 1999; Forster et al., 2013) and on high charge state oxygen (Allen et al., 2016; Kremser et al., 1988), but there has been otherwise little emphasis on solar wind‐source ions, which have typically been assumed to be minor players. For overall magnetospheric dynamics, these solar wind charge state minor ions may not be especially important, but as a probe of transport and energization processes, following their dynamics and energization can provide important insights.
Ion and electron injection events at and near geosynchronous orbit have been associated with fast Earthward flows from the near‐Earth plasma sheet into the middle and inner magnetosphere (e.g., Gabrielse et al., 2012, 2014). Farther out in the plasma sheet, these flows, systematically studied and described by Angelopoulos et al. (1992), Angelopoulos, Kennel, et al. (1994); Angelopoulos, Phan, et al. (1994); Baumjohann et al. (1990); McPherron et al. (2011); and Runov et al. (2009), have been associated with ion and electron acceleration in the near‐Earth magnetotail (Sergeev et al., 2012). Such flow channels have been shown to occur during substorms and to be associated with auroral streamers and sometimes with development of the substorm current wedge (Lyons et al., 2012). In some of the studies of relatively near‐Earth (geosynchronous orbit and inside geosynchronous) injections, ion energies in excess of 1 MeV have been noted. Because no potential drops approaching that magnitude have been measured, many have assumed that nonadiabatic acceleration processes are required to explain such high energies in injections (e.g., Delcourt, 2002). Analysis of drift echo data has shown convincingly that protons may be accelerated to such energies in injections, at least at geosynchronous altitudes (e.g., Baker et al., 1979). However, as we will demonstrate in this paper that is not usually the case at the Van Allen Probes apogee.
In this work we will demonstrate through both data analysis and a very simple model that the energies gained by the injected ions near the apogee of the Van Allen Probes (~5 ≤ L ≤ 7) are consistent with simply adiabatic (μ‐conserving) or quasi‐adiabatic motion governed by E × B drifts (charge and mass independent) and gradient and curvature drifts (charge state dependent) in high‐velocity flow channels, similar to those that have been described at higher altitudes both in observations (e.g., bursty bulk flows) and in magnetohydrodynamic simulations (Wiltberger et al., 2015). The particle trajectories and energization, therefore, depend only on ion charge state and not on ion mass. Thus, H+, He+, and O+ all undergo identical energization time histories, while He++ and O6+ receive 2 and 6 times the energy of the singly ionized species while following the same combined drift trajectories. It should be stated that at plasma energies, this behavior is well known. What has not been well established, and what we demonstrate clearly below, is that it extends even to energies for which gyroradius effects and pitch angle scattering have often been thought to modify that behavior. (Our modeling of this process is somewhat analogous to the treatment used in Zaharia et al., 2000, although there are important differences that lead to parametric values for velocity and flow channel width more consistent with flow channel observations. Our results are also much less sophisticated yet quite consistent with those obtained by Birn et al. (1997), Yang et al. (2011), and Zang et al. (2009).)
2. Data
Our data set for this analysis is taken from the Radiation Belt Storm Probes Ion Composition Experiments (RBSPICE) on each of the Van Allen Probe spacecraft, hereafter referred to as RBSPICE‐A and RBSPICE‐B. These instruments are described in Mitchell et al. (2013). They use a combined energy (W; we use W for energy to differentiate between energy and electric field, E) and time of flight (TOF) to derive the ion species and energy for the three major magnetospheric ions: H, He, and O (practically speaking, the O measurements also include nitrogen, but we will refer to this simply as O). They do not measure charge state, so, for example, they do not differentiate between He+ and He++ or between O+ and On+, where for the solar wind n is typically 6. (e.g., Bochsler, 2000; Gloeckler & Geiss, 1989). In interpreting the RBSPICE ion measurements it is important to understand that unlike simple solid‐state detector measurements, the requirement for also obtaining TOF results in considerably different sensitivities (efficiencies) for protons versus other species (He and O). Without going into detail (this is discussed in Mitchell et al. (2013)), for a particular energy ion, the efficiency for measuring protons is typically much lower than the efficiency for measuring heavier ions. This can become significant when interpreting RBSPICE ion measurements.
The ion data are organized into four categories: (i) TOFxW ions (TOF by W, where the x is NOT a multiply or cross product symbol), that is, particles that produce a valid TOF and energy measurement but are not categorized according to mass. These data are binned into relatively fine energy bins (ΔW/W ≈ 10%) and cover energies from 50 to 20 MeV. Since ion species are not identified, it is for these data that the variable efficiency for different species can be important to their interpretation. (ii) Protons, for which the TOF and W have been analyzed on board to assign mass = 1, binned at ΔW/W ≈ 20%, between energies of 50 and 600 keV; (iii) helium, mass 4, binned at ΔW/W ≈ 26%, between energies of 65 and 900 keV; (iv) and oxygen, mass 16, binned at ΔW/W ≈ 26%, between 140 and 900 keV. Although the instruments could be configured to measure specific species at energies higher than 600 keV for protons and 900 keV for He and O, these limits were selected as the best use of the available telemetry. The data are obtained over six separate telescope look directions and each ~11‐s spin of the spacecraft is sectored into either 12 or 18 spin sectors, although in this analysis we have not made use of pitch angle or anisotropy information, and so we simply average over all look directions to improve statistics.
3. Analysis of the Observations
3.1. Inference of Ion Species' Charge States From Dispersed Injections
The first dispersed event we analyze was observed near dawn on 1 December 2012. It contains several features of inner magnetosphere particle injections that we will make use of later. Figure 1 presents a 3‐hr interval on 1 December 2012, when Probe B was near apogee (dipole L ≈ 6.5, LT ≈ 0530). The figure presents spectrograms of all TOFxW ion intensities (top panel), proton counting rates, helium counting rates, and oxygen counting rates in successive panels. (We use counting rates because, with logarithmically spaced energy bins, the counts in each bin decrease more slowly with energy than they would if converted to intensity, allowing the energy‐dependent structure to be seen over a smaller color bar dynamic range. This is nearly [within a constant] equivalent to displaying the data in energy flux.)
Figure 1.
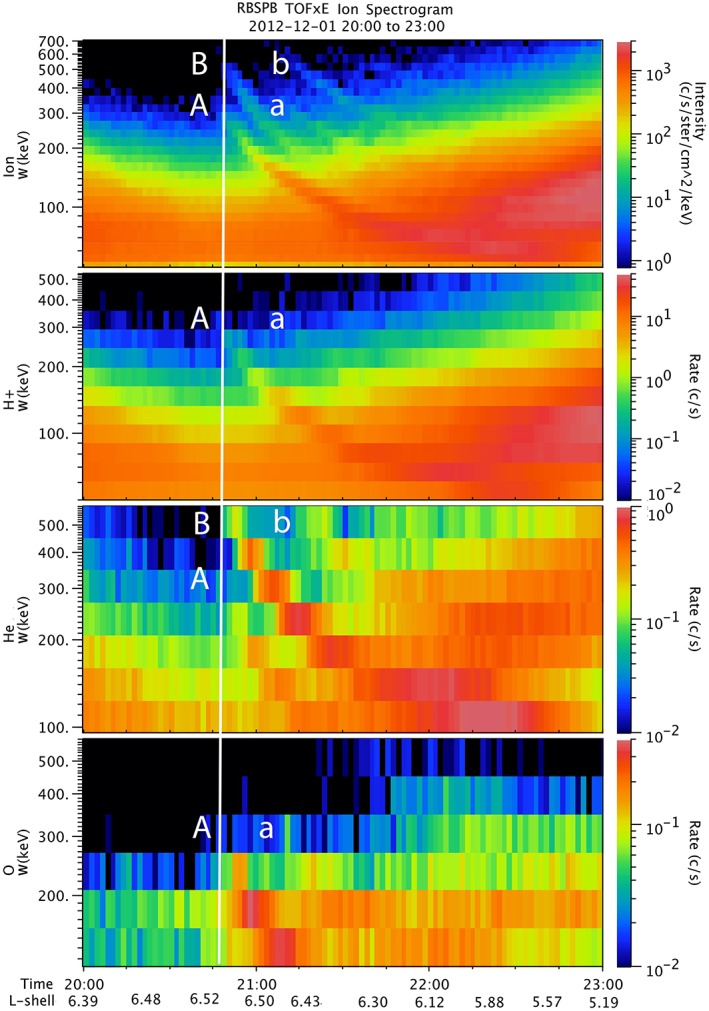
Spectrograms of an injection event on 1 December 2012, as measured by the RBSPICE instrument on Van Allen Probe B, located at 0530 LT and L ≈ 6.5. Top panel is TOFxE ion intensity, followed by H, He, and O on the three panels below. A vertical white line marks the first appearance of the injection as it drifts three fourths around the Earth from near midnight. A marks the locus of the dispersed injection for singly ionized ions at their peak energy, about 300 keV; a marks the 300‐keV locus for the drift echo of singly ionized ions; B marks the locus of the dispersed injection for doubly ionized ions at their peak energy (~550 keV on this energy scale, which is calibrated for protons); b marks the ~550‐keV locus for the drift echo of B.
In an injection, particles are transported by plasma motion (convection, V = E × B/B 2) roughly meridionally from higher L shells to lower L shells, within the space of tens of seconds to minutes. Observed at the lower L shells, the particles have been energized either adiabatically (conserving their first adiabatic moment, μ) or nonadiabatically (e.g., scattering in pitch angle or in the extreme executing Speiser motion (Speiser, 1965) resulting in fast transport azimuthally in the direction of the convection electric field [V × B]). If they are adiabatic, the particles likewise drift azimuthally in the magnetic field through magnetic gradient and curvature drifts. For simplicity, we evaluate this drift as a gradient drift in a dipole field,
This motion is azimuthal, perpendicular to the radial direction in the equatorial plane. This motion also transports the particles parallel to the convection E field, at a velocity proportional to their (perpendicular) energy (W ⊥) and inversely proportional to their charge number (q; ~W ⊥/q). Such injections observed at local times separated from the local time of the convection flow appear dispersed in energy, with higher energy particles observed earlier than lower energy particles as they drift past the observer. Typically, the convection is no longer active, and the population originally transported from higher L moves past the observer only azimuthally according to these drifts. In the spectrogram, these populations appear first in the highest energy particles, followed by lower and lower energies in a smooth arc to the lowest energies that appear last. Each such convective injection will produce this sort of dispersed feature in the spectrogram.
There appear to be different numbers of injection features in each panel of Figure 1. Despite that appearance, this event is actually only one, isolated injection. We have marked with a vertical white line the first appearance of the ions at Probe B. The different features in the figure include multiple charge states, as well as drift echoes. In the top panel (TOFxW ions) there are four distinct dispersed injection signatures, labeled A, B, a, and b. These can also be seen in the spectrograms for each species, but not every species displays every feature, so the four labels are only repeated for the features that do appear.
The second panel from the top shows counting rates for energetic protons. This shows one distinct injection (A) and a very faint drift echo (a). The third panel is helium. This is the most complex, with two injections (B at higher energy and A at lower energy) both starting at about 2050 UT. The higher, stronger helium injection B is also followed by a drift echo (b, about 30 min later at the highest energy plotted). The bottom panel displays oxygen, also showing injection A beginning at ~2050 UT, followed by drift echo a, again about 30 min later at the highest energy for which there are sufficient counting rates. The oxygen injection follows the same dispersion with energy as H and also the same as the lower of the two helium injections.
The upper (higher energy) helium injection can also be seen in the TOFxW ion product (top panel). In either case, a close examination reveals that at any vertical cut in time, the energy of the upper injection is just twice the energy of the lower injection. As we will demonstrate, this difference reflects the energy gained, and the ∇B drift velocities of, He+ (lower) and He++ (upper). Returning to the top panel, the injection signatures can now be sorted out. The lower of the two injections beginning at ~2050 UT is at the common energy of protons, O+, and He+. The upper of the two is at the energy of the He++. That they appear to be at roughly the same intensity in the TOFxW ions reflects the fact that protons dominate the lower energy injection, whereas helium dominates the upper injection. The RBSPICE TOF efficiency for helium is much higher than that for protons at these energies, so the lower intensity of the intrinsic particle distribution in the upper injection is offset by the higher efficiency for counting them, and they appear quite similar. The two additional injections appearing a little later in time are drift echoes from the first two.
The drift echo in the protons merges into the rising proton intensity as the spacecraft begins moving in from apogee and is not distinct. The He++ drift echo (higher energy) and the O+ drift echo (lower background intensities) stand out more clearly.
We can use this observation to directly calculate the local time of the original injection. At ~300 keV/e the time difference between the first H injection and its drift echo is about 20 min, so that is the time for particles with that E/q to drift through 24 hr of local time. At 300 keV, He++ follows H+ by ~15 min. If the injection took place at T 0, and 300‐keV H appears at T 0 + ΔT H300, 300‐keV He++ should appear at T 0 + 2×ΔT H300. But that is T 0 + ΔT H300 + 15 min, so ΔT H300 = 15 min. Thus, at 15 min before the 300‐keV H+ appeared, both 300‐keV H+ and 300‐keV He++ were at the same (injection) location; 15/20 × 24 hr LT ≈ 18 hr LT. Since Probe B is at ~0530 LT, the injection took place at ~0530 LT + 18 LT, or 2330 LT.
The event in Figure 2 is another example of a dispersed event. Observed near 0800 LT at L = 6.3 with RBSPICE‐B on 7 April 2016, this sequence shows two injections in close succession. The dispersion places the initial injection on the nightside, although the lack of a clear drift echo makes the calculation of the injection local time less certain than for the first event discussed. The injection detected in oxygen follows the same dispersion shapes as the injection in protons. The peak energy in the first injection is between 400 and 500 keV for both species, while the peak energy in the second injection reaches about 600 keV for both oxygen and hydrogen. In the oxygen spectrogram, we have repeated the lower energies from the proton spectrogram to show the continuity between the two (we do not measure oxygen as a unique species below about 140 keV). Once again the helium (top spectrogram) shows evidence for both He+ and He++, again with the He++ signatures much more distinct. While the He dispersion features look superficially like those of oxygen and protons, their peak energy is at ~900 keV for the first injection and above that for the second. This is consistent with the He++ being energized to just twice the proton and oxygen energies and consistent with the supposition that the energy gained is proportional to the charge state. A comparison between hydrogen and oxygen features at a given energy with helium features at twice that energy shows that they arrive at RBSPICE at the same time, consistent with the drift velocity in the magnetic field gradient being proportional to W/q and the He charge state being 2.
Figure 2.
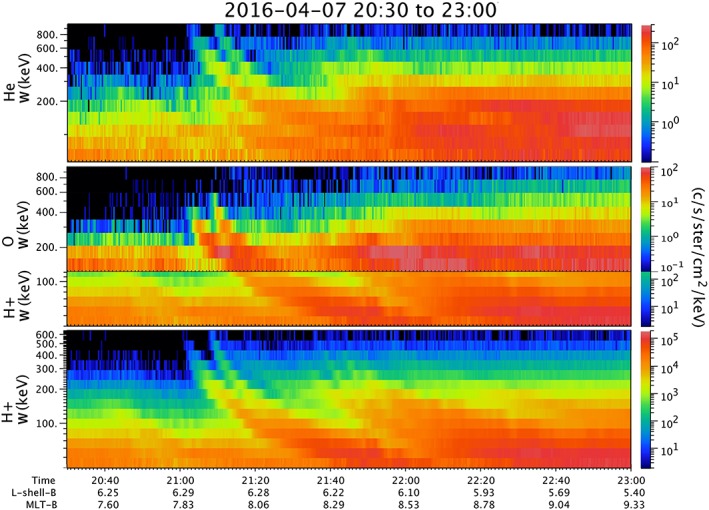
Spectrograms of injection event on 7 April 2016, measured by the RBSPICE B, located at ~0800 LT and L ≈ 6.3. Top panel is He intensity; bottom panel is H. The second (middle) panel is a combined spectrogram of O (higher energies) and H (lower energies). The O measurement does not go below ~140 keV. Because (as we argue in the text) we find the energization and drifts of injected ions to be organized by W/q, the morphology of the lower‐energy hydrogen should mimic the morphology of the O+ in an injection, as demonstrated in this panel.
3.2. Ion Count Rate Time Series Correlation Analysis for Different Energy Channels for a Dispersionless Injection Event on 11 March 2015: Defining the Upper‐Energy Limits of Energetic Ion Injections Based on Their Charge
On 11 March 2015 between 14 and 16 UT at 2200 LT and near the Probe B apogee at L = 6.5 (Figure 3), while there are dispersion‐like features present, the onsets of most of the injections in this set of spectrograms are nearly coincident in time at all energies. To aid the eye in following some of the bullet points below we have derived iso‐color contours from the top panel (all ions) and transcribed those contours onto the species spectrograms in the other panels. We have placed the contours at their measured energy values in the proton and oxygen spectrograms; we have moved them vertically to twice their original energy values in the helium spectrogram and to 6 times their original energy values (the white versions of the contours) in the oxygen spectrogram.
Figure 3.
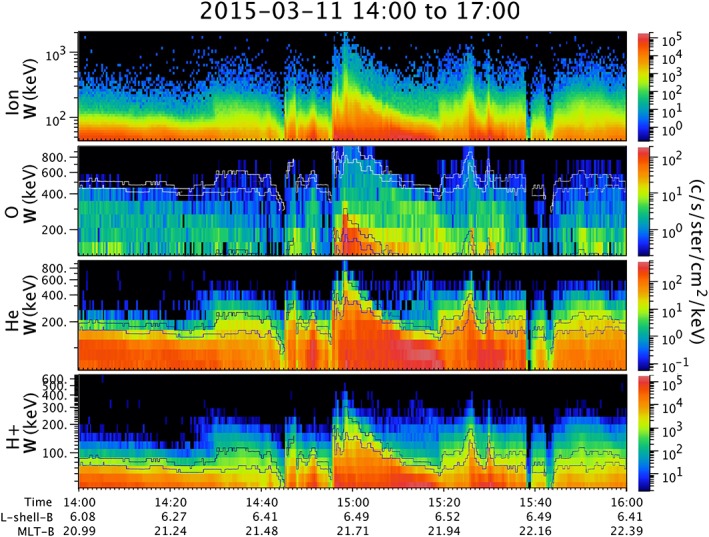
Spectrograms of injection events on 11 March 2015, measured by RBSPICE B, located at ~2100 LT and L ≈ 6.5. Top panel is all ions, the second from top panel is O, the third panel is He, and the bottom panel is H. The ion spectrogram energy scale goes up to 2 MeV, and it can be seen that the injection just before 1500 UT has measureable intensities to that energy. For that injection, the protons (bottom panel) reach ~400 keV or a little higher, the helium reaches ~900 keV, and the oxygen has a complex structure. Two iso‐color contours taken from the all‐ion spectrogram are repeated in each of the species spectrograms, registered in energy to 1, 2, and 6 times the energy of those in the H+ spectrogram.
Certain patterns stand out in these spectrograms:
Both protons and helium show a relatively abrupt upper energy cutoff in the intensity. In spectral terms, this is indicative of a sharp change in slope, from shallower to much steeper at a particular energy. That cutoff energy changes continuously and often abruptly in time over the interval shown, as sudden injections bring in more energetic plasma.
The pattern in the all‐ion (top) spectrogram is different, with no sharp upper edge, although the profile of a particular color (intensity) contour has a time history similar to those for protons and helium.
The pattern for the oxygen is quite different, with much more, seemingly amorphous haze at the higher energies. We will discuss that “haze” further below.
Another characteristic of the abrupt drop at the top energies in the proton and helium spectrograms is that for any given time (not just in the rise or decay of an injection) the spectral cutoff for the helium lies at double the energy of the cutoff for the protons. We will argue that this implies that the ions in this energy range are being continuously transported (by convection) from higher L shells and adiabatically energized with the peak energies attained representing the total potential drop they have moved through via their ∇B drift in the direction parallel to the convection electric field. This can also be thought of as Betatron acceleration, with their energy gain proportional to the change in the magnetic field strength while they preserve the first adiabatic invariant, although that approach does not shed light on their azimuthal transport, which is critical to the upper limit in energy at a function of L as discussed in section 4 below.
Figure 4 shows spectra for each of the species in Figure 3, taken at the peak intensity in that figure at 14:58:29 UT. We have slid the spectra vertically, both for clarity, and to compensate for the efficiencies used in various products when converting from counting rates to intensity.
Figure 4.
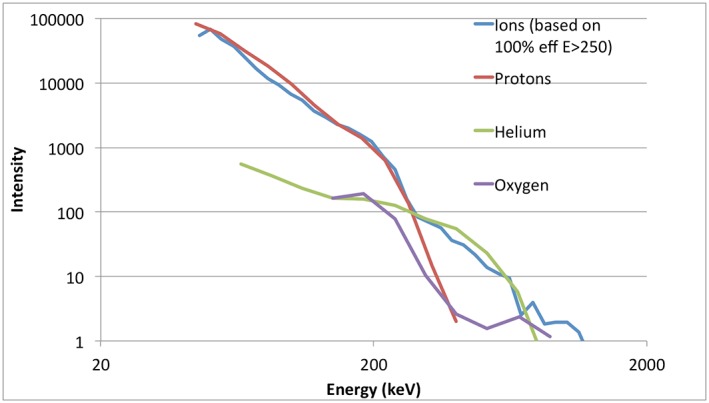
Spectra taken from a vertical slice through the spectrograms in Figure 3, at 14:58:29 UT (the peak intensity in this sequence). The ion spectrum has been adjusted by using efficiencies for O, He above ~200–260 keV.
In particular, the ion product (which includes all ions independent of mass) assumes efficiencies based on calibrations with protons, and at very high energies those proton efficiencies are much less than 1 (for example, 10% at 600 keV and 5% at 1 MeV). However, the higher energy particles measured in the ion product are not hydrogen but rather helium and/or oxygen, so the efficiencies for these ions are much closer to 1. In Figure 4 we plot the H, He, and O spectra using their calibrated efficiencies and calculate the ion spectrum using proton efficiencies up to 200 keV, transitioning from proton efficiencies to an efficiency of 1 between 200 and 260 keV, and using an efficiency of 1 above 260 keV. This adjusted ion spectrum now matches what would be expected if one summed the H, He, and O contributions into a single ion spectrum.
What this exercise shows is that if one were measuring ion injections with an instrument that did not differentiate among ion species, and furthermore one made the assumption that the entire spectral range is dominated by protons, then one would need to account for the acceleration of those assumed protons to energies of more than 1 MeV. However, as we have shown, the higher energies are dominated by helium and oxygen. We have argued that the helium energy is higher as a consequence of its being doubly ionized and energized by a q‐dependent process. Now we must account for the observation that, at least in the peak spectrum presented, the very highest energies are represented by oxygen.
Returning to the oxygen “haze” at higher energies, one might think that perhaps this is a fraction of the O+ which, with its large gyroradius relative to protons or He++, might participate in some nonspecified, nonadiabatic process (e.g., Delcourt, 2002; Ono et al., 2009) that boosts it to much higher energies than the rest of the O+. We will show instead that this is actually solar wind‐source oxygen, O6+ (accounting for the good match of the iso‐contours at 6 × W in Figure 3).
The following figures and discussion will be based on the assumption that the plasma that populates the newly injected energetic particles observed at Van Allen Probes apogee, as well as the source plasma for all of the interval from 14 through 17 UT of 11 March 2015, is composed of a mix of plasma that originated in the ionosphere (protons, He+, and O+) and plasma that originated in the solar wind (protons, He++, and O6+).
As pointed out in the discussion of Figures 1, 2, 3, at any particular time each species appears to have a distinct maximum energy in the spectrogram. That is, the lack of a measurement above the top energy that can be seen in the spectrogram is not for lack of sensitivity but a physical upper bound to the energy each species gains on its path to the observation point. This may not be strictly true; it is hard to know what is below the instrument sensitivity level—however, it is a useful construct and true in the sense that the disappearance of foreground signal above the top observed energy is typically abrupt, representing a large break in the spectral slope below that energy. Of course sometimes, as in the case of the O(6+) in Figure 4, the peak energy may be above the range of the species measurement, in which case the peak energy is not measured.
Figure 5a shows counting rates for H at ~120 keV, He at about twice that energy, and O at about 6 times that energy. The correspondence between the three rates is self‐evident; they are very strongly correlated. This demonstrates that the dependence on charge state is not restricted to the peak energy observed but orders the data at other energies as well. Figure 5b shows counting rates for all three species at a fixed energy. The lack of a close correlation is also evident. We will quantify the correlation as a function of energy below.
Figure 5.
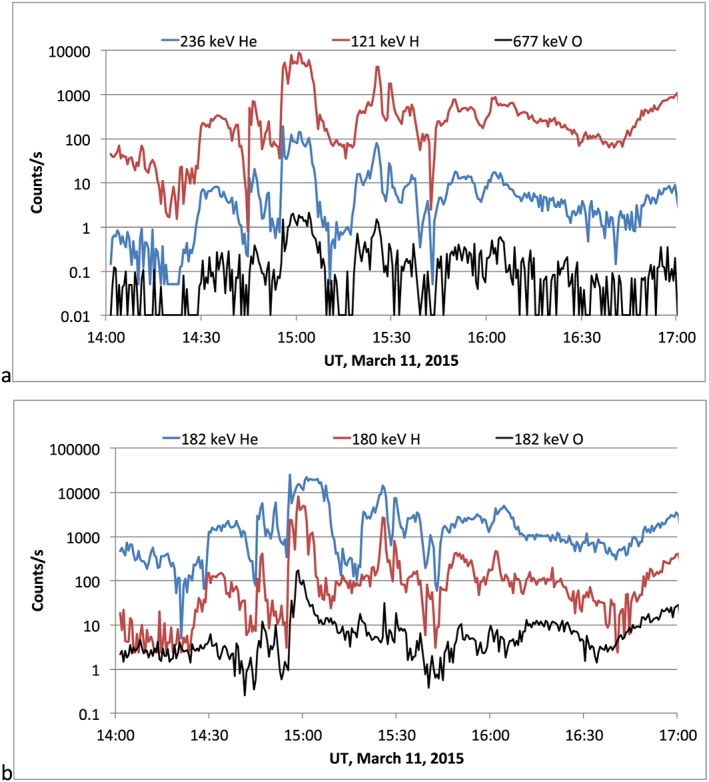
(a) Counting rates for protons at ~120 keV, He at ~240 keV, and O at ~680 keV. The similarity in time profiles is clear. (b) Counting rates for H, He, and O at ~180 keV, displaced vertically for clarity.
According to our assumptions, at the highest energies to which each species is accelerated the measurements should be dominated by the highest charge state for that species. For H that is always 1. For He it is 2, and for O as argued in the discussion of Figure 4 it is ~6. Our expectation is that if there are significant fractions of He+ and/or O+ present, those populations will contribute to the species measurements for energies at and below the proton peak energy observed at any given moment. We have also observed that while there are sometimes signatures in the He spectrograms that indicate a nonzero He+ population, He++ almost always dominates. We have not shown many examples, but in a survey of the injection and storm time data to date we have found only a few instances where the He+ signatures are even observable. This is not to say He++ is always the dominant charge state for helium in the inner magnetosphere. The reverse is actually true, the equilibrium charge state for helium in the inner and middle magnetosphere is singly charged (e.g., Chenette et al., 1984; Gerrard et al., 2014; Spjeldvik & Fritz, 1978). But it takes time (days) to reach that equilibrium charge state, and our observations confirm that the helium freshly transported from the plasma sheet/outer magnetosphere in active times is predominantly doubly ionized (a conclusion reached previously by others, e.g., Blake et al., 1983). For the oxygen the story is more complicated. The data reveal strong signatures of both O+ and O6+.
In Figure 6 we show counting rates for three species at specific energies: 180‐keV H, 182‐keV O, and 65‐keV He. The reasoning behind this is the following: Our hypothesis that the injected particles are organized by W/q requires that the singly ionized component of the 180‐keV O should behave very similar to the 180‐keV H (both are charge state 1). The 6‐times ionized component of the 180‐keV O should behave similar to 30‐keV H+ or 60‐keV He++ (all three being W/q = 30). Since our lowest helium energy channel is at 65 keV, we use that as the closest measurement we have to represent the time history of the transport/energization of 180‐keV O6+. It can be seen in the figure that the 180‐keV O counting rate deviates considerably from either the 180‐keV H or the 65‐keV He rates. However, a linear combination of the 180‐keV H and the 65‐keV He (orange line) tracks the 180‐keV O exceptionally well. The coefficients for that linear combination were simply chosen to best fit the 180‐keV O rates, but they are held constant throughout the 3‐hr interval plotted. The fact that over the entire interval shown the same coefficients work well implies that the compositional mix of H, He++, O+, and O6+ remained fairly constant in the source plasma population from which these ions originated.
Figure 6.
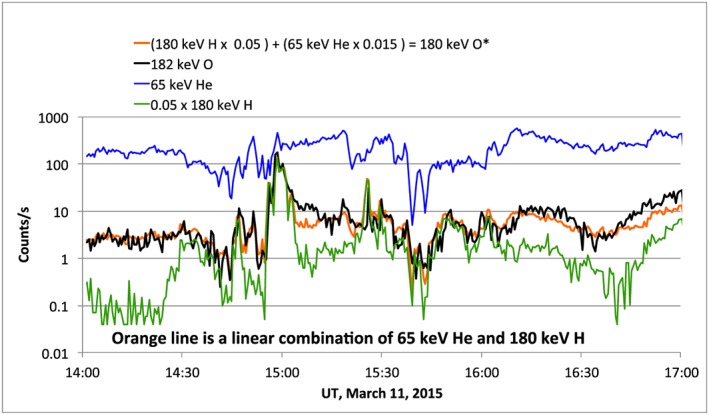
Counting rates for 65‐keV He (thin blue line), 180‐keV H (thin green line), and 182‐keV O (black line). The orange line is a linear combination of the He and H counting rates, which we refer to as 180‐keV O*, where the * indicates that it is not an actual oxygen measurement but a constructed oxygen counting rate.
To demonstrate that this hypothesis holds up throughout the energy range covered by the RBSPICE instruments, we calculated cross‐correlation coefficients between pairs of energy channels for H and He, for H and O, and for He and O. As Figure 7 shows, there is a clear ridge of correlation between the counting rate time histories along the W He ≈ 2 × W H track through the table. To aid the eye, the lower table is based on a simple analytical function that maximizes along W He = 2 × W H. In the upper table the strong correlation along that contour and the lack of any feature along the W He = 1 × W H track strongly supports the conclusion that He++ dominates the helium charge state in this plasma recently transported from higher L.
Figure 7.
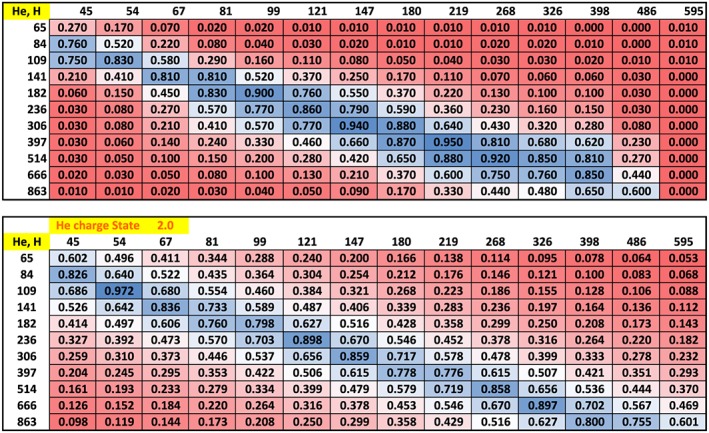
Top: correlation coefficients between time histories of counting rates between H and He, energy by energy. The table is color coded to highlight the consistently high correlation between channels centered on those for which W He ≈ 2 × W H. The lower table is simply a function that maximizes at W He = 2 × WH. The correlation in the data is a bit broader at higher energies than the chosen function in the lower table, but the general trend is consistent.
The results for H to O and He to O are shown in the following figures.
In Figure 8 clear areas of very high correlation appear. These are consistent with contributions from O6+ (modeled in the center table of Figure 8) and O+ (modeled in the rightmost table of Figure 8). Similar results are shown in Figure 9, for He and O.
Figure 8.

Similar to Figure 7, correlation tables for H and O. Here two regions of high correlation appear. The two model tables (center and right) show predicted regions of correlation for O6+ (center table) and O+ (right). The ion energy time history correlation table shows both patterns, with some minor decorrelation where they would overlap vertically. UT = universal time.
Figure 9.
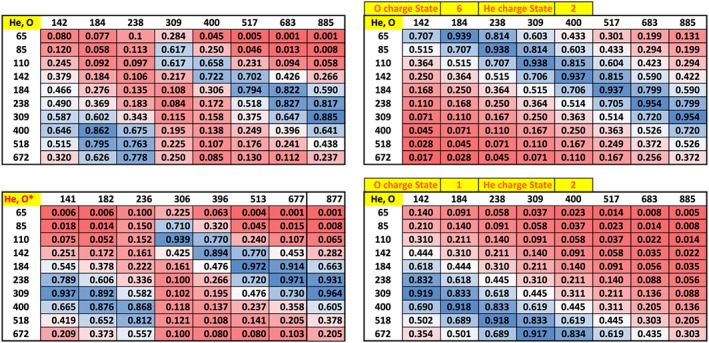
Similar to Figure 8, correlation tables for He and O. Again, two regions of high correlation appear. The two model tables to the right show predicted regions of correlation for O6+ (upper right) and O+ (lower right). The table in the lower left shows the correlation coefficients derived from a set of O energy channels constructed from linear combinations of H and He channels under the assumption that the energization of all species is dominated by charge state, that He++ dominates helium, and that O contains a mix of O6+ and O+ (we call these O* channels, see Figure 6 and text discussing that figure).
Our analysis to this point has focused on establishing that the four major ions participating in near‐Earth ion transport and injection on the nightside are H+, He++, O+, and O6+ (it should be stated that the RBSPICE instrument does not resolve differences between O and N, so a fraction of the O+ may in fact be N+; see Christon et al., 2002). Singly ionized helium plays a minor role but is often present in negligible quantities.
We will examine one more sequence of dispersionless and near‐dispersionless injections at ~L = 6.5 and then discuss the observations in the context of a very simple model.
In Figure 10 spectrograms of the counting rates for various species and all ions for a series of injections on 6 March 2017 reveal fairly high ion energies and, on probe A (upper five panels), nearly dispersionless injections (nearly vertical leading edges). The first major injection of the series shows inverse dispersion—that is, enhanced intensities in the lower energies first, followed by enhancements at progressively higher energies over the course of about a minute. This feature, in association with a drop in intensities at low energies (third panel from the bottom) at the time of the peak intensity for high energies leads us to the conclusion that probe A is located inside an injection flow channel. More on this below.
Figure 10.
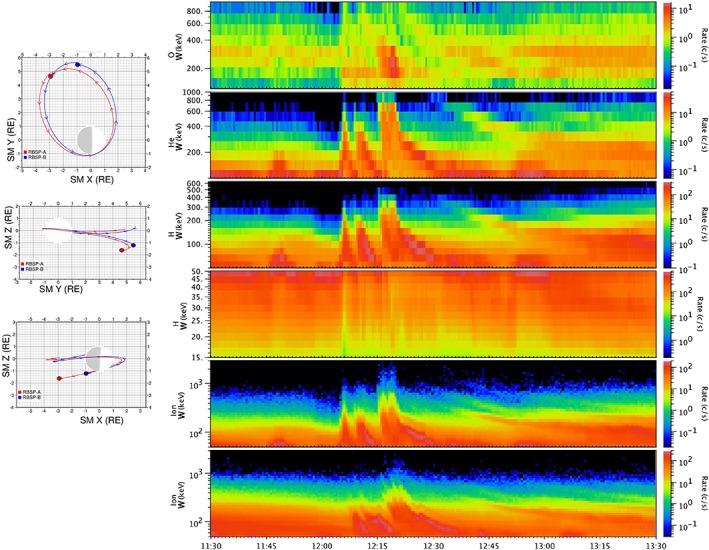
Right: spectrograms of injection events on 6 March 2017, measured by the RBSPICE A (and B, bottom panel), located at ~2000 LT and L ~ 6.2. Top panel is oxygen, the second from top panel is He, the third panel is H, the fourth panel is TOFxPH ions (mainly protons), the fifth panel is all ions, and the bottom panel is all ions as measured on Probe B. The ion spectrogram energy scale goes up to 3 MeV, and it can be seen that the injection just after 1215 UT has measureable intensities to nearly that energy. For that injection, the protons reach ~400 keV or a little higher, the helium reaches ~900 keV, and the oxygen has a complex structure. The RBSPICE B ions (bottom) are more dispersed than the RBSPICE A ions, consistent with its location about 1.5 hr earlier in local time. Left: locations of Probes A (red) and B (blue).
As in the previous dispersionless example, ion intensities well above sensor background are detected at energies as high as 2 and 3 MeV. Figure 11 shows the intensity spectra for all ions (blue), protons (red), helium (green), and oxygen (purple). The all‐ion spectrum would lie well above the other spectra at energies above ~350 keV if we used the proton efficiencies to convert from counting rates to intensity, but since the individual ion spectra inform us as to where helium and then oxygen dominate the ion measurement, by using high efficiencies above ~350 keV we see that the all‐ion measurement agrees very well with the separate H, He, and O spectra. Although the oxygen spectral telemetry product stops above ~900 keV, as in the previous example it is clear that the highest ion energies measured are almost certainly oxygen.
Figure 11.
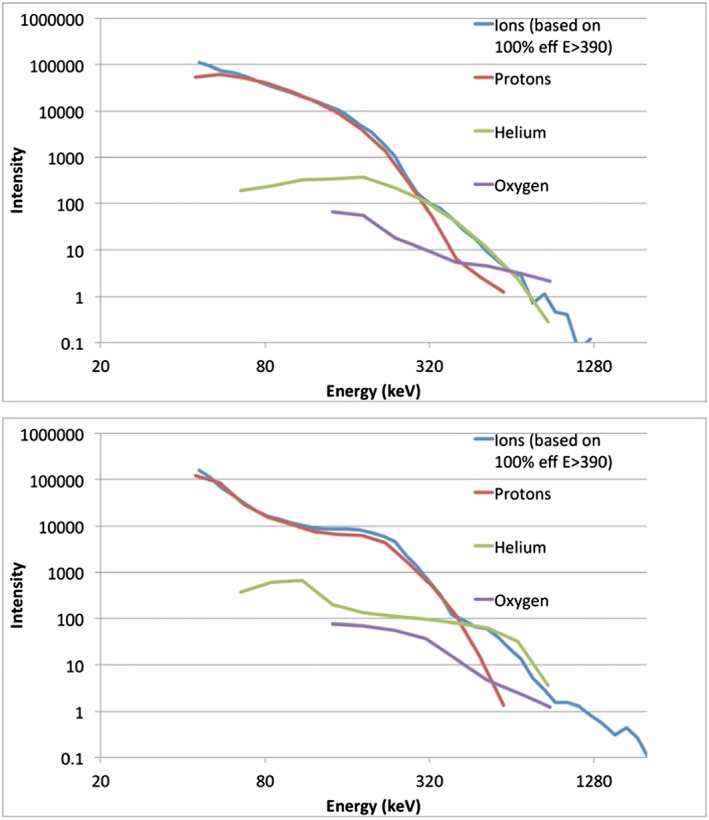
Intensity spectra taken from a vertical slice through the RBSPICE A spectrograms in Figure 10, at 12:06:12 (first injection) and 12:16:17 UT (the peak intensity in this sequence). The ion spectrum has been adjusted by transitioning to efficiencies consistent with He and O above energies where it is clear hydrogen does not contribute significantly.
We have repeated the exercise of calculating cross‐correlation coefficients for pairs of energy channels for the three measured species in this event. The results are presented in Figure 12. Again, the areas of high correlation can be understood under the assumption that energization and transport are both ordered by W/q, and by the assumption that the four major species contributing to the energetic particle population during these intervals of enhanced transport and injection are protons, He++, O+, and O6+.
Figure 12.
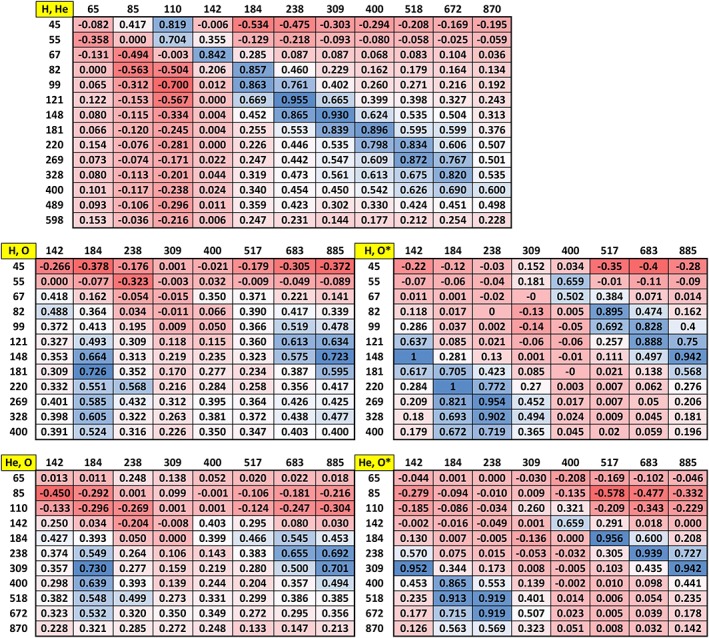
Similar to Figures 8 and 9, correlation tables for pairs of species. For H versus He, the ridge of high correlation again runs down the W He ≈ 2 × W H region. For the H versus O and He versus O tables on the left, again, two regions of high correlation appear, again, as predicted in the model tables presented in Figure 9. The tables on the right show the correlation coefficients derived from a set of O* energy channels constructed from linear combinations of H and He channels under the same reasoning as given for Figure 9 and in the text.
In Figure 13 we show more detail, for H and He, of the relatively dispersionless events of 6 March 2017 (Figure 10 provides a broader overview). We have provided this more detailed spectrogram to emphasize a few features.
Figure 13.
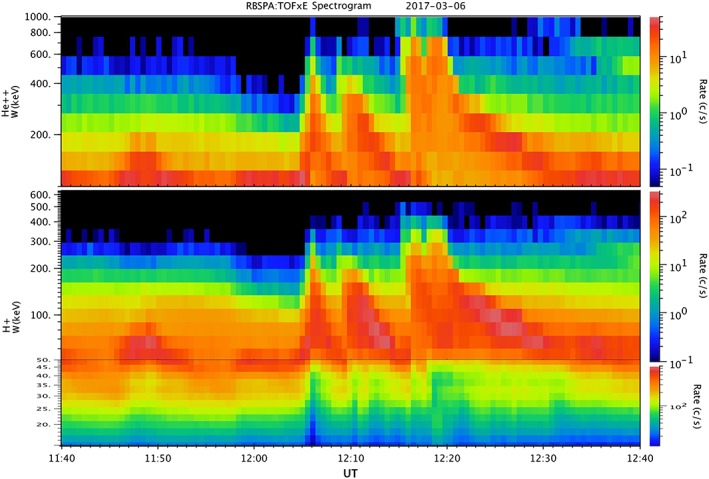
Spectrograms of injection events on 6 March 2017 measured by the RBSPICE A for helium (top) and protons (a composite of two products: the TOFxE identified protons and TOFxPH ions assumed to be protons—for this velocity range, that assumption is typically well founded. This is a detail of data from Figure 10, allowing closer examination of several features discussed in the text.
The first is that around 1206 UT, the time of the peak of the first injection, there is a drop in the counting rates by a factor of ~3 to 5 in the protons below about 40 keV. The spectrogram presents rates, not intensities because the dynamic range for the rates is smaller than for intensity, which helps in highlighting features over a broad range of energies. The energy spectrum below ~40 keV is quite flat, which is typical of the thermal plasma in this region. The drop by factors of 3 to 5 at the lower energies therefore represents a drop in plasma density in this injection, which we expect if this is a flux tube that has been transported from higher L, for example, by interchange.
The second feature we see in this injection is the inverse dispersion on the leading edge. The lower energies are enhanced first, followed by the higher energies. We think this is a consequence of being at the local time of an inflowing channel as it reaches the L shell of the spacecraft. The initial enhancement at the lowest energies is at the leading edge of the flow. This first plasma has only been transported a short radial distance in L, so the gain in energy is small. As the flow brings plasma from greater and greater L distances, the peak energy reached goes up until at 1206 the channel has brought plasma in from as far out as it extends. The peak energy reached then depends not only on the source plasma temperature and the change in |B| but also on whether a particular ion can remain within the flow channel for the whole distance or instead gradient drifts out of the channel before reaching the observation point. We will go into this argument in the section on modeling below.
The third feature we wish to highlight here is that ions at the peak energy persist for approximately 30 s. We believe that this represents the length of time that the velocity in flow channel maintained its highest value. Again, this will be discussed more in section 4 below.
3.3. Conclusions From Event Analysis
The four major ion constituents of energized plasma in injections in the L = 5 to L = 6.5 range comprise H+, He++, O+, and O6+. He+ is a minor constituent.
The energization, peak energy, and drift dynamics are well ordered in W/q even at energies exceeding 1 MeV. Thus, O+ gains the same amount of energy as H+, He++ gains twice that energy, and O6+ gains 6 times that energy.
During active intervals, the energy dependence of these species is well ordered in W/q, even before or between injections.
The abundance ratios in the source plasma that becomes energized in the injections remain nearly constant over the course of several hours.
4. Framework for Understanding the Observations
4.1. Adiabatic Motion Within a Fast Flow Channel
For the purposes of understanding the transport and energization of plasma to high energies during substorm injections, and more broadly during Earthward transport of plasma under a variety of activity levels, Figure 14 presents a cartoon of what we will refer to as a flow channel and the trajectories of plasma ions in that flow channel. A flow channel as we show it here is an idealized, highly simplified version of the fast transport of plasma Earthward during a substorm and probably also during a storm or a continuously driven convection episode. Although our cartoon shows a wedge‐shaped flow channel, a rectangular shape would produce similar results, and we do not differentiate between the two. Similar constructs have been used by others, (e.g., Gabrielse et al., 2012) who analyzed electron injections beyond geosynchronous or Li et al. (2003) who simulated electron and proton injections at geosynchronous orbit. Using the Rice Convection Model (RCM), Zhang et al. (2009) and Yang et al. (2011) have shown similar results associated with low entropy bubbles propagating Earthward in the near‐Earth magnetotail. In the RCM, the region of Earthward convection (low entropy bubble) is much broader beyond about 15 R E, becoming much narrower inside 15 R E down to geosynchronous orbit. Our discussion is more appropriate to the narrower, near‐Earth region addressed in those papers. Below, we list the general characteristics that we believe to be important for understanding the observations of substorm injections:
The region of Earthward flow is limited in azimuthal (or Y) extent.
Pressure balance is roughly maintained during the Earthward transport of plasma and magnetic fields.
The system is at least quasi‐adiabatic even at energies >>100 keV (that is, on average the first adiabatic invariant is preserved, although individual particles likely scatter in pitch angle, as the injected particles in fresh injections are typically observed to be isotropic).
Inside the channel the flow velocity is proportional to 1/|B| (which can also be thought of as equivalent to a constant potential drop across the channel during the flow or, as we treat it, a constant electric field—a convection electric field consistent with the plasma flow, which may be a combination of inductive and potential fields, but the particles do not care which).
The equatorial magnetic field strength increases a bit faster than a dipolar field would with decreasing L, consistent with an initially stretched field configuration and consistent with typical in situ measured field strengths that are usually lower than dipolar in the near‐Earth plasma sheet (this assumption is not critical to the results, we simply felt it was more representative than assuming a dipole field out to or beyond 10 R E).
Energetic ions will be lost from the particle population via gradient drift when they reach the duskward edge of the flow channel.
Although plasma can also gradient/curvature drift into the channel from the dawnward side of the channel, that is not a significant contributor to the observed injection energetic particle population (again, not critical but makes the simulation simpler). This assumption is justified by the fact that the source of the great majority of the particles available to take place in the flow and acceleration is the dense plasma sheet. Particles at higher energies with gradient drift velocities fast enough to feed the convecting population through the sides of the channel have much lower densities, and will not contribute importantly to the phase space distribution throughout the flowing channel. If they are at low energy in the region next to the channel, they will drift though the boundary slowly; if they are at high energy, they are already far down in phase space density and will contribute little to the flowing population.
Figure 14.
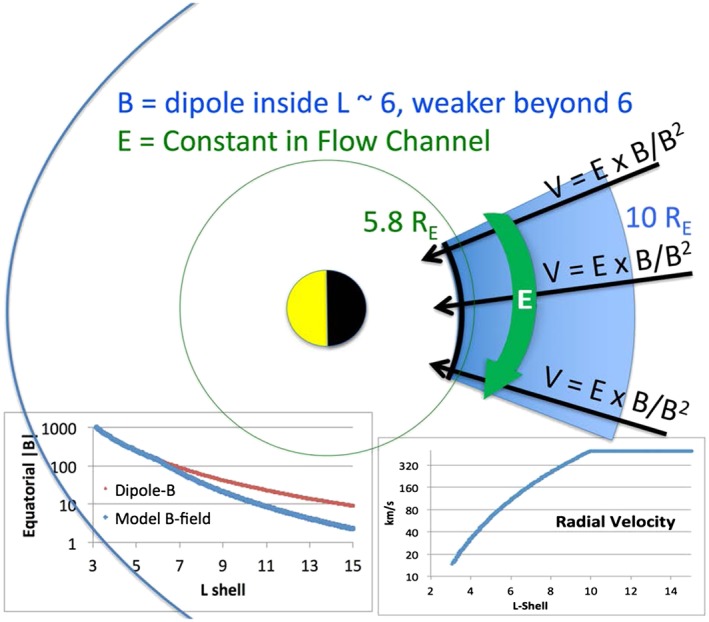
Cartoon of simple model for ion transport and acceleration. In this depiction, we show radial flow, resulting in an azimuthal E field. An alternate depiction could be drawn with parallel east‐west boundaries and a dawn‐dusk E field. Either, or something intermediate between those extremes, would produce similar results. UT = universal time.
In Figure 14 we set up the basic concept for a simple analytical model that we use in the following discussion. The model is based on the assumptions discussed above. The figure is a cartoon showing the flow channel, the direction of the convective drift, as well as the velocity profile and magnetic field (Z component) profile we use in the analytical model. An ion starting at the outer edge of the flow channel convects Earthward at the velocity prescribed by the model. (We start the particles at 15 R E in these simulations, but the choice of the outer boundary has only minor influence on the results.) The convection velocity starts out high in the near‐Earth tail (typical values modeled range from 200 to 1,000 km/s). At a defined distance (10 R E in this example) the velocity begins to decrease proportional to 1/|B| resulting in the profile shown in the lower‐right inset. The magnetic field varies monotonically from a (typical) low value at 15 R E to higher and higher values inward to an inner boundary (here chosen to be 6 R E) where it reaches the local dipole value and then varies according to the dipole relationship with L inside that boundary. The particle energy is varied assuming the first adiabatic invariant is conserved, and its azimuthal drift velocity is calculated based on a dipole field radial gradient (which will be a slight underestimate in the outer region beyond the transition to an assumed dipole at 6 R E).
In Figure 15 we diagram the qualitative behavior of various ion energies as they are convected Earthward between ~10 R E and ~6 R E (the location of the Van Allen Probes). In Figure 15a we show that for a beginning energy of roughly 0.1 keV, during their convection toward Earth the conservation of μ leads to their reaching ~1 keV at ~6 R E. As they gain energy, they drift duskward. Those ions that begin their Earthward transport duskward of some point on the outer boundary do not reach 6 R E but drift through the dusk edge of the channel and no longer convect Earthward. At higher initial energy (~2 and 3 keV, Figure 15b) a narrower local time segment of the channel at 10 R E can reach 6 R E, gaining energy to ~30 keV. In Figure 15c initial energies of ~20 keV fill an even narrower segment of both the outer and inner boundaries. In Figure 15d, we show schematically the trajectories of the very highest energies that can be transported from the outer boundary to the inner boundary. These come from a very narrow source region in local time and populate a very narrow portion of the 6 R E inner boundary.
Figure 15.
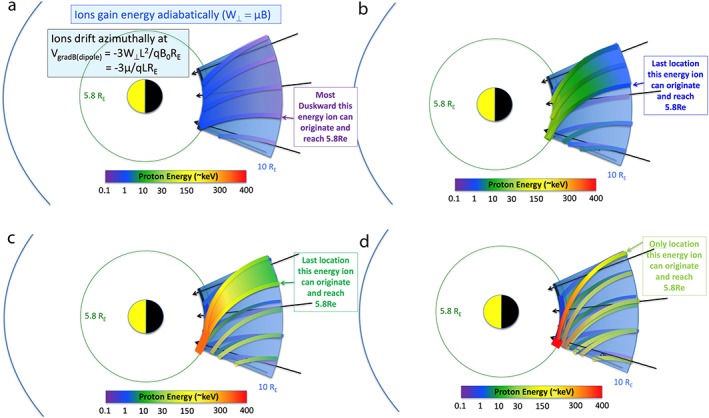
Cartoon model ion trajectories. Ions gain energy adiabatically as they are convected Earthward. They drift azimuthally in the radial gradient of the magnetic field. Their energy gain can also be calculated by the expression q × E × d, where q is the ion charge state, E is the azimuthal electric field in the channel, and d is the azimuthal distance through which they have gradient drifted during their transport.
While the channel continues to flow, this pattern will be maintained. At the observation distance (5.8 R E in the cartoon) and at the dusk edge of the channel, the duration of the highest energy particles produced will represent the duration of the flow channel's existence. At lower energies, where the particles fill a larger wedge of azimuth, the duration of the injection for an observer at the dusk edge of the channel will be the duration of the channel's existence plus the gradient drift time of the dawnward most edge of that energy particle population. These durations as a function of ion energy will be the same for an observer displaced to earlier local times but will be dispersed in time. The gradient drifts go as W/q, so the times for these drifts are ordered by W/q in the measurements not simply by W.
In Figure 16 we plot the output of a simple analytical model based on the cartoon in Figure 15 for a variety of energy ranges of source protons at the outer boundary (which is placed at 15 R E, although the results are only displayed in the figure between 10R E and 5R E). See the Figure 16 caption for the range of model parameters. In Figure 16a we follow particles with initial energies between 0.1 and 1 keV. To display the results of the model we plot a particular color (corresponding to an energy range as shown in the legend) over the full range in azimuth and radius that particles within that energy range populate. Thus, for the lowest energies displayed (1 to 10 keV) where the gradient drift is not a strong effect, the dark blue color fills most of the region. Higher energies are plotted in successive layers on top of the lower energies, so beginning about 9 R E the 10‐ to 20‐keV energy range appears, over a slightly narrower range in azimuth. For this low energy range of input energies, the highest energy appearing at 6 R E is the 50‐ to 70‐keV range, which still fills almost 35° of the full 40° channel.
Figure 16.
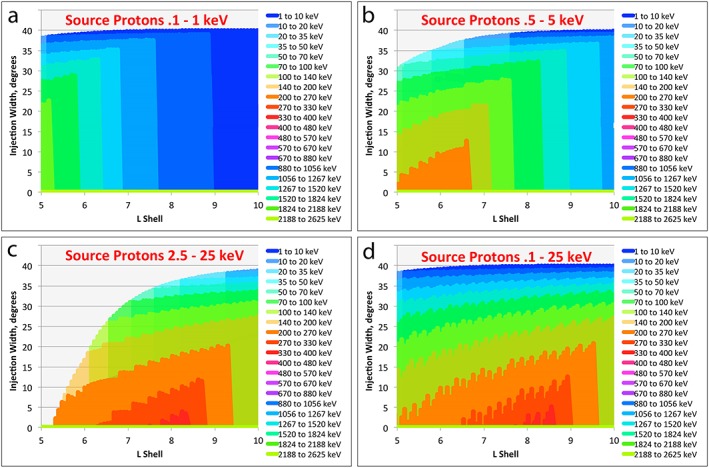
Model proton energies for a 40° wide flow channel and 500‐km/s flow velocity outside 10 R E. The sawtooth contours and slightly nonvertical edges to the colors are consequences of the spatial resolution of the calculation and plotting and are not physical. (a) For a source population at the outer boundary (15 R E) of 0.1 to 1‐keV protons; (b) for a source population of 0.5‐ to 5‐keV protons; (c) for a source population of 2.5‐ to 25‐keV protons; (d) for a source population of 0.1‐ to 25‐keV protons.
In Figure 16b the source population is raised to 0.5 to 5 keV. Now we see energies as high as ~250 keV at 6 R E, the latter filling about 10° of the 40° width. In Figure 16c we follow a source energy range of 2.5‐ to 25‐keV protons. Notice that at 6 R E, despite a higher energy range for the source population, the highest energy reached is still contained within the 200‐ to 270‐keV color contour, which covers the same 10° range in azimuth. The actual peak energy is very close to 270 keV and covers only a sliver of the channel in azimuth. What this indicates is that the high energy population seen at 6 R E was common to the source populations in Figures 16b and 16c, that is, protons between 2.5 and 5 keV. In Figure 16d we show the results for a source population inclusive of all the energies from Figures 16a to 16c. Again, higher energies are plotted on top of lower energies, so the dark blue extends from the edge that can be seen at the top of the figure all the way to the bottom edge, just as in Figure 16a—it is simply hidden behind higher energies. So for this broad range of input energies, the output energies at 6 R E range from ~1 up to ~270 keV.
While our modeling is focused more on the ~6 R E region where we have Van Allen Probe measurements, we would like to point out that the highest energies reached are farther out, between 8 and 9 R E for this choice of input energies and channel characteristics. This pattern is maintained for closer distances as well, such that the lowest altitudes modeled have lower peak energies than those farther out, independent of the high energy extent of the input distribution. This is consistent with the injection process during storms, when the ring current pressures at lower L shells are typically dominated by particles of modest energies, while the intensities at energies >200 keV often actually decrease because they are on open drift paths and do not reach typical ring current altitudes (Gkioulidou et al., 2016).
In Figures 17a and 17b we show the effects of changing the velocity of the flow (convective velocity) in the channel while keeping the channel width and input energy distribution fixed. For a lower flow velocity (a), the peak energy is reached farther out (~8 R E) than for a higher flow velocity (b, ~7 R E), but the peak energy (~140 keV) is lower for 200 km/s (a) than the peak energy for 500 km/s (b, ~300 keV).
Figure 17.
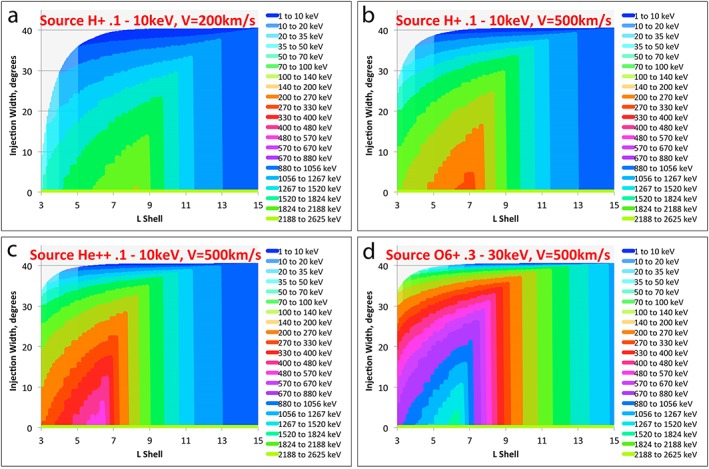
(a) Model results for a source population of 0.1‐ to 10‐keV H+ and a flow velocity in the region beyond 10 R E of 200 km/s; (b) model results for (the same) source population of 0.1‐ to 10‐keV H+ but for a flow velocity in the region beyond 10 R E of 500 km/s; (c) model results for a source population of 0.1‐ to 10‐keV He++, flow velocity in the region beyond 10 R E of 500 km/s; (d) model results for a source population of 0.3‐ to 30‐keV O6+, flow velocity in the region beyond 10 R E of 500 km/s. Note that for an observer at the dusk side of the channel (bottom of plot) at 6 R E and V = 500 km/s, the peak energy for H+ is ~270 keV, the peak energy for He++ is ~540 keV, and the peak energy for O6+ is ~1.6 MeV.
In Figures 17c and 17d we show the results for a fixed flow velocity (500 km/s, the same as in Figure 17b) but for the species He++ in Figure 17c and O6+ in Figure 17d. It can be seen by comparing the colors with the legend that the highest energy reached at 6 R E is proportional to the ion charge state. O+ (not shown) would look identical to H+. As mentioned earlier, this energy gain can be understood either as Betatron acceleration or as the energy a charged particle gains when transported parallel to an electric field, W final = W initial + q • E • d, where the kinetic energy (ΔW) gained by the particle is equal to its charge state q (1, 2, or 6 in this analysis) times the (~constant) electric field times the distance the particle moves in the direction of the electric field (azimuthally by gradient drift in our analysis).
There are other features in Figures 16 and 17 that inform the measurements as well. For example, the location of the highest energy reached in the simulation depends on the velocity of the convection, which can be understood qualitatively as a faster radial flow allowing for a particle with a higher initial energy (which will drift faster azimuthally in the B field gradient) to be moved farther in radially before drifting through the dusk boundary. The simulation also does not take into consideration the full range of particle energies that may be present at the outer boundary of the flow. Including additional particles with higher initial energies in that source population will change the energy structure of the regions beyond 6 to 7 R E, but since we are interested only in understanding the observations in the vicinity of 6 R E, we have only included those energies in the source population that can be transported from the source region to ~6 R E. Including higher energy particles in the source distribution does not change the energy structure Earthward of the last vertical contour in the plots, since those higher energy particles drift through the dusk boundary before reaching that L shell. It is trivial to add higher energies to investigate the structure of the channel at larger L, but we chose to keep only those source distribution particles relevant to our Van Allen Probes observations.
Another characteristic of injections, both dispersionless and dispersed, is that the width (in time) of the injection at the peak observed energy is much narrower than its width at lower energies. This characteristic is naturally explained in our model as a consequence of the charge and energy‐dependent ion transport. The highest energies only fill a narrow azimuthal region of both the source and the injected flow channel width, while lower and lower energies fill wider and wider swaths of the flow channel. In particular, the width (in time) of the injection at the peak energy is primarily a consequence of the duration over which the flow channel is flowing. By subtracting the observed width of the peak energy from the observed width at one half the peak energy, one gets the width of one half of the entire channel (in particle drift time). From this, the physical width of the flow channel can be estimated.
Although our modeling has focused on injections, the general high correlation in the ion intensities versus time profiles ordered by W/q suggests that essentially all of the transport from the near‐Earth tail (plasma sheet) into the middle to inner magnetosphere is dominated by “adiabatic” convection, as pointed out in previous publications (e.g., Kistler et al., 1989).
4.2. Comparison With Observations
The width of the first, dispersionless event in Figure 13 is about 30 s at the peak energy, ~400 keV. According to our model, this indicates that the peak flow velocity lasted for about 30 s. The width of the event at one half that energy is about 90 s. Subtracting the 30‐s duration, this leaves 60 s of drift at ~200 keV/q from the center of the channel to the dusk edge. To match these observations with our model, we need a channel width of about 23° and a peak velocity of the flow (at 10 R E) of about 1,200 km/s (about 280 km/s at the observation L shell, 6.2). This is on the high side for flow velocities, but may not be unreasonable given that we have intentionally chosen relatively high peak proton energies among the injections observed on the Van Allen Probes. These numbers would imply that a segment of the plasma sheet of about 5.6 R E extent in the X coordinate and about 3.9 R E wide in Y would have been transported Earthward through a line drawn at a distance 10 R E tailward from Earth. At the observation L shell, the radial transport through a boundary in X (or R) would be about 1.3 R E, over an azimuthal width of about 2.3 R E. We do not model any compression of the channel width during propagation other than to assume radial flow, but such compression would change these numbers somewhat.
4.3. Effects Not Included
The model we have constructed ignores many effects that would need to be included in a self‐consistent model. It is meant to be illustrative but is not meant to include all of the physics of injection of energetic particles and plasma transport during those injections. In particular, the injection geometry is highly idealized, with radially aligned (or X axis aligned) edges and uniform conditions (V, B, and E) inside the channel. Some of the caveats of such an approach are listed below:
It does not include the effects of enhanced magnetic field at the leading edge as typically observed in dipolarizations (as modeled, for example, in Ukhorskiy et al., 2017)—rather we believe that it models the high speed flow behind those fronts, which typically have a longer duration than the front itself and can be thought of as transporting a significant X‐dimension segment of the plasma sheet plasma from the near‐Earth plasma sheet to inside geosynchronous.
It does not include turbulence.
It does not include scattering of particles.
It does not include magnetic gradients (other than the described radial gradient), either internal to the channel or at its edges.
It does not model coupling with the ionosphere or flux pileup.
It does not include drift of particles into the channel from the sides.
It is not intended to be a true physical model but rather an illustration that several of the repeatable observable characteristics of injections can be reproduced by making very simplifying assumptions about the particle transport from higher to lower L. The fact that the model so successfully reproduces many of the characteristics of the observed particle injections at the Van Allen Probes leads us to conclude that it is capturing some of the essential (and dominating) characteristics of that transport, despite its inconsistencies and lack of realism.
The model thus provides a very simple, quick‐to‐run tool that allows many of the basic parameters of near‐Earth injections to be varied to match the observed parameters of any particular event. This aspect of speed confers some degree of value, as more sophisticated, more physical models (hybrid codes, RCM, etc.) are computationally complex and take much longer to explore the parameter space of flow velocity, flow duration, channel width, source plasma energy distribution, and penetration depth of various energies and charge states. Using this simple model, one can then constrain the parameter space of a more complex model and so gain efficiency.
4.4. Conclusions From the Transport and Acceleration Model
Our modeling of ion transport from the near‐tail region to the region near apogee of the Van Allen Probes has reproduced several key characteristics established in the data analysis section of this paper. These are the following:
The peak energy (even to energies as high as 1 MeV) reached in an injection event can be quantitatively modeled as the initial energy of the particle added to the energy gained as the particle is convected into regions of higher magnetic field while conserving its first adiabatic invariant (Betatron acceleration). We are not claiming that the transport is strictly adiabatic but simply that adiabatic transport predicts energy gain consistent with the observations.
Alternatively, the peak energy reached in an injection event can be understood as the energy gained as the particle drifts across a flow channel by a distance (d) in the direction of the V × B convection electric field (presumably a combination of potential and inductive).
The energies of particles below the peak energy observed can also be understood by these same simple assumptions.
The measurements of the resulting energetic particle population are best ordered by W/q (energy/charge).
Although ions in injections are typically observed to be nearly isotropic, their transport must be close to adiabatic. That is, while a case could be made for the idea that nonadiabatic transport would also result in charge state‐dependent energy gain (the energy gained would still be q • E • d whether the motion parallel to the electric field E was adiabatic or not), extreme nonadiabatic transport would not result in the observed q‐dependent drifts in the azimuthal direction (well‐behaved drift echoes), and one might expect quite different behavior of O+ (large gyroradii) relative to H+. For example, if Speiser motion dominated the transport (as indeed it may at high energies in the magnetotail), particles would drift across the flow channel much more quickly than the gradient drift speed, resulting in considerably different flux tube profiles and time histories for similar energies of H+ and O+. Their demonstrated close correlations argue that for transport from the near tail to the inner magnetosphere, both species move along nearly identical drift paths over a very broad range of energies, even up to over 1 MeV.
Because He++ is characteristic of freshly injected plasma sheet plasma but uncharacteristic of closed drift path, quiet time plasma near Van Allen Probe apogee, it makes an especially good diagnostic particle to establish the parameters for a particular injection flow channel. It stands out uniquely relative to the background plasma, unlike either H+ or O+.
5. Summary
In our analysis of the Van Allen Probes RBSPICE data (section 3) we have shown that individual injections, as well as entire sequences of activity including multiple injections demonstrate the characteristics of nearly (pitch angle averaged) adiabatic transport. These features include the peak observed energy for each species (charge state), as well as the drift speeds of the species and the widths of the injection features as a function of time and energy.
A very simple model reproduces the key features of the analyzed injections (section 4). The model assumes adiabatic transport in a defined channel from the near‐Earth plasma sheet to inside geosynchronous, with a constant electric field across the channel. It does not specify the nature of the electric field, other than to use a plasma bulk velocity consistent with the electric field. The strength of the model is its simplicity—it allows certain parameters of flow channels to be fit from the observations, and because it requires very little computation, it allows for quick iteration. The results of such modeling can provide constraints on the parameters of more computationally intensive physical models, where iteration is costly. The fact that the basic parameters of the injections are reproduced by the model suggests that other than pitch angle scattering, transport from the plasma sheet to the inner magnetosphere is very close to adiabatic, even to ion energies as high as 1 MeV.
Acknowledgments
This research was supported under JHU/APL Subcontract 937836 to the New Jersey Institute of Technology under NASA Prime Contract NAS5‐01072. D. G. M. is grateful for useful conversations with Barry Mauk and Chris Paranicas and for the support of the RBSPICE Science Team, the RBSPICE Science Operations Center at Fundamental Technologies, the developers of the RBSPICEMIDL software at APL, and the RBSPICE Principal Investigator Louis J. Lanzerotti. The data used in the figures presented in this paper are all available on line though the RBSPICE Science Operations Center at http://rbspice.ftecs.com/. Model details are archived at https://doi.org/10.5281/zenodo.1218730.
Mitchell, D. G. , Gkioulidou, M. , & Ukhorskiy, A. Y. (2018). Energetic ion injections inside geosynchronous orbit: Convection‐ and drift‐dominated, charge‐dependent adiabatic energization (W = qEd). Journal of Geophysical Research: Space Physics, 123, 6360–6382. 10.1029/2018JA025556
References
- Allen, R. C. , Livi, S. A. , & Goldstein, J. (2016). Variations of oxygen charge state abundances in the global magnetosphere, as observed by polar. Journal of Geophysical Research: Space Physics, 121, 1091–1113. 10.1002/2015JA021765 [DOI] [Google Scholar]
- Angelopoulos, V. , Baumjohann, W. , Kennel, C. F. , Coroniti, F. V. , Kivelson, M. G. , Pellat, R. , et al. (1992). Bursty bulk flows in the inner central plasma sheet. Journal of Geophysical Research, 97(A4), 4027–4039. 10.1029/91JA02701 [DOI] [Google Scholar]
- Angelopoulos, V. , Kennel, C. F. , Coroniti, F. V. , Pellat, R. , Kivelson, M. G. , Walker, R. J. , et al. (1994). Statistical characteristics of bursty bulk flow events. Journal of Geophysical Research, 99(A11), 21,257–21,280. 10.1029/94JA01263 [DOI] [Google Scholar]
- Angelopoulos, V. , Phan, T. D. , Larson, D. E. , Mozer, F. S. , Lin, R. P. , Tsuruda, K. , et al. (1994). Magnetotail flow bursts: Association to global magnetospheric circulation, relationship to ionospheric activity and direct evidence for localization. Geophysical Research Letters, 24, 2271–2274. 10.1029/97GL02355 [DOI] [Google Scholar]
- Baker, D. N. , Belian, R. D. , Higbie, P. R. , & Hones, E. W. Jr. (1979). High‐energy magnetospheric protons and their dependence on geomagnetic and interplanetary conditions. Journal of Geophysical Research, 84(A12), 7138–7154. 10.1029/JA084iA12p07138 [DOI] [Google Scholar]
- Baumjohann, W. , Paschmann, G. , & Lühr, H. (1990). Characteristics of high‐speed ion flows in the plasma sheet. Journal of Geophysical Research, 95(A4), 3801–3809. 10.1029/JA095iA04p03801 [DOI] [Google Scholar]
- Birn, J. , Thomsen, M. F. , Borovsky, J. E. , Reeves, G. D. , McComas, D. J. , Belian, R. D. , & Hesse, M. (1997). Substorm ion injections: Geosynchronous observations and test particle orbits in three‐dimensional dynamic MHD fields. Journal of Geophysical Research, 102(A2), 2325–2341. 10.1029/96JA03032 [DOI] [Google Scholar]
- Blake, J. B. , Fennell, J. F. , Baker, D. N. , Belian, R. D. , & Higbie, P. R. (1983). A determination of the charge state of energetic magnetospheric ions by the observation of drift echoes. Geophysical Research Letters, 10(12), 1211–1214. 10.1029/GL010i012p01211 [DOI] [Google Scholar]
- Bochsler, P. (2000). Abundances and charge states of particles in the solar wind. Reviews of Geophysics, 38(2), 247–266. 10.1029/1999RG000063 [DOI] [Google Scholar]
- Chenette, D. L. , Blake, J. B. , & Fennell, J. F. (1984). The charge state composition of 0.4‐MeV helium ions in Earth's outer radiation belts during quiet times, Space Sciences The Laboratory of the Aerospace Corporation, Report SD‐TR‐84‐48, 30 September, 1984.
- Christon, S. P. , Mall, U. , Eastman, T. E. , Gloeckler, G. , Lui, A. T. Y. , McEntire, R. W. , & Roelof, E. C. (2002). Solar cycle and geomagnetic N+1/O+1 variation in outer dayside magnetosphere: Possible relation to topside ionosphere. Geophysical Research Letters, 29(5), 1058 10.1029/2001GL013988 [DOI] [Google Scholar]
- Daglis, I. A. , Livi, S. , Sarris, E. T. , & Wilken, B. (1994). Energy density of ionospheric and solar wind origin ions in the near‐Earth magnetotail during substorms. Journal of Geophysical Research, 99(A4), 5691–5703. 10.1029/93JA02772 [DOI] [Google Scholar]
- Daglis, I. A. , Thorne, R. M. , Baumjohann, W. , & Orsini, S. (1999). The terrestrial ring current: Origin, formation, and decay. Reviews of Geophysics, 37(4), 407–438. 10.1029/1999RG900009 [DOI] [Google Scholar]
- Delcourt, D. C. (2002). Particle acceleration by inductive electric fields in the inner magnetosphere. Journal of Atmospheric and Solar ‐ Terrestrial Physics, 64(5‐6), 551–559. 10.1016/S1364-6826(02)00012-3 [DOI] [Google Scholar]
- Fok, M. , Moore, T. E. , Brandt, P. C. , Delcourt, D. C. , Slinker, S. P. , & Fedder, J. A. (2006). Impulsive enhancements of oxygen ions during substorms. Journal of Geophysical Research, 111, A10222 10.1029/2006JA011839 [DOI] [Google Scholar]
- Forster, D. R. , Denton, M. H. , Grande, M. , & Perry, C. H. (2013). Inner magnetospheric heavy ion composition during high-speed stream-driven storms. Journal of Geophysical Research: Space Physics, 118, 4066–4079. 10.1002/jgra.50292 [DOI] [Google Scholar]
- Gabrielse, C. , Angelopoulos, V. , Runov, A. , & Turner, D. L. (2012). The effects of transient, localized electric fields on equatorial electron acceleration and transport toward the inner magnetosphere. Journal of Geophysical Research, 117, A10213 10.1029/2012JA017873 [DOI] [Google Scholar]
- Gabrielse, C. , Angelopoulos, V. , Runov, A. , & Turner, D. L. (2014). Statistical characteristics of particle injections throughout the equatorial magnetotail. Journal of Geophysical Research: Space Physics, 119, 2512–2535. 10.1002/2013JA019638 [DOI] [Google Scholar]
- Gerrard, A. , Lanzerotti, L. , Gkioulidou, M. , Mitchell, D. , Manweiler, J. , & Bortnik, J. (2014). Quiet time observations of He ions in the inner magnetosphere as observed from the RBSPICE instrument aboard the van Allen probes mission. Geophysical Research Letters, 41, 1100–1105. 10.1002/2013GL059175 [DOI] [Google Scholar]
- Gkioulidou, M. , Ukhorskiy, A. Y. , Mitchell, D. G. , & Lanzerotti, L. J. (2016). Storm time dynamics of ring current protons: Implications for the long‐term energy budget in the inner magnetosphere. Geophysical Research Letters, 43, 4736–4744. 10.1002/2016GL068013 [DOI] [Google Scholar]
- Gloeckler, G. , & Geiss, J. (1989). The abundances of elements and isotopes in the solar wind In Waddington C. (Ed.), Proceedings of the symposium on cosmic abundances of matter, Conf. Proc., (Vol. 183, pp. 49–71). New York: Am. Inst. of Phys. [Google Scholar]
- Gloeckler, G. , & Hamilton, D. C. (1987). AMPTE ion composition results. Physica Scripta, T18, 73–84. 10.1088/0031-8949/1987/T18/009 [DOI] [Google Scholar]
- Keika, K. , Kistler, L. M. , & Brandt, P. C. (2013). Energization of O+ ions in the Earth's inner magnetosphere and the effects on ring current buildup: A review of previous observations and possible mechanisms. Journal of Geophysical Research: Space Physics, 118, 4441–4464. 10.1002/jgra.50371 [DOI] [Google Scholar]
- Kistler, L. M. , Ipavich, F. M. , Hamilton, D. C. , Gloeckler, G. , & Wilken, B. (1989). Energy spectra of the major ion species in the ring current during geomagnetic storms. Journal of Geophysical Research, 94(A4), 3579–3599. 10.1029/JA094iA04p03579 [DOI] [Google Scholar]
- Konradi, A. , Semar, C. L. , & Fritz, T. A. (1975). Substorm‐injected protons and electrons and the injection boundary model. Journal of Geophysical Research, 80(4), 543–552. 10.1029/JA080i004p00543 [DOI] [Google Scholar]
- Korth, A. , Friedel, R. H. W. , Frutos‐Alfaro, F. , Mouikis, C. G. , & Zong, Q. (2001). Ion compositions of substorms during storm‐time and non‐storm‐time periods. Journal of Atmospheric and Solar ‐ Terrestrial Physics, 64(5–6), 561–566. 10.1016/S1364-6826(02)00013-5 [DOI] [Google Scholar]
- Korth, A. , Friedel, R. H. W. , Henderson, M. G. , Frutos‐Alfaro, F. , & Mouikis, C. G. (2003). O+ transport in the ring current: Storm versus substorm In Disturbances in geospace: The storm‐substorm relationship, Geophysical Monograph Series (Vol. 142, pp. 59–73). Washington, DC: American Geophysical Union; 10.1029/142GM07 [DOI] [Google Scholar]
- Kremser, G. , Stüdemann, W. , Wilken, B. , Gloeckler, G. , Hamilton, D. C. , & Ipavich, F. M. (1988). Observations of energetic oxygen and carbon ions with charge states between 3 and 6 in the magnetosphere. Annales de Geophysique, 6(3), 325–334. [Google Scholar]
- Kremser, G. , Stüdemann, W. , Wilken, B. , Gloeckler, G. , Hamilton, D. C. , Ipavich, F. M. , & Hovestadt, D. (1985). Charge state distributions of oxygen and carbon in the energy range 1 to 300 keV/e observed with AMPTE/CCE in the magnetosphere. Geophysical Research Letters, 12(12), 847–850. 10.1029/GL012i012p00847 [DOI] [Google Scholar]
- Kronberg, E. A. , Haaland, S. E. , Daly, P. W. , Grigorenko, E. E. , Kistler, L. M. , Fränz, M. , & Dandouras, I. (2012). Oxygen and hydrogen ion abundance in the near‐Earth magnetosphere: Statistical results on the response to the geomagnetic and solar wind activity conditions. Journal of Geophysical Research, 117, A12208 10.1029/2012JA018071 [DOI] [Google Scholar]
- Lanzerotti, L. J. , Roberts, C. S. , & Brown, W. L. (1967). Temporal variations in the electron flux at synchronous altitudes. Journal of Geophysical Research, 72(23), 5893–5902. 10.1029/JZ072i023p05893 [DOI] [Google Scholar]
- Li, X. , Sarris, T. E. , Baker, D. N. , Peterson, W. K. , & Singer, H. J. (2003). Simulation of energetic particle injections associated with a substorm on August 27, 2001. Geophysical Research Letters, 30(1), 1004 10.1029/2002GL015967 [DOI] [Google Scholar]
- Lyons, L. R. , Nishimura, Y. , Xing, X. , Runov, A. , Angelopoulos, V. , Donovan, E. , & Kikuchi, T. (2012). Coupling of dipolarization front flow bursts to substorm expansion phase phenomena within the magnetosphere and ionosphere. Journal of Geophysical Research, 117, A02212 10.1029/2011JA017265 [DOI] [Google Scholar]
- Maggiolo, R. , & Kistler, L. M. (2014). Spatial variation in the plasma sheet composition: Dependence on geomagnetic and solar activity. Journal of Geophysical Research: Space Physics, 119, 2836–2857. 10.1002/2013JA019517 [DOI] [Google Scholar]
- Mauk, B. , & Meng, C.‐I. (1983). Characterization of geostationary particle signatures based on the 1368 “injection boundary” mode. Journal of Geophysical Research, 88(A4), 3055–3071. 10.1029/JA088iA04p03055 [DOI] [Google Scholar]
- McIlwain, C. (1974). Substorm injection boundaries In McCormac B. M. (Ed.), Magnetospheric physics (pp. 143–154). Hingham, Mass: D. Reidel. [Google Scholar]
- McPherron, R. L. , Hsu, T.‐S. , Kissinger, J. , Chu, X. , & Angelopoulos, V. (2011). Characteristics of plasma flows at the inner edge of the plasma sheet. Journal of Geophysical Research, 116, A00I33 10.1029/2010JA015923 [DOI] [Google Scholar]
- Mitchell, D. G. , Brandt, P. C. , & Mende, S. B. (2005). Oxygen in the ring current during major storms. Advances in Space Research, 36(10), 1758–1761. 10.1016/j.asr.2004.03.025 [DOI] [Google Scholar]
- Mitchell, D. G. , Lanzerotti, L. J. , Kim, C. K. , Stokes, M. , Ho, G. , Cooper, S. , et al. (2013). Radiation Belt Storm Probes Ion Composition Experiment (RBSPICE). Space Science Reviews, 179(1‐4), 263–308. 10.1007/s11214-013-9965-x [DOI] [PMC free article] [PubMed] [Google Scholar]
- Mouikis, C. G. , Kistler, L. M. , Liu, Y. H. , Klecker, B. , Korth, A. , & Dandouras, I. (2010). The H+ and O+ content of the plasma sheet at 15–19 Re as a function of geomagnetic and solar activity. Journal of Geophysical Research, 115, A00J16 10.1029/2010JA015978 [DOI] [Google Scholar]
- Nosé, M. , Ohtani, S. , Lui, A. T. Y. , Christon, S. P. , McEntire, R. W. , Williams, D. J. , et al. (2000). Change of energetic ion composition in the plasma sheet during substorms. Journal of Geophysical Research, 105(A10), 23,277–23,286. 10.1029/2000JA000129 [DOI] [Google Scholar]
- Ohtani, S. , Nosé, M. , Christon, S. P. , & Lui, A. T. Y. (2011). Energetic O+ and H+ ions in the plasma sheet: Implications for the transport of ionospheric ions. Journal of Geophysical Research, 116, A10211 10.1029/2011JA016532 [DOI] [Google Scholar]
- Ono, Y. , Nosé, M. , Christon, S. P. , & Lui, A. T. Y. (2009). The role of magnetic field fluctuations in nonadiabatic acceleration of ions during dipolarization. Journal of Geophysical Research, 114, A05209 10.1029/2008JA013918 [DOI] [Google Scholar]
- Runov, A. , Angelopoulos, V. , Sitnov, M. I. , Sergeev, V. A. , Bonnell, J. , McFadden, J. P. , et al. (2009). THEMIS observations of an earthward‐propagating dipolarization front. Geophysical Research Letters, 36, L14106 10.1029/2009GL038980 [DOI] [Google Scholar]
- Sergeev, V. A. , Chernyaev, I. A. , Dubyagin, S. V. , Miyashita, Y. , Angelopoulos, V. , Boakes, P. D. , et al. (2012). Energetic particle injections to geostationary orbit: Relationship to flow bursts and magnetospheric state. Journal of Geophysical Research, 117, A10207 10.1029/2012JA017773 [DOI] [Google Scholar]
- Sharp, R. D. , Johnson, R. G. , Lennartson, W. , Peterson, W. K. , & Shelley, E. G. (1983). Hot plasma composition results from the ISEE‐1 spacecraft In Johnson R. G. (Ed.), Energetic ion composition in the Earth's magnetosphere (pp. 231–261). Tokyo: Terra Sci; 10.1007/978-94-009-7105-9_9 [DOI] [Google Scholar]
- Speiser, T. W. (1965). Particle trajectories in model current sheets: 1. Analytical solutions. Journal of Geophysical Research, 70(17), 4219–4226. 10.1029/JZ070i017p04219 [DOI] [Google Scholar]
- Spjeldvik, W. N. , & Fritz, T. A. (1978). Energetic ionized helium in the quiet time radiation belts: Theory and comparison with observation. Journal of Geophysical Research, 83(A2), 654–662. 10.1029/JA083iA02p00654 [DOI] [Google Scholar]
- Ukhorskiy, A. Y. , Sitnov, M. I. , Merkin, V. G. , Gkioulidou, M. , & Mitchell, D. G. (2017). Ion acceleration at dipolarization fronts in the inner magnetosphere. Journal of Geophysical Research: Space Physics, 122, 3040–3054. 10.1002/2016JA023304 [DOI] [Google Scholar]
- Wiltberger, M. , Merkin, V. , Lyon, J. G. , & Ohtani, S. (2015). High‐resolution global magnetohydrodynamic simulation of bursty bulk flows. Journal of Geophysical Research: Space Physics, 120, 4555–4566. 10.1002/2015JA021080 [DOI] [Google Scholar]
- Yang, J. , Toffoletto, F. R. , Wolf, R. A. , & Sazykin, S. (2011). RCM‐E simulation of ion acceleration during an idealized plasma‐sheet bubble injection. Journal of Geophysical Research, 116, A05201 10.1029/2010JA16346 [DOI] [Google Scholar]
- Young, D. T. (1980). Synoptic studies of magnetospheric composition. Switzerland: Habilitationsschrift, University of Bern. [Google Scholar]
- Zaharia, S. , Cheng, C. Z. , & Johnson, J. R. (2000). Particle transport and energization in association with substorms. Journal of Geophysical Research, 105(A8), 18,741–18,752. 10.1029/1999JA000407 [DOI] [Google Scholar]
- Zhang, J.‐C. , Wolf, R. A. , Spiro, R. W. , Erickson, G. M. , Sazykin, S. , Toffoletto, F. R. , & Yang, J. (2009). Rice Convection Model simulation of the injection of an observed bubble into the inner magnetosphere: 2. Simulation results. Journal of Geophysical Research, 114, A08219 10.1029/2009JA014131 [DOI] [Google Scholar]


