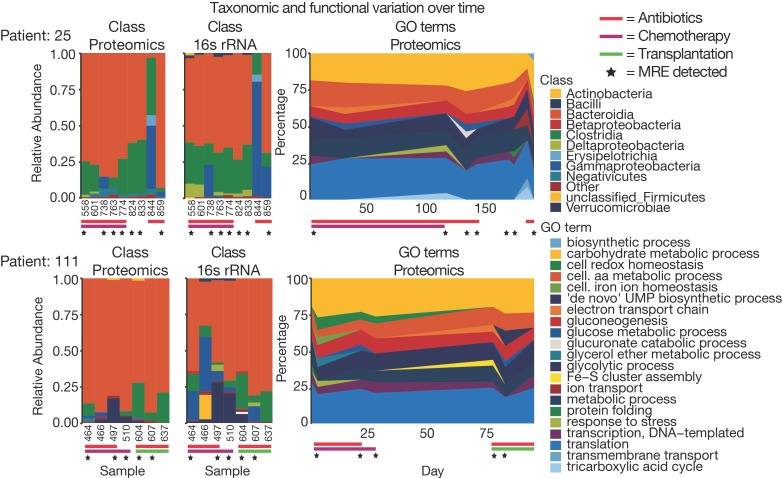
Figure 6.
Comparing taxonomic and functional data for longitudinal samples. Taxonomic class abundances retrieved from proteomic and 16S rRNA data as well as GO term abundances were compared for samples for two patients over time. In addition, antibiotic treatment at sampling time point and type of hospital admission (i.e., chemotherapy or transplantation) for the sampling time is indicated.

