

Abstract
Background
Fluphenazine is a typical antipsychotic drug from the phenothiazine group of antipsychotics. It has been commonly used in the treatment of schizophrenia, however, with the advent of atypical antipsychotic medications, use has declined over the years.
Objectives
To measure the outcomes (both beneficial and harmful) of the clinical effectiveness, safety and cost‐effectiveness of oral fluphenazine versus atypical antipsychotics for schizophrenia.
Search methods
We searched the Cochrane Central Register of Studies (25 April 2013). For the economic search, we searched the Cochrane Schizophrenia Group Health Economic Database (CSzGHED) on 31 January 2014
Selection criteria
All randomised controlled trials (RCTs) comparing fluphenazine (oral) with any other oral atypical antipsychotics.
Data collection and analysis
Review authors worked independently to inspect citations and assess the quality of the studies and to extract data. For homogeneous dichotomous data we calculated the risk ratio (RR) and 95% confidence interval (CI), and calculated the mean differences (MDs) for continuous data. We assessed risk of bias for included studies and used GRADE (Grading of Recommendations Assessment, Development and Evaluation) to rate the quality of the evidence.
Main results
Four studies randomising a total of 202 people with schizophrenia are included. Oral fluphenazine was compared with oral amisulpride, risperidone, quetiapine and olanzapine.
Comparing oral fluphenazine with amisulpride, there was no difference between groups for mental state using the Brief Psychiatric Rating Scale (BPRS) (1 RCT, n = 57, MD 5.10 95% CI ‐2.35 to 12.55, very low‐quality evidence), nor was there any difference in numbers leaving the study early for any reason (2 RCTs, n = 98, RR 1.19 95% CI 0.63 to 2.28, very low‐quality evidence). More people required concomitant anticholinergic medication in the fluphenazine group compared to amisulpride (1 RCT, n = 36, RR 7.82 95% CI 1.07 to 57.26, very low‐quality evidence). No data were reported for important outcomes including relapse, changes in life skills, quality of life or cost‐effectiveness.
Comparing oral fluphenazine with risperidone, data showed no difference between groups for 'clinically important response' (1 RCT, n = 26, RR 0.67 95% CI 0.13 to 3.35, very low‐quality evidence) nor leaving the study early due to inefficacy (1 RCT, n = 25, RR 1.08 95% CI 0.08 to 15.46, very low‐quality evidence). No data were reported data for relapse; change in life skills; quality of life; extrapyramidal adverse effects; or cost‐effectiveness.
Once again there was no difference when oral fluphenazine was compared with quetiapine for clinically important response (1 RCT, n = 25, RR 0.62 95% CI 0.12 to 3.07, very low‐quality evidence), nor leaving the study early for any reason (1 RCT, n = 25, RR 0.46 95% CI 0.05 to 4.46, very low‐quality evidence). No data were reported for relapse; clinically important change in life skills; quality of life; extrapyramidal adverse effects; or cost‐effectiveness.
Compared to olanzapine, fluphenazine showed no superiority for clinically important response (1 RCT, n = 60, RR 1.33 95% CI 0.86 to 2.07, very low‐quality evidence), in incidence of akathisia (1 RCT, n = 60, RR 3.00 95% CI 0.90 to 10.01, very low‐quality evidence) or in people leaving the study early (1 RCT, n = 60, RR 3.00 95% CI 0.33 to 27.23, very low‐quality evidence). No data were reported for relapse; change in life skills; quality of life; or cost‐effectiveness.
Authors' conclusions
Measures of clinical response and mental state do not highlight differences between fluphenazine and amisulpride, risperidone, quetiapine or olanzapine. Largely measures of adverse effects are also unconvincing for substantive differences between fluphenazine and the newer drugs. All included trials carry a substantial risk of bias regarding reporting of adverse effects and this bias would have favoured the newer drugs. The four small short included studies do not provide much clear information about the relative merits or disadvantages of oral fluphenazine compared with newer atypical antipsychotics.
Plain language summary
Comparing effectiveness of an older antipsychotic (oral fluphenazine) with newer antipsychotics for treating schizophrenia
Introduction People with schizophrenia often hear voices or see things (hallucinations) and have strange beliefs (delusions). It is a distressing and debilitating illness. The main treatment for schizophrenia is antipsychotic drugs. Fluphenazine is an older antipsychotic drug first formulated in the 1950s, effective for treating the psychoses of schizophrenia. However fluphenazine can cause some serious side effects, particularly movement disorders, and is known to lower people’s mood. Fluphenazine is inexpensive but the arrival of newer antipsychotic drugs with fewer movement disorder side effects reduced its use and market share.
Methods An electronic search of Cochrane Schizophrenia's register of studies was carried out in 2013. Review authors looked for trials that randomised people with schizophrenia to receive either oral fluphenazine or an atypical antipsychotic. Four studies with a total of 202 people with schizophrenia could be included. The trials compared fluphenazine with either amisulpride, risperidone, quetiapine or olanzapine.
Results Data showed oral fluphenazine is no better or worse in improving mental state than amisulpride but more people receiving oral fluphenazine did need to take additional anticholinergic medication (drugs used to help relieve a range of symptoms such as involuntary movements of the muscles, high blood pressure and insomnia).
Data from the trials comparing oral fluphenazine with either risperidone, quetiapine or olanzapine also showed no superiority between the treatment groups for clinical improvement. Only the trial comparing oral fluphenazine with olanzapine provided adverse‐effects data. Again, incidence of akathisia, a movement disorder, was similar between treatment groups.
Quality of evidence Evidence from these few trials is poor, of low quality and involves a small number of participants. It does not provide clear overall information about whether oral fluphenazine is better or worse than atypical antipsychotic drugs for treating people with schizophrenia. Data were not available for important outcomes such as such, relapse, hospital admission, satisfaction, costs and quality of life. Adverse‐effects data were poorly reported. Future large‐scale research should report on these important outcomes.
Conclusions Fluphenazine is low cost and widely available, so is likely to remain one of the most widely used treatments for schizophrenia worldwide. However, evidence currently available from randomised controlled trials about its effectiveness compared to atypical antipsychotics is unclear.
Summary of findings
Background
Description of the condition
Schizophrenia is a psychotic disorder that can present with a variety of psychotic, cognitive and affective symptoms. It generally follows a chronic course with acute relapses and (often partial) remission. Schizophrenia is diagnosed in approximately 15.2 people per 100,000 per year (McGrath 2008). The prevalence is higher, at 4.6 per 1000 (Saha 2005), which is another sign of the chronicity of the condition. Heritability studies indicate a significant genetic component to the aetiology, however attempts to discover genes that directly cause schizophrenia have not been fruitful. Many environmental risk factors (such as urbanicity, deprivation, migrant status, fetal anoxia, childhood abuse, cannabis misuse etc.) have been shown to increase the risk of developing schizophrenia. Hence, it is currently hypothesised that the aetiology is a polygenic susceptibility to schizophrenia in individuals, which interacts with environmental risk factors. Research is increasingly focusing on these genetic and environmental interactions (van Os 2008). Symptoms are often sub‐divided into 'positive' and 'negative' symptoms: positive symptoms include delusions (fixed false beliefs) and hallucinations (perceptions in the absence of an external stimulus). Negative symptoms are harder to define but often involve reductions in emotional and executive functioning, for example flattened affect, self‐neglect, social isolation and apathy. Morbidity is considerable, with the majority of sufferers unable to work (Marvaha 2004). There is also increased mortality ‐ particularly due to suicide (Healy 2012).
Description of the intervention
Antipsychotics are the most effective available treatment for schizophrenia and are most effective at treating the positive symptoms of schizophrenia, however they are poorer at treating the negative symptoms (Kane 1986). Antipsychotics can be classified in a number of ways; commonly they are divided into typical and atypical groups. Fluphenazine, developed by Bristol Myers‐Squibb and approved by the US Food and Drug Administration (FDA) in 1959, is a typical antipsychotic piperazine drug from the phenothiazine group of antipsychotics. It is available as a tablet, short‐acting injection or long‐acting injection. Originally, fluphenazine was used in Britain for the treatment of anxiety, until American reports highlighted its potential for the treatment of psychotic illness (Darling 1959; Millar 1963). Since then, it has been commonly used in the treatment of schizophrenia; it is acknowledged as an essential medicine by the World Health Organization (WHO) and widely used internationally (WHO 2005). However, with the advent of atypical antipsychotic medications, use has declined over the years.
How the intervention might work
Multiple lines of evidence point to an excess of dopaminergic neuro‐transmission in schizophrenia. All antipsychotics are thought to be effective by reducing dopamine receptor activity, usually by dopamine blockade in the mesolimbic area of the brain (Grace 1991). Fluphenazine ( 2‐[4‐[3‐[2‐(trifluoromethyl)‐10H‐phenothiazin‐10‐yl]propyl]piperazin‐1‐yl]ethanol, Figure 1) is a high‐potency D2 antagonist and also blocks D1a receptors post‐synaptically (Seeman 2002). It is not wholly specific: this and other receptor activities account for its side‐effect profile. These side effects range from hypotension secondary to alpha‐adrenergic blockade, anticholinergic symptoms and extrapyramidal side effects (EPSEs) (tardive dyskinesia, muscle rigidity, tremor, dystonias and akathisia). It can also induce the neuroleptic malignant syndrome. It has variable inter‐individual bioavailability and undergoes extensive first‐pass metabolism. Peak plasma levels occur within hours and half‐life is approximately 15 hours (Dencker 1988; Dysken 1981).
1.
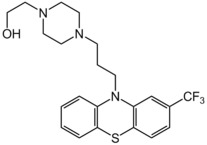
Fluphenazine structure
Why it is important to do this review
Recent guidelines support the use of atypical antipsychotics as the first‐line treatment in schizophrenia (APA 2004). Pharmaceutical companies have marketed atypical medications as being superior to typicals in terms of their efficacy and tolerability (Kendall 2011), whereas recent trials dispute this supposed advantage (Jones 2006; Leucht 2009; Lieberman 2005). It is acknowledged that typical drugs may have a higher propensity for EPSEs than many atypical drugs, many of which are more likely to induce the metabolic syndrome. However, EPSEs can often be avoided by low‐dose prescribing. There are increasing concerns about the cardiovascular risks associated with long‐term use of atypical antipsychotics. Additionally, it is the inexpensive typical antipsychotics that are more heavily used instead of the more expensive atypical options in the developing world. It is the accumulation of such factors that have renewed interest in researching the efficacy and tolerability of typical antipsychotics. Currently there is a lack of research evidence on fluphenazine versus atypical antipsychotics and this review aims to draw together the existing evidence.
In terms of the costs of schizophrenia, this was estimated at about £6.7 billion in England in 2004/05, of which the direct costs were £2 million while the indirect costs accounted for the rest (Mangalore 2007). The cost of fluphenazine (oral) itself is inexpensive compared to other atypical antipsychotics, at £1.88 for a 10 milligram (mg) tablet. The maximum daily dose of fluphenazine (oral) is 10 mg per day, which costs £1.88 per day, or £56.40 per month (fluphenazine oral is not present in the BNF ‐ the cost was in US Dollars and was converted to GBP on 31st January 2014 at the prevailing exchange rate on that day). The atypical antipsychotics in comparison are more expensive than typical antipsychotics, with olanzapine available at £13.11 for 28 5 mg tablets, and clozapine (Clozaril) at £21.56 for 28 100 mg tablets. It is important to complement the clinical effectiveness of fluphenazine (oral) with its cost‐effectiveness; Davies and colleagues (Davies 2007) conducted a study on cost‐effectiveness of the first‐generation antipsychotics (i.e. flupentixol, trifluoperazine, chlorpromazine) and the second generation antipsychotics (i.e. risperidone, olanzapine, amisulpride). The study findings argue that there is no evidence to suggest that atypical (second generation) antipsychotics are more cost‐effective than typical (first‐generation) antipsychotics.
This is one of a family of related Cochrane reviews (Table 5).
1. Fluphenazine family of reviews.
| Intervention | Means of delivery | Comparison | Review |
| Fluphenazine | Oral | Placebo | Matar 2013 |
| Low‐potency first‐generation antipsychotic drugs | Tardy 2014 | ||
| Depot | Any | Maayan 2015 |
Objectives
To measure the outcomes (both beneficial and harmful) of the clinical effectiveness, safety and cost‐effectiveness of oral fluphenazine versus atypical antipsychotics for schizophrenia.
Methods
Criteria for considering studies for this review
Types of studies
All relevant randomised controlled trials (RCTs). We planned to include data from cross‐over trials only until the point of the first cross‐over as thereafter data tend to become unstable. If trials were described as 'double‐blind' but implied randomisation, we included them in a sensitivity analysis (see Sensitivity analysis). We excluded quasi‐randomised studies, such as those allocating by alternate days of the week. Where people were given additional treatments with oral fluphenazine, we only included data if the adjunct treatment was evenly distributed between groups and it was only the oral fluphenazine that was randomised.
With regards to selecting studies for economic evaluations, review authors (SS and VF) categorised studies as follows. Type A ‐ Full economic evaluation (within the framework of RCTs): studies that focus on cost‐effectiveness analysis, cost‐utility analysis and cost‐benefit analysis. Type B ‐ Partial economic evaluation (within the framework of RCTs): studies that focus on cost‐analysis and cost‐minimisation studies of fluphenazine (oral). Type C ‐ Randomised trials that reported limited information, such as estimates of resources use or costs associated with fluphenazine (oral).
Types of participants
Adults (aged 18 and over) with schizophrenia or related disorders, including schizophreniform disorder, schizoaffective disorder and delusional disorder, again by any means of diagnosis. We excluded children and people with dementing illnesses, depression and primary problems associated with substance misuse. We are interested in making sure that information is as relevant to the current care of people with schizophrenia as possible so aimed to highlight clearly the current clinical state (acute, early post‐acute, partial remission, remission) as well as the stage (prodromal, first episode, early illness, persistent) and whether the studies primarily focused on people with particular problems (for example, negative symptoms, treatment‐resistant illnesses).
Types of interventions
1. Oral fluphenazine
Any dose or form of oral application (i.e. not depot or short‐acting parenteral).
2. Atypical oral antipsychotics
Any dose or form of oral atypical antipsychotics.
Types of outcome measures
We divided outcomes into short term (up to 12 weeks), medium term (13 to 26 weeks) and long term (over 26 weeks).
Primary outcomes
1. Clinically important response (as defined by the individual studies)
1.1 Global impression ‐ ≥ 50% improvement on any relevant rating scale
Secondary outcomes
1. Death
1.1 Suicide 1.2 Natural causes
2. Global state
2.1 Clinically important change in global state (as defined by individual studies) 2.2 Average endpoint/change in global state score 2.3 Relapse (as defined in each study)
3. Service outcomes
3.1 Hospitalisation/re‐hospitalisation 3.2 Time to hospitalisation
4. Mental state
4.1 Clinically important change in general mental state 4.2 Average endpoint/change in general mental state score 4.3 Clinically important change in specific symptoms (positive/negative symptoms and depression scores)
5. General functioning
5.1 Clinically important change in general functioning 5.2 Average endpoint/change in general functioning score 5.3 Clinically important change in specific aspects of functioning (including social skills, life skills, employment) 5.4 Average endpoint/change in specific aspects of functioning (including social skills, life skills, employment)
6. Quality of life
6.1 Clinically important change in quality of life 6.2 Average endpoint/change in quality of life score
7. Satisfaction with treatment
7.1 Clinically important change in levels of satisfaction 7.2 Average endpoint/change in satisfaction
8. Adverse effects ‐ general and specific
8.1 Clinically important general/specific adverse effects 8.2 Average endpoint/change in general/specific adverse effect score
9. Extrapyramidal adverse effects
9.1 Any clinically significant extrapyramidal adverse effects 9.2 Any clinically significant extrapyramidal side effects (EPSEs) ‐ as defined by each study 9.3 Average score/change in EPSEs 9.4 Incidence of use of antiparkinson drugs 9.5 Dystonia 9.6 Akathisia 9.7 Akinesia
10. Leaving the study early ‐ any reason
10.1 Leaving the study early ‐ due to inefficacy of the intervention 10.2 Leaving the study early due to side effects
11. Economic outcomes
11.1 Average change in total cost of medical and mental health care 11.2 Total indirect and direct costs 11.3 Direct resource use: 11.3.1 Outpatients ‐ number of contacts (GP consultation, psychiatrist, psychologists, psychiatric nurse, counsellor, social worker) 11.3.2 Hospitalisation (taking battery of tests, patients’ physical, psychiatric and psychological profile and psychological assessment, number of days, relapse) 11.3.3 Medication (different types of antipsychotics to include dose and frequency, treatment of side effects) 11.3.4 Psychological therapies (different types of psychological therapies to include session numbers and frequency) 11.3.5 Other resources (day centres, night shelter) and transportation for medical care visits 11.4 Indirect resource use: 11.4.1 Family, relative and friends resources 11.4.2 Police, criminal justice system 11.4.3 Benefits paid, social security payments 11.4.4 Employment agency workers, absence from work, loss of productivity 11.5 Cost‐effectiveness ratios represented by the incremental cost‐effectiveness ratio (ICER) 11.6 Cost‐utilities represented by incremental costs per quality‐adjusted life year (QALY) or disability adjusted life year (DALY) 11.7 Cost‐benefit represented by net Benefit Ratio, others
12. 'Summary of findings' table
We used the GRADE approach to interpret findings (Schünemann 2008) and used GRADE profiler (GRADEPRO) to import data from RevMan 5 (Review Manager) to create 'Summary of findings' tables. These tables provide outcome‐specific information concerning the overall quality of evidence from each included study in the comparison, the magnitude of effect of the interventions examined, and the sum of available data on all outcomes we rated as important to patient care and decision making. We selected the following main outcomes for inclusion in the 'Summary of findings' table:
Clinically important response in mental state (short, medium and long term)
Relapse (long term)
Clinically important change in life skills (long term)
Quality of life (long term)
Adverse effects, e.g. EPSEs (medium term)
Leaving the study early: any reason (medium term)
Cost‐effectiveness (long term)
Search methods for identification of studies
Electronic searches
We searched the Central Register of Studies (25 April 2013) using the phrase:
("*clozapin*":TI OR "* clozaril*":TI OR "* leponex*":TI OR "*aripiprazole*":TI OR "*olanzapin*":TI OR "*lanzac*":TI OR "*zyprex*":TI OR "*quetiapin*":TI OR "*seroquel*":TI OR "*risperidon*":TI OR "*belivon*":TI OR "*risperdal*":TI OR "*risperin*":TI OR "*rispolin*":TI OR "*sertindol*":TI OR "*serdolect*":TI OR "*serlect*":TI OR "*ziprasidon*":TI OR "*zotepin*":TI OR "*lodopin*":TI OR "*nipolept*":TI OR "*zopite*":TI OR "*setous*":TI OR "*majorpin*":TI OR "*remoxiprid*":TI OR "*roxiam*":TI OR "*remidon*":TI OR "*iloperidon*":TI OR "*clozapin*":AB OR "* clozaril*":AB OR "* leponex*":AB OR "*aripiprazole*":AB OR "*olanzapin*":AB OR "*lanzac*":AB OR "*zyprex*":AB OR "*quetiapin*":AB OR "*seroquel*":AB OR "*risperidon*":AB OR "*belivon*":AB OR "*risperdal*":AB OR "*risperin*":AB OR "*rispolin*":AB OR "*sertindol*":AB OR "*serdolect*":AB OR "*serlect*":AB OR "*ziprasidon*":AB OR "*zotepin*":AB OR "*lodopin*":AB OR "*nipolept*":AB OR "*zopite*":AB OR "*setous*":AB OR "*majorpin*":AB OR "*remoxiprid*":AB OR "*roxiam*":AB OR "*remidon*":AB OR "*iloperidon*":AB OR "*clozapine*" null "*clozapin*" OR "* clozaril*" OR "* leponex*" null "*aripiprazole*" OR "*olanzapin*" OR "*lanzac*" OR "*zyprex*" OR "*quetiapin*" OR "*seroquel*" OR "*risperidon*" OR "*belivon*" OR "*risperdal*" OR "*risperin*" OR "*rispolin*" OR "*sertindol*" OR "*serdolect*" OR "*serlect*" OR "*ziprasidon*" OR "*zotepin*" OR "*lodopin*" OR "*nipolept*" OR "*zopite*" OR "*setous*" OR "*majorpin*" OR "*remoxiprid*" OR "*roxiam*" OR "*remidon*" OR "*iloperidon*" OR "*atypical*":TI OR "*atypical*":TI OR "*atypical*":AB OR "*atypical*") AND ("*fluphen*":TI OR "*fluphen*":TI OR "*flufen*":TI OR "*flufen*":TI OR "*lyogen*":TI OR "*lyogen*":TI OR "*prolixin*":TI OR "*prolixin*":TI OR "*siqualon*":TI OR "*siqualon*":TI OR "*modec*":TI OR "*moditen*":TI OR "*fluphen*":AB OR "*flufen*":AB OR "*lyogen*":AB OR "*prolixin*":AB OR "*siqualon*":AB OR "*modec*":AB OR "*moditen*":AB OR "*fluphen*" OR "*flufen*" OR "*lyogen*" OR "*prolixin*" OR "*siqualon*" OR "*modec*" OR "*moditen*")
2. Economic study search of Cochrane Schizophrenia Group Health Economic Database (2013)
For the economic search, we replicated the above strategy in the Cochrane Schizophrenia Group Health Economic Database (CSzGHED) on 31 January 2014. The database of studies relates to cost‐effectiveness of schizophrenia treatments. This database was constructed from systematic searches of four databases: Health Economic Evaluation Database (HEED), National Health Services Health Economic Database (NHS EED), Cost‐Effectiveness Analysis Registry (CEA) and EconLit as well as Cochrane Registry.
Searching other resources
1. Reference searching
We inspected references of all included studies for further relevant studies.
2. Personal contact
We contacted the first author of each included study for information regarding unpublished trials.
3. Pharmaceutical companies
We contacted relevant pharmaceutical companies to obtain more information or data on unpublished trials if appropriate.
Data collection and analysis
Selection of studies
Review author JS independently inspected citations from the searches and identified relevant abstracts. Review author SS independently re‐inspected a random 20% sample to ensure reliability. Where disputes arose, we acquired the full report for more detailed scrutiny. JS obtained and inspected full reports of the abstracts meeting the review criteria. Again, SS re‐inspected a random 20% of full reports in order to ensure reliable selection. Where it was not possible to resolve disagreement by discussion, we attempted to contact the authors of the study for clarification.
For the selection of economic studies, review authors VF and SS inspected all retrieved citations identified by the economic database search, and where disputes arose, we acquired the full report for further inspection.
Data extraction and management
1. Extraction
Review author BGL, SZ, JX, independently extracted data from included studies, and SS made a random 20% check to ensure reliability. Again, we discussed any disagreement. We extracted data presented only in graphs and figures whenever possible, but included the data only if the two review authors independently had the same result.
For the economic analysis, had Type A and B studies been identified (see Types of studies), review authors VF ad SS would have investigated whether appraisal had already been undertaken by NHS EED using their search tool derived for this purpose. If appraisal had not been undertaken, VF and SS would have applied the NHS EED tool to the data. For Type C studies, we planned to extract outcome data directly from the already‐included effectiveness studies.
2. Management
2.1 Forms
We extracted data onto standard, simple forms.
2.2 Scale‐derived data
We included continuous data from rating scales only if:
a) the psychometric properties of the measuring instrument were described in a peer‐reviewed journal (Marshall 2000); and b) the measuring instrument had not been written or modified by one of the trialists for that particular trial.
Ideally, the measuring instrument should either be i) a self‐report or ii) completed by an independent rater or relative (not the therapist). We realise that this is not often reported clearly and noted this in the Description of studies section.
2.3 Endpoint versus change data
There are advantages to both endpoint and change data. Change data can remove a component of between‐person variability from the analysis. On the other hand, calculation of change needs two assessments (baseline and endpoint), which can be difficult in unstable and difficult to measure conditions such as schizophrenia. We decided primarily to use endpoint data and only use change data if the former were not available. We combined endpoint and change data in the analysis as we preferred mean differences (MD) rather than standardised mean differences (SMD) throughout (Higgins 2011).
2.4 Skewed data
Continuous data on clinical and social outcomes are often not normally distributed. To avoid the pitfall of applying parametric tests to non‐parametric data, we aimed to apply the following standards to relevant data before inclusion.
Studies, N > 200 We entered useable data from studies of at least 200 participants, for example, in the analysis irrespective of the following rules, because skewed data pose less of a problem in large studies.
Change data
We also entered all useable change data as when continuous data are presented on a scale that includes a possibility of negative values (such as change data), it is difficult to tell whether data are skewed or not.
Endpoint data, N < 200
(a) When a scale started from the finite number zero, we subtracted the lowest possible value from the mean and divided this by the standard deviation (SD). If this value was lower than 1, it would have strongly suggested a skew and we excluded these data. If this ratio was higher than 1 but below 2, there is a suggestion of skew. We entered these data and tested whether their inclusion or exclusion changed the results substantially. Finally, if the ratio was larger than 2 we included these data, because skew was less likely (Altman 1996; Higgins 2011).
b) If a scale started from a positive value (such as the Positive and Negative Syndrome Scale (PANSS) (Kay 1986), which can have values from 30 to 210), we modified the calculation described above to take the scale starting point into account. In these cases skew is present if 2 SD > (S‐S min), where S is the mean score and 'S min' is the minimum score.
2.5 Common measure
To facilitate comparison between trials, we intended to convert variables that can be reported in different metrics, such as days in hospital (mean days per year, per week or per month) to a common metric (e.g. mean days per month).
2.6 Conversion of continuous to binary
Where possible, we made efforts to convert outcome measures to dichotomous data. This can be done by identifying cut‐off points on rating scales and dividing participants accordingly into 'clinically improved' or 'not clinically improved'. It is generally assumed that if there is a 50% reduction in a scale‐derived score such as the Brief Psychiatric Rating Scale (BPRS, Overall 1962) or the PANSS (Kay 1986), this could be considered as a clinically significant response (Leucht 2005; Leucht 2005a).
2.7 Direction of graphs
We entered data in such a way that the area to the left of the line of no effect indicates a favourable outcome for oral fluphenazine. Where keeping to this makes it impossible to avoid outcome titles with clumsy double‐negatives (e.g. 'Not un‐ improved') we reported data where the left of the line indicates an unfavourable outcome. We noted this in the relevant graphs.
Assessment of risk of bias in included studies
Again BGL and JS worked independently to assess risk of bias by using criteria described in the Cochrane Handbook for Systematic Reviews of Interventions (Higgins 2011) to assess trial quality. This set of criteria is based on evidence of associations between overestimate of effect and high risk of bias of the article such as sequence generation, allocation concealment, blinding, incomplete outcome data and selective reporting.
If the raters disagreed, we made the final rating by consensus with SS.
We noted the level of risk of bias in both the text of the review and in the 'Summary of findings' tables.
This review also aimed to assess the overall methodological quality of each study included in the economic evaluation. We planned to use the checklist developed by Drummond 1996 and the CHEC criteria list (Evers 2005) for Type A and B studies. Had we found any economic studies of Type A or B level, this would have been noted in the summary as well as in a separate table.
Measures of treatment effect
1. Binary data
For binary outcomes we calculated a standard estimation of the risk ratio (RR) and its 95% confidence interval (CI). It has been shown that RR is more intuitive (Boissel 1999) than odds ratios and that odds ratios tend to be interpreted as RR by clinicians (Deeks 2000). The number needed to treat/harm (NNTB/NNTH) statistic with its confidence intervals is intuitively attractive to clinicians but is problematic both in its accurate calculation in meta‐analyses and interpretation (Hutton 2009). For binary data presented in the 'Summary of findings' table/s, where possible, we calculated illustrative comparative risks.
2. Continuous data
For continuous outcomes we estimated the mean difference (MD) between groups. We preferred not to calculate effect size measures (standardised mean difference (SMD)). However, if in future versions of this review, if scales of very considerable similarity are used, we will presume there is a small difference in measurement, and we will calculate effect size and transform the effect back to the units of one or more of the specific instruments.
Unit of analysis issues
1. Cluster trials
Studies increasingly employ 'cluster randomisation' (such as randomisation by clinician or practice), but analysis and pooling of clustered data poses problems. Firstly, authors often fail to account for intra‐class correlation in clustered studies, leading to a 'unit of analysis' error (Divine 1992) whereby P values are spuriously low, confidence intervals unduly narrow and statistical significance overestimated. This causes type I errors (Bland 1997; Gulliford 1999).
We did not identify any cluster‐randomised studies; however, in future version of this review, and where we identify studies that have not accounted for clustering in primary studies, we will present data in a table, with a (*) symbol to indicate the presence of a probable unit of analysis error. In subsequent versions of this review we will seek to contact first authors of studies to obtain intra‐class correlation coefficients (ICCs) for their clustered data and to adjust for this by using accepted methods (Gulliford 1999). Where clustering has been incorporated into the analysis of primary studies, we will present these data as if from a non‐cluster randomised study, but adjust for the clustering effect.
We have sought statistical advice and have been advised that the binary data as presented in a report should be divided by a 'design effect'. This is calculated using the mean number of participants per cluster (m) and the ICC (design effect = 1+(m‐1)*ICC) (Donner 2002). If the ICC is not reported it would be assumed to be 0.1 (Ukoumunne 1999).
If cluster studies have been appropriately analysed, taking into account ICCs and relevant data documented in the report, synthesis with other studies would be possible using the generic inverse variance technique.
2. Cross‐over trials
A major concern of cross‐over trials is the carry‐over effect. It occurs if an effect (e.g. pharmacological, physiological or psychological) of the treatment in the first phase is carried over to the second phase. As a consequence, on entry to the second phase the participants can differ systematically from their initial state despite a wash‐out phase. For the same reason cross‐over trials are not appropriate if the condition of interest is unstable (Elbourne 2002). We did not identify any cross‐over studies; however, in future versions of this review where such studies are identified, as both effects are very likely in severe mental illness, we will only use data from the first phase of cross‐over studies.
3. Studies with multiple treatment groups
Where a study involves more than two treatment arms, if relevant, we presented the additional treatment arms in comparisons. If data were binary we simply added and combined these within the two‐by‐two table. If data were continuous, we combined data following the formula in section 7.7.3.8 (Combining groups) of the Cochrane Handbook for Systematic Reviews of Interventions (Higgins 2011).
Dealing with missing data
1. Overall loss of credibility
At some degree of loss to follow‐up, data must lose credibility (Xia 2009). We chose that, for any particular outcome, should more than 50% of data be unaccounted for, we would not reproduce these data or use them within analyses. If, however, more than 50% of those in one arm of a study were lost, but the total loss was less than 50%, we planned to address this within the 'Summary of findings' table/s by downgrading quality. Finally, we also planned to downgrade quality within the 'Summary of findings' table/s should loss be 25% to 50% in total. Such high losses were not experienced in the included studies.
2. Binary
In the case where attrition for a binary outcome was between 0% and 50% and where these data were not clearly described, we presented data on a 'once randomised always analyse' basis (an intention‐to‐treat analysis). Those leaving the study early are all assumed to have the same rates of negative outcome as those who completed, with the exception of the outcome of death and adverse effects. For these outcomes, the rate of those who stay in the study ‐ in that particular arm of the trial ‐ were used for those who did not. We undertook a sensitivity analysis to test how prone the primary outcomes were to change when data only from people who completed the study to that point were compared to the intention‐to‐treat analysis using the above assumptions.
3. Continuous
3.1 Attrition
In the case where attrition for a continuous outcome was between 0% and 50%, and data only from people who completed the study to that point were reported, we reproduced these data.
3.2 Standard deviations
If standard deviations (SDs) were not reported, first, we tried to obtain the missing values from the authors. If not available, where there are missing measures of variance for continuous data, but an exact standard error (SE) and confidence intervals are available for group means, and either P value or 't' value are available for differences in mean, we can calculate them according to the rules described in the Cochrane Handbook for Systematic Reviews of Interventions (Higgins 2011). When only the SE is reported, SDs are calculated by the formula SD = SE * square root (n). Chapters 7.7.3 and 16.1.3 of the Cochrane Handbook for Systematic Reviews of Interventions (Higgins 2011) present detailed formulae for estimating SDs from P values, t or F values, confidence intervals, ranges or other statistics. If these formulae do not apply, we can calculate the SDs according to a validated imputation method which is based on the SDs of the other included studies (Furukawa 2006). Although some of these imputation strategies can introduce error, the alternative would be to exclude a given study's outcome and thus to lose information. We did not impute any values, since we did not identify any missing SDs in the included studies.
Assessment of heterogeneity
1. Clinical heterogeneity
We considered all included studies initially, without seeing comparison data, to judge clinical heterogeneity. We simply inspected all studies for clearly outlying people or situations which we had not predicted would arise. Had such situations or participant groups arisen, we would have fully discussed these. However, meta‐analysis was not possible, since all included studies compared various different atypical antipsychotics versus oral fluphenazine.
2. Methodological heterogeneity
We considered all included studies initially, without seeing comparison data, to judge methodological heterogeneity. We simply inspected all studies for clearly outlying methods which we had not predicted would arise. When such methodological outliers arose we fully discussed these.
3. Statistical heterogeneity
3.1 Visual inspection
We visually inspected graphs to investigate the possibility of statistical heterogeneity.
3.2 Employing the I2 statistic
We investigated heterogeneity between studies by considering the I2 statistic alongside the Chi2 test P value. The I2 statistic provides an estimate of the percentage of inconsistency thought to be due to chance (Higgins 2003). The importance of the observed value of I2 depends on i) the magnitude and direction of effects and ii) the strength of evidence for heterogeneity (e.g. P value from Chi2 test or a confidence interval for I2). We planned to interpret an I2 estimate greater than or equal to around 50%, accompanied by a statistically significant Chi2 test, as evidence of substantial levels of heterogeneity (Section 9.5.2 ‐ Higgins 2011). Had substantial levels of heterogeneity been found for the primary outcome, we would have explored the reasons for this (Subgroup analysis and investigation of heterogeneity).
Assessment of reporting biases
1. Protocol versus full study
Reporting biases arise when the dissemination of research findings is influenced by the nature and direction of results. These are described in section 10.1 of the Cochrane Handbook for Systematic Reviews of Interventions (Higgins 2011). We made attempts to locate protocols for the included randomised trials. Had any protocols been available, we would have compared the outcomes in the protocol and in the published report.
2. Funnel plot
Reporting biases arise when the dissemination of research findings is influenced by the nature and direction of results (Egger 1997). These are again described in section 10 of the Cochrane Handbook for Systematic Reviews of Interventions (Higgins 2011). We are aware that funnel plots may be useful in investigating reporting biases but are of limited power to detect small‐study effects. We did not use funnel plots for outcomes since there were less than 10 included studies.
Data synthesis
We understand that there is no closed argument for preference for use of fixed‐effect or random‐effects models. The random‐effects method incorporates an assumption that the different studies are estimating different, yet related, intervention effects. This often seems to be true to us and the random‐effects model takes into account differences between studies even if there is no statistically significant heterogeneity. There is, however, a disadvantage to the random‐effects model. It puts added weight onto small studies which often are the most biased ones. Depending on the direction of effect these studies can either inflate or deflate the effect size. For this review, we chose a random‐effects model for all analyses.
Handling of economic data
“It has been argued for many years that promoting effective care without taking into account the cost of care and the value of any health gain can lead to inefficient use of public and private funds allocated to health care, which may indirectly result in harm for individuals and the public” (Williams 1987).
We intended to summarise data from type A and type B studies and summarise data according to the Cochrane Campbell Economic Methods Group (Higgins 2011), and if information had been available, a narrative abstract would have been presented for each included study.
We anticipated that most studies would be Type C level of economic evidence and that we would use data from such studies to calculate a GBP value associated with the outcomes. These approximate values can be calculated by:
(a) using the Personal Social Services Research Unit (PSSRU ‐ NHS reference costs for mental health services) calculation of £338 (weighted mean average of all adult mental health in‐patient bed days) per hospital bed day based in a UK NHS setting (PSSRU 2012); and
(b) assuming that one relapse equals one hospital admission, a median length of stay as 16 days, as per Hospital Episode Statistics 2012 (HES 2012; main speciality ‘adult mental illness’), we could utilise results of the effects of the intervention that present service use data for an adult ward as well as for relapse rates (HES is a data warehouse containing details of all admissions, outpatient appointments and A&E attendances at NHS hospitals in England);
(c) in terms of use of adjunctive medication, if the specific drug is not mentioned then we would assume that the adjunctive medication used was phenobarbital and that it would be prescribed for no longer than 14 days at an average dose of 120 mg per day; the cost for this was obtained from the BNF which provides unit costs for the medication;
(d) in terms of treatment for EPSEs, if the specific drug was not mentioned, we would assume that for the treatment procyclidine was used at a dose of 10 mg three times a day for 14 days; the cost for this was obtained from the BNF which provides unit costs for the medication
(e) in terms of treatment for akathisia, if the specific drug was not mentioned, we would assume that for the treatment propranolol was prescribed at a dose of 80 mg twice a day for 14 days; the cost for this was obtained from the BNF which provides unit costs for the medication;
(f) in terms of treatment for depression, if the specific drug was not mentioned, we would assume that for the treatment fluoxetine was prescribed at a dose of 20 mg once a day for 120 days; thee cost for this was obtained from the BNF which provides unit costs for the medication;
(g) in terms of epileptic fits, we would assume that such fits last for less than five minutes (more than five minutes constitutes Status Epilepticus as specified by NICE 2012), unless otherwise specified;
(h) in terms of treatment for agitation, if the specific drug was not mentioned, we would assume that for the treatment lorazepam was prescribed at a dose of 1 mg up to four times a day for three days; the cost for this was obtained from the BNF which provides unit costs for the medication.
We did not factor any associated costs (including cost and resource use of treatment) prior to the relevant measured outcomes being considered. We are using UK NHS PSSRU reference costs of 2012 as well as BNF costs from 2013 and therefore planned to present the outcomes in terms of a GBP saving using relative risks obtained from the effectiveness part of the review, which we have considered to be a proxy for resource use.
The authors wish to emphasise the numerous assumptions that have been made for the purposes of presenting economic data, specifically of Type C studies:
the current included studies contributing to the Type C studies were undertaken between the years of 1987 to 2005; and, taking this into account;
the median length of stay and costs have been calculated from current available data, that is, according to 2012 HES costs, from primarily a UK NHS perspective; and
the GBP value data that are presented reflect a proxy measure only; that is, the GBP value of the intervention effect on the measured outcome, and not taking into account any costs or resource use that may likely have been incurred prior to the actual outcome (which includes, but is not limited to, costs and resource use prior to intervention, the intervention itself and post‐intervention up to outcome).
We are aware that Cochrane systematic reviews are international in context and in their understanding; however, we have adopted a UK NHS perspective for the purposes of this review – partly because we have been funded by the National Institute of Health Research (NIHR) (NIHR Cochrane Programme Grant 2011, UK Reference number: 10/4001/15) to undertake a series of economic evaluations within systematic reviews.
“…[I]n the face of scarce resources, decision makers often need to consider not only whether an intervention works, but also whether its adoption will lead to a more efficient use of resources” (Higgins 2011).
Subgroup analysis and investigation of heterogeneity
1. Subgroup analyses
1.1 Primary outcomes
We subgrouped analyses by length of treatment (short, medium and long term).
1.2 Clinical state, stage or problem
Where possible, we reported data on subgroups of people in the same clinical state, stage and with similar problems.
2. Investigation of heterogeneity
Had inconsistency been high, we would have reported this. Should this happen in future versions of this review, first we will investigate whether the data have been entered correctly. Second, if the data are correct, we will visually inspect the graph and successively remove outlying studies to see if homogeneity is restored. For this review, we decided that should this occur with data contributing no more than around 10% of the total weighting to the summary finding, we will present the data. If not, we will not pool the data and discuss the issues. We know of no supporting research for this 10% cut‐off but are investigating use of prediction intervals as an alternative to this unsatisfactory state.
When unanticipated clinical or methodological heterogeneity are obvious we will simply state hypotheses regarding these for future reviews or versions of this review. We do not anticipate undertaking analyses relating to these.
Sensitivity analysis
1. Implication of randomisation
We included trials in a sensitivity analysis if they were described in some way as to imply randomisation. For the primary outcomes we included these studies, If their inclusion did not result in a substantive difference, they remained in the analyses. If their inclusion did result in important, clinically significant but not necessarily statistically significant differences, we did not add the data from these lower quality studies to the results of the better trials, but presented such data within a subcategory.
2. Assumptions for lost binary data
Where assumptions had to be made regarding people lost to follow‐up (see Dealing with missing data), we compared the findings of the primary outcomes when we use our assumption/s and when we used data only from people who completed the study to that point. If there was a substantial difference, we reported the results and discussed them but continued to employ our assumption.
Where assumptions had to be made regarding missing SD data (see Dealing with missing data), we compared the findings of the primary outcomes when we used our assumption/s and when we used data only from people who completed the study to that point. We undertook a sensitivity analysis to test how prone results were to change when completer‐only data only were compared to the imputed data using the above assumption. If there was a substantial difference, we reported the results and discussed them but continued to employ our assumption.
3. Risk of bias
We analysed the effects of excluding trials that are judged to be at high risk of bias across one or more of the domains of randomisation, allocation concealment, blinding and outcome reporting for the meta‐analysis of the primary outcome. If the exclusion of trials at high risk of bias did not substantially alter the direction of effect or the precision of the effect estimates, then we included data from these trials in the analysis.
4. Imputed values
Had we imputed any values, we would have carried out a sensitivity analysis to assess the effects of including data from trials where we used imputed values for ICC in calculating the design effect in cluster‐randomised trials. We will undertake this sensitivity analysis in future versions of this review where such imputations may be made.
If substantial differences are noted in the direction or precision of effect estimates in any of the sensitivity analyses listed above, we will not pool data from the excluded trials with the other trials contributing to the outcome, but will present them separately.
5. Fixed‐effect and random‐effects
We synthesised all data using a random‐effects model, however, we also synthesised data for the primary outcome using a fixed‐effect model to evaluate whether this alters the significance of the results.
6. Economic summary
We undertook a sensitivity analysis taking into account both the upper and lower confidence intervals for the risk ratios, of the outcomes of interest, and calculated a saving based on these values to investigate how far this affects the direction of the estimated value.
Results
Description of studies
For substantive descriptions of studies please see Characteristics of included studies, Characteristics of excluded studies and Characteristics of studies awaiting classification tables.
Results of the search
Please see Figure 2 for a visual description of the study search process and study inclusion/exclusion details. Our study search identified 501 records; after duplicates were removed, we screened a total of 409 references. Of these, we excluded 390 based on title and abstract, with only 19 full‐text references requested for full inspection. Of these, four studies were included.
2.
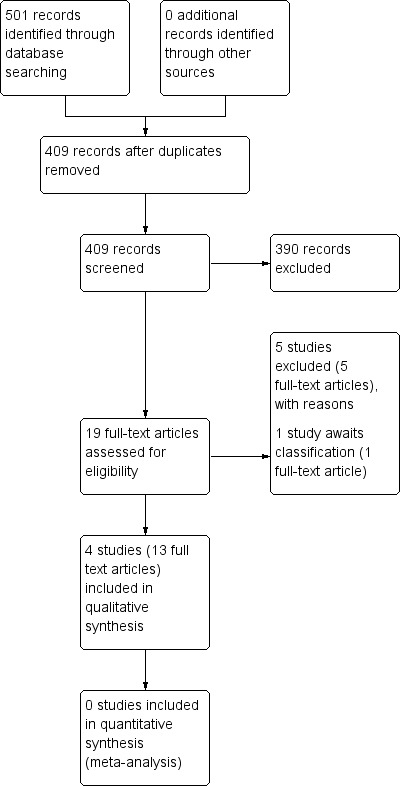
Study flow diagram: 2013 study search
Included studies
1. Length of trials
Studies ranged from six weeks duration of treatment to 22 weeks. Boyer 1987 and Saletu 1994 both had a washout period of three weeks and three days respectively, with a treatment duration of six weeks. Conley 2005 had a four‐ to six‐week open‐label lead‐in phase, with a 12‐week treatment duration, and Dossenbach 1998 had two treatment phases, one for 'acute' (six weeks) and one for 'long term' (22 weeks).
2. Design
All included studies were parallel arm RCTs; only one study had more than two treatment arms (Conley 2005). No included study adequately described the randomisation methods used.
3. Participants
All participants had a diagnosis of schizophrenia with either DSM‐III (Diagnostic and Statistical Manual, third edition) (Boyer 1987; Conley 2005; Saletu 1994) or DSM‐IV (Diagnostic and Statistical Manual, fourth edition) (Dossenbach 1998). Participants included in Conley 2005 were defined as 'treatment‐refractory', and participants in Dossenbach 1998 were assessed both in the 'acute' stage (with results up to six weeks), as well as the long‐term treatment (up to 22 weeks).
4. Setting
Three out of the four studies provided details as to trial setting: Conley 2005 was undertaken in the USA; Dossenbach 1998 was undertaken in Croatia with a multicentre design; and Saletu 1994 was undertaken in Austria. Boyer 1987 provided no details.
5. Study size
Study sizes ranged from n = 40 (Conley 2005; Saletu 1994) to n = 62 (Boyer 1987). The total number of included participants in this review is n = 202.
6. Interventions
6.1 Fluphenazine
The total number of participants receiving fluphenazine was n = 92. Doses of fluphenazine were relatively uniform between studies, with one study permitting a larger dose range (Dossenbach 1998). Boyer 1987 used a range of 2 mg to 12 mg/day; Conley 2005 used a mean of 13.2 mg/day; Dossenbach 1998 used a range of 5 mg to 20 mg/day, with a mean dose of 11.7 mg/day overall in both the 'acute' and 'long‐term' phase of the study; Saletu 1994 used a range of 2 mg to 4 mg/day.
6.2 Amisulpride
Two studies compared amisulpride with fluphenazine; the total number of participants receiving amisulpride was n = 53. Boyer 1987 used a range of 50 mg to 300 mg/day; and Saletu 1994 used a range of 50 mg to 100 mg/day.
6.3 Olanzapine
One study compared the olanzapine with fluphenazine; the total number of participants receiving olanzapine was n = 30. Dossenbach 1998 used a range of 6 mg to 21 mg/day, with a mean average of 13.6 mg/day in the 'acute' phase, and 14.8 mg/day in the 'long‐term' study phase.
6.4 Quetiapine
One study compared the quetiapine with fluphenazine; the total number of participants receiving quetiapine was n = 12. Conley 2005 used a mean dose of 463.6 mg/day.
6.5 Risperidone
One study compared the risperidone with fluphenazine; the total number of participants receiving risperidone was n = 13. Conley 2005 used a mean dose of 4.31 mg/day.
7. Outcomes
7.1 General remarks
We did not conduct a meta‐analysis as the four included studies were presented in four different comparisons. Studies were generally lacking that compared fluphenazine oral with other atypical antipsychotics, and as a consequence, outcome‐reporting between studies was not consistent. Only two studies provided data for out primary outcome of 'clinically important response' (Conley 2005; Dossenbach 1998).
7.2 Acceptability and efficacy
Each included study provided data regarding mental and global state outcomes (widely‐accepted rating scales, including the Brief Psychiatric Rating Scale (BPRS), Positive and Negative Symptom Scale (PANSS) and Clinical Global Impression (CGI)), however some of these data were skewed and are presented in an additional table.
7.3 Adverse events
Adverse events, including anticholinergic effects, central nervous system effects, gastrointestinal effects and 'others' were generally well‐reported in the included studies. However data were seriously lacking for extrapyramidal adverse effects.
7.4 Outcome scales
7.4.1 Global state
i) Clinical Global Impression ‐ CGI (Guy 1976) This is a rating instrument that enables clinicians to quantify severity of illness and overall clinical improvement during therapy. A seven‐point scoring system is usually used with low scores indicating decreased severity and/or greater recovery. Three studies reported data using this scale (Conley 2005; Dossenbach 1998; Saletu 1994).
7.4.2 Mental state
i) Association for Methodology and Documentation in Psychiatry ‐ AMDP (Gebhardt 1983)
The AMDP consists of a glossary of psychopathological symptoms, as well as rating criteria to assist standardisation in recording. One included study measured degrees of apathy in participants using the AMDP manual criteria (Saletu 1994).
ii) Brief Psychiatric Rating Scale ‐ BPRS (Overall 1962) This scale is used to assess the severity of abnormal mental states. The original scale has 16 items, but a revised 18‐item scale is commonly used. Each item is defined on a seven‐point scale varying from 'not present' to 'extremely severe', scoring from zero to six or one to seven. Scores can range from zero to 108 or 18 to 126, respectively. High scores indicate more severe symptoms. The BPRS‐positive cluster comprises four items, which are conceptual disorganisation, suspiciousness, hallucinatory behaviour and unusual thought content. The BPRS‐negative cluster comprises only three items, which are emotional withdrawal, motor retardation, and blunted affect. Three studies reported data using this scale (Boyer 1987; Conley 2005; Dossenbach 1998).
iii) Hamilton Anxiety Scale ‐ HAMA (Maier 1988)
HAMA is a rating scale developed to quantify the severity of anxiety symptomatology and consists of 14 items, each defined by a series of symptoms. Each item is rated on a five‐point scale, ranging from zero (= not present) to four (= severe). One study reported continuous data using this scale (Dossenbach 1998).
iv) Positive and Negative Symptom Scale ‐ PANSS (Kay 1987) The positive and negative syndrome scale was originated as a method for evaluating positive, negative and other symptom dimensions in schizophrenia. The scale has 30 items, and each item can be rated on a seven‐point scoring system varying from one (absent) to seven (extreme). This scale can be divided into three subscales for measuring the severity of general psychopathology, positive symptoms (PANSS‐P) and negative symptoms (PANSS‐N). A low score indicates low levels of symptoms. One study provided data using this scale (Dossenbach 1998).
v) Scale for Assessment of Negative Symptoms ‐ SANS (Andreasen 1982)
The SANS measures the incidence and severity of negative symptoms using a 25‐item scale, using a six‐point scoring system, where zero = better to five = worse, where a higher score equals a more severe experience of negative symptoms. One study reported data using this scale (Saletu 1994).
7.4.3 Satisfaction with treatment
i) Drug Attitude Inventory ‐ DAI (Hogan 1983)
The DAI is a self‐administered rating scale designed to gain understanding of patient‐use and personal experiences of using psychiatric medication. There are 30 items, which are rated as either 'true' or 'false' by users, including statements such as 'medication is a slow‐acting poison', or 'I can't concentrate on anything when I'm on medication'. One study provided continuous data using this scale (Dossenbach 1998).
7.4.4 Adverse events
i) Assessment of Involuntary Movements Scale ‐ AIMS (Guy 1976a)
This scale measures the examination of involuntary movements (tardive dyskinesia) consisting of 12 items scored from zero = none to four = severe, quantifying the severity of tardive dyskinesia. This scale used in short‐term trials may also help to assess Parkinsonian symptoms such as tremor. One study reported continuous data using this scale (Dossenbach 1998).
ii) Hillside Akathisia Scale ‐ HAS (Fleischhacker 1989)
The HAS was used to measure akathisia; the subjective subscale has two subjective and three objective items for which anchored rating points are provided. The subjective items take into account a patient's sensation of restlessness and urge to move, and the objective items assess physical signs of akathisia present in the head, trunk, hands, arms, feet and legs. There are a total of five items, which are measured on a five‐point scoring system from zero = absent to four = present and not controllable. One study provided data using this scale (Dossenbach 1998).
iii) Leeds Sleep Evaluation Questionnaire ‐ LSEQ (Parrott 1980)
The LSEQ is a 10‐item, self‐rating measurement designed to assess changes in sleep quality over the course of psychopharmacological treatment. Four domains are rated, including 'ease of initiating sleep', 'quality of sleep', 'ease of waking' and 'behaviour following wakefulness'. One study reported data using this scale (Dossenbach 1998).
iv) Simpson‐Angus Scale ‐ SAS (Simpson 1970)
The SAS measures drug‐related extrapyramidal symptoms; it is a 10‐item rating scale, with a score range of zero ( = not present) to 40 ( = severe); it includes items such as gait, rigidity, tremor and salivation. One study reported data using this scale (Dossenbach 1998).
7.5 Missing outcomes
The four included studies failed to report several of our pre‐specified secondary outcomes of interest, including economic outcomes, quality of life outcomes, service‐use and hospitalisation outcomes, relapse, and general function (such as social skills, employability). These are particularly patient‐important outcomes that have been overlooked, and would add to the body of evidence regarding acceptability of treatment.
Excluded studies
We excluded five studies. Three, or perhaps two, studies compared amisulpride with placebo, haloperidol, or at different doses (Boyer 1986; Boyer 1987a; Boyer 1996). Pickar 1992 was not a randomised study and Ravanic 1996 provided no useable data.
Studies awaiting assessment
One study awaits assessment as only a conference abstract is available with no usable data available; the full report is required (Djukic‐Dejanovic 2002).
Ongoing studies
We identified no ongoing studies.
Risk of bias in included studies
For a graphical overview of 'Risk of bias' assessments in included studies, see Figure 3; Figure 4.
3.
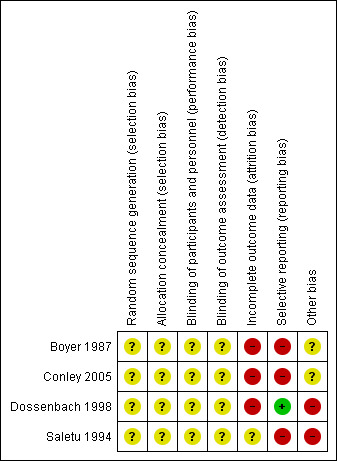
'Risk of bias' summary: review authors' judgements about each risk of bias item for each included study.
4.
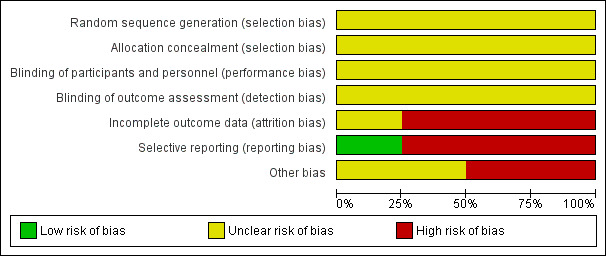
'Risk of bias' graph: review authors' judgements about each risk of bias item presented as percentages across all included studies.
Allocation
None of the included studies provided adequate details as to randomisation methods and were all rated as an 'unclear' risk of bias. Conley 2005 stated that randomisation was performed by the dispensing pharmacy; Dossenbach 1998 stated that randomisation was undertaken in a 1:1 ratio; while Boyer 1987 and Saletu 1994 simply stated that participants were 'randomly allocated', with no further details.
Blinding
Again, none of the included studies provided adequate details as to blinding methods and were all rated as an 'unclear' risk of bias, with all studies only stating that studies were double‐blinded.
Incomplete outcome data
Three included studies were rated as a 'high' risk of bias for attrition; in Boyer 1987, not all participants completed ratings for various BPRS components, and it was unclear whether last observation carried forward (LOCF) was used. Forty participants were randomised in Conley 2005, however data for n = 2 were 'lost', and only n = 38 (out of n = 40 randomised) were presented in the data and analysis. In Dossenbach 1998, all participants were included in the safety analysis. However for efficacy n = 5 were excluded because they did not meet inclusion criteria for BPRS or CGI.
Selective reporting
Three studies were rated as a 'high' risk of bias for selective reporting; Boyer 1987, Conley 2005 and Saletu 1994 did not report all stated outcome measures, particularly relating to continuous data with means and standard deviations not transparently reported. Dossenbach 1998 was rated as a 'low' risk due to higher standards of reporting outcome data.
Other potential sources of bias
Two studies were rated as 'unclear' for other bias (Boyer 1987; Conley 2005), while the other two studies rated as 'high' (Dossenbach 1998; Saletu 1994). We did not detect any obvious other sources of bias with Boyer 1987; study medications were supplied by Janssen Pharmaceutica and Astra‐Zeneca Pharmaceuticals in Conley 2005. For the two studies rated as a 'high' risk (Dossenbach 1998; Saletu 1994), both were sponsored by the pharmaceutical industry, including Eli Lilly and Company (Dossenbach 1998) and Synthelabo Recherche/Laboratoires Delagrange (Bagneux, France) (Saletu 1994).
Effects of interventions
See: Table 1; Table 2; Table 3; Table 4
Summary of findings for the main comparison. FLUPHENAZINE (ORAL) compared to AMISULPRIDE for schizophrenia.
| FLUPHENAZINE (ORAL) compared to AMISULPRIDE for schizophrenia | ||||||
| Patient or population: patients with schizophrenia Settings: Austria & EU Intervention: FLUPHENAZINE (ORAL) Comparison: AMISULPRIDE | ||||||
| Outcomes | Illustrative comparative risks* (95% CI) | Relative effect (95% CI) | No of Participants (studies) | Quality of the evidence (GRADE) | Comments | |
| Assumed risk | Corresponding risk | |||||
| AMISULPRIDE | FLUPHENAZINE (ORAL) | |||||
| Mental state: Average endpoint score BPRS total score ‐ short term (up to 12 weeks) (high = poor) Brief Psychiatric Rating Scale (BPRS). Scale from: 0 to 108. Follow‐up: 3 weeks | The mean mental state: average endpoint score BPRS total score ‐ short term (up to 12 weeks) (high = poor) in the control groups was 37.2 points | The mean mental state: average endpoint score BPRS total score ‐ short term (up to 12 weeks) (high = poor) in the intervention groups was 5.1 higher (‐2.35 to 12.55 higher) | 57 (1 study) | ⊕⊝⊝⊝ very low1,2 | ||
| Relapse (long term) ‐ not reported | See comment | See comment | Not estimable | ‐ | See comment | No study reported this outcome |
| Clinically important change in life skills (long term) ‐ not measured | See comment | See comment | Not estimable | ‐ | See comment | No study measured this outcome |
| Quality of life (long term) ‐ not measured | See comment | See comment | Not estimable | ‐ | See comment | No study measured this outcome |
| Adverse effects: Extrapyramidal effects ‐ concomitant anticholinergic medication ‐ short term (up to 12 weeks) Participants requiring concomitant anticholinergic medication Follow‐up: 3 weeks | 53 per 10003 | 412 per 1000 (56 to 1000) | RR 7.82 (1.07 to 57.26) | 36 (1 study) | ⊕⊝⊝⊝ very low2,4 | |
| Leaving the study early ‐ any reason ‐ short term (up to 12 weeks) Follow‐up: 3 weeks | Moderate | RR 1.19 (0.63 to 2.28) | 98 (2 studies) | ⊕⊝⊝⊝ very low2,4 | ||
| 10 per 10003 | 33 per 1000 (1 to 768) | |||||
| Cost‐effectiveness (long term) ‐ not measured | See comment | See comment | Not estimable | ‐ | See comment | No study measured this outcome |
| *The basis for the assumed risk (e.g. the median control group risk across studies) is provided in footnotes. The corresponding risk (and its 95% confidence interval) is based on the assumed risk in the comparison group and the relative effect of the intervention (and its 95% CI). CI: Confidence interval; RR: Risk ratio | ||||||
| GRADE Working Group grades of evidence High quality: Further research is very unlikely to change our confidence in the estimate of effect. Moderate quality: Further research is likely to have an important impact on our confidence in the estimate of effect and may change the estimate. Low quality: Further research is very likely to have an important impact on our confidence in the estimate of effect and is likely to change the estimate. Very low quality: We are very uncertain about the estimate. | ||||||
1 Risk of bias: rated 'serious' ‐ randomisation methods not clearly stated; not all outcomes reported, not all participants accounted for. Only one small study included (Boyer 1987, n = 62). 2 Imprecision: rated 'very serious' ‐ few participants, few events, leading to uncertainty in the precision of estimate of effect. 3 Control risk: mean baseline risk presented from single study. 4 Risk of bias: rated 'serious' ‐ randomisation methods not clearly stated; not all outcomes reported, sponsored by pharmaceutical company. Only one small study included (Saletu 1994, n = 40).
Summary of findings 2. FLUPHENAZINE (ORAL) compared to RISPERIDONE for schizophrenia.
| FLUPHENAZINE (ORAL) compared to RISPERIDONE for schizophrenia | ||||||
| Patient or population: patients with schizophrenia Settings: USA Intervention: FLUPHENAZINE (ORAL) Comparison: RISPERIDONE | ||||||
| Outcomes | Illustrative comparative risks* (95% CI) | Relative effect (95% CI) | No of Participants (studies) | Quality of the evidence (GRADE) | Comments | |
| Assumed risk | Corresponding risk | |||||
| RISPERIDONE | FLUPHENAZINE (ORAL) | |||||
| Clinically important response (defined by study) ‐ short term (up to 12 weeks) decreased rate of BPRS score < 20% Follow‐up: 12 weeks | 231 per 10001 | 155 per 1000 (30 to 773) | RR 0.67 (0.13 to 3.35) | 26 (1 study) | ⊕⊝⊝⊝ very low2,3,4 | |
| Relapse (long term) ‐ not reported | See comment | See comment | Not estimable | ‐ | See comment | No study reported this outcome |
| Clinically important change in life skills (long term) ‐ not reported | See comment | See comment | Not estimable | ‐ | See comment | No study reported this outcome |
| Quality of life (long term) ‐ not reported | See comment | See comment | Not estimable | ‐ | See comment | No study reported this outcome |
| Adverse effects: Extrapyramidal effects ‐ short/medium term (up to 12 weeks) ‐ not reported | See comment | See comment | Not estimable | ‐ | See comment | No study reported this outcome |
| Leaving the study early ‐ inefficacy short term (up to 12 weeks) Follow‐up: 12 weeks | 77 per 10001 | 83 per 1000 (6 to 1000) | RR 1.08 (0.08 to 15.46) | 25 (1 study) | ⊕⊝⊝⊝ very low2,3,4 | |
| Cost‐effectiveness (long term) ‐ not reported | See comment | See comment | Not estimable | ‐ | See comment | No study reported this outcome <BR/> |
| *The basis for the assumed risk (e.g. the median control group risk across studies) is provided in footnotes. The corresponding risk (and its 95% confidence interval) is based on the assumed risk in the comparison group and the relative effect of the intervention (and its 95% CI). CI: Confidence interval; RR: Risk ratio | ||||||
| GRADE Working Group grades of evidence High quality: Further research is very unlikely to change our confidence in the estimate of effect. Moderate quality: Further research is likely to have an important impact on our confidence in the estimate of effect and may change the estimate. Low quality: Further research is very likely to have an important impact on our confidence in the estimate of effect and is likely to change the estimate. Very low quality: We are very uncertain about the estimate. | ||||||
1 Control risk: mean baseline risk presented for single included study. 2 Risk of bias: rated 'serious' ‐ randomisation methods unclear; rated 'high' for attrition bias, with data for some included participants 'lost'; only one small study included (Conley 2005, n = 40). 3 Indirectness: rated 'serious' ‐ only one included study provided data, which had three treatment arms (fluphenazine versus risperidone versus quetiapine). 4 Imprecision: rated 'very serious' ‐ few participants, few events, leading to uncertainty in the precision of estimate of effect.
Summary of findings 3. FLUPHENAZINE (ORAL) compared to QUETIAPINE for schizophrenia.
| FLUPHENAZINE (ORAL) compared to QUETIAPINE for schizophrenia | ||||||
| Patient or population: patients with schizophrenia Settings: USA Intervention: FLUPHENAZINE (ORAL) Comparison: QUETIAPINE | ||||||
| Outcomes | Illustrative comparative risks* (95% CI) | Relative effect (95% CI) | No of Participants (studies) | Quality of the evidence (GRADE) | Comments | |
| Assumed risk | Corresponding risk | |||||
| QUETIAPINE | FLUPHENAZINE (ORAL) | |||||
| Clinically important response (defined by study) ‐ short term (up to 12 weeks) decreased rate of BPRS score < 20% Follow‐up: 12 weeks | 250 per 10001 | 155 per 1000 (30 to 767) | RR 0.62 (0.12 to 3.07) | 25 (1 study) | ⊕⊝⊝⊝ very low2,3,4 | |
| Relapse (long term) | See comment | See comment | Not estimable | ‐ | See comment | |
| Clinically important change in life skills (long term) | See comment | See comment | Not estimable | ‐ | See comment | |
| Quality of life (long term) | See comment | See comment | Not estimable | ‐ | See comment | |
| Adverse effects: Extrapyramidal effects ‐ short/medium term (up to 12 weeks) | See comment | See comment | Not estimable | ‐ | See comment | |
| Leaving the study early ‐ inefficacy ‐ short term (up to 12 weeks) Follow‐up: 12 weeks | 167 per 10001 | 77 per 1000 (8 to 743) | RR 0.46 (0.05 to 4.46) | 25 (1 study) | ⊕⊝⊝⊝ very low2,3,4 | |
| Cost‐effectiveness (long term) | See comment | See comment | Not estimable | ‐ | See comment | |
| *The basis for the assumed risk (e.g. the median control group risk across studies) is provided in footnotes. The corresponding risk (and its 95% confidence interval) is based on the assumed risk in the comparison group and the relative effect of the intervention (and its 95% CI). CI: Confidence interval; RR: Risk ratio | ||||||
| GRADE Working Group grades of evidence High quality: Further research is very unlikely to change our confidence in the estimate of effect. Moderate quality: Further research is likely to have an important impact on our confidence in the estimate of effect and may change the estimate. Low quality: Further research is very likely to have an important impact on our confidence in the estimate of effect and is likely to change the estimate. Very low quality: We are very uncertain about the estimate. | ||||||
1 Control risk: mean baseline risk presented for single included study. 2 Risk of bias: rated 'serious' ‐ randomisation methods unclear; rated 'high' for attrition bias, with data for some included participants 'lost'; only one small study included (Conley 2005, n = 40). 3 Indirectness: rated 'serious' ‐ only one included study provided data, which had three treatment arms (fluphenazine versus risperidone versus quetiapine). 4 Imprecision: rated 'very serious' ‐ few participants, few events, leading to uncertainty in the precision of estimate of effect.
Summary of findings 4. FLUPHENAZINE (ORAL) compared to OLANZAPINE for schizophrenia.
| FLUPHENAZINE (ORAL) compared to OLANZAPINE for schizophrenia | ||||||
| Patient or population: patients with schizophrenia Settings: multicentre, Croatia Intervention: FLUPHENAZINE (ORAL) Comparison: OLANZAPINE | ||||||
| Outcomes | Illustrative comparative risks* (95% CI) | Relative effect (95% CI) | No of Participants (studies) | Quality of the evidence (GRADE) | Comments | |
| Assumed risk | Corresponding risk | |||||
| OLANZAPINE | FLUPHENAZINE (ORAL) | |||||
| Clinically important response (defined by study) ‐ short term (up to 12 weeks) decreased rate of PANSS score < 40%, decreased rate of BPRS score < 40% Follow‐up: 22 weeks | 500 per 10001 | 665 per 1000 (430 to 1000) | RR 1.33 (0.86 to 2.07) | 60 (1 study) | ⊕⊝⊝⊝ very low2,3 | |
| Relapse (long term) ‐ not reported | See comment | See comment | Not estimable | ‐ | See comment | No study reported this outcome |
| Clinically important change in life skills (long term) ‐ not reported | See comment | See comment | Not estimable | ‐ | See comment | No study reported this outcome |
| Quality of life (long term) ‐ not reported | See comment | See comment | Not estimable | ‐ | See comment | No study reported this outcome |
| Adverse effects: Extrapyramidal effects ‐ akathisia ‐ short term (up to 12 weeks) Follow‐up: 22 weeks | 100 per 10001 | 300 per 1000 (90 to 1000) | RR 3.00 (0.90 to 10.01) | 60 (1 study) | ⊕⊝⊝⊝ very low2,3 | |
| Leaving the study early: inefficacy ‐ short term (up to 12 weeks) Follow‐up: 22 weeks | 33 per 10001 |
100 per 1000 (11 to 908) |
RR 3.00 (0.33 to 27.23) |
60 (1 study) | ⊕⊝⊝⊝ very low2,3 | |
| Cost‐effectiveness (long term) ‐ not reported | See comment | See comment | Not estimable | ‐ | See comment | No study reported this outcome |
| *The basis for the assumed risk (e.g. the median control group risk across studies) is provided in footnotes. The corresponding risk (and its 95% confidence interval) is based on the assumed risk in the comparison group and the relative effect of the intervention (and its 95% CI). CI: Confidence interval; RR: Risk ratio | ||||||
| GRADE Working Group grades of evidence High quality: Further research is very unlikely to change our confidence in the estimate of effect. Moderate quality: Further research is likely to have an important impact on our confidence in the estimate of effect and may change the estimate. Low quality: Further research is very likely to have an important impact on our confidence in the estimate of effect and is likely to change the estimate. Very low quality: We are very uncertain about the estimate. | ||||||
1 Control risk: mean baseline risk presented for single included study. 2 Risk of bias: rated 'serious' ‐ randomisation methods not adequately described; five participants excluded from analysis; sponsored by pharmaceutical company. 3 Imprecision: rated 'very serious' ‐ few participants, few events, leading to uncertainty in the precision of estimate of effect (Dossenbach 1998, n = 60).
COMPARISON 1: FLUPHENAZINE (ORAL) versus AMISULPRIDE
1.1 Global state: 1. Average endpoint score of CGI scales (high = poor)
1.1.1 short term (up to 12 weeks)
In this subgroup we only found one relevant trial (n = 36) (Saletu 1994). There was no significant difference between fluphenazine (oral) and amisulpride (mean difference (MD) ‐0.34 95% confidence interval (CI) ‐0.90 to 0.22, Analysis 1.1).
1.1. Analysis.
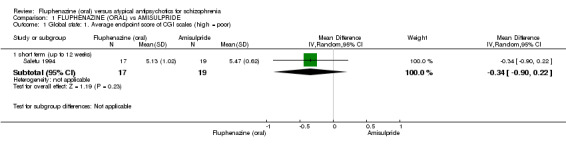
Comparison 1 FLUPHENAZINE (ORAL) vs AMISULPRIDE, Outcome 1 Global state: 1. Average endpoint score of CGI scales (high = poor).
1.2 Mental state: 2a. Average endpoint score of various scales (high = poor)
1.2.1 BPRS ‐ anxiety/depression subscale score ‐ short term (up to 12 weeks)
In this subgroup we only found one relevant trial (n = 57) (Boyer 1987). We found evidence of a clear difference between 'fluphenazine (oral)' and 'amisulpride' within this subgroup (MD 2.60 95% CI 1.40 to 3.80, Analysis 1.2).
1.2. Analysis.
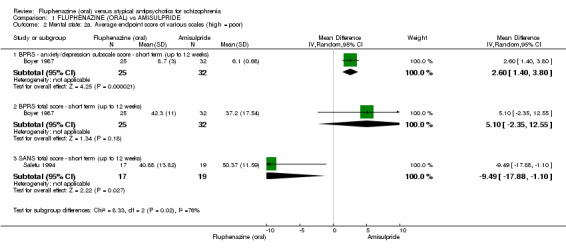
Comparison 1 FLUPHENAZINE (ORAL) vs AMISULPRIDE, Outcome 2 Mental state: 2a. Average endpoint score of various scales (high = poor).
1.2.2 BPRS total score ‐ short term (up to 12 weeks)
In this subgroup we only found one relevant trial (n = 57) (Boyer 1987). There was not a clear difference between 'fluphenazine (oral)' and 'amisulpride' within this subgroup (MD 5.10 95% CI ‐2.35 to 12.55, Analysis 1.2).
1.2.3 SANS total score ‐ short term (up to 12 weeks)
In this subgroup we only found one relevant trial (n = 36) (Saletu 1994). There was a statistically significant difference (P = 0.03) favouring fluphenazine (oral) over amisulpride (MD ‐9.49 95% CI ‐17.88 to ‐1.10, Analysis 1.2).
1.3 Mental state: 2b. Average endpoint score of AMDP scale (high = poor)
1.3.1 short term (up to 12 weeks)
Data for this outcome are skewed and are best inspected by viewing Analysis 1.3.
1.3. Analysis.
Comparison 1 FLUPHENAZINE (ORAL) vs AMISULPRIDE, Outcome 3 Mental state: 2b. Average endpoint score of AMDP scale (high = poor).
| Mental state: 2b. Average endpoint score of AMDP scale (high = poor) | ||||
|---|---|---|---|---|
| Study | Interventions | Mean | SD | N |
| short term (up to 12 weeks) | ||||
| Saletu 1994 | Fluphenazine | 7.13 | 4.26 | 17 |
| Saletu 1994 | Amisulpride | 8.76 | 4.13 | 19 |
1.4 Adverse effects: 1. Extrapyramidal side effects
1.4.1 concomitant anticholinergic medication ‐ short term (up to 12 weeks)
In this subgroup we only found one relevant trial (n = 36) (Saletu 1994). There was a statistically significant difference (P = 0.04) favouring amisulpride over fluphenazine (oral) (risk ratio (RR) 7.82 95% CI 1.07 to 57.26, Analysis 1.4).
1.4. Analysis.
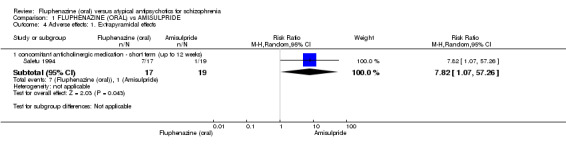
Comparison 1 FLUPHENAZINE (ORAL) vs AMISULPRIDE, Outcome 4 Adverse effects: 1. Extrapyramidal effects.
1.5 Leaving the study early
1.5.1 any reason In this subgroup we found two trials (n = 98). There was no significant difference between the two treatment groups (RR 1.19 95% CI 0.63 to 2.28, Analysis 1.5)
1.5. Analysis.
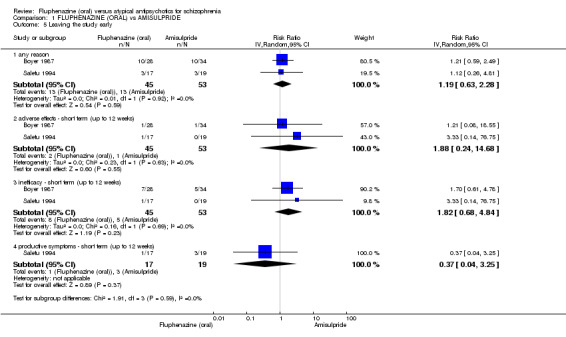
Comparison 1 FLUPHENAZINE (ORAL) vs AMISULPRIDE, Outcome 5 Leaving the study early.
1.5.2 adverse effects ‐ short term (up to 12 weeks)
In this subgroup we found two trials (n = 98). There was no significant difference between fluphenazine (oral) and amisulpride (RR 1.88 95% CI 0.24 to 14.68, Analysis 1.5).
1.5.1 inefficacy ‐ short term (up to 12 weeks)
In this subgroup we found two trials (n = 98). There was no significant difference between fluphenazine (oral) and amisulpride (RR 1.82 95% CI 0.68 to 4.84, Analysis 1.5).
1.5.3 productive symptoms ‐ short term (up to 12 weeks)
In this subgroup we only found one relevant trial (n = 36) (Saletu 1994). There was no significant difference between fluphenazine (oral) and amisulpride (RR 0.37 95% CI 0.04 to 3.25, Analysis 1.5).
COMPARISON 2: FLUPHENAZINE (ORAL) versus RISPERIDONE
2.1 Clinically important response (defined by study)
2.1.1 short term (up to 12 weeks)
In this subgroup we only found one relevant trial (n = 26) (Conley 2005). There was no significant difference between fluphenazine (oral) and risperidone (RR 0.67 95% CI 0.13 to 3.35, Analysis 2.1).
2.1. Analysis.
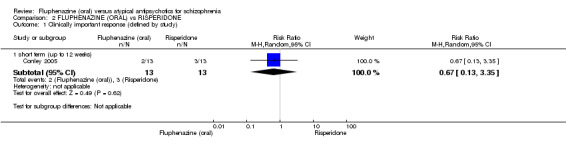
Comparison 2 FLUPHENAZINE (ORAL) vs RISPERIDONE, Outcome 1 Clinically important response (defined by study).
2.2 Global state: 1. Average endpoint score of CGI scales (high = poor)
2.2.1 short term (up to 12 weeks)
In this subgroup we only found one relevant trial (n = 26) (Conley 2005). There was no significant difference between fluphenazine (oral) and risperidone (MD 0.07 95% CI ‐0.77 to 0.91, Analysis 2.2).
2.2. Analysis.
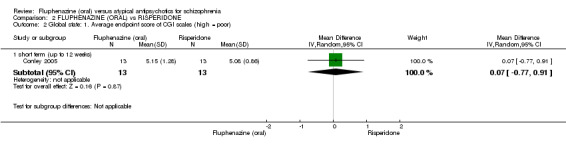
Comparison 2 FLUPHENAZINE (ORAL) vs RISPERIDONE, Outcome 2 Global state: 1. Average endpoint score of CGI scales (high = poor).
2.3 Mental state: 2a. Average endpoint scores (BPRS, high = poor)
2.3.1 BPRS endpoint total scale score ‐ short term (up to 12 weeks)
In this subgroup we only found one relevant trial (n = 25) (Conley 2005). There was no significant difference between fluphenazine (oral) and risperidone (MD ‐1.98 95% CI ‐12.96 to 9.00, Analysis 2.3).
2.3. Analysis.
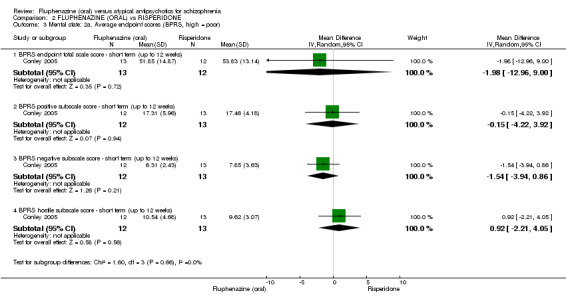
Comparison 2 FLUPHENAZINE (ORAL) vs RISPERIDONE, Outcome 3 Mental state: 2a. Average endpoint scores (BPRS, high = poor).
2.3.2 BPRS positive subscale score ‐ short term (up to 12 weeks)
In this subgroup we only found one relevant trial (n = 25) (Conley 2005). There was no significant difference between fluphenazine (oral) and risperidone (MD ‐0.15 95% CI ‐4.22 to 3.92, Analysis 2.3).
2.3.3 BPRS negative subscale score ‐ short term (up to 12 weeks)
In this subgroup we only found one relevant trial (n = 25) (Conley 2005). There was no significant difference between fluphenazine (oral) and risperidone (MD ‐1.54 95% CI ‐3.94 to 0.86, Analysis 2.3).
2.3.4 BPRS hostile subscale score ‐ short term (up to 12 weeks)
In this subgroup we only found one relevant trial (n = 25) (Conley 2005). There was no significant difference between fluphenazine (oral) and risperidone (MD 0.92 95% CI ‐2.21 to 4.05, Analysis 2.3).
2.4 Mental state: 2b. Average endpoint score of various scales (high = poor) ‐ short term (up to 12 weeks) (skewed data)
2.4.1 BPRS anxiety/depression subscale score
Data for this outcome are skewed and are best inspected by viewing Analysis 2.4.
2.4. Analysis.
Comparison 2 FLUPHENAZINE (ORAL) vs RISPERIDONE, Outcome 4 Mental state: 2b. Average endpoint score of various scales (high = poor) ‐ short term (up to 12 weeks) (skewed data).
| Mental state: 2b. Average endpoint score of various scales (high = poor) ‐ short term (up to 12 weeks) (skewed data) | ||||
|---|---|---|---|---|
| Study | Interventions | Mean | SD | N |
| BPRS anxiety/depression subscale score | ||||
| Conley 2005 | Fluphenazine | 10.38 | 5.20 | 12 |
| Conley 2005 | Risperidone | 9.31 | 5.91 | 13 |
| BPRS activation subscale score | ||||
| Conley 2005 | Fluphenazine | 7.00 | 3.72 | 12 |
| Conley 2005 | Risperidone | 7.00 | 3.06 | 13 |
2.4.2 BPRS activation subscale score
Data for this outcome are skewed and are best inspected by viewing Analysis 2.4.
2.5 Adverse effects: 1. Anticholinergic effect
2.5.1 blurred vision ‐ short term (up to 12 weeks)
In this subgroup we only found one relevant trial (n = 25) (Conley 2005). There was no significant difference between fluphenazine (oral) and risperidone (RR 1.08 95% CI 0.18 to 6.53, Analysis 2.5).
2.5. Analysis.
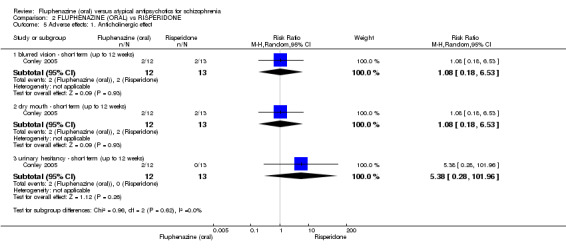
Comparison 2 FLUPHENAZINE (ORAL) vs RISPERIDONE, Outcome 5 Adverse effects: 1. Anticholinergic effect.
2.5.2 dry mouth ‐ short term (up to 12 weeks)
In this subgroup we only found one relevant trial (n = 25) (Conley 2005). There was no significant difference between fluphenazine (oral) and risperidone (RR 1.08 95% CI 0.18 to 6.53, Analysis 2.5).
2.5.3 urinary hesitancy ‐ short term (up to 12 weeks)
In this subgroup we only found one relevant trial (n = 25) (Conley 2005). There was no significant difference between fluphenazine (oral) and risperidone (RR 5.38 95% CI 0.28 to 101.96, Analysis 2.5).
2.6 Adverse effects: 2. Central nervous system
2.6.1 anxiety ‐ short term (up to 12 weeks)
In this subgroup we only found one relevant trial (n = 25) (Conley 2005). There was no significant difference between fluphenazine (oral) and risperidone (RR 0.54 95% CI 0.06 to 5.24, Analysis 2.6).
2.6. Analysis.
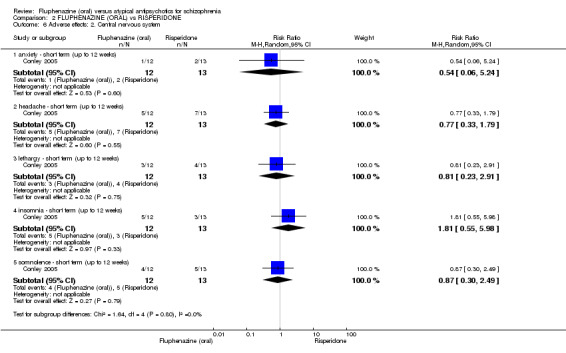
Comparison 2 FLUPHENAZINE (ORAL) vs RISPERIDONE, Outcome 6 Adverse effects: 2. Central nervous system.
2.6.2 headache ‐ short term (up to 12 weeks)
In this subgroup we only found one relevant trial (n = 25) (Conley 2005). There was no significant difference between fluphenazine (oral) and risperidone (RR 0.77 95% CI 0.33 to 1.79, Analysis 2.6).
2.6.3 lethargy ‐ short term (up to 12 weeks)
In this subgroup we only found one relevant trial (n = 25) (Conley 2005). There was no significant difference between fluphenazine (oral) and risperidone (RR 0.81 95% CI 0.23 to 2.91, Analysis 2.6).
2.6.4 insomnia ‐ short term (up to 12 weeks)
In this subgroup we only found one relevant trial (n = 25) (Conley 2005). There was no significant difference between fluphenazine (oral) and risperidone (RR 1.81 95% CI 0.55 to 5.98, Analysis 2.6).
2.6.5 somnolence ‐ short term (up to 12 weeks)
In this subgroup we only found one relevant trial (n = 25) (Conley 2005). There was no significant difference between fluphenazine (oral) and risperidone (RR 0.87 95% CI 0.30 to 2.49, Analysis 2.6).
2.7 Adverse effects: 3. Gastrointestinal
2.7.1 constipation ‐ short term (up to 12 weeks)
In this subgroup we only found one relevant trial (n = 25) (Conley 2005). There was no significant difference between fluphenazine (oral) and risperidone (RR 9.69 95% CI 0.58 to 163.02, Analysis 2.7).
2.7. Analysis.
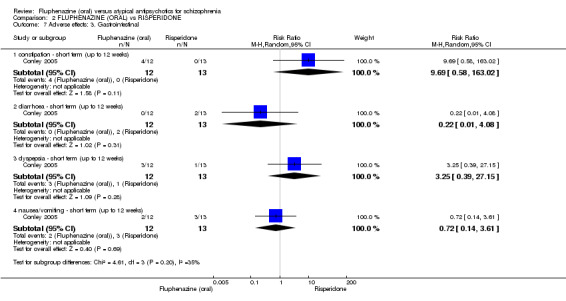
Comparison 2 FLUPHENAZINE (ORAL) vs RISPERIDONE, Outcome 7 Adverse effects: 3. Gastrointestinal.
2.7.2 diarrhoea ‐ short term (up to 12 weeks)
In this subgroup we only found one relevant trial (n = 25) (Conley 2005). There was no significant difference between fluphenazine (oral) and risperidone (RR 0.22 95% CI 0.01 to 4.08, Analysis 2.7).
2.7.3 dyspepsia ‐ short term (up to 12 weeks)
In this subgroup we only found one relevant trial (n = 25) (Conley 2005). There was no significant difference between fluphenazine (oral) and risperidone (RR 3.25 95% CI 0.39 to 27.15, Analysis 2.7).
2.7.4 nausea/vomiting ‐ short term (up to 12 weeks)
In this subgroup we only found one relevant trial (n = 25) (Conley 2005). There was no significant difference between fluphenazine (oral) and risperidone (RR 0.72 95% CI 0.14 to 3.61, Analysis 2.7).
2.8 Adverse effects: 4. Other adverse events
2.8.1 urinary frequency ‐ short term (up to 12 weeks)
In this subgroup we only found one relevant trial (n = 25) (Conley 2005). There was no significant difference between fluphenazine (oral) and risperidone (RR 0.36 95% CI 0.02 to 8.05, Analysis 2.8).
2.8. Analysis.
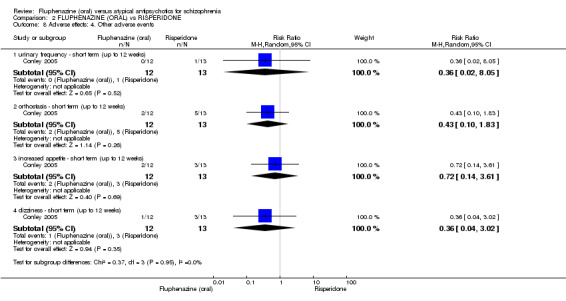
Comparison 2 FLUPHENAZINE (ORAL) vs RISPERIDONE, Outcome 8 Adverse effects: 4. Other adverse events.
2.8.2 orthostasis ‐ short term (up to 12 weeks)
In this subgroup we only found one relevant trial (n = 25) (Conley 2005). There was no significant difference between fluphenazine (oral) and risperidone (RR 0.43 95% CI 0.10 to 1.83, Analysis 2.8).
2.8.3 increased appetite ‐ short term (up to 12 weeks)
In this subgroup we only found one relevant trial (n = 25) (Conley 2005). There was no significant difference between fluphenazine (oral) and risperidone (RR 0.72 95% CI 0.14 to 3.61, Analysis 2.8).
2.8.4 dizziness ‐ short term (up to 12 weeks)
In this subgroup we only found one relevant trial (n = 25) (Conley 2005). There was no significant difference between fluphenazine (oral) and risperidone (RR 0.36 95% CI 0.04 to 3.02, Analysis 2.8).
2.9 Adverse effects: 5. Average endpoint weight loss (kg) (skewed data)
2.9.1 short term (up to 12 weeks)
Data for this outcome are skewed and are best inspected by viewing Analysis 2.9
2.9. Analysis.
Comparison 2 FLUPHENAZINE (ORAL) vs RISPERIDONE, Outcome 9 Adverse effects: 5. Average endpoint weight loss (kg) (skewed data).
| Adverse effects: 5. Average endpoint weight loss (kg) (skewed data) | ||||
|---|---|---|---|---|
| Study | Intervention | Mean(kg) | SD | N |
| short term (up to 12 weeks) | ||||
| Conley 2005 | Fluphenazine | ‐2.6 | 5.7 | 13 |
| Conley 2005 | Risperidone | ‐0.65 | 2.43 | 13 |
2.10 Leaving the study early
2.10.1 inefficacy ‐ short term (up to 12 weeks)
In this subgroup we only found one relevant trial (n = 25) (Conley 2005). There was no significant difference between fluphenazine (oral) and risperidone (RR 1.08 95% CI 0.08 to 15.46, Analysis 2.10).
2.10. Analysis.
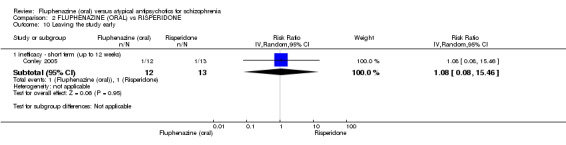
Comparison 2 FLUPHENAZINE (ORAL) vs RISPERIDONE, Outcome 10 Leaving the study early.
COMPARISON 3: FLUPHENAZINE (ORAL) versus QUETIAPINE
3.1 Clinically important response (defined by study)
3.1.1 short term (up to 12 weeks)
In this subgroup we only found one relevant trial (n = 25) (Conley 2005). There was no significant difference between fluphenazine (oral) and quetiapine (RR 0.62 95% CI 0.12 to 3.07, Analysis 3.1).
3.1. Analysis.
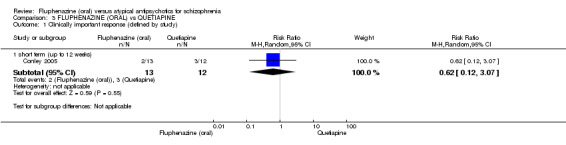
Comparison 3 FLUPHENAZINE (ORAL) vs QUETIAPINE, Outcome 1 Clinically important response (defined by study).
3.2 Global state: 1. CGI: Average endpoint CGI‐SI (high = poor)
3.2.1 short term (up to 12 weeks)
In this subgroup we only found one relevant trial (n = 25) (Conley 2005). There was no significant difference between fluphenazine (oral) and quetiapine (MD ‐0.03 95% CI ‐0.92 to 0.86, Analysis 3.2).
3.2. Analysis.
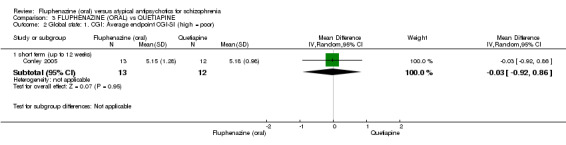
Comparison 3 FLUPHENAZINE (ORAL) vs QUETIAPINE, Outcome 2 Global state: 1. CGI: Average endpoint CGI‐SI (high = poor).
3.3 Mental state: 2a. General ‐ average endpoint score (BPRS total, high = poor)
3.3.1 short term (up to 12 weeks)
In this subgroup we only found one relevant trial (n = 25) (Conley 2005). There was no significant difference between fluphenazine (oral) and quetiapine (MD ‐1.98 95% CI ‐12.96 to 9.00, Analysis 3.3).
3.3. Analysis.
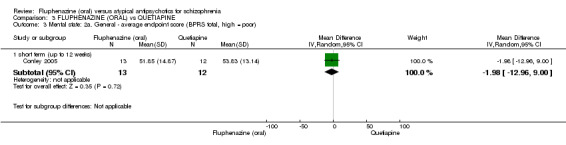
Comparison 3 FLUPHENAZINE (ORAL) vs QUETIAPINE, Outcome 3 Mental state: 2a. General ‐ average endpoint score (BPRS total, high = poor).
3.4 Mental state: 2b. Positive symptoms ‐ average endpoint score (BPRS positive sub‐score, high = poor)
3.4.1 short term (up to 12 weeks)
In this subgroup we only found one relevant trial (n = 25) (Conley 2005). There was a statistically significant difference (P = 0.0002) favouring fluphenazine (oral) over quetiapine (MD ‐13.61 95% CI ‐20.77 to ‐6.45, Analysis 3.4).
3.4. Analysis.
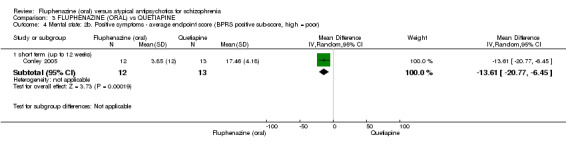
Comparison 3 FLUPHENAZINE (ORAL) vs QUETIAPINE, Outcome 4 Mental state: 2b. Positive symptoms ‐ average endpoint score (BPRS positive sub‐score, high = poor).
3.5 Mental state: 2c. Negative symptoms ‐ average endpoint score (BPRS negative sub‐score, high = poor)
3.5.1 short term (up to 12 weeks)
In this subgroup we only found one relevant trial (n = 24) (Conley 2005). There was no significant difference between fluphenazine (oral) and quetiapine (MD ‐0.11 95% CI ‐2.27 to 2.05, Analysis 3.5).
3.5. Analysis.
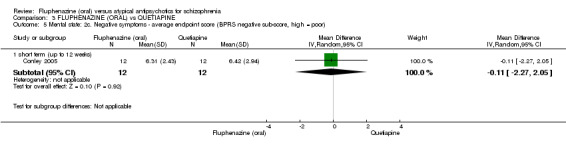
Comparison 3 FLUPHENAZINE (ORAL) vs QUETIAPINE, Outcome 5 Mental state: 2c. Negative symptoms ‐ average endpoint score (BPRS negative sub‐score, high = poor).
3.6 Mental state: 2d. Anxiety/depression symptoms ‐ average endpoint score (BPRS anxiety/depression sub‐score, high score = poor)
3.6.1 short term (up to 12 weeks)
Data for this outcome are skewed and are best inspected by viewing Analysis 3.6.
3.6. Analysis.
Comparison 3 FLUPHENAZINE (ORAL) vs QUETIAPINE, Outcome 6 Mental state: 2d. Anxiety/depression symptoms ‐ average endpoint score (BPRS anxiety/depression sub‐score, high score = poor).
| Mental state: 2d. Anxiety/depression symptoms ‐ average endpoint score (BPRS anxiety/depression sub‐score, high score = poor) | ||||
|---|---|---|---|---|
| Study | Interventions | Mean | SD | N |
| short term (up to 12 weeks) | ||||
| Conley 2005 | Quetiapine | 10.25 | 3.70 | 12 |
| Conley 2005 | Risperidone | 9.31 | 5.91 | 13 |
3.7 Mental state: 2e. Hostility symptoms ‐ average endpoint score (BPRS hostility sub‐score, high = poor)
3.7.1 short term (up to 12 weeks)
In this subgroup we only found one relevant trial (n = 24) (Conley 2005). There was no significant difference between fluphenazine (oral) and quetiapine (MD 0.79 95% CI ‐2.45 to 4.03, Analysis 3.7).
3.7. Analysis.
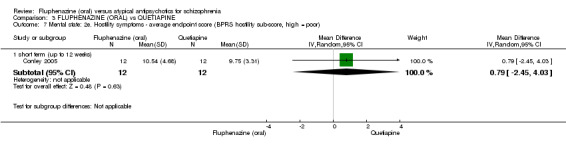
Comparison 3 FLUPHENAZINE (ORAL) vs QUETIAPINE, Outcome 7 Mental state: 2e. Hostility symptoms ‐ average endpoint score (BPRS hostility sub‐score, high = poor).
3.8 Mental state: 2f. Activation symptoms ‐ average endpoint score (BPRS activation sub‐score, high = poor)
3.8.1 short term (up to 12 weeks)
Data for this outcome are skewed and are best inspected by viewing Analysis 3.8.
3.8. Analysis.
Comparison 3 FLUPHENAZINE (ORAL) vs QUETIAPINE, Outcome 8 Mental state: 2f. Activation symptoms ‐ average endpoint score (BPRS activation sub‐score, high = poor).
| Mental state: 2f. Activation symptoms ‐ average endpoint score (BPRS activation sub‐score, high = poor) | ||||
|---|---|---|---|---|
| Study | Intervention | Mean | SD | N |
| short term (up to 12 weeks) | ||||
| Conley 2005 | Qutiapine | 7.33 | 2.77 | 12 |
| Conley 2005 | Risperidone | 7.00 | 3.06 | 13 |
3.9 Adverse effects: 1. Anticholinergic effect
3.9.1 dry mouth ‐ short term (up to 12 weeks)
In this subgroup we only found one relevant trial (n = 24) (Conley 2005). There was no significant difference between fluphenazine (oral) and quetiapine (RR 1.00 95% CI 0.17 to 5.98, Analysis 3.9).
3.9. Analysis.
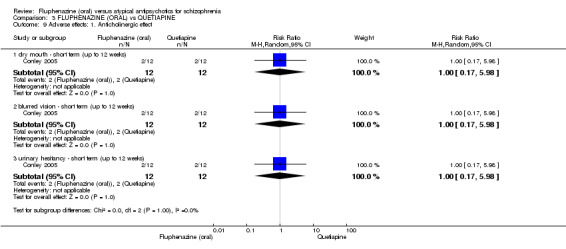
Comparison 3 FLUPHENAZINE (ORAL) vs QUETIAPINE, Outcome 9 Adverse effects: 1. Anticholinergic effect.
3.9.2 blurred vision ‐ short term (up to 12 weeks)
In this subgroup we only found one relevant trial (n = 24) (Conley 2005). There was no significant difference between fluphenazine (oral) and quetiapine (RR 1.00 95% CI 0.17 to 5.98, Analysis 3.9).
3.9.3 urinary hesitancy ‐ short term (up to 12 weeks)
In this subgroup we only found one relevant trial (n = 24) (Conley 2005). There was no significant difference between fluphenazine (oral) and quetiapine (RR 1.00 95% CI 0.17 to 5.98, Analysis 3.9).
3.10 Adverse effects: 2. Central nervous system
3.10.1 anxiety ‐ short term (up to 12 weeks)
In this subgroup we only found one relevant trial (n = 24) (Conley 2005). There was no significant difference between fluphenazine (oral) and quetiapine (RR 1.00 95% CI 0.07 to 14.21, Analysis 3.10).
3.10. Analysis.
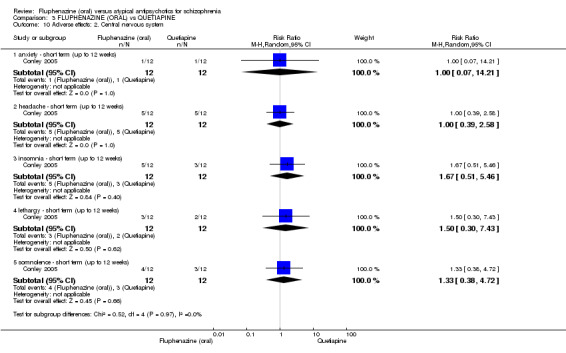
Comparison 3 FLUPHENAZINE (ORAL) vs QUETIAPINE, Outcome 10 Adverse effects: 2. Central nervous system.
3.10.2 headache ‐ short term (up to 12 weeks)
In this subgroup we only found one relevant trial (n = 24) (Conley 2005). There was no significant difference between fluphenazine (oral) and quetiapine (RR 1.00 95% CI 0.39 to 2.58, Analysis 3.10).
3.10.3 insomnia ‐ short term (up to 12 weeks)
In this subgroup we only found one relevant trial (n = 24) (Conley 2005). There was no significant difference between fluphenazine (oral) and quetiapine (RR 1.67 95% CI 0.51 to 5.46, Analysis 3.10).
3.10.4 lethargy ‐ short term (up to 12 weeks)
In this subgroup we only found one relevant trial (n = 24) (Conley 2005). There was no significant difference between fluphenazine (oral) and quetiapine (RR 1.50 95% CI 0.30 to 7.43, Analysis 3.10).
3.10.5 somnolence ‐ short term (up to 12 weeks)
In this subgroup we only found one relevant trial (n = 24) (Conley 2005). There was no significant difference between fluphenazine (oral) and quetiapine (RR 1.33 95% CI 0.38 to 4.72, Analysis 3.10).
3.11 Adverse effects: 3. Gastrointerstinal adverse effects
3.11.1 constipation ‐ short term (up to 12 weeks)
In this subgroup we only found one relevant trial (n = 24) (Conley 2005). There was no significant difference between fluphenazine (oral) and quetiapine (RR 1.00 95% CI 0.32 to 3.10, Analysis 3.11).
3.11. Analysis.
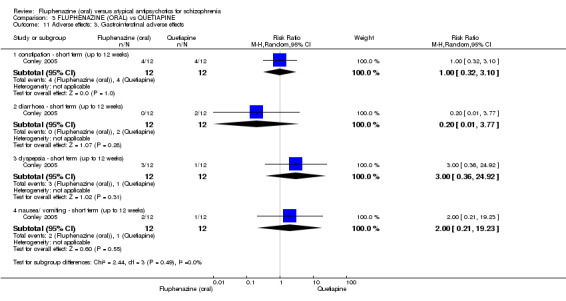
Comparison 3 FLUPHENAZINE (ORAL) vs QUETIAPINE, Outcome 11 Adverse effects: 3. Gastrointerstinal adverse effects.
3.11.2 diarrhoea ‐ short term (up to 12 weeks)
In this subgroup we only found one relevant trial (n = 24) (Conley 2005). There was no significant difference between fluphenazine (oral) and quetiapine (RR 0.20 95% CI 0.01 to 3.77, Analysis 3.11).
3.11.3 dyspepsia ‐ short term (up to 12 weeks)
In this subgroup we only found one relevant trial (n = 24) (Conley 2005). There was no significant difference between fluphenazine (oral) and quetiapine (RR 3.00 95% CI 0.36 to 24.92, Analysis 3.11).
3.11.4 nausea/ vomiting ‐ short term (up to 12 weeks)
In this subgroup we only found one relevant trial (n = 24) (Conley 2005). There was no significant difference between fluphenazine (oral) and quetiapine (RR 2.00 95% CI 0.21 to 19.23, Analysis 3.11).
3.12 Adverse effects: 4a. Other adverse events
3.12.1 dizziness ‐ short term (up to 12 weeks)
In this subgroup we only found one relevant trial (n = 24) (Conley 2005). There was no significant difference between fluphenazine (oral) and quetiapine (RR 1.00 95% CI 0.07 to 14.21, Analysis 3.12).
3.12. Analysis.
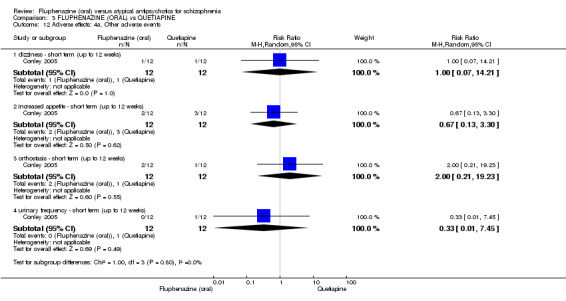
Comparison 3 FLUPHENAZINE (ORAL) vs QUETIAPINE, Outcome 12 Adverse effects: 4a. Other adverse events.
3.12.2 increased appetite ‐ short term (up to 12 weeks)
In this subgroup we only found one relevant trial (n = 24) (Conley 2005). There was no significant difference between fluphenazine (oral) and quetiapine (RR 0.67 95% CI 0.13 to 3.30, Analysis 3.12).
3.12.3 orthostasis ‐ short term (up to 12 weeks)
In this subgroup we only found one relevant trial (n = 24) (Conley 2005). There was no significant difference between fluphenazine (oral) and quetiapine (RR 2.00 95% CI 0.21 to 19.23, Analysis 3.12).
3.12.4 urinary frequency ‐ short term (up to 12 weeks)
In this subgroup we only found one relevant trial (n = 24) (Conley 2005). There was no significant difference between fluphenazine (oral) and quetiapine (RR 0.33 95% CI 0.01 to 7.45, Analysis 3.12).
3.13 Adverse effects: 4b. Other ‐ average endpoint weight loss (average weight in kg) (skewed)
3.13.1 short term (up to 12 weeks)
Data for this outcome are skewed and are best inspected by viewing Analysis 3.13.
3.13. Analysis.
Comparison 3 FLUPHENAZINE (ORAL) vs QUETIAPINE, Outcome 13 Adverse effects: 4b. Other ‐ average endpoint weight loss (average weight in kg) (skewed).
| Adverse effects: 4b. Other ‐ average endpoint weight loss (average weight in kg) (skewed) | ||||
|---|---|---|---|---|
| Study | Intervention | Mean(kg) | SD | N |
| short term (up to 12 weeks) | ||||
| Conley 2005 | Fluphenazine | ‐2.6 | 5.7 | 13 |
| Conley 2005 | Risperidone | ‐0.65 | 2.43 | 13 |
3.14 Leaving the study early
3.14.1 inefficacy ‐ short term (up to 12 weeks)
In this subgroup we only found one relevant trial (n = 25) (Conley 2005). There was no significant difference between fluphenazine (oral) and quetiapine (RR 0.46 95% CI 0.05 to 4.46, Analysis 3.14).
3.14. Analysis.
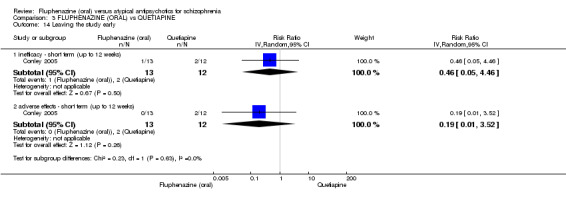
Comparison 3 FLUPHENAZINE (ORAL) vs QUETIAPINE, Outcome 14 Leaving the study early.
3.14.2 adverse effects ‐ short term (up to 12 weeks)
In this subgroup we only found one relevant trial (n = 25) (Conley 2005). There was no significant difference between fluphenazine (oral) and quetiapine (RR 0.19 95% CI 0.01 to 3.52, Analysis 3.14).
COMPARISON 4: FLUPHENAZINE (ORAL) versus OLANZAPINE
4.1 Clinically important response (defined by author)
4.1.1 short term (up to 12 weeks)
In this subgroup we only found one relevant trial (n = 60) (Dossenbach 1998). There was no significant difference between fluphenazine (oral) and olanzapine (RR 1.33 95% CI 0.86 to 2.07, Analysis 4.1).
4.1. Analysis.
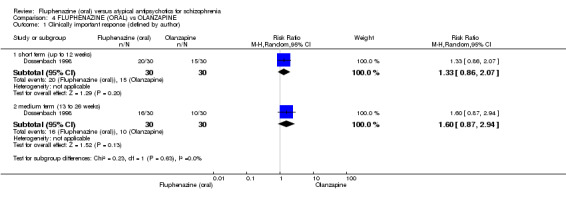
Comparison 4 FLUPHENAZINE (ORAL) vs OLANZAPINE, Outcome 1 Clinically important response (defined by author).
4.1.2 medium term (13 to 26 weeks)
In this subgroup we only found one relevant trial (n = 60) (Dossenbach 1998). There was no significant difference between fluphenazine (oral) and olanzapine (RR 1.60 95% CI 0.87 to 2.94, Analysis 4.1).
4.2 Global state: 1. CGI: Average change CGI‐SI (high = poor)
4.2.1 short term (up to 12 weeks)
In this subgroup we only found one relevant trial (n = 55) (Dossenbach 1998). There was a statistically significant difference (P = 0.05) favouring olanzapine over fluphenazine (oral) (MD 0.70 95% CI ‐0.01 to 1.41, Analysis 4.2).
4.2. Analysis.
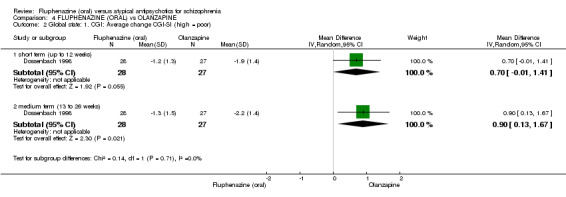
Comparison 4 FLUPHENAZINE (ORAL) vs OLANZAPINE, Outcome 2 Global state: 1. CGI: Average change CGI‐SI (high = poor).
4.2.2 medium term (13 to 26 weeks)
In this subgroup we only found one relevant trial (n = 55) (Dossenbach 1998). There was a statistically significant difference (P = 0.02) favouring olanzapine over fluphenazine (oral) (MD 0.90 95% CI 0.13 to 1.67, Analysis 4.2).
4.3 Mental state: 2a. General ‐ average change score (BPRS total, high = poor)
4.3.1 short term (up to 12 weeks)
In this subgroup we only found one relevant trial (n = 54) (Dossenbach 1998). There was no significant difference between fluphenazine (oral) and olanzapine (MD 7.10 95% CI ‐1.15 to 15.35, Analysis 4.3).
4.3. Analysis.
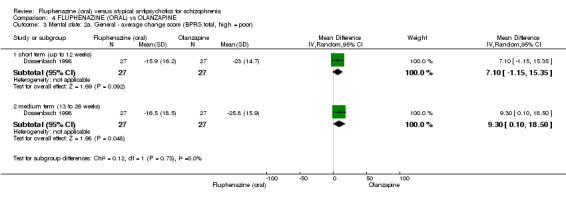
Comparison 4 FLUPHENAZINE (ORAL) vs OLANZAPINE, Outcome 3 Mental state: 2a. General ‐ average change score (BPRS total, high = poor).
4.3.2 medium term (13 to 26 weeks)
In this subgroup we only found one relevant trial (n = 54) (Dossenbach 1998). There was a statistically significant difference (P = 0.05) favouring olanzapine over fluphenazine (oral) (MD 9.30 95% CI 0.10 to 18.50, Analysis 4.3).
4.4 Mental state: 2b. General ‐ average change score (PANSS total, high = poor)
4.4.1 short term (up to 12 weeks)
In this subgroup we only found one relevant trial (n = 54) (Dossenbach 1998). There was no significant difference between fluphenazine (oral) and olanzapine (MD 12.00 95% CI ‐2.03 to 26.03, Analysis 4.4).
4.4. Analysis.
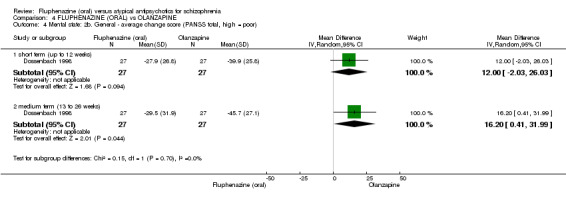
Comparison 4 FLUPHENAZINE (ORAL) vs OLANZAPINE, Outcome 4 Mental state: 2b. General ‐ average change score (PANSS total, high = poor).
4.4.2 medium term (13 to 26 weeks)
In this subgroup we only found one relevant trial (n = 54) (Dossenbach 1998). There was a statistically significant difference (P = 0.04) favouring olanzapine over fluphenazine (oral) (MD 16.20 95% CI 0.41 to 31.99, Analysis 4.4).
4.5 Mental state: 2c. Positive symptoms ‐ average change score (BPRS positive sub‐score, high = poor)
4.5.1 short term (up to 12 weeks)
In this subgroup we only found one relevant trial (n = 55) (Dossenbach 1998). There was no significant difference between fluphenazine (oral) and olanzapine (MD 2.30 95% CI ‐0.67 to 5.27, Analysis 4.5).
4.5. Analysis.
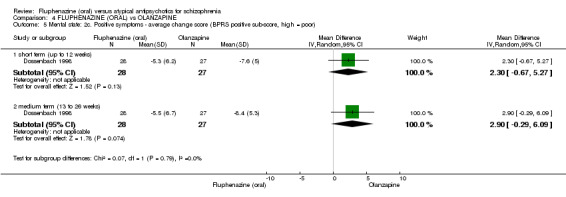
Comparison 4 FLUPHENAZINE (ORAL) vs OLANZAPINE, Outcome 5 Mental state: 2c. Positive symptoms ‐ average change score (BPRS positive sub‐score, high = poor).
4.5.2 medium term (13 to 26 weeks)
In this subgroup we only found one relevant trial (n = 55) (Dossenbach 1998). There was no significant difference between fluphenazine (oral) and olanzapine (MD 2.90 95% CI ‐0.29 to 6.09, Analysis 4.5).
4.6 Mental state: 2d. Positive symptoms ‐ average endpoint score (PANSS positive sub‐score, high = poor)
4.6.1 short term (up to 12 weeks)
In this subgroup we only found one relevant trial (n = 55) (Dossenbach 1998). There was a statistically significant difference (P = 0.03) favouring fluphenazine (oral) over olanzapine (MD ‐5.10 95% CI ‐9.68 to ‐0.52, Analysis 4.6).
4.6. Analysis.
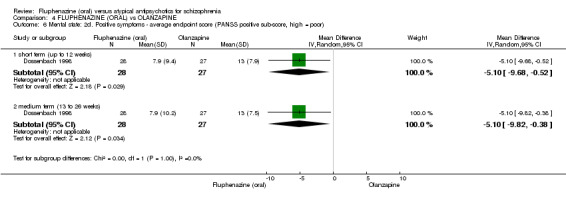
Comparison 4 FLUPHENAZINE (ORAL) vs OLANZAPINE, Outcome 6 Mental state: 2d. Positive symptoms ‐ average endpoint score (PANSS positive sub‐score, high = poor).
4.6.2 medium term (13 to 26 weeks)
In this subgroup we only found one relevant trial (n = 55) (Dossenbach 1998). There was a statistically significant difference (P = 0.03) favouring fluphenazine (oral) over olanzapine (MD ‐5.10 95% CI ‐9.82 to ‐0.38, Analysis 4.6).
4.7 Mental state: 2e. Negative symptoms ‐ average change score (BPRS negative sub‐score, high = poor)
4.7.1 short term (up to 12 weeks)
In this subgroup we only found one relevant trial (n = 55) (Dossenbach 1998). There was no significant difference between fluphenazine (oral) and olanzapine (MD 1.20 95% CI ‐0.47 to 2.87, Analysis 4.7).
4.7. Analysis.
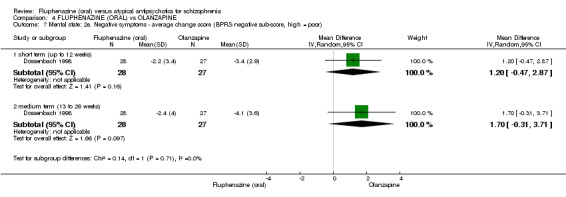
Comparison 4 FLUPHENAZINE (ORAL) vs OLANZAPINE, Outcome 7 Mental state: 2e. Negative symptoms ‐ average change score (BPRS negative sub‐score, high = poor).
4.7.2 medium term (13 to 26 weeks)
In this subgroup we only found one relevant trial (n = 55) (Dossenbach 1998). There was no significant difference between fluphenazine (oral) and olanzapine (MD 1.70 95% CI ‐0.31 to 3.71, Analysis 4.7).
4.8 Mental state: 2f. Negative symptoms ‐ average change score (PANSS negative sub‐score, high = poor)
4.8.1 short term (up to 12 weeks)
In this subgroup we only found one relevant trial (n = 54) (Dossenbach 1998). There was no significant difference between fluphenazine (oral) and olanzapine (MD 2.40 95% CI ‐0.96 to 5.76, Analysis 4.8).
4.8. Analysis.
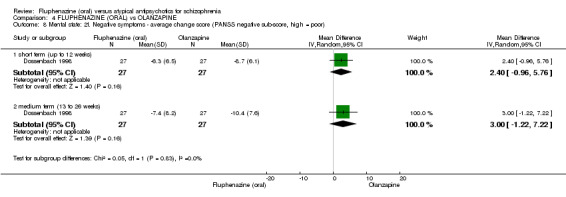
Comparison 4 FLUPHENAZINE (ORAL) vs OLANZAPINE, Outcome 8 Mental state: 2f. Negative symptoms ‐ average change score (PANSS negative sub‐score, high = poor).
4.8.2 medium term (13 to 26 weeks)
In this subgroup we only found one relevant trial (n = 54) (Dossenbach 1998). There was no significant difference between fluphenazine (oral) and olanzapine (MD 3.00 95% CI ‐1.22 to 7.22, Analysis 4.8).
4.9 Mental state: 2g. General psychopathology ‐ average change score (PANSS general psychopathology sub‐score, high = poor)
4.9.1 short term (up to 12 weeks)
In this subgroup we only found one relevant trial (n = 54) (Dossenbach 1998). There was no significant difference between fluphenazine (oral) and olanzapine (MD 6.20 95% CI ‐0.90 to 13.30, Analysis 4.9).
4.9. Analysis.
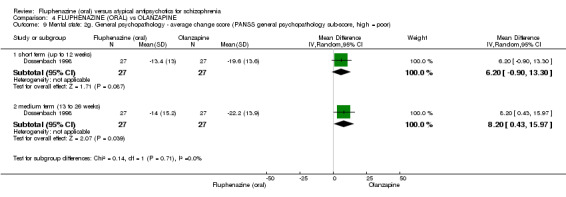
Comparison 4 FLUPHENAZINE (ORAL) vs OLANZAPINE, Outcome 9 Mental state: 2g. General psychopathology ‐ average change score (PANSS general psychopathology sub‐score, high = poor).
4.9.2 medium term (13 to 26 weeks)
In this subgroup we only found one relevant trial (n = 54) (Dossenbach 1998). There was a statistically significant difference (P = 0.04) favouring olanzapine over fluphenazine (oral) (MD 8.20 95% CI 0.43 to 15.97, Analysis 4.9).
4.10 Mental state: 2h. Anxiety ‐ average change score (HAMA, high = poor)
4.10.1 short term (up to 12 weeks)
In this subgroup we only found one relevant trial (n = 54) (Dossenbach 1998). There was a statistically significant difference (P = 0.05) favouring olanzapine over fluphenazine (oral) (MD 4.00 95% CI 0.08 to 7.92, Analysis 4.10).
4.10. Analysis.
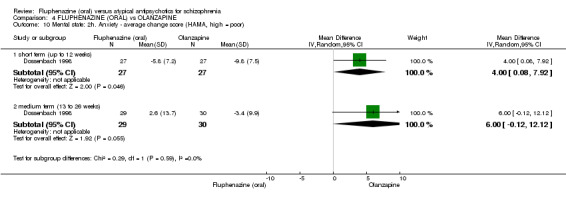
Comparison 4 FLUPHENAZINE (ORAL) vs OLANZAPINE, Outcome 10 Mental state: 2h. Anxiety ‐ average change score (HAMA, high = poor).
4.10.2 medium term (13 to 26 weeks)
In this subgroup we only found one relevant trial (n = 59) (Dossenbach 1998). There was a statistically significant difference (P = 0.05) favouring olanzapine over fluphenazine (oral) (MD 6.00 95% CI ‐0.12 to 12.12, Analysis 4.10).
4.11 Satisfaction with treatment: 1. Average change score (DAI, low = poor)
4.11.1 short term (up to 12 weeks)
In this subgroup we only found one relevant trial (n = 52) (Dossenbach 1998). There was no significant difference between fluphenazine (oral) and olanzapine (MD ‐1.20 95% CI ‐2.44 to 0.04, Analysis 4.11).
4.11. Analysis.
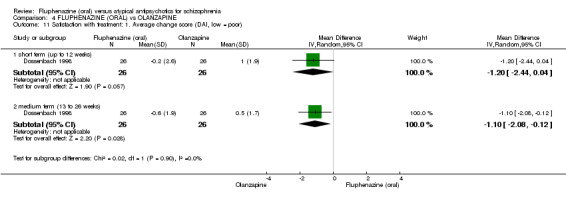
Comparison 4 FLUPHENAZINE (ORAL) vs OLANZAPINE, Outcome 11 Satisfaction with treatment: 1. Average change score (DAI, low = poor).
4.11.2 medium term (13 to 26 weeks)
In this subgroup we only found one relevant trial (n = 52) (Dossenbach 1998). There was a statistically significant difference (P = 0.03) favouring olanzapine over between fluphenazine (oral) (MD ‐1.10 95% CI ‐2.08 to ‐0.12, Analysis 4.11).
4.12 Adverse effects: 1. General
4.12.1 at least one adverse effect ‐ medium term (13 to 26 weeks)
In this subgroup we only found one relevant trial (n = 60) (Dossenbach 1998). There was a statistically significant difference (P = 0.04) favouring olanzapine over fluphenazine (oral) (RR 1.53 95% CI 1.02 to 2.31, Analysis 4.12).
4.12. Analysis.
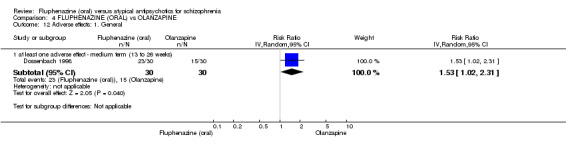
Comparison 4 FLUPHENAZINE (ORAL) vs OLANZAPINE, Outcome 12 Adverse effects: 1. General.
4.13 Adverse effects: 2. Anticholinergic effect
4.13.1 concomitant anticholinergic medication ‐ average endpoint dosage (mg/day) ‐ short term (up to 12 weeks)
In this subgroup we only found one relevant trial (n = 60) (Dossenbach 1998). There was a statistically significant difference (P = 0.001) favouring olanzapine over between fluphenazine (oral) (MD 0.89 95% CI 0.35 to 1.43, Analysis 4.13).
4.13. Analysis.
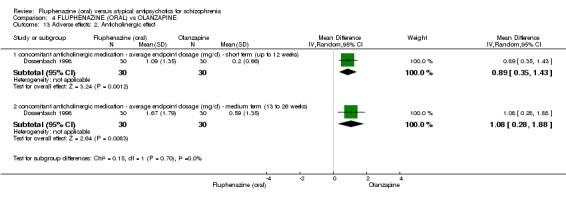
Comparison 4 FLUPHENAZINE (ORAL) vs OLANZAPINE, Outcome 13 Adverse effects: 2. Anticholinergic effect.
4.13.2 concomitant anticholinergic medication ‐ average endpoint dosage (mg/day) ‐ medium term (13 to 26 weeks)
In this subgroup we only found one relevant trial (n = 60) (Dossenbach 1998). There was a statistically significant difference (P = 0.008) favouring olanzapine over between fluphenazine (oral) (MD 1.08 95% CI 0.28 to 1.88, Analysis 4.13).
4.14 Adverse effects: 3a. Central nervous system
4.14.1 insomnia ‐ short term (up to 12 weeks)
In this subgroup we only found one relevant trial (n = 60) (Dossenbach 1998). There was no significant difference between fluphenazine (oral) and olanzapine (RR 13.00 95% CI 0.76 to 220.96, Analysis 4.14).
4.14. Analysis.
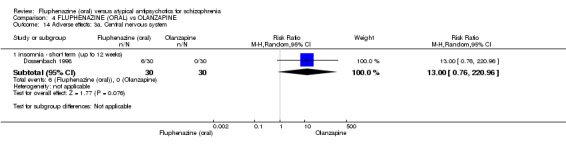
Comparison 4 FLUPHENAZINE (ORAL) vs OLANZAPINE, Outcome 14 Adverse effects: 3a. Central nervous system.
4.15 Adverse effects: 3b. CNS (LSEQ, low = poor)
4.15.1 awakening from sleep average endpoint score ‐ short term (up to 12 weeks)
In this subgroup we only found one relevant trial (n = 53) (Dossenbach 1998). There was no significant difference between fluphenazine (oral) and olanzapine (MD ‐2.70 95% CI ‐10.18 to 4.78, Analysis 4.15).
4.15. Analysis.
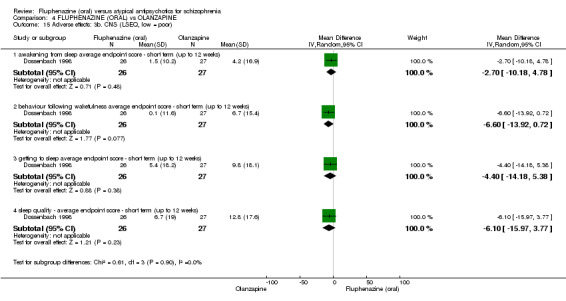
Comparison 4 FLUPHENAZINE (ORAL) vs OLANZAPINE, Outcome 15 Adverse effects: 3b. CNS (LSEQ, low = poor).
4.15.2 behaviour following wakefulness average endpoint score ‐ short term (up to 12 weeks)
In this subgroup we only found one relevant trial (n = 53) (Dossenbach 1998). There was no significant difference between fluphenazine (oral) and olanzapine (MD ‐6.60 95% CI ‐13.92 to 0.72, Analysis 4.15).
4.15.3 getting to sleep average endpoint score ‐ short term (up to 12 weeks)
In this subgroup we only found one relevant trial (n = 53) (Dossenbach 1998). There was no significant difference between fluphenazine (oral) and olanzapine (MD ‐4.40 95% CI ‐14.18 to 5.38, Analysis 4.15).
4.15.4 sleep quality ‐ average endpoint score ‐ short term (up to 12 weeks)
In this subgroup we only found one relevant trial (n = 53) (Dossenbach 1998). There was no significant difference between fluphenazine (oral) and olanzapine (MD ‐6.10 95% CI ‐15.97 to 3.77, Analysis 4.15).
4.16 Adverse effects: 4a. Extrapyramidal effects
4.16.1 akathisia ‐ short term (up to 12 weeks)
In this subgroup we only found one relevant trial (n = 60) (Dossenbach 1998). There was no significant difference between fluphenazine (oral) and olanzapine (RR 3.00 95% CI 0.90 to 10.01, Analysis 4.16).
4.16. Analysis.
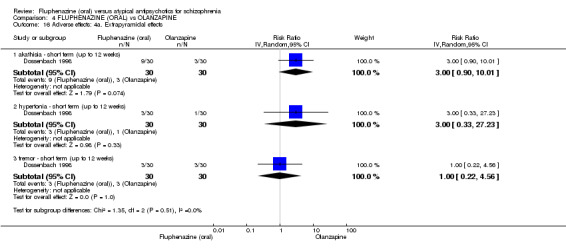
Comparison 4 FLUPHENAZINE (ORAL) vs OLANZAPINE, Outcome 16 Adverse effects: 4a. Extrapyramidal effects.
4.16.2 hypertonia ‐ short term (up to 12 weeks)
In this subgroup we only found one relevant trial (n = 60) (Dossenbach 1998). There was no significant difference between fluphenazine (oral) and olanzapine (RR 3.00 95% CI 0.33 to 27.23, Analysis 4.16).
4.16.3 tremor ‐ short term (up to 12 weeks)
In this subgroup we only found one relevant trial (n = 60) (Dossenbach 1998). There was no significant difference between fluphenazine (oral) and olanzapine (RR 1.00 95% CI 0.22 to 4.56, Analysis 4.16).
4.17 Adverse effects: 4b. Extrapyramidal effects ‐ average change score (SAS, high = poor)
4.17.1 short term (up to 12 weeks)
In this subgroup we only found one relevant trial (n = 60) (Dossenbach 1998). There was a statistically significant difference (P = 0.001) favouring olanzapine over fluphenazine (oral) (MD 4.20 95% CI 1.68 to 6.72, Analysis 4.17).
4.17. Analysis.

Comparison 4 FLUPHENAZINE (ORAL) vs OLANZAPINE, Outcome 17 Adverse effects: 4b. Extrapyramidal effects ‐ average change score (SAS, high = poor).
4.17.2 medium term (13 to 26 weeks)
In this subgroup we only found one relevant trial (n = 60) (Dossenbach 1998). There was a statistically significant difference (P = 0.008) favouring olanzapine over fluphenazine (oral) (MD 4.00 95% CI 1.02 to 6.98, Analysis 4.17).
4.18 Adverse effects: 4c. Extrapyramidal effects ‐ average change score (HAS, high = poor)
4.18.1 short term (up to 12 weeks)
In this subgroup we only found one relevant trial (n = 59) (Dossenbach 1998). There was a statistically significant difference (P = 0.02) favouring olanzapine over fluphenazine (oral) (MD 6.60 95% CI 0.88 to 12.32, Analysis 4.18).
4.18. Analysis.

Comparison 4 FLUPHENAZINE (ORAL) vs OLANZAPINE, Outcome 18 Adverse effects: 4c. Extrapyramidal effects ‐ average change score (HAS, high = poor).
4.18.2 medium term (13 to 26 weeks)
In this subgroup we only found one relevant trial (n = 59) (Dossenbach 1998). There was a statistically significant difference (P = 0.05) favouring olanzapine over fluphenazine (oral) (MD 6.00 95% CI ‐0.12 to 12.12, Analysis 4.18).
4.19 Adverse effects: 4d. Extrapyramidal effects ‐ average change score (AIMS, high = poor)
4.19.1 short term (up to 12 weeks)
In this subgroup we only found one relevant trial (n = 60) (Dossenbach 1998). There was no significant difference between fluphenazine (oral) and olanzapine (MD 1.10 95% CI ‐0.11 to 2.31, Analysis 4.19).
4.19. Analysis.

Comparison 4 FLUPHENAZINE (ORAL) vs OLANZAPINE, Outcome 19 Adverse effects: 4d. Extrapyramidal effects ‐ average change score (AIMS, high = poor).
4.19.2 medium term (13 to 26 weeks)
In this subgroup we only found one relevant trial (n = 60) (Dossenbach 1998). There was no significant difference between fluphenazine (oral) and olanzapine (MD 1.10 95% CI ‐0.45 to 2.65, Analysis 4.19).
4.20 Adverse effects: 5. Other adverse events
4.20.1 weight gain ‐ medium term (13 to 26 weeks)
In this subgroup we only found one relevant trial (n = 60) (Dossenbach 1998). There was no significant difference between fluphenazine (oral) and olanzapine (RR 0.09 95% CI 0.01 to 1.57, Analysis 4.20).
4.20. Analysis.
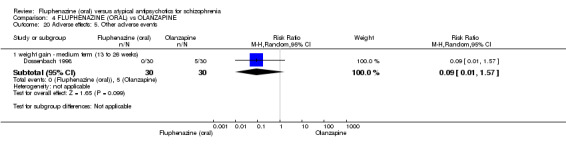
Comparison 4 FLUPHENAZINE (ORAL) vs OLANZAPINE, Outcome 20 Adverse effects: 5. Other adverse events.
4.21 Adverse effects: 5b. Other adverse events
4.21.1 concomitant anxiolytics medication average dosage (mg/day) ‐ short term (up to 12 weeks)
In this subgroup we only found one relevant trial (n = 60) (Dossenbach 1998). There was a statistically significant difference (P = 0.05) favouring olanzapine over fluphenazine (oral) (MD 4.65 95% CI 0.07 to 9.23, Analysis 4.21).
4.21. Analysis.
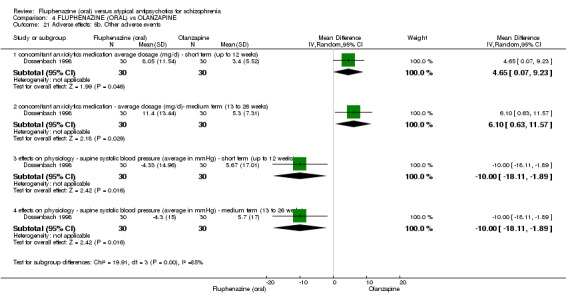
Comparison 4 FLUPHENAZINE (ORAL) vs OLANZAPINE, Outcome 21 Adverse effects: 5b. Other adverse events.
4.21.2 concomitant anxiolytics medication ‐ average dosage (mg/day)‐ medium term (13 to 26 weeks)
In this subgroup we only found one relevant trial (n = 60) (Dossenbach 1998). There was a statistically significant difference (P = 0.03) favouring olanzapine over fluphenazine (oral) (MD 6.10 95% CI 0.63 to 11.57, Analysis 4.21).
4.21.3 effects on physiology ‐ supine systolic blood pressure (average in mmHg) ‐ short term (up to 12 weeks)
In this subgroup we only found one relevant trial (n = 60) (Dossenbach 1998). There was a statistically significant difference (P = 0.02) favouring fluphenazine (oral) over olanzapine (MD ‐10.00 95% CI ‐18.11 to ‐1.89, Analysis 4.21).
4.21.4 effects on physiology ‐ supine systolic blood pressure (average in mmHg) ‐ medium term (13 to 26 weeks)
In this subgroup we only found one relevant trial (n = 60) (Dossenbach 1998). There was a statistically significant difference (P = 0.02) favouring fluphenazine (oral) over olanzapine (MD ‐10.00 95% CI ‐18.11 to ‐1.89, Analysis 4.21).
4.22 Adverse effects: 5c. Other (skewed)
4.22.1 weight gain (average weight in kg) ‐ short term (up to 12 weeks)
Data for this outcome are skewed and are best inspected by viewing Analysis 4.22.
4.22. Analysis.
Comparison 4 FLUPHENAZINE (ORAL) vs OLANZAPINE, Outcome 22 Adverse effects: 5c. Other (skewed).
| Adverse effects: 5c. Other (skewed) | ||||
|---|---|---|---|---|
| Study | Intervention | Mean(kg) | SD | N |
| weight gain (average weight in kg) ‐ short term (up to 12 weeks) | ||||
| Dossenbach 1998 | Fluphenazine | 0.45 | 2.72 | 30 |
| Dossenbach 1998 | Olanzapine | 2.43 | 3.83 | 30 |
| weight gain (average weight in kg) ‐ medium term (13 to 26 weeks) | ||||
| Dossenbach 1998 | Fluphenazine | 0.04 | 3.21 | 30 |
| Dossenbach 1998 | Olanzapine | 5.15 | 6.41 | 30 |
4.22.2 weight gain (average weight in kg) ‐ medium term (13 to 26 weeks)
Data for this outcome are skewed and are best inspected by viewing Analysis 4.22.
4.23 Leaving the study early
4.23.1 inefficacy ‐ short term (up to 12 weeks)
In this subgroup we only found one relevant trial (n = 60) (Dossenbach 1998). There was no significant difference between fluphenazine (oral) and olanzapine (RR 3.00 95% CI 0.33 to 27.23, Analysis 4.23).
4.23. Analysis.
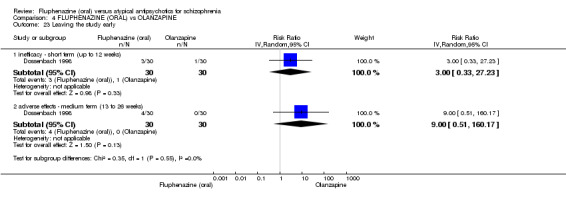
Comparison 4 FLUPHENAZINE (ORAL) vs OLANZAPINE, Outcome 23 Leaving the study early.
4.23.2 adverse effects ‐ medium term (13 to 26 weeks)
In this subgroup we only found one relevant trial (n = 60) (Dossenbach 1998). There was no significant difference between fluphenazine (oral) and olanzapine (RR 9.00 95% CI 0.51 to 160.17, Analysis 4.23).
5. SENSITIVITY ANALYSIS
5.1 Implication of randomisation
None of the included studies provided adequate details as to randomisation methods; furthermore, meta‐analysis was not possible for our primary outcome, therefore the removal of studies with an inadequate description of randomisation left us with no data to compare.
5.2 Assumptions for lost binary data
Due to the relatively small loss to follow‐up between studies, there was no difference in the estimate of effect of our primary outcome when we compared completer‐only data with intention‐to‐treat analysis. Even when we assumed the extreme of each person leaving having a good outcome ‐ this changed the findings by degree but not by direction and in no case changed the equivocal statistical significance of the results (Table 6).
2. Sensitivity analyses: Clinically important response (defined by study).
| FLUPHENAZINE (ORAL) vs AMISULPIRIDE | ||||||
| No trial reported relevant data for the primary outcome | ||||||
| FLUPHENAZINE (ORAL) vs RISPERIDONE | ||||||
| 2.1.1 short term (up to 12 weeks) | ||||||
| Conley 2005 | 2 | 13 | 3 | 13 | 100.0% | 0.67 [0.13 to 3.35] |
| Leaving the study | 1 | 1 | ||||
| Opposite assumption* | 3 | 4 | 0.75 [0.21 to 2.71] | |||
| FLUPHENAZINE (ORAL) vs QUETIAPINE | ||||||
| 3.1.1 short term (up to 12 weeks) | ||||||
| Conley 2005 | 2 | 13 | 3 | 12 | 100.0% | 0.62 [0.12 to 3.07] |
| Leaving the study | 1 | 4 | ||||
| Opposite assumption | 3 | 7 | 0.40 [0.13 to 1.19] | |||
| FLUPHENAZINE (ORAL) vs OLANZAPINE | ||||||
| 4.1.1 short term (up to 12 weeks) | ||||||
| Dossenbach 1998 | 20 | 30 | 15 | 30 | 100.0% | 1.33 [0.86 to 2.07] |
| Leaving the study | 7 | 7 | ||||
| Opposite assumption | 27 | 22 | 1.23 [0.96 to 1.57] | |||
| 4.1.2 medium term (13 to 26 weeks) | ||||||
| Dossenbach 1998 | 16 | 30 | 10 | 30 | 100.0% | 1.60 [0.87 to 2.94] |
| Leaving the study | 7 | 7 | ||||
| Opposite assumption | 23 | 17 | 1.35 [0.93 to 1.96] | |||
* We currently assume that those who left early have the same rate as 'events' as those who stayed in. This means that for each time the outcome is reported the assumption has negligible effect on the final calculation of RR. For 'opposite assumption' we have pushed the assumption further ‐ assumed that all who leave have done so because they have the outcome of interest.
5.3 Risk of bias
Each included study was rated as a 'high' risk of bias across at least one of the domains; again, meta‐analysis was not possible for our primary outcome, therefore the removal of studies rated as a 'high' risk left us with no data to compare.
5.4 Imputed values
We did not include any cluster‐randomised studies and therefore did not impute any ICC values.
5.5 Fixed‐effect and random‐effects
Since meta‐analysis was not possible, there was no difference in the estimate of effect when using a fixed‐effect model as opposed to a random‐effects model.
6. Economic consideration of results
This review is one of several selected for economic consideration of findings. As yet, this has not been completed but should be available for next update.
Discussion
Summary of main results
1. FLUPHENAZINE (ORAL) versus AMISULPRIDE
1.1 Global state/mental state
Only one small study reported data the global state of participants in the short term (12 weeks). This showed no difference between fluphenazine and amisulpride. No trials provided longer‐term data. No trials recorded relapse data. Another small study reported no clear difference between amisulpride and fluphenazine in the short term using the Brief Psychiatric Rating Scale (BPRS) (Analysis 1.2). The favourable outcome for negative symptoms reported by Saletu 1994 is, as always, of interest, but is only based on a short trial involving 36 people. We found no evidence that for these key outcomes there is any difference between fluphenazine and the newer drug ‐ but all data are weak.
1.2 Adverse events
Less of the 19 allocated amisulpride in Saletu 1994 needed concomitant use of anticholinergic medication ‐ a proxy measure of extrapyramidal symptoms. This would support most clinicians' experiences of fluphenazine having a high propensity to induce extrapyramidal side effects (EPSEs). There is significant concern in reporting bias with this small, drug company‐funded study ‐ and data on adverse events (the Webster Scale and Adverse Experience Scale) were not reported at all. Newer drugs are often marketed on having different and less problematic adverse effects than the old medications ‐ so it is odd that there is not more confidence and openness in reporting.
1.3 Leaving the study early
One study found no significant difference for this outcome between the compounds.
2. FLUPHENAZINE (ORAL) versus RISPERIDONE
2.1 Global state/mental state
Only one study (n = 26) provided data on global state showing no difference between the compounds in the short term. There were no data on relapse. The same study did not show any significant difference between fluphenazine or risperidone on various scales of mental state response in the short term. This does seem to reflect the situation with amisulpride. No clear difference between the old and the new drug has been demonstrated.
2.2 Adverse effects
The same study found no difference between the compounds on a large number of individual adverse events. There is evidence that there is greater short‐term weight gain with risperidone than fluphenazine. However, there is significant concern in the reporting of bias in this small, pharmaceutical company‐funded study ‐ data from the Simpson Angus Scale (SAS), the Barnes Akathisia Scale (BAS), and the Assessment of Involuntary Movements Scale (AIMS), Sexual Function: Changes in Sexual Function Questionnaire (CSFQ) and the Prolactin‐Related Adverse Event Questionnaire (PRAEQ) were not reported. This is concerning as risperidone is associated with EPSEs and hyperprolactinaemia and, as with amisulpride, the reporting biases would tend to favour the newer drug.
2.3 Leaving the study early
The same study found no significant difference between the compounds for this outcome in the short term.
3. FLUPHENAZINE (ORAL) versus QUETIAPINE
3.1 Clinically important response (defined by study)/global state/mental state
Conley 2005 (n = 25) found no difference between the compounds in the short term in terms of 'clinically important response' and global state. For one measure on mental state, the same small short study found a difference favouring fluphenazine over quetiapine on the positive symptoms sub‐score (Analysis 3.4). There were no demonstrated differences on the negative symptoms sub‐score. So, in keeping with the other comparisons, tiny studies do not find convincing clinical differences between the old and the new drug.
3.2 Adverse effects
Again, as will the comparisons with other newer drugs, the same small study found no difference between the compounds on a large number of individual adverse events and reporting bias was considerable. If anything this reporting bias would have been favouring the newer and more expensive drug.
3.3 Leaving the study early
Conley 2005 found no difference between the compounds in the short term.
4. FLUPHENAZINE (ORAL) versus OLANZAPINE
4.1 Clinically important response (defined by study)/global state/mental state
Dossenbach 1998 (n = 60) found no difference between the compounds in the short term in terms of 'clinically important response' in the short to mid term. The same study found no differences between compounds in the short term (average change on Cognitive Global Impression (CGI)), but a difference favoured olanzapine in the mid term (MD 0.9 95% CI 0.13 to 1.67, Analysis 4.2), though this is unlikely to be clinically significant. The same study found showed no clear differences between the compounds in the short term using BPRS or Positive and Negative Syndrome Scale (PANSS) overall. For other less important scores there was some favouring of olanzapine over fluphenazine and vice versa. The clinical significance of these findings is questionable due to small sample sizes and wide confidence intervals.
4.2 Adverse effects
Short‐ and mid‐term data appeared to indicate less incidences of any adverse effects with olanzapine. Data support the expected outcome EPSEs with fluphenazine and marked short‐term weight gain with olanzapine, but again, as with the other comparisons, there was the risk of reporting bias favouring the newer drug.
4.3 Leaving the study early
No difference was found between the compounds for attrition rates.
Overall completeness and applicability of evidence
1. Applicability
There were no international multicentre trials. The majority of patients were in‐patients ‐ thus these findings may not be applicable to the larger number of patients with schizophrenia now living in the community. Understandably, many of the exclusion criteria related to more severely ill patients (e.g. 'suicidality' or "acute paranoid psychosis") again bringing into question the applicability of these results in the acute in‐patient setting. Similarly many other physical and mental co‐morbidities such as addiction or depression were exclusion criteria ‐ in reality such co‐morbidities tend to be the norm rather than the exception.
Schizophrenia is a chronic, relapsing‐remitting condition. None of the trials lasted longer than 22 weeks (and three of the four less than 12 weeks). Thus these trials cannot provide data on fluphenazine's role as a maintenance treatment in schizophrenia. Nor can they provide essential safety information about the long‐term health implications of the studies drugs.
1.2 Quality of reporting
The four included studies failed to report several of our pre‐specified secondary outcomes of interest, including economic outcomes, quality of life outcomes, service‐use and hospitalisation outcomes, relapse, and general function (such as social skills, employability). These are particularly patient‐important outcomes that have been overlooked, and would add to the body of evidence regarding acceptability of treatment.
Each study had some examples of missing or unreported data due to attrition. Attrition is inevitable but unfortunately these studies had small‐sample sizes. Only one gave details as to why the patients left the trial. Use of last observation carried forward (LOCF) was not clearly stated.
Other common tendencies affect clinically meaningful interpretation of the data ‐ mean values were commonly reported without standard deviations. Most of the global state and mental state measurements were reported as continuous data that is difficult to interpret clinically. A more meaningful measure might be achieved by conversion to binary data such as "improved" or "not improved."
1.3 Heterogeneity
There was no heterogeneity between studies.
1.4 Publication bias
Formal tests to examine publication bias were underpowered. Therefore, we can not make a judgement in this regard.
Quality of the evidence
The quality of the findings were all rated as "very low." There were concerns with all four trials about a lack of detailed descriptions of the methodologies such as blinding and allocation practices. Most of the studies were pharmaceutical industry‐funded. Not all outcomes were reported (particularly those related to adverse events such as akathisia scales), which was suggestive of reporting bias.
Potential biases in the review process
The review authors sought to adhere to the protocol, through the independent inspection of citations and full articles of potentially relevant studies.
Agreements and disagreements with other studies or reviews
We are not aware of other systematic reviews evaluating the effects of oral fluphenazine versus atypical antipsychotics in the treatment of schizophrenia.
Authors' conclusions
Implications for practice.
1. For people with schizophrenia
These studies do not provide clear information about the relative merits or disadvantages of fluphenazine compared to the atypical antipsychotics many patients will be offered as first‐line treatment. The data support the general point that use of fluphenazine carries the risk of many adverse effects including movement disorder. Many outcomes that patients will be concerned with such as tolerability and effect on quality of life of the drug are not answered by these studies.
2. For clinicians
These studies do not provide clear evidence to support or refute use of fluphenazine as first‐line treatment for schizophrenia compared with atypical antipsychotics in terms of clinical response and effectiveness. As expected, the evidence suggests a greater propensity for EPSEs with fluphenazine than amisulpride or olanzapine, but more short‐term weight gain with olanzapine and risperidone.
3. For managers or policy makers
Fluphenazine is inexpensive compared to atypical antipsychotics but there are no cost‐effectiveness data. Likewise, there are no clear data relating to the relative effectiveness or patient satisfaction with the drug. It can cause significant side effects such as movement disorders.
Implications for research.
1. General
Attempting to systematically review data on fluphenazine highlights the necessity of studies conforming to certain minimum criteria to allow extraction of clinically meaningful results. This would include more detailed and transparent study protocols giving full disclosure to such things as allocation, randomisation and blinding techniques. Use of more easily understandable binary outcomes could be helpful, It should also be the case that all data and results are fully reported. Two trials ‐ Ravanic 1996 (excluded study) and Djukic‐Dejanovic 2002 (awaiting assessment) are of direct relevance to this review but have no data that can be used. We are not sure if the latter study should still be in awaiting assessment, or merged with Ravanic 1996 as we continue to have no record of the full publication. Furthermore, excluded studies Boyer 1986 and Boyer 1996 may be one study. Close compliance with CONSORT would have helped clarify these issues.
2. Specific
2.1 Reviews
The excluded studies and the one awaiting assessment do pose important questions which would generate good comparisons for other reviews (Table 7).
3. Reviews suggested by excluded studies and those awaiting assessment.
| Study tag | Comparison | Existing review |
| Boyer 1986, Boyer 1996 (may be one study) | Amisulpride versus haloperidol | XX FARHAD None currently underway |
| Boyer 1987a | Amisulpride dose | |
| Amisulpride versus placebo | ||
| Djukic‐Dejanovic 2002 (may be Ravanic 1996) | Clozapine versus haloperidol | Essali 2009 |
2.2 Trials
It is difficult to derive meaningful clinical data to inform best practice with regard to the use of fluphenazine versus atypical antipsychotics in schizophrenia despite access to the pooled data of four different trials. Small sample sizes are problematic ‐ it would be beneficial if international researchers were able to collaborate in more multicentre and long‐term studies. Studies should also take into account more meaningful outcomes relating to hospital admissions, quality of life, mortality and cost‐effectiveness. Given the current limitations in the literature, we propose a design for a new randomised trial (Table 8).
4. Design of a future study.
| Methods | Allocation: randomised (clearly described). Blinding: single‐blind (outcomes assessor). Duration: up to 52 weeks. Design: parallel. Setting: anywhere. |
| Participants | Diagnosis: schizophrenia. N = 300. Age: N/A. Sex: N/A. Inclusion criteria: in need of longer‐term care. Exclusion criteria: specific contra‐indication to evaluated treatments. |
| Interventions | 1. Fluphenazine: 5 mg to 20 mg/day. N = 150. 2. Atypical drug of choice. N = 150. Both drugs should be known to be effective, but the comparative effectiveness be unclear. |
| Outcomes | Global state: Clinically important response in mental state (short, medium and long term), relapse (long term). Service use: hospital stay. Social skills: Clinically important change in life skills (long term). Quality of life (long term). Adverse effects: important adverse effects, e.g. EPSEs (medium term), weight gain. Leaving the study early: any reason (medium term). Cost‐effectiveness (long term). |
EPSEs: extrapyramidal side effects
What's new
| Date | Event | Description |
|---|---|---|
| 6 July 2016 | Amended | Author affiliation correction |
Acknowledgements
Many thanks to Mahesh Jayaram for advice for this protocol and Samir Srivastava for peer reviewing the protocol as well as Genevieve Gariepy and Matteo Rabaioli for peer reviewing the full review. We also thank Katie Jones for help with data extraction of included studies. The Cochrane Schizophrenia Group Editorial Base in Nottingham produces and maintains standard text for use in the methods section of their reviews. We have used this text as the basis of what appears here and adapted it as required.
We also thank Katie Jones for her help with data extraction of included studies.
“This project was supported by the National Institute for Health Research, via Cochrane Infrastructure funding to the Schizophrenia Group. The views and opinions expressed therein are those of the authors and do not necessarily reflect those of the Systematic Reviews Programme, NIHR, NHS or the Department of Health.”
Data and analyses
Comparison 1. FLUPHENAZINE (ORAL) vs AMISULPRIDE.
| Outcome or subgroup title | No. of studies | No. of participants | Statistical method | Effect size |
|---|---|---|---|---|
| 1 Global state: 1. Average endpoint score of CGI scales (high = poor) | 1 | Mean Difference (IV, Random, 95% CI) | Subtotals only | |
| 1.1 short term (up to 12 weeks) | 1 | 36 | Mean Difference (IV, Random, 95% CI) | ‐0.34 [‐0.90, 0.22] |
| 2 Mental state: 2a. Average endpoint score of various scales (high = poor) | 2 | Mean Difference (IV, Random, 95% CI) | Subtotals only | |
| 2.1 BPRS ‐ anxiety/depression subscale score ‐ short term (up to 12 weeks) | 1 | 57 | Mean Difference (IV, Random, 95% CI) | 2.60 [1.40, 3.80] |
| 2.2 BPRS total score ‐ short term (up to 12 weeks) | 1 | 57 | Mean Difference (IV, Random, 95% CI) | 5.10 [‐2.35, 12.55] |
| 2.3 SANS total score ‐ short term (up to 12 weeks) | 1 | 36 | Mean Difference (IV, Random, 95% CI) | ‐9.49 [‐17.88, ‐1.10] |
| 3 Mental state: 2b. Average endpoint score of AMDP scale (high = poor) | Other data | No numeric data | ||
| 3.1 short term (up to 12 weeks) | Other data | No numeric data | ||
| 4 Adverse effects: 1. Extrapyramidal effects | 1 | Risk Ratio (M‐H, Random, 95% CI) | Subtotals only | |
| 4.1 concomitant anticholinergic medication ‐ short term (up to 12 weeks) | 1 | 36 | Risk Ratio (M‐H, Random, 95% CI) | 7.82 [1.07, 57.26] |
| 5 Leaving the study early | 2 | Risk Ratio (IV, Random, 95% CI) | Subtotals only | |
| 5.1 any reason | 2 | 98 | Risk Ratio (IV, Random, 95% CI) | 1.19 [0.63, 2.28] |
| 5.2 adverse effects ‐ short term (up to 12 weeks) | 2 | 98 | Risk Ratio (IV, Random, 95% CI) | 1.88 [0.24, 14.68] |
| 5.3 inefficacy ‐ short term (up to 12 weeks) | 2 | 98 | Risk Ratio (IV, Random, 95% CI) | 1.82 [0.68, 4.84] |
| 5.4 productive symptoms ‐ short term (up to 12 weeks) | 1 | 36 | Risk Ratio (IV, Random, 95% CI) | 0.37 [0.04, 3.25] |
Comparison 2. FLUPHENAZINE (ORAL) vs RISPERIDONE.
| Outcome or subgroup title | No. of studies | No. of participants | Statistical method | Effect size |
|---|---|---|---|---|
| 1 Clinically important response (defined by study) | 1 | Risk Ratio (M‐H, Random, 95% CI) | Subtotals only | |
| 1.1 short term (up to 12 weeks) | 1 | 26 | Risk Ratio (M‐H, Random, 95% CI) | 0.67 [0.13, 3.35] |
| 2 Global state: 1. Average endpoint score of CGI scales (high = poor) | 1 | Mean Difference (IV, Random, 95% CI) | Subtotals only | |
| 2.1 short term (up to 12 weeks) | 1 | 26 | Mean Difference (IV, Random, 95% CI) | 0.07 [‐0.77, 0.91] |
| 3 Mental state: 2a. Average endpoint scores (BPRS, high = poor) | 1 | Mean Difference (IV, Random, 95% CI) | Subtotals only | |
| 3.1 BPRS endpoint total scale score ‐ short term (up to 12 weeks) | 1 | 25 | Mean Difference (IV, Random, 95% CI) | ‐1.98 [‐12.96, 9.00] |
| 3.2 BPRS positive subscale score ‐ short term (up to 12 weeks) | 1 | 25 | Mean Difference (IV, Random, 95% CI) | ‐0.15 [‐4.22, 3.92] |
| 3.3 BPRS negative subscale score ‐ short term (up to 12 weeks) | 1 | 25 | Mean Difference (IV, Random, 95% CI) | ‐1.54 [‐3.94, 0.86] |
| 3.4 BPRS hostile subscale score ‐ short term (up to 12 weeks) | 1 | 25 | Mean Difference (IV, Random, 95% CI) | 0.92 [‐2.21, 4.05] |
| 4 Mental state: 2b. Average endpoint score of various scales (high = poor) ‐ short term (up to 12 weeks) (skewed data) | Other data | No numeric data | ||
| 4.1 BPRS anxiety/depression subscale score | Other data | No numeric data | ||
| 4.2 BPRS activation subscale score | Other data | No numeric data | ||
| 5 Adverse effects: 1. Anticholinergic effect | 1 | Risk Ratio (M‐H, Random, 95% CI) | Subtotals only | |
| 5.1 blurred vision ‐ short term (up to 12 weeks) | 1 | 25 | Risk Ratio (M‐H, Random, 95% CI) | 1.08 [0.18, 6.53] |
| 5.2 dry mouth ‐ short term (up to 12 weeks) | 1 | 25 | Risk Ratio (M‐H, Random, 95% CI) | 1.08 [0.18, 6.53] |
| 5.3 urinary hesitancy ‐ short term (up to 12 weeks) | 1 | 25 | Risk Ratio (M‐H, Random, 95% CI) | 5.38 [0.28, 101.96] |
| 6 Adverse effects: 2. Central nervous system | 1 | Risk Ratio (M‐H, Random, 95% CI) | Subtotals only | |
| 6.1 anxiety ‐ short term (up to 12 weeks) | 1 | 25 | Risk Ratio (M‐H, Random, 95% CI) | 0.54 [0.06, 5.24] |
| 6.2 headache ‐ short term (up to 12 weeks) | 1 | 25 | Risk Ratio (M‐H, Random, 95% CI) | 0.77 [0.33, 1.79] |
| 6.3 lethargy ‐ short term (up to 12 weeks) | 1 | 25 | Risk Ratio (M‐H, Random, 95% CI) | 0.81 [0.23, 2.91] |
| 6.4 insomnia ‐ short term (up to 12 weeks) | 1 | 25 | Risk Ratio (M‐H, Random, 95% CI) | 1.81 [0.55, 5.98] |
| 6.5 somnolence ‐ short term (up to 12 weeks) | 1 | 25 | Risk Ratio (M‐H, Random, 95% CI) | 0.87 [0.30, 2.49] |
| 7 Adverse effects: 3. Gastrointestinal | 1 | Risk Ratio (M‐H, Random, 95% CI) | Subtotals only | |
| 7.1 constipation ‐ short term (up to 12 weeks) | 1 | 25 | Risk Ratio (M‐H, Random, 95% CI) | 9.69 [0.58, 163.02] |
| 7.2 diarrhoea ‐ short term (up to 12 weeks) | 1 | 25 | Risk Ratio (M‐H, Random, 95% CI) | 0.22 [0.01, 4.08] |
| 7.3 dyspepsia ‐ short term (up to 12 weeks) | 1 | 25 | Risk Ratio (M‐H, Random, 95% CI) | 3.25 [0.39, 27.15] |
| 7.4 nausea/vomiting ‐ short term (up to 12 weeks) | 1 | 25 | Risk Ratio (M‐H, Random, 95% CI) | 0.72 [0.14, 3.61] |
| 8 Adverse effects: 4. Other adverse events | 1 | Risk Ratio (M‐H, Random, 95% CI) | Subtotals only | |
| 8.1 urinary frequency ‐ short term (up to 12 weeks) | 1 | 25 | Risk Ratio (M‐H, Random, 95% CI) | 0.36 [0.02, 8.05] |
| 8.2 orthostasis ‐ short term (up to 12 weeks) | 1 | 25 | Risk Ratio (M‐H, Random, 95% CI) | 0.43 [0.10, 1.83] |
| 8.3 increased appetite ‐ short term (up to 12 weeks) | 1 | 25 | Risk Ratio (M‐H, Random, 95% CI) | 0.72 [0.14, 3.61] |
| 8.4 dizziness ‐ short term (up to 12 weeks) | 1 | 25 | Risk Ratio (M‐H, Random, 95% CI) | 0.36 [0.04, 3.02] |
| 9 Adverse effects: 5. Average endpoint weight loss (kg) (skewed data) | Other data | No numeric data | ||
| 9.1 short term (up to 12 weeks) | Other data | No numeric data | ||
| 10 Leaving the study early | 1 | Risk Ratio (IV, Random, 95% CI) | Subtotals only | |
| 10.1 inefficacy ‐ short term (up to 12 weeks) | 1 | 25 | Risk Ratio (IV, Random, 95% CI) | 1.08 [0.08, 15.46] |
Comparison 3. FLUPHENAZINE (ORAL) vs QUETIAPINE.
| Outcome or subgroup title | No. of studies | No. of participants | Statistical method | Effect size |
|---|---|---|---|---|
| 1 Clinically important response (defined by study) | 1 | Risk Ratio (M‐H, Random, 95% CI) | Subtotals only | |
| 1.1 short term (up to 12 weeks) | 1 | 25 | Risk Ratio (M‐H, Random, 95% CI) | 0.62 [0.12, 3.07] |
| 2 Global state: 1. CGI: Average endpoint CGI‐SI (high = poor) | 1 | Mean Difference (IV, Random, 95% CI) | Subtotals only | |
| 2.1 short term (up to 12 weeks) | 1 | 25 | Mean Difference (IV, Random, 95% CI) | ‐0.03 [‐0.92, 0.86] |
| 3 Mental state: 2a. General ‐ average endpoint score (BPRS total, high = poor) | 1 | Mean Difference (IV, Random, 95% CI) | Subtotals only | |
| 3.1 short term (up to 12 weeks) | 1 | 25 | Mean Difference (IV, Random, 95% CI) | ‐1.98 [‐12.96, 9.00] |
| 4 Mental state: 2b. Positive symptoms ‐ average endpoint score (BPRS positive sub‐score, high = poor) | 1 | Mean Difference (IV, Random, 95% CI) | Subtotals only | |
| 4.1 short term (up to 12 weeks) | 1 | 25 | Mean Difference (IV, Random, 95% CI) | ‐13.61 [‐20.77, ‐6.45] |
| 5 Mental state: 2c. Negative symptoms ‐ average endpoint score (BPRS negative sub‐score, high = poor) | 1 | Mean Difference (IV, Random, 95% CI) | Subtotals only | |
| 5.1 short term (up to 12 weeks) | 1 | 24 | Mean Difference (IV, Random, 95% CI) | ‐0.11 [‐2.27, 2.05] |
| 6 Mental state: 2d. Anxiety/depression symptoms ‐ average endpoint score (BPRS anxiety/depression sub‐score, high score = poor) | Other data | No numeric data | ||
| 6.1 short term (up to 12 weeks) | Other data | No numeric data | ||
| 7 Mental state: 2e. Hostility symptoms ‐ average endpoint score (BPRS hostility sub‐score, high = poor) | 1 | Mean Difference (IV, Random, 95% CI) | Subtotals only | |
| 7.1 short term (up to 12 weeks) | 1 | 24 | Mean Difference (IV, Random, 95% CI) | 0.79 [‐2.45, 4.03] |
| 8 Mental state: 2f. Activation symptoms ‐ average endpoint score (BPRS activation sub‐score, high = poor) | Other data | No numeric data | ||
| 8.1 short term (up to 12 weeks) | Other data | No numeric data | ||
| 9 Adverse effects: 1. Anticholinergic effect | 1 | Risk Ratio (M‐H, Random, 95% CI) | Subtotals only | |
| 9.1 dry mouth ‐ short term (up to 12 weeks) | 1 | 24 | Risk Ratio (M‐H, Random, 95% CI) | 1.0 [0.17, 5.98] |
| 9.2 blurred vision ‐ short term (up to 12 weeks) | 1 | 24 | Risk Ratio (M‐H, Random, 95% CI) | 1.0 [0.17, 5.98] |
| 9.3 urinary hesitancy ‐ short term (up to 12 weeks) | 1 | 24 | Risk Ratio (M‐H, Random, 95% CI) | 1.0 [0.17, 5.98] |
| 10 Adverse effects: 2. Central nervous system | 1 | Risk Ratio (M‐H, Random, 95% CI) | Subtotals only | |
| 10.1 anxiety ‐ short term (up to 12 weeks) | 1 | 24 | Risk Ratio (M‐H, Random, 95% CI) | 1.0 [0.07, 14.21] |
| 10.2 headache ‐ short term (up to 12 weeks) | 1 | 24 | Risk Ratio (M‐H, Random, 95% CI) | 1.0 [0.39, 2.58] |
| 10.3 insomnia ‐ short term (up to 12 weeks) | 1 | 24 | Risk Ratio (M‐H, Random, 95% CI) | 1.67 [0.51, 5.46] |
| 10.4 lethargy ‐ short term (up to 12 weeks) | 1 | 24 | Risk Ratio (M‐H, Random, 95% CI) | 1.5 [0.30, 7.43] |
| 10.5 somnolence ‐ short term (up to 12 weeks) | 1 | 24 | Risk Ratio (M‐H, Random, 95% CI) | 1.33 [0.38, 4.72] |
| 11 Adverse effects: 3. Gastrointerstinal adverse effects | 1 | Risk Ratio (M‐H, Random, 95% CI) | Subtotals only | |
| 11.1 constipation ‐ short term (up to 12 weeks) | 1 | 24 | Risk Ratio (M‐H, Random, 95% CI) | 1.0 [0.32, 3.10] |
| 11.2 diarrhoea ‐ short term (up to 12 weeks) | 1 | 24 | Risk Ratio (M‐H, Random, 95% CI) | 0.2 [0.01, 3.77] |
| 11.3 dyspepsia ‐ short term (up to 12 weeks) | 1 | 24 | Risk Ratio (M‐H, Random, 95% CI) | 3.0 [0.36, 24.92] |
| 11.4 nausea/ vomiting ‐ short term (up to 12 weeks) | 1 | 24 | Risk Ratio (M‐H, Random, 95% CI) | 2.0 [0.21, 19.23] |
| 12 Adverse effects: 4a. Other adverse events | 1 | Risk Ratio (M‐H, Random, 95% CI) | Subtotals only | |
| 12.1 dizziness ‐ short term (up to 12 weeks) | 1 | 24 | Risk Ratio (M‐H, Random, 95% CI) | 1.0 [0.07, 14.21] |
| 12.2 increased appetite ‐ short term (up to 12 weeks) | 1 | 24 | Risk Ratio (M‐H, Random, 95% CI) | 0.67 [0.13, 3.30] |
| 12.3 orthostasis ‐ short term (up to 12 weeks) | 1 | 24 | Risk Ratio (M‐H, Random, 95% CI) | 2.0 [0.21, 19.23] |
| 12.4 urinary frequency ‐ short term (up to 12 weeks) | 1 | 24 | Risk Ratio (M‐H, Random, 95% CI) | 0.33 [0.01, 7.45] |
| 13 Adverse effects: 4b. Other ‐ average endpoint weight loss (average weight in kg) (skewed) | Other data | No numeric data | ||
| 13.2 short term (up to 12 weeks) | Other data | No numeric data | ||
| 14 Leaving the study early | 1 | Risk Ratio (IV, Random, 95% CI) | Subtotals only | |
| 14.1 inefficacy ‐ short term (up to 12 weeks) | 1 | 25 | Risk Ratio (IV, Random, 95% CI) | 0.46 [0.05, 4.46] |
| 14.2 adverse effects ‐ short term (up to 12 weeks) | 1 | 25 | Risk Ratio (IV, Random, 95% CI) | 0.19 [0.01, 3.52] |
Comparison 4. FLUPHENAZINE (ORAL) vs OLANZAPINE.
| Outcome or subgroup title | No. of studies | No. of participants | Statistical method | Effect size |
|---|---|---|---|---|
| 1 Clinically important response (defined by author) | 1 | Risk Ratio (M‐H, Random, 95% CI) | Subtotals only | |
| 1.1 short term (up to 12 weeks) | 1 | 60 | Risk Ratio (M‐H, Random, 95% CI) | 1.33 [0.86, 2.07] |
| 1.2 medium term (13 to 26 weeks) | 1 | 60 | Risk Ratio (M‐H, Random, 95% CI) | 1.6 [0.87, 2.94] |
| 2 Global state: 1. CGI: Average change CGI‐SI (high = poor) | 1 | Mean Difference (IV, Random, 95% CI) | Subtotals only | |
| 2.1 short term (up to 12 weeks) | 1 | 55 | Mean Difference (IV, Random, 95% CI) | 0.7 [‐0.01, 1.41] |
| 2.2 medium term (13 to 26 weeks) | 1 | 55 | Mean Difference (IV, Random, 95% CI) | 0.90 [0.13, 1.67] |
| 3 Mental state: 2a. General ‐ average change score (BPRS total, high = poor) | 1 | Mean Difference (IV, Random, 95% CI) | Subtotals only | |
| 3.1 short term (up to 12 weeks) | 1 | 54 | Mean Difference (IV, Random, 95% CI) | 7.1 [‐1.15, 15.35] |
| 3.2 medium term (13 to 26 weeks) | 1 | 54 | Mean Difference (IV, Random, 95% CI) | 9.3 [0.10, 18.50] |
| 4 Mental state: 2b. General ‐ average change score (PANSS total, high = poor) | 1 | Mean Difference (IV, Random, 95% CI) | Subtotals only | |
| 4.1 short term (up to 12 weeks) | 1 | 54 | Mean Difference (IV, Random, 95% CI) | 12.0 [‐2.03, 26.03] |
| 4.2 medium term (13 to 26 weeks) | 1 | 54 | Mean Difference (IV, Random, 95% CI) | 16.20 [0.41, 31.99] |
| 5 Mental state: 2c. Positive symptoms ‐ average change score (BPRS positive sub‐score, high = poor) | 1 | Mean Difference (IV, Random, 95% CI) | Subtotals only | |
| 5.1 short term (up to 12 weeks) | 1 | 55 | Mean Difference (IV, Random, 95% CI) | 2.3 [‐0.67, 5.27] |
| 5.2 medium term (13 to 26 weeks) | 1 | 55 | Mean Difference (IV, Random, 95% CI) | 2.90 [‐0.29, 6.09] |
| 6 Mental state: 2d. Positive symptoms ‐ average endpoint score (PANSS positive sub‐score, high = poor) | 1 | Mean Difference (IV, Random, 95% CI) | Subtotals only | |
| 6.1 short term (up to 12 weeks) | 1 | 55 | Mean Difference (IV, Random, 95% CI) | ‐5.1 [‐9.68, ‐0.52] |
| 6.2 medium term (13 to 26 weeks) | 1 | 55 | Mean Difference (IV, Random, 95% CI) | ‐5.1 [‐9.82, ‐0.38] |
| 7 Mental state: 2e. Negative symptoms ‐ average change score (BPRS negative sub‐score, high = poor) | 1 | Mean Difference (IV, Random, 95% CI) | Subtotals only | |
| 7.1 short term (up to 12 weeks) | 1 | 55 | Mean Difference (IV, Random, 95% CI) | 1.20 [‐0.47, 2.87] |
| 7.2 medium term (13 to 26 weeks) | 1 | 55 | Mean Difference (IV, Random, 95% CI) | 1.70 [‐0.31, 3.71] |
| 8 Mental state: 2f. Negative symptoms ‐ average change score (PANSS negative sub‐score, high = poor) | 1 | Mean Difference (IV, Random, 95% CI) | Subtotals only | |
| 8.1 short term (up to 12 weeks) | 1 | 54 | Mean Difference (IV, Random, 95% CI) | 2.40 [‐0.96, 5.76] |
| 8.2 medium term (13 to 26 weeks) | 1 | 54 | Mean Difference (IV, Random, 95% CI) | 3.0 [‐1.22, 7.22] |
| 9 Mental state: 2g. General psychopathology ‐ average change score (PANSS general psychopathology sub‐score, high = poor) | 1 | Mean Difference (IV, Random, 95% CI) | Subtotals only | |
| 9.1 short term (up to 12 weeks) | 1 | 54 | Mean Difference (IV, Random, 95% CI) | 6.20 [‐0.90, 13.30] |
| 9.2 medium term (13 to 26 weeks) | 1 | 54 | Mean Difference (IV, Random, 95% CI) | 8.2 [0.43, 15.97] |
| 10 Mental state: 2h. Anxiety ‐ average change score (HAMA, high = poor) | 1 | Mean Difference (IV, Random, 95% CI) | Subtotals only | |
| 10.1 short term (up to 12 weeks) | 1 | 54 | Mean Difference (IV, Random, 95% CI) | 4.00 [0.08, 7.92] |
| 10.2 medium term (13 to 26 weeks) | 1 | 59 | Mean Difference (IV, Random, 95% CI) | 6.0 [‐0.12, 12.12] |
| 11 Satisfaction with treatment: 1. Average change score (DAI, low = poor) | 1 | Mean Difference (IV, Random, 95% CI) | Subtotals only | |
| 11.1 short term (up to 12 weeks) | 1 | 52 | Mean Difference (IV, Random, 95% CI) | ‐1.2 [‐2.44, 0.04] |
| 11.2 medium term (13 to 26 weeks) | 1 | 52 | Mean Difference (IV, Random, 95% CI) | ‐1.1 [‐2.08, ‐0.12] |
| 12 Adverse effects: 1. General | 1 | Risk Ratio (IV, Random, 95% CI) | Subtotals only | |
| 12.1 at least one adverse effect ‐ medium term (13 to 26 weeks) | 1 | 60 | Risk Ratio (IV, Random, 95% CI) | 1.53 [1.02, 2.31] |
| 13 Adverse effects: 2. Anticholinergic effect | 1 | Mean Difference (IV, Random, 95% CI) | Subtotals only | |
| 13.1 concomitant anticholinergic medication ‐ average endpoint dosage (mg/d) ‐ short term (up to 12 weeks) | 1 | 60 | Mean Difference (IV, Random, 95% CI) | 0.89 [0.35, 1.43] |
| 13.2 concomitant anticholinergic medication ‐ average endpoint dosage (mg/d) ‐ medium term (13 to 26 weeks) | 1 | 60 | Mean Difference (IV, Random, 95% CI) | 1.08 [0.28, 1.88] |
| 14 Adverse effects: 3a. Central nervous system | 1 | Risk Ratio (M‐H, Random, 95% CI) | Subtotals only | |
| 14.1 insomnia ‐ short term (up to 12 weeks) | 1 | 60 | Risk Ratio (M‐H, Random, 95% CI) | 13.0 [0.76, 220.96] |
| 15 Adverse effects: 3b. CNS (LSEQ, low = poor) | 1 | Mean Difference (IV, Random, 95% CI) | Subtotals only | |
| 15.1 awakening from sleep average endpoint score ‐ short term (up to 12 weeks) | 1 | 53 | Mean Difference (IV, Random, 95% CI) | ‐2.7 [‐10.18, 4.78] |
| 15.2 behaviour following wakefulness average endpoint score ‐ short term (up to 12 weeks) | 1 | 53 | Mean Difference (IV, Random, 95% CI) | ‐6.60 [‐13.92, 0.72] |
| 15.3 getting to sleep average endpoint score ‐ short term (up to 12 weeks) | 1 | 53 | Mean Difference (IV, Random, 95% CI) | ‐4.4 [‐14.18, 5.38] |
| 15.4 sleep quality ‐ average endpoint score ‐ short term (up to 12 weeks) | 1 | 53 | Mean Difference (IV, Random, 95% CI) | ‐6.10 [‐15.97, 3.77] |
| 16 Adverse effects: 4a. Extrapyramidal effects | 1 | Risk Ratio (IV, Random, 95% CI) | Subtotals only | |
| 16.1 akathisia ‐ short term (up to 12 weeks) | 1 | 60 | Risk Ratio (IV, Random, 95% CI) | 3.0 [0.90, 10.01] |
| 16.2 hypertonia ‐ short term (up to 12 weeks) | 1 | 60 | Risk Ratio (IV, Random, 95% CI) | 3.0 [0.33, 27.23] |
| 16.3 tremor ‐ short term (up to 12 weeks) | 1 | 60 | Risk Ratio (IV, Random, 95% CI) | 1.0 [0.22, 4.56] |
| 17 Adverse effects: 4b. Extrapyramidal effects ‐ average change score (SAS, high = poor) | 1 | Mean Difference (IV, Random, 95% CI) | Subtotals only | |
| 17.1 short term (up to 12 weeks) | 1 | 60 | Mean Difference (IV, Random, 95% CI) | 4.20 [1.68, 6.72] |
| 17.2 medium term (13 to 26 weeks) | 1 | 60 | Mean Difference (IV, Random, 95% CI) | 4.0 [1.02, 6.98] |
| 18 Adverse effects: 4c. Extrapyramidal effects ‐ average change score (HAS, high = poor) | 1 | Mean Difference (IV, Random, 95% CI) | Subtotals only | |
| 18.1 short term (up to 12 weeks) | 1 | 59 | Mean Difference (IV, Random, 95% CI) | 6.6 [0.88, 12.32] |
| 18.2 medium term (13 to 26 weeks) | 1 | 59 | Mean Difference (IV, Random, 95% CI) | 6.0 [‐0.12, 12.12] |
| 19 Adverse effects: 4d. Extrapyramidal effects ‐ average change score (AIMS, high = poor) | 1 | Mean Difference (IV, Random, 95% CI) | Subtotals only | |
| 19.1 short term (up to 12 weeks) | 1 | 60 | Mean Difference (IV, Random, 95% CI) | 1.1 [‐0.11, 2.31] |
| 19.2 medium term (13 to 26 weeks) | 1 | 60 | Mean Difference (IV, Random, 95% CI) | 1.1 [‐0.45, 2.65] |
| 20 Adverse effects: 5. Other adverse events | 1 | Risk Ratio (M‐H, Random, 95% CI) | Subtotals only | |
| 20.1 weight gain ‐ medium term (13 to 26 weeks) | 1 | 60 | Risk Ratio (M‐H, Random, 95% CI) | 0.09 [0.01, 1.57] |
| 21 Adverse effects: 5b. Other adverse events | 1 | Mean Difference (IV, Random, 95% CI) | Subtotals only | |
| 21.1 concomitant anxiolytics medication average dosage (mg/d) ‐ short term (up to 12 weeks) | 1 | 60 | Mean Difference (IV, Random, 95% CI) | 4.65 [0.07, 9.23] |
| 21.2 concomitant anxiolytics medication ‐ average dosage (mg/d)‐ medium term (13 to 26 weeks) | 1 | 60 | Mean Difference (IV, Random, 95% CI) | 6.10 [0.63, 11.57] |
| 21.3 effects on physiology ‐ supine systolic blood pressure (average in mmHg) ‐ short term (up to 12 weeks) | 1 | 60 | Mean Difference (IV, Random, 95% CI) | ‐10.0 [‐18.11, ‐1.89] |
| 21.4 effects on physiology ‐ supine systolic blood pressure (average in mmHg) ‐ medium term (13 to 26 weeks) | 1 | 60 | Mean Difference (IV, Random, 95% CI) | ‐10.0 [‐18.11, ‐1.89] |
| 22 Adverse effects: 5c. Other (skewed) | Other data | No numeric data | ||
| 22.1 weight gain (average weight in kg) ‐ short term (up to 12 weeks) | Other data | No numeric data | ||
| 22.2 weight gain (average weight in kg) ‐ medium term (13 to 26 weeks) | Other data | No numeric data | ||
| 23 Leaving the study early | 1 | Risk Ratio (IV, Random, 95% CI) | Subtotals only | |
| 23.1 inefficacy ‐ short term (up to 12 weeks) | 1 | 60 | Risk Ratio (IV, Random, 95% CI) | 3.0 [0.33, 27.23] |
| 23.2 adverse effects ‐ medium term (13 to 26 weeks) | 1 | 60 | Risk Ratio (IV, Random, 95% CI) | 9.00 [0.51, 160.17] |
Characteristics of studies
Characteristics of included studies [ordered by study ID]
Boyer 1987.
| Methods | Allocation: randomised. Blindness: not stated. Duration: 3 weeks washout plus 6 weeks treatment period. Setting: not stated. Design: parallel. |
|
| Participants | Diagnosis: schizophrenia (DSM‐III). N = 62. Age: 21‐53 years old. Sex: 43 men, 19 women. Duration ill: mean˜12.3 years, SD˜4.7 years. Inclusion criteria: duration ill between 1 to 20 years; absence of marked positive symptoms; score >7 on DSAS. Exclusion criteria: not received antipsychotics in previous month. |
|
| Interventions | 1. Fluphenazine: 2 mg to 12 mg/day. N = 28. 2. Amisulpride: 50 mg to 300 mg/day. N = 34. |
|
| Outcomes | Mental state: BPRS.* Leaving the study early. Unable to use ‐ Mental state: DSAS (not a validated scale). Behaviour: NOSIE (no SD reported). Adverse effects: physiological measures, CHESS (no data reported). |
|
| Notes | * The published papers clearly report SD as measure of variance but these seem to be SE and we treat them as such. | |
| Risk of bias | ||
| Bias | Authors' judgement | Support for judgement |
| Random sequence generation (selection bias) | Unclear risk | Quote: "After a 3‐week washout period, participants were randomly assigned" ‐ no further details. (p.296). |
| Allocation concealment (selection bias) | Unclear risk | Not stated. |
| Blinding of participants and personnel (performance bias) All outcomes | Unclear risk | Double‐blind. |
| Blinding of outcome assessment (detection bias) All outcomes | Unclear risk | Not stated. |
| Incomplete outcome data (attrition bias) All outcomes | High risk | Five participants did not complete ratings for various BPRS components. |
| Selective reporting (reporting bias) | High risk | Did not report complete data for NOSIE and CHESS. |
| Other bias | Unclear risk | None obvious. |
Conley 2005.
| Methods | Allocation: randomised, randomisation was performed by the dispensing pharmacy. Blindness: double‐blind. Duration: 12 weeks (with 4‐ to 6‐week open‐label qualification phase prior to randomisation). Setting: in‐patients, Maryland (USA) Design: parallel. |
|
| Participants | Diagnosis: schizophrenia (DSM‐III); therapy‐refractory. N = 40. Age:18‐65 years old. Sex: men = 30 and women = 8. Length of illness: not stated. Included criteria: persistent positive psychotic symptoms at study entry ("moderate" severity ≥ 4 points on a 1‐ to 7‐point scale) on 2 of 4 psychosis items on the BPRS scale; persistent global illness severity (BPRS total score ≥ 45 points on the 18‐item scale and a CGI score of ≥ 4 points [moderately ill]); two prior failed treatment trials with two different antipsychotics at doses of 600 mg/day chlorpromazine equivalents, each of at least 6 weeks duration; no stable period of good social/occupational functioning within the previous 5 years. Exclusion criteria: not stated. |
|
| Interventions | 1. Fluphenazine: mean, 13.2 mg/day, SD 1.17 mg/day, n = 13. 2. Risperidone: mean, 4.31 mg/day, SD 0.63 mg/day, n = 13. 3. Quetiapine: mean, 463.6 mg/day, SD 50.5 mg/day, n = 12. |
|
| Outcomes | Clinically important response: no clinical improvement*. Global state: CGI severity score. Mental state: BPRS (global score; negative, positive, anxiety‐depression score, hostility, activation score). Adverse effects. Leave the study early. Unable to use ‐ Simpson Angus Scale (SAS), the Barnes Akathisia Scale (BAS), and the Assessment of Involuntary Movements Scale (AIMS), Sexual Function: Changes in Sexual Function Questionnaire (CSFQ) (no data reported). Quality of life (no SD reported). Adverse effect: the Prolactin‐Related Adverse Event Questionnaire (PRAEQ) (no data reported). |
|
| Notes | Funding: National Institutes of Mental Health (NIMH grant MH‐47311); study medications supplied by Janssen Pharmaceutica and Astra‐Zeneca Pharmaceuticals. * decreased rate of BPRS score < 20%. |
|
| Risk of bias | ||
| Bias | Authors' judgement | Support for judgement |
| Random sequence generation (selection bias) | Unclear risk | Quote:"randomisation was performed by the dispensing pharmacy".(p.341) |
| Allocation concealment (selection bias) | Unclear risk | Not stated. |
| Blinding of participants and personnel (performance bias) All outcomes | Unclear risk | Quote: "After a 4‐6 week open‐label trial with either olanzapine (or a typical antipsychotic other than fluphenazine), participants who did not achieve a 20% reduction in their total BPRS scores and who still had a total BPRS ≥35 points were randomly assigned. After open‐label phase, participants were randomised to double blind study." No further details.(p.164) |
| Blinding of outcome assessment (detection bias) All outcomes | Unclear risk | Not stated. |
| Incomplete outcome data (attrition bias) All outcomes | High risk | N = 40 participants randomised ‐ n = 2 pieces of data "lost" (p.165); only results for 38 participants reported. |
| Selective reporting (reporting bias) | High risk | SAS, BAS, AIMS, NOSIE, CHESS, CSFQ, PRAEQ were not well‐reported. |
| Other bias | Unclear risk | Funding: National Institutes of Mental Health (NIMH grant MH‐47311), study medications supplied by Janssen Pharmaceutica and Astra‐Zeneca Pharmaceuticals. |
Dossenbach 1998.
| Methods | Allocation: randomised, no further information. Blindness: double‐blind. Duration: Acute phase: 6 weeks (2 to 9 days placebo lead‐in); long term: 22 weeks. Setting: hospital, multicentre, Croatia. Design: parallel. |
|
| Participants | Diagnosis: schizophrenia or schizoaffective disorder (DSM‐IV) N = 60. Age: mean˜35.4 years, SD˜10.4 years. Sex: men = 28 and women = 32. Length of illness: not stated. Inclusion criteria: schizophrenia, BPRS ≥ 42, CGI ≥ 4 . Exclusion criteria: pregnant or lactating women, serious or unstable illness; history of intolerance to olanzapine; DSM substance dependence excluding caffeine or nicotine within last 30 days; serious suicide risk; significantly elevated liver function results; active hepatitis B or current jaundice; received treatment with injectable neuroleptic within less than one dosing interval between depot neuroleptic injection prior to study entry; previously intolerant or non‐responsive to fluphenazine; previous participation in any olanzapine clinical trial; pregnancy or lactating; uncorrected hypothyroidism or hyperthyroidism, myasthenia gravis, narrow‐angle glaucoma, chronic urinary retention and/or clinically significant prostatic hypertrophy, a history of seizures, severe allergies or multiple adverse drug reactions, a history of leukopenia without known aetiology. |
|
| Interventions | 1. Fluphenazine: 5 mg to 20 mg/day, average, 11.7 ± 3.0 mg/day for acute phase (6 weeks) and 11.7 ± 3.0 mg/day for long term (22 weeks), n = 30. 2. Olanzapine: 6 mg to 21 mg/day, average, 13.6 ± 2.4 mg/day for acute phase (6 weeks) and 14.8 ± 2.5 mg/day for long term (22 weeks), n = 30. |
|
| Outcomes | Clinically important response: no clinical improvement*. Global state: CGI severity change score. Mental state: BPRS (global score; negative, positive change score); PANSS (total, positive, negative, general psychopathology change score), Hillside Akathisia Scale (HAS). Quality of Sleep scale: Leeds Sleep Evaluation Questionnaire (LSEQ) total and subscale score. Satisfaction: Drug Attitude Inventory (DAI). Extrapyramidal adverse effects: Simpson Angus Scale (SAS), and the Assessment of Involuntary Movements Scale (AIMS). Leave the study early. Unable to use: vital signs, ECG, laboratory findings, no data reported. HAMA subscale score. LSEQ in medium term, data not reported. |
|
| Notes | Funding: Eli Lilly and Company. *Two definitions: decreased rate of PANSS score < 40%, decreased rate of BPRS score < 40%.The data were reported separately in our data analysis based on these two definitions. |
|
| Risk of bias | ||
| Bias | Authors' judgement | Support for judgement |
| Random sequence generation (selection bias) | Unclear risk | Quotes: "Random allocation at a 1:1 ratio" (p.312) |
| Allocation concealment (selection bias) | Unclear risk | Not reported. |
| Blinding of participants and personnel (performance bias) All outcomes | Unclear risk | Quote: "This was a long‐term, randomised, double‐blind parallel clinical trial" (p.312) |
| Blinding of outcome assessment (detection bias) All outcomes | Unclear risk | Quote:"This was a long‐term, randomised, double‐blind parallel clinical trial" (p.312) |
| Incomplete outcome data (attrition bias) All outcomes | High risk | Out of 60 participants, five (n = 3 olanzapine; n = 2 fluphenazine) were excluded from efficacy analysis because they did not meet inclusion criteria for BPRS or CGI. Three participants missing from DAI results because of no baseline data for two (n = 1 olanzapine; n = 1 fluphenazine) and one participant on fluphenazine discontinuing without having a DAI performed. Four participants in fluphenazine group discontinued because of adverse event. All participants were included in safety analysis. |
| Selective reporting (reporting bias) | Low risk | All measured outcomes were well reported. |
| Other bias | High risk | Funding: sponsored by Eli Lilly and Company. |
Saletu 1994.
| Methods | Allocation: randomised,no further details. Blindness: double‐blind. Duration: 3‐day washout period plus 6 weeks treatment period. Setting: in‐patients, Austria. Design: parallel. |
|
| Participants | Diagnosis: DSM‐III schizophrenia. N = 40. Age: mean˜31 years,SD˜6.4 years. Sex: men = 32 and women = 8. Length of illness: mean 82.6˜118.3 months. Inclusion criteria:clinical diagnosis (ICD 9 criteria) of either a simple type (295.0), hebephrenic type (295.1) or residual type (295.6) of schizophrenia; minimal age of 18 years; minimal length of illness of 1 year; a necessity of 6 weeks in‐patient treatment. Exclusion criteria: an acute phase of a paranoid schizophrenia; pronounced symptoms of depression, neurotic asthenia or neurotic depression; reactive depressive psychosis; alcohol‐induced psychiatric disturbances; gravidity; physical illness; treatment with lithium salts; treatment with depot neuroleptics within the last 45 days; potential premature discontinuation of treatment. |
|
| Interventions | 1. Fluphenazine: 2 mg/day to 4 mg/day, n = 21. 2. Amisulpride: 50 mg/day to 100 mg/day, n = 19. During the first 2 weeks, the dosage consisted of single doses of 50 mg/day amisulpride or 2 mg/day fluphenazine. From the third week up to the sixth, the daily doses were 100 mg amisulpride (50 mg twice daily) and 4 mg fluphenazine (2 mg twice daily). |
|
| Outcomes | Global state: CGI Mental state: Association for Methodology and Documentation in Psychiatry (AMDP), SANS. Extrapyramidal adverse effects: Webster scale, contaminant of anticholinergic drugs. Adverse effect: Adverse experience questionnaire. Leave the study early. Unable to use: Global function: Grunberger AD test (Alphabetical cross‐out test); Grunberger psychomotor activity test; numerical memory test; Pauli test; reaction time test; complex reaction test; Zerssen well‐being scale; semantic differential polarity profile; state‐trait anxiety scale; CFF descending threshold; skin conductance (mean); skin conductance fluctuations. There is no SD reported and no reply from the author. Webster scale, Adverse experience questionnaire, EEG, no data reported on this outcome. |
|
| Notes | Funding: Experimental drugs supplied by Synthelabo Recherche/Laboratoires Delagrange (Bagneux, France). | |
| Risk of bias | ||
| Bias | Authors' judgement | Support for judgement |
| Random sequence generation (selection bias) | Unclear risk | Quote: "patients were included in the double‐blind, parallel group study" (p.127) |
| Allocation concealment (selection bias) | Unclear risk | Allocation concealment not described. |
| Blinding of participants and personnel (performance bias) All outcomes | Unclear risk | Quote:"patients were included in the double‐blind, parallel group study" (p.127) |
| Blinding of outcome assessment (detection bias) All outcomes | Unclear risk | Quote: "patients were included in the double‐blind, parallel group study" (p.127) |
| Incomplete outcome data (attrition bias) All outcomes | Unclear risk | Out of 40 participants, five discontinued therapy prematurely. Three amisulpride participants dropped out due to productive symptoms (days 14, 28 and 35) while two fluphenazine participants dropped out due to depressive symptoms (days 21 and 28). |
| Selective reporting (reporting bias) | High risk | Webster scale, adverse experience questionnaire and EEG were not reported. |
| Other bias | High risk | Funding: Experimental drugs supplied by Synthelabo Recherche/Laboratoires Delagrange (Bagneux, France). |
AIMS ‐ Assessment of Involuntary Movements Scale AMDP ‐ Association for Methodology and Documentation in Psychiatry BAS – Barnes Akathisa Scale BPRS – Brief Psychiatric Rating Scale CFF: critical flicker frequency CGI – Cognitive Global Impression CHESS ‐ Changes in Health, End‐Stage, Disease, Signs, and Symptoms CSFQ ‐ Changes in Sexual Functioning Questionnaire DAI – Drug Attitude Inventory DSAS – Depression Anxiety and Stress Scale DSM‐III: Diagnostic and Statistical Manual, third edition DSM‐IV: Diagnostic and Statistical Manual, fourth edition ECG ‐ electrocardiogram HAMA ‐ Hamilton Anxiety Scale HAS ‐ Hillside Akathisia Scale ICD: International Classification of Diseases LSEQ – Leeds Sleep Evaluation Questionnaire NOSIE – Nurses’ Observation Scale for Inpatient Evaluation PANSS – Positive and Negative Syndrome Scale PRAEQ ‐ Prolactin Related Adverse Event Questionnaire SANS – Scale for Assessment of Negative Symptoms SAS – Simpson‐Angus Scale SD: standard deviation SE: standard error
Characteristics of excluded studies [ordered by study ID]
| Study | Reason for exclusion |
|---|---|
| Boyer 1986 | Allocation: randomised. Participants: people with schizophrenia. Interventions: amisulpride versus haloperidol (n = 39), not fluphenazine. We are unclear if this study is one report of a larger multicentre trial (Boyer 1996). |
| Boyer 1987a | Allocation: randomised. Participants: people with schizophrenia. Interventions: amisulpride 100 mg versus amisulpride 300 mg versus placebo, not fluphenazine. |
| Boyer 1996 | Allocation: randomised. Participants: people with schizophrenia. Interventions: amisulpride versus haloperidol (n = 191), not fluphenazine. We are unclear if this study is the final report of trial also reported by individual centre (Boyer 1986). |
| Pickar 1992 | Allocation: not randomised, one arm cross‐over design. |
| Ravanic 1996 | Allocation: randomised. Paticipants: schizophrenia DSM III‐R. Intervention: fluphenazine versus clozapine. Outcomes: no usable data. |
DSM‐III‐R: Diagnostic and Statistical Manual, third edition, revised
Characteristics of studies awaiting assessment [ordered by study ID]
Djukic‐Dejanovic 2002.
| Methods | Allocation: randomised. |
| Participants | Diagnosis: schizophrenia (DSM‐IV). N = 44. |
| Interventions | 1. Fluphenazine. N = 10. 2. Clozapine. N = 23. 3. Haloperidol. N = 11. |
| Outcomes | Adverse effects. |
| Notes | Full paper required (conference abstract only) We are very unclear if this study is one further report of the Ravanic 1996 trial. Numbers of participants, and the short description is identical but interventions are similar but not the same. |
DSM‐IV: Diagnostic and Statistical Manual, fourth edition
Differences between protocol and review
Minor changes
1. Additions made to outcomes of interest; economic and patient‐important outcomes added
6. Economic
11.1 Average change in total cost of medical and mental health care 11.2 Total indirect and direct costs 11.3 Direct resource use: 11.3.1 Outpatients ‐ number of contacts (GP consultation, psychiatrist, psychologists, psychiatric nurse, counsellor, social worker) 11.3.2 Hospitalisation (taking battery of tests, patients’ physical, psychiatric and psychological profile and psychological assessment, number of days, relapse) 11.3.3 Medication (different types of antipsychotics to include dose and frequency, treatment of side effects) 11.3.4 Psychological therapies (different types of psychological therapies to include session numbers and frequency) 11.3.5 Other resources (day centres, night shelter) and transportation for medical care visits 11.4 Indirect resource use: 11.4.1 Family, relative and friends resources 11.4.2 Police, criminal justice system 11.4.3 Benefits paid, social security payments 11.4.4 Employment agency workers, absence from work, loss of productivity 11.5 Cost‐effectiveness ratios represented by the incremental cost‐effectiveness ratio (ICER) 11.6 Cost‐utilities represented by incremental costs per quality‐adjusted life year (QALY) or disability adjusted life year (DALYs) 11.7 Cost‐benefit represented by net Benefit Ratio, others.
2. Comparisons
We did not combine the various atypical drugs into one comparison (i.e. 'fluphenazine (oral) versus atypical), but instead presented the comparator drugs separately. The Cochrane Schizophrenia Group is in the process of making our systematic reviews more specific as regards drug comparisons in order to increase the quality and precision of the evidence; we adhered to this endeavour in this review process.
Contributions of authors
James Sampford: protocol development; helped write the full review.
Stephanie Sampson: protocol development; extracted data, undertook analyses, helped write the full review, helped with economic analyses.
Sai Zhao: helped with data extraction of included studies.
Jun Xia: helped with data extraction of included studies.
Bao Guo Li: helped with data extraction of included studies.
Vivek Furtado: economic analyses.
Sources of support
Internal sources
Leeds and York NHS Partnership Foundation Trust, UK.
External sources
-
NIHR Cochrane Programme Grant, UK.
Reference number: 10/4001/15
Declarations of interest
James Sampford: none known.
Stephanie Sampson: employed by the National Health Service to undertake Cochrane Programme Grant Reviews (SR ‐ 10/4001/15: Cost‐effective treatments and diagnostic approaches for people with schizophrenia within the NHS).
Sai Zhao: received payment from the NIHR funding detailed above.
Jun Xia: received payment from the NIHR funding detailed above.
Bao Guo Li: none known.
Vivek Furtado: none known
Edited (no change to conclusions)
References
References to studies included in this review
Boyer 1987 {published data only}
- Boyer P. Efficacy of low doses of atypical neuroleptics (benzamides) in defect states [Etude de l'efficacite de faibles doses de neuroleptiques atypiques (benzamides) dans les etats deficitaires]. Annales Medico‐Psychologiques 1986;144(6):593‐9. [MEDLINE: ] [PubMed] [Google Scholar]
- Boyer P, Puech AJ. Determinants for clinical activity of neuroleptic drugs: chemical substances, doses, assessment tools. Psychiatrie and Psychobiologie 1987;2(4):296‐305. [Google Scholar]
- Pichot P, Boyer P. A double blind, controlled, multicenter trial of low dose amisulpride (solian (R) 50) versus low dose fluphenazine in the treatment of negative symptoms in chronic schizophrenia [Essai multicentrique controle, en double insu, amisulpride (solian (r) 50) contre fluphenazine a faibles doses dans le traitement du syndrome deficitaire des schizophrenies chroniques]. Annales de Psychiatrie 1988;3(3):312‐20. [Google Scholar]
- Pichot P, Boyer P. Controlled double‐blind multi‐centre trial of low dose amisulpride versus fluphenazine in the treatment of the negative syndrome of chronic schizophrenia. In: Borenstein P, et al. editor(s). Amisulpride. Paris: Expansion Scientifique Française, 1989:125–38. [Google Scholar]
Conley 2005 {published data only}
- Conley RR. New antipsychotic strategies: quetiapine and risperidone vs. fluphenazine in treatment resistant schizophrenia. Http://www.clinicaltrials.gov 2005.
- Conley RR, Kelly DL, Nelson MW, Richardson CM, Feldman S, Benham R, et al. Risperidone, quetiapine, and fluphenazine in the treatment of patients with therapy‐refractory schizophrenia. Schizophrenia Bulletin 2005;31(4):163‐8. [DOI] [PubMed] [Google Scholar]
- Kelly D Conley RR. Sexual side effects of quetiapine and risperidone compared with fluphenazine. Psychoneuroendocrinology 1999.
- Kelly DL, Conley RR. A randomised double‐blind 12‐week study of quetiapine, risperidone or fluphenazine on sexual functioning in people with schizophrenia. Psychoneuroendocrinology 2006;31(3):340‐6. [DOI] [PubMed] [Google Scholar]
- Kelly DL, Conley RR. Thyroid function in treatment‐resistant schizophrenia patients treated with quetiapine, risperidone, or fluphenazine. Journal of Clinical Psychiatry 2005;66(1):80‐4. [DOI] [PubMed] [Google Scholar]
Dossenbach 1998 {published data only}
- Dossenbach M, Friedel P, Jakovljevic M, Hotujac L, Folnegovic V, Uglesic B, et al. Olanzapine versus fluphenazine ‐ six weeks treatment of acute schizophrenia. 10th European Colleague of Neuropsychopharmacology Congress; 1997 September 13‐17; Vienna. 1997.
- Dossenbach M, Jakovljevic M, Folnegovi V, Uglesic B, Dodig G, Friedel P, et al. Olanzapine versus fluphenazine ‐ six weeks of treatment of anxiety symptoms during acute schizophrenia. Proceedings of the 10th European College of Neuropsychopharmacology Congress; 1997 Sep 13‐17; Vienna, Austria. 1998, issue 1‐2:203.
- Dossenbach MRK, Folnegovic‐Smalc V, Hotujac L, Uglesic B, Tollefson GD, Grundy SL, et al. Double‐blind, randomized comparison of olanzapine versus fluphenazine in the long‐term treatment of schizophrenia. Progress in Neuro‐Psychopharmacology and Biological Psychiatry 2004;28(2):311‐8. [DOI] [PubMed] [Google Scholar]
- Jakovljevic M, Dossenbach MR, Friedel P, Schausberger B, Grundy SL, Hotujac L, et al. Olanzapine versus fluphenazine in the acute (six week) treatment of schizophrenia. Psychiatria Danubina 1999; Vol. 11, issue 1‐2:3‐11.
- Jakovljevic M, Dossenbach MRK. Olanzapine versus fluphenazine in the acute (six week) treatment of schizophrenia. Psychiatria Danubina 1999; Vol. 11, issue 1‐2:3‐10.
- Jakovljevic M, Pivac N, Mihaljevic‐Peles A, Mustapic M, Relja M, Ljubicic D, et al. The effects of olanzapine and fluphenazine on plasma cortisol, prolactin and muscle rigidity in schizophrenic patients: a double blind study. Progress in Neuro‐psychopharmacology & Biological Psychiatry 2007;31(2):399‐402. [DOI] [PubMed] [Google Scholar]
Saletu 1994 {published data only}
- Saletu B, Kufferle B, Grunberger J, Foldes P, Topitz A, Anderer P. Clinical, EEG mapping and psychometric studies in negative schizophrenia: comparative trials with amisulpride and fluphenazine. Neuropsychobiology 1994;29(3):125‐35. [DOI] [PubMed] [Google Scholar]
References to studies excluded from this review
Boyer 1986 {published data only}
- Boyer P. Efficacy of low doses of atypical neuroleptics (benzamides) in defect states [Etude de l'efficacite de faibles doses de neuroleptiques atypiques (benzamides) dans les etats deficitaires]. Annales Medico‐Psychologiques 1986;144(6):593‐9. [MEDLINE: ] [PubMed] [Google Scholar]
- Boyer P, Lecrubier Y, Puech AJ. Treatment of positive and negative symptoms: pharmacologic approaches. Modern Problems of PharmacoPsychiatry 1990;24:152‐74. [MEDLINE: ] [DOI] [PubMed] [Google Scholar]
- Pichot P, Boyer P. A controlled double‐blind multi‐centre trial of high dose amisulpride versus haloperidol in acute psychotic states. Amisulpride. Paris: Expansion Scientifique Francaise, 1989:83‐92. [Google Scholar]
- Pichot P, Boyer P. A double blind, controlled, multicenter trial of amisulpride versus high dose haloperidol in acute psychotic disorders. Annales de Psychiatrie 1988, issue 3:326‐32.
Boyer 1987a {published data only}
- Boyer P. Amisulpride in the treatment of negative schizophrenic symptoms: results of a double‐blind controlled trial versus placebo. Amisulpride. Paris: Expansion Scientifique Française, 1989:111‐23. [Google Scholar]
- Boyer P, Lecrubier Y, Puech AJ. Treatment of positive and negative symptoms: pharmacologic approaches. Modern Problems of PharmacoPsychiatry 1990;24:152‐74. [MEDLINE: ] [DOI] [PubMed] [Google Scholar]
- Boyer P, Puech A, Kossmann L, Lecrubier Y, Dewailly J. A controlled study versus placebo with low dose of amisulpride in the treatment of the purely deficit schizophrenia [Etude controlee versus placebo de faibles doses d'amisulpride dans le traitement des formes purement deficitaires de schizophrenie.]. L'Encephale 1989;15(2):300. [Google Scholar]
- Boyer P, Puech AJ, Lecrubier Y. Double blind trial versus placebo of low dose amisulpride (Solian 50) in schizophrenia with exclusively negative symptoms. Preliminary analysis of results [Etude en double insu contre placebo de l'amisulpride (Solian (r) 50) a faible dose chez des schizophrenes purement deficitaires. Premiere analyse des resultats]. Annales de Psychiatrie 1988;3(3):321‐5. [Google Scholar]
- Lecrubier Y, Puech AJ, Aubin F, Boyer P, Deyrieux B. Improvement by amisulpride of the negative syndrome in non‐psychotic subjects: a preliminary study. Psychiatrie and Psychobiologie 1988;3(5):329‐34. [MEDLINE: ] [Google Scholar]
Boyer 1996 {published data only}
- Boyer P, Turjanski S, Fleurot O. Amisulpride in the treatment of acute schizophrenia: a double‐blind comparison with haloperidol. Proceedings of the 20th Collegium Internationale Neuro‐Psychopharmacologicum Congress; 1996 Jun 23‐27; Melbourne, Australia. 1996.
- Möller HJ, Boyer P, Fleurot O, Rein W. Improvement of acute exacerbations of schizophrenia with amisulpride: a comparison with haloperidol. Psychopharmacology 1997;132(4):396‐401. [MEDLINE: ] [DOI] [PubMed] [Google Scholar]
- Möller HJ, Boyer P, Rein W, Eich FX. Treatment of schizophrenic patients with actue exacerbations: a double‐blind comparison of amisulpride and haloperidol. PharmacoPsychiatry 1997;30:199. [Google Scholar]
- Möller HJ, Boyer P, Turjanski S, Fleurot O. Amisulpride in the treatment of subchronic or chronic schizophrenia with acute exacerbation: a double‐blind comparison with haloperidol. Proceedings of the 8th Congress of the Association of European Psychiatrists; 1996 Jul 7‐12; London, UK. 1996.
Pickar 1992 {published data only}
Ravanic 1996 {published data only}
- Ravanic DB, Djukic‐Dejanovic SM, Stojiljkovic M, Jankovic S, Paunovic VR, Bankovic D. Antipsychotic efficacy of clozapine vs fluphenazine in positive and negative schizophrenia syndrome. Journal of Neural Transmission 1996; Vol. 103:Xlvi.
References to studies awaiting assessment
Djukic‐Dejanovic 2002 {published data only}
- Djukic‐Dejanovic SM, Pantovic MM, Alexopulos C, Milovanovic DR, Paunovic VR, Ravanic DB. Clozapine vs. classical antipsychotics in schizophrenia. Proceedings of the 12th World Congress of Psychiatry; 2002 Aug 24‐29; Yokohama, Japan. 2002.
Additional references
Altman 1996
- Altman DG, Bland JM. Detecting skewness from summary information. BMJ 1996;313(7066):1200. [DOI] [PMC free article] [PubMed] [Google Scholar]
Andreasen 1982
- Andreasen NC. Negative symptoms in schizophrenia: definition and reliability. Archives of General Psychiatry 1982;39(7):784‐8. [DOI] [PubMed] [Google Scholar]
APA 2004
- Lehman AF, Lieberman JA, Dixon LB, McGlashan TH, Miller AL, Perkins DO, et al. Practice guideline for the treatment of patients with schizophrenia, second edition. American Journal of Psychiatry 2004;161(Suppl 2):1‐56. [PubMed] [Google Scholar]
Bland 1997
- Bland JM. Statistics notes. Trials randomised in clusters. BMJ 1997;315:600. [DOI] [PMC free article] [PubMed] [Google Scholar]
Boissel 1999
- Boissel JP, Cucherat M, Li W, Chatellier G, Gueyffier F, Buyse M, et al. The problem of therapeutic efficacy indices, 3: comparison of the indices and their use [Apercu sur la problematique des indices d'efficacite therapeutique, 3: Comparaison des indices et utilisation. Groupe d'Etude des Indices D'efficacite]. Therapie 1999;54(4):405‐11. [PUBMED: 10667106] [PubMed] [Google Scholar]
CEA
- Cost‐Effectiveness Analysis Registry (CEA). https://research.tufts‐nemc.org/cear4/ accessed 11/09/13.
Darling 1959
- Darling HF. Fluphenazine: a preliminary study. Disease of the Nervous System 1959;20(4):167‐70. [PubMed] [Google Scholar]
Davies 2007
- Davies LM, Lewis S, Jones PB, Barnes TRE, Gaughran F, Hayhurst K, et al. Cost‐effectiveness of first‐ vs. second‐generation antipsychotic drugs: results from a randomised controlled trial in schizophrenia responding poorly to previous therapy. British Journal of Psychiatry 2007;191(JULY):14‐22. [EMBASE: 2007328135; MEDLINE: ] [DOI] [PubMed] [Google Scholar]
Deeks 2000
- Deeks J. Issues in the selection for meta‐analyses of binary data. Proceedings of the 8th International Cochrane Colloquium; 2000 Oct 25‐28; Cape Town. Cape Town: The Cochrane Collaboration, 2000.
Dencker 1988
- Dencker SJ, Johansson R, Malm U. Pharmacokinetic and pharmacodynamic studies on high doses of fluphenazine. Psychopharmacology (Berl) 1988;94(2):237‐41. [DOI] [PubMed] [Google Scholar]
Divine 1992
- Divine GW, Brown JT, Frazier LM. The unit of analysis error in studies about physicians' patient care behavior. Journal of General Internal Medicine 1992;7(6):623‐9. [DOI] [PubMed] [Google Scholar]
Donner 2002
- Donner A, Klar N. Issues in the meta‐analysis of cluster randomized trials. Statistics in Medicine 2002;21:2971‐80. [DOI] [PubMed] [Google Scholar]
Drummond 1996
- Drummond MF, Jefferson TO. Guidelines for authors and peer reviewers of economic submissions to the BMJ. BMJ 1996;313(3 August):275‐83. [DOI] [PMC free article] [PubMed] [Google Scholar]
Dysken 1981
- Dysken MW, Javaid JI, Chang SS, Schaffer C, Shahid A, Davis JM. Fluphenazine pharmacokinetics and therapeutic response. Psychopharmacology (Berl) 1981;73(3):205‐10. [DOI] [PubMed] [Google Scholar]
Egger 1997
- Egger M, Davey Smith G, Schneider M, Minder C. Bias in meta‐analysis detected by a simple, graphical test. BMJ 1997;315:629‐34. [DOI] [PMC free article] [PubMed] [Google Scholar]
Elbourne 2002
- Elbourne D, Altman DG, Higgins JPT, Curtina F, Worthingtond HV, Vaile A. Meta‐analyses involving cross‐over trials: methodological issues. International Journal of Epidemiology 2002;31(1):140‐9. [DOI] [PubMed] [Google Scholar]
Essali 2009
- Essali A, Al‐Haj HN, Li C, Rathbone J. Clozapine versus typical neuroleptic medication for schizophrenia. Cochrane Database of Systematic Reviews 2009, Issue 1. [DOI: 10.1002/14651858.CD000059.pub2; CD000059] [DOI] [PMC free article] [PubMed] [Google Scholar]
Evers 2005
- Evers S, Goossens M, Vet H, Tulder M, Ament A. Criteria list for assessment of methodological quality of economic evaluations: consensus on health economic criteria. International Journal of Technology Assessment in Health Care 2005;21(2 Spring):240‐5. [PubMed] [Google Scholar]
Fleischhacker 1989
- Fleischhacker WW, Bergmann KJ, Perovich R, Pestreich LK, Borenstein M, Lieberman JA, et al. The Hillside Akathisia Scale: a new rating instrument for neuroleptic‐induced akathisia. Psychopharmacological Bulletin 1989;25(2):222‐6. [PubMed] [Google Scholar]
Furukawa 2006
- Furukawa TA, Barbui C, Cipriani A, Brambilla P, Watanabe N. Imputing missing standard deviations in meta‐analyses can provide accurate results. Journal of Clinical Epidemiology 2006;59(7):7‐10. [DOI] [PubMed] [Google Scholar]
Gebhardt 1983
- Gebhardt R, Pietzcker A, Strauss A, Stoeckel M, Langer C, Freudenthal K. Scale formation in the AMDP‐system [Skalenbildung im AMDP‐System]. Archives of Psychiatry and Neurological Sciences 1983;233:223‐45. [DOI] [PubMed] [Google Scholar]
Grace 1991
- Grace AA. Phasic versus tonic dopamine release and the modulation of dopamine system responsivity: a hypothesis for the etiology of schizophrenia. Neuroscience 1991;41(1):1‐24. [DOI] [PubMed] [Google Scholar]
Gulliford 1999
- Gulliford MC. Components of variance and intraclass correlations for the design of community‐based surveys and intervention studies: data from the Health Survey for England 1994. American Journal of Epidemiology 1999;149:876‐83. [DOI] [PubMed] [Google Scholar]
Guy 1976
- Guy W. ECDEU Assessment Manual for Psychopharmacology. Rockville, MD: National Institute of Mental Health. DHEW Publication NO (ADM), 1976:124‐585. [Google Scholar]
Guy 1976a
- Guy E. Abnormal Involuntary Movement Scale. Rockville, MD, National Institute of Mental Health, U.S. Department of Health and Human Services: ECDEU Assessment Manual for Psychopharmacology 1976.
Healy 2012
- Healy D, Noury J, Harris M, Butt M, Linden S, Whitaker C, et al. Mortality in schizophrenia and related psychoses: data from two cohorts, 1875‐1924 and 1994‐2010. BMJ Open 2012;2(5):e001810. [DOI: 10.1136/bmjopen-2012-001810] [DOI] [PMC free article] [PubMed] [Google Scholar]
HEED
- Health Economic Evaluation Database (HEED). Online ISBN: 9780470510933. [DOI: 10.1002/9780470510933] [DOI]
HES 2012
- Hospital Episode Statistics, Admitted Patient Care ‐ England 2011‐12: Main Specialties (.xls). http://www.hscic.gov.uk/searchcatalogue?productid=9161&q=title%3a%22hospital+episode+statistics%22&sort=Relevance&size=10&page=1#top (accessed May 2013) 2011‐12.
Higgins 2003
- Higgins JP, Thompson SG, Deeks JJ, Altman DG. Measuring inconsistency in meta‐analyses. BMJ 2003;327:557‐60. [DOI] [PMC free article] [PubMed] [Google Scholar]
Higgins 2011
- Higgins JPT, Green S (editors). Cochrane Handbook for Systematic Reviews of Interventions Version 5.0.2 [updated September 2011]. The Cochrane Collaboration, 2011. Available from www.cochrane‐handbook.org.
Hogan 1983
- Hogan TP, Awad AG, Eastwood R. A self‐report scale predictive of drug compliance in schizophrenics: reliability and discriminative validity. Psychological Medicine 1983;13:177‐83. [DOI] [PubMed] [Google Scholar]
Hutton 2009
- Hutton JL. Number needed to treat and number needed to harm are not the best way to report and assess the results of randomised clinical trials. British Journal of Haematology 2009;146(1):27‐30. [DOI] [PubMed] [Google Scholar]
Jones 2006
- Jones PB, Barnes TRE, Davies L. Randomized controlled trial of the effect on quality of life of second‐ vs. first‐generation antipsychotic drugs in schizophrenia ‐ cost utility of the latest antipsychotic drugs in schizophrenia study (CUtLASS 1). Archives of General Psychiatry 2006;63:1079‐86. [DOI] [PubMed] [Google Scholar]
Kane 1986
- Kane JM, Woerner M, Sarantakos S. Depot neuroleptics: a comparison review of standard, intermediate and low‐dose regimens. Journal of Clinical Psychiatry 1986;47(Suppl 5):30‐3. [PubMed] [Google Scholar]
Kay 1986
- Kay SR, Opler LA, Fiszbein A. Positive and Negative Syndrome Scale (PANSS) Manual. North Tonawanda, NY: Multi‐Health Systems, 1986. [Google Scholar]
Kay 1987
- Kay SR, Fiszbein A, Opler LA. The positive and negative syndrome scale (PANSS) for schizophrenia. Schizophrenia Bulletin 1987;13:261‐76. [DOI] [PubMed] [Google Scholar]
Kendall 2011
- Kendall T. The rise and fall of the atypical antipsychotics. British Journal of Psychiatry 2011;199:266‐8. [DOI] [PubMed] [Google Scholar]
Leucht 2005
- Leucht S, Kane JM, Kissling W, Hamann J, Etschel E, Engel RR. What does the PANSS mean?. Schizophrenia Research 2005;79(2‐3):231‐8. [PUBMED: 15982856] [DOI] [PubMed] [Google Scholar]
Leucht 2005a
- Leucht S, Kane JM, Kissling W, Hamann J, Etschel E, Engel R. Clinical implications of brief psychiatric rating scale scores. British Journal of Psychiatry 2005;187:366‐71. [PUBMED: 16199797] [DOI] [PubMed] [Google Scholar]
Leucht 2009
- Leucht S, Corves C, Arbter D, Engel RR, Li C, Davis JM. Second‐generation versus first‐generation antipsychotic drugs for schizophrenia: a meta‐analysis. Lancet 2009;373(9657):31‐41. [DOI] [PubMed] [Google Scholar]
Lieberman 2005
- Lieberman JA, Stroup TS, McEvoy JP. Effectiveness of antipsychotic drugs in patients with chronic schizophrenia. New England Journal of Medicine 2005;353:1209‐23. [DOI] [PubMed] [Google Scholar]
Maayan 2015
- Maayan N, Quraishi Seema N, David A, Jayaswal A, Eisenbruch M, Rathbone J, et al. Fluphenazine decanoate (depot) and enanthate for schizophrenia. Cochrane Database of Systematic Reviews 2015, Issue 2. [DOI: 10.1002/14651858.CD000307.pub2; CD000307] [DOI] [PMC free article] [PubMed] [Google Scholar]
Maier 1988
- Maier W, Buller R, Philipp M, Heuser I. The Hamilton Anxiety Scale: reliability, validity and sensitivity to change in anxiety and depressive disorders. Journal of Affective Disorders 1988;14(1):61‐8. [DOI: 10.1016/0165-0327(88)90072-9] [DOI] [PubMed] [Google Scholar]
Mangalore 2007
- Mangalore R, Knapp M. Cost of schizophrenia in England. Journal of Mental Health Policy and Economics 2007;10(1):23–41. [PubMed] [Google Scholar]
Marshall 2000
- Marshall M, Lockwood A, Bradley C, Adams C, Joy C, Fenton M. Unpublished rating scales: a major source of bias in randomised controlled trials of treatments for schizophrenia. British Journal of Psychiatry 2000;176:249‐52. [DOI] [PubMed] [Google Scholar]
Marvaha 2004
- Marvaha S, Johnson S. Schizophrenia and employment ‐ a review. Social Psychiatry and Psychiatric Epidemiology 2004;39:337‐49. [DOI] [PubMed] [Google Scholar]
Matar 2013
- Matar HE, Almerie MQ, Sampson S. Fluphenazine (oral) versus placebo for schizophrenia. Cochrane Database of Systematic Reviews 2013, Issue 7. [DOI: 10.1002/14651858.CD006352.pub2; CD006352] [DOI] [PMC free article] [PubMed] [Google Scholar]
McGrath 2008
- McGrath J, Saha S, Chant D, Welham J. Schizophrenia: a concise overview of incidence, prevalence, and mortality. Epidemiological Review 2008;30:67‐76. [DOI] [PubMed] [Google Scholar]
Millar 1963
- Millar J. A trial of fluphenazine in schizophrenia. British Journal of Psychiatry 1963;109:428‐32. [Google Scholar]
NICE 2012
- National Institute for Health and Clinical Excellence. The Epilepsies: the diagnosis and management of the epilepsies in adults and children in primary and secondary care (Pharmacological Update of Clinical Guideline 20). NCGC National Clinical Guideline Centre 2012:1‐636.
Overall 1962
- Overall JE, Gorham DR. The brief psychiatric rating scale. Psychological Reports 1962;10:799‐812. [Google Scholar]
Parrott 1980
- Parrott AC, Hindmarch I. The Leeds sleep evaluation questionnaire in psychopharmacological investigations ‐ a review. Psychopharmacology 1980;71:173‐9. [DOI] [PubMed] [Google Scholar]
PSSRU 2012
- Compiled by Lesley Curtis. Unit costs of health and social care 2012. http://www.pssru.ac.uk/project‐pages/unit‐costs/2012/ (accessed May 2013) 2012:47.
Saha 2005
- Saha S, Chant D, Welham J, McGrath J. A systematic review of the prevalence of schizophrenia. PLoS Medicine 2005;2(5):e141. [DOI: 10.1371/journal.pmed.0020141] [DOI] [PMC free article] [PubMed] [Google Scholar]
Schünemann 2008
- Schünemann HJ, Oxman AD, Vist GE, Higgins JPT, Deeks JJ, Glasziou P, et al. Chapter 12: Interpreting results and drawing conclusions. In: Higgins JPT, Green S (editors) Cochrane Handbook for Systematic Reviews of Interventions. The Cochrane Collaboration, 2008. Available from www.cochrane‐handbook.org.
Seeman 2002
- Seeman P. Atypical antipsychotics: mechanism of action. Canadian Journal of Psychiatry 2002;47(1):27‐38. [PubMed] [Google Scholar]
Simpson 1970
- Simpson GM, Angus JWS. A rating scale for extrapyramidal side effects. Acta Psychiatrica Scandanavica 1970;212:S11‐19. [DOI] [PubMed] [Google Scholar]
Tardy 2014
- Tardy M, Huhn M, Engel Rolf R, Leucht S. Fluphenazine versus low‐potency first‐generation antipsychotic drugs for schizophrenia. Cochrane Database of Systematic Reviews 2014, Issue 8. [DOI: 10.1002/14651858.CD009230.pub2; CD009230] [DOI] [PMC free article] [PubMed] [Google Scholar]
Ukoumunne 1999
- Ukoumunne OC, Gulliford MC, Chinn S, Sterne JAC, Burney PGJ. Methods for evaluating area‐wide and organisation‐based intervention in health and health care: a systematic review. Health Technology Assessment 1999;3(5):1‐75. [PubMed] [Google Scholar]
van Os 2008
- Os J, Rutten BPF, Poulton R. Gene‐environment interactions in schizophrenia: review of epidemiological findings and future directions. Schizophrenia Bulletin 2008;34(6):1066‐82. [DOI] [PMC free article] [PubMed] [Google Scholar]
WHO 2005
- Essential Medicines: WHO model list. http://whqlibdoc.who.int/hq/2005/a87017_eng.pdf March 2005; Vol. 14th edition.
Williams 1987
- Williams, A (editor). Health economics: the cheerful face of dismal science?. Health and Economics. London (UK): Macmillan, 1987. [Google Scholar]
Xia 2009
- Xia J, Adams CE, Bhagat N, Bhagat V, Bhoopathi P, El‐Sayeh H, et al. Loss to outcomes stakeholder survey: the LOSS study. Psychiatric Bulletin 2009;33(7):254‐7. [Google Scholar]