Abstract
Many countries are shifting their efforts from malaria control to disease elimination. New technologies will be necessary to meet the more stringent demands of elimination campaigns, including improved quality control of malaria diagnostic tests, as well as an improved means for communicating test results among field healthcare workers, test manufacturers, and national ministries of health. In this report, we describe and evaluate an embedded barcode within standard rapid diagnostic tests as one potential solution. This information-augmented diagnostic test operates on the familiar principles of traditional lateral flow assays and simply replaces the control line with a control grid patterned in the shape of a QR (quick response) code. After the test is processed, the QR code appears on both positive or negative tests. In this report we demonstrate how this multipurpose code can be used not only to fulfill the control line role of test validation, but also to embed test manufacturing details, serve as a trigger for image capture, enable registration for image analysis, and correct for lighting effects. An accompanying mobile phone application automatically captures an image of the test when the QR code is recognized, decodes the QR code, performs image processing to determine the concentration of the malarial biomarker histidine-rich protein 2 at the test line, and transmits the test results and QR code payload to a secure web portal. This approach blends automated, sub-nanomolar biomarker detection, with near real-time reporting to provide quality assurance data that will help to achieve malaria elimination.
Keywords: Rapid diagnostic tests, point-of-care, quality control, QR codes, mHealth
Graphical Abstract
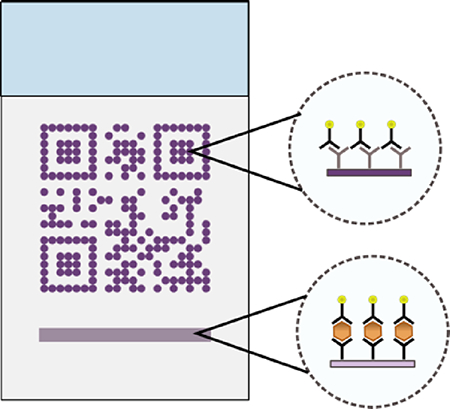
Barcode embedded rapid diagnostic tests are presented as a tool for improved communication in malaria elimination campaigns.
1. Introduction
As evidenced by a 21% decrease in case incidence between 2010 and 2015, recent malaria control efforts have been remarkably successful in lowering the burden that disease-endemic countries face1. Still, malaria led to 429,000 deaths in 2015 and 3.3 billion people remain at risk of infection. Plasmodium falciparum, the most prevalent form of the parasite, resulted in the deaths of 303,000 children under five years of age in 20151. Currently treatment decisions are often symptom-based – which is confounded due to the overlap in clinical presentation between malaria and other tropical diseases2–7. The diagnosis and treatment on the basis of symptoms alone results in a delay in diagnosis of non-malarial causes of fevers, wasted resources, and potentially accelerated development of parasite resistance to treatment8. Until there is a reliable vaccine against malaria, there is a need for improved diagnostic technologies to support elimination campaigns9.
The standard for clinical malaria diagnosis remains microscopic inspection of a blood smear10,11. When performed by a trained technician, it can provide an accurate diagnosis within an hour. However, successful implementation remains difficult in environments that lack the needed infrastructure12. Similarly, fluorescence staining and nucleic acid amplification through polymerase chain reaction are difficult to deploy in the regions most burdened by malaria13. Rapid diagnostic tests (RDTs) have been adapted as an attractive solution to the challenges presented in low resource settings7,14–16. RDTs provide an inexpensive, 20-minute diagnosis, and are amenable for use by minimally trained healthcare workers. In this approach, a blood sample is placed on the RDT sample pad, a running buffer is added to a buffer pad, and the blood flows through a porous membrane by capillary action. The accumulation of conjugate (typically gold nanoparticles conjugated to antibodies specific for a malarial biomarker) results from a sandwich type assay at the “test” line, and confirms a positive diagnosis. Further downstream at the “control” line, a secondary antibody against the antibody on the conjugate captures any unbound conjugate. The presence of a control line signal indicates that the sample has successfully flowed through the test region and that sample conditions are satisfactory for antigen-antibody binding. If the control line is visible, the RDT result is considered valid.
Despite the mature biochemistry of RDTs, several issues still hinder their usage. Field evaluations indicate that correct analysis of RDTs is highly dependent on end-user training and supervision17–20. Coupled with language barriers that lead to a poor understanding of operational instructions and errors in the interpretation of the results, RDTs often still result in an uncertain diagnosis21. Additionally, there are currently no standards to evaluate field performance of RDTs, and lot-to-lot variation can result in misdiagnoses with the potential for harmful consequences2. To combat these problems, the World Health Organization performs standardized testing of RDT performance which includes product testing, lot-testing, and testing at the end-user level22. Others have recommended that RDT brand, lot number, and test conditions be recorded with each test and reported as feedback to the manufacturer11. This would enable lot-to-lot comparisons, as well as validate satisfactory test storage conditions. Unfortunately, current reporting that describes the clinical usage of malaria RDTs, as well as research publications, do not standardize this level of detail as a requirement and this potentially valuable information is lost.
We and others have recently introduced new technologies to overcome one of the challenges in RDT analysis, specifically subjective visual inspection of RDTs23–25. We have previously developed image processing algorithms that analyze an image of an RDT captured with a mobile phone to automatically interpret the test without any additional adapters or hardware19. The “connected” nature of mobile phones also fulfills a major communication need for malaria elimination campaigns which is based on paper registries for disease surveillance26. Given the growth of mobile phone usage, even in low- and middle-income countries, strategies that utilize a mobile phone have the potential to provide widespread deployment, even in remote point-of-care settings.
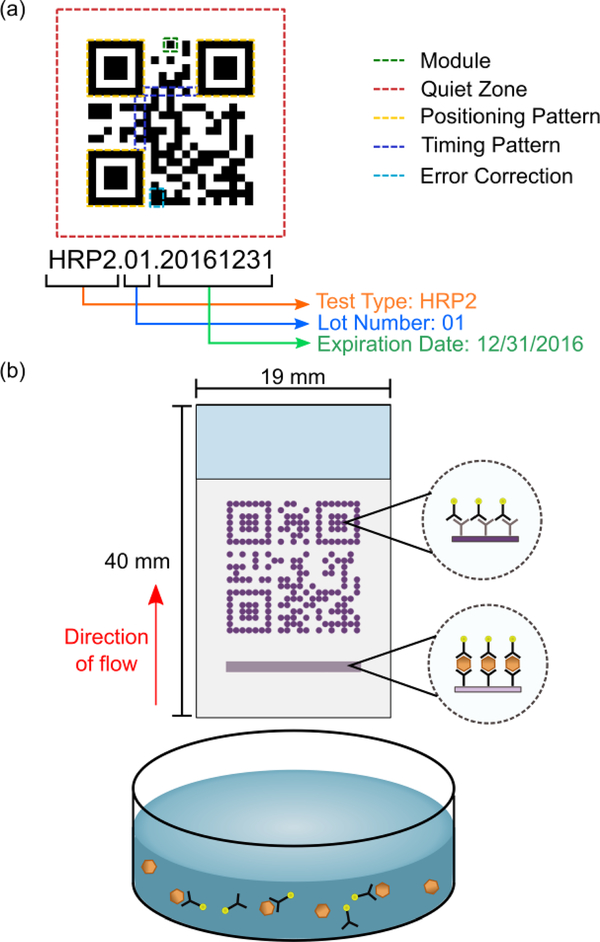
In this report, we describe the development of a strategy for including and retrieving additional test information, which we call barcode embedded Rapid Diagnostic Tests (beRDTs). These diagnostic tests operate on the same principles as traditional lateral flow assays, except that the control line is replaced by a standard QR code to embed additional information. QR codes are built from individual “modules” and encode an information payload, as well as form patterns that assist in decoding the payload (Fig. 1a)27. QR codes offer unique advantages including a high information density per area and error correction of up to 30% of missing or defective modules. Due in part to their multi-platform readability and the diversity of the information that can be encoded (e.g., text, contact information, web URLs), static QR codes have previously been used to encode data in point-of-care diagnostic devices, but to date have not had connection to the interpretation of the results28,29. In this work, we replace the traditional control line on an RDT with a control-QR code (Fig. 1b).
Fig. 1.
(a) The key components of a QR code. (b) beRDTs, in a half-strip or dipstick form factor, use the same principles and biochemistry of traditional lateral flow assays, but with the control antibodies deposited in the shape of a QR code.
The use of QR codes provides some specific features that will assist malaria elimination campaigns. The QR code facilitates accurate quantitative image processing in two specific ways. First, the QR code allows for straightforward image registration, orientation, and scaling. The presence of a machine readable QR code simplifies the algorithmic image processing required to determine the location of the test line. QR codes adhere to a strict standard27 that, among other things, includes specific patterns for recognition and requirements for contrast between dark and light modules. Importantly, the QR codes are present in the event of either positive or negative tests, as long as the gold conjugate and buffer have traveled the entire length of the test. This offers an unambiguous invalid test criterion. By using the successful recognition of a QR code as a trigger for a camera, we are assured that at the least, the minimal standard for machine recognition of QR codes has been met, which ensures that the image used for quantitative analysis of the test line will be adequate. Upon code recognition, an image of the QR-control line and the test line are captured in a single image, and the embedded QR payload is parsed. Embedded within the QR code is manufacturing information; we have chosen to embed the test type, lot number, and expiration date (Fig. 1a). Finally, the test results and embedded information payload can be uploaded to any electronic health record system. In this work, we have connected our mobile application with REDCap30, a secure research database manager for analysis and server-side storage.
2. Experimental
Experiments were designed: 1) to evaluate the QR code spatial resolution after fabrication, 2) to determine the sensitivity of QR code pixel intensity to fabrication parameters, and 3) to calculate the limit of detection of beRDTs at the test line using the automated mobile application. The beRDTs that were used in these experiments can be classified into two categories: static and dynamic. Static beRDTs refer to the membranes in which a visible solution has been deposited in the locations of the QR code modules in order to evaluate fabrication resolution. Dynamic beRDTs refer to tests that have an antibody solution that is invisible after deposition and drying, but becomes visible only when gold nanoparticle conjugate binds within the QR code. While static beRDTs are useful for the evaluation of reagent deposition and image analysis software development, only the dynamic beRDTs are reactive to a biological sample.
2.1. beRDT Spatial Reagent Deposition
A third-party barcode generation library (Zebraxing) in MATLAB (Mathworks, Natick, MA) was used to translate the payload text into a QR code. Custom MATLAB software generated a list of spatial X-Y coordinates of the “dark” modules of the QR code that correspond to locations where antibody was deposited. The AD1520 Aspirate/Dispense Platform (BioDot, Irvine, CA) was used to deposit antibody solution onto a nitrocellulose membrane at the specific locations provided by the custom MATLAB program. In addition to the QR code, a series of contiguous droplets was deposited 2 mm upstream of the leading edge of the QR code to form the test line. As in traditional lateral flow assays, the deposited antibodies adsorb to the nitrocellulose surface at the location of their deposition and do not flow down the membrane when a sample is added. Since the different capture antibodies are spatially separated, there is no cross-reaction between the QR code antibody and the test line antibody. The deposited solution varied depending on the objective of the experiment: for visualization of static beRDTs, 2 mM Eosin-Y (#E4009, Sigma Aldrich, St. Louis, MO) was used; for dynamic beRDTs, a solution of 1 mg/mL goat anti-mouse antibody (#31160, Life Technologies, Grand Island, NY) in PBST (1× phosphate buffered saline, 0.1% Tween-20) were used to print the control QR codes and the test line was made from a solution of 1 mg/mL mouse anti-HRP2 antibody (#ABMAL-0404, Arista Biological, Allentown, PA). The overall QR code dimensions are 12.5 mm wide by 12.5 mm long; and the test line is 12.5 mm wide by 0.5 mm thick.
2.2. Conjugate Preparation
Gold nanoparticles (AuNPs) 40nm in diameter were purchased from DCN Diagnostics (Carlsbad, CA) at a concentration that has an absorbance, or optical density (OD), of 2.12 and used to create the gold-antibody conjugate used for detection. In this work, OD measurements of gold conjugate were made at 535 nm using an Agilent 8453 G1103A spectrophotometer (Agilent Technologies, Santa Clara, CA). The stock AuNPs were diluted down to an OD of 1 using deionized water. The pH of the resulting solution was then increased to 7.46 using a 0.20 M potassium carbonate solution. Mouse anti-HRP2 antibody (#ABMAL-0404, Arista Biological) was added to this gold nanoparticle solution at a protein concentration of 0.01 mg/mL, and then incubated for 15 minutes on a shaker. Blocking buffer (50 mM borate buffer with 10% (w/v) bovine serum albumin (BSA)) was added at a volume of 10% of the solution volume and the solution was mixed on a shaker for 45 minutes. After incubation the solution was centrifuged for 30 minutes at 5000 rcf, the supernatant removed, and the remaining conjugate pellet was diluted to an OD of 10 with storage buffer (50 mM borate buffer with 1% (w/v) BSA).
2.3. RDT Assembly
Whatman FF120HP nitrocellulose membranes with a 10 mil polystyrene backing (GE Healthcare, Piscataway, NJ) were used to construct the rapid diagnostic tests. The control QR code and test line were deposited onto the nitrocellulose membrane, as described above, and the membrane was dried at 40 ºC. Next, the membrane was blocked with 100 mL Pierce Protein-Free T20 blocking buffer (ThermoFisher, Waltham, MA) and dried at 40 ºC. A Whatman CF7 wicking pad was attached to the backing card with the wicking pad overlapping the nitrocellulose membrane. A CM4000 membrane cutter (BioDot, Irvine, CA) was used to cut the assembled RDT into test strips that were slightly larger than the width of the QR code. RDTs were stored in foil pouches with desiccant until use. Prior to use, the backing card was cut to remove the sections for a sample pad and a conjugate pad, leaving a “half-strip”. Half-strip tests function as dipstick-like lateral flow assays and are common during the development of full RDTs. A paperclip was used to ensure contact between the wicking pad and the nitrocellulose membrane – a role played by the plastic housing in commercial RDTs. The dimensions of the beRDT are as follows: the nitrocellulose membrane of the beRDT is 19 mm wide by 24 mm long; the wicking pad is 19 mm wide by 19 mm long; the entire beRDT (membrane and wicking pad) is 19 mm wide by 40 mm long; there is 3 mm of overlap between the nitrocellulose membrane and the wicking pad. Some commercial rapid diagnostic tests include a cover over the membrane to protect from environmental contaminants, but many do not and recent efforts have shown that paper-based diagnostic devices are tolerant of surface contaminants31,32. For simplicity of fabrication, we chose not to include a cover on the beRDTs in this work.
2.4. beRDT Experiments
The assembled beRDTs were placed in a 3D printed (Project 3510 HD Plus, 3D Systems, Rock Hill, SC) holder with a 210 μL liquid reservoir. To evaluate the effect of deposited antibody concentration and conjugate volume on colorimetric intensity of the resulting QR code varying amounts of conjugate were mixed with PBSTT running buffer (1× PBS, 0.1% Tween-20, 2% Triton-x-100), to a total solution volume of 200 μL. To determine the beRDT limit of detection, 110 μL of the PBSTT running buffer was pre-mixed with 40 μL of conjugate and 50 μL of 0–50 nM recombinant HRP2 (obtained from PATH, Seattle, WA) and added to the reservoir. In all cases, the assays were run until the running buffer had completely wicked from the liquid reservoir. Quantitative imaging was performed ~45 minutes after the sample was added to the assay. A Nikon D800 camera was used to image the parametric evaluation of QR code colorimetric intensity (Sections 3.1, 3.2, and 3.3), and ImageJ (NIH, Bethesda, MD) was used for quantitative image analysis. To determine the limit of detection (Section 3.4), a custom mobile phone application was developed to perform automated image analysis and quantify the intensity of the test line. The limit of detection was calculated as described by Wang (IUPAC method)33.
2.5. beRDT Analysis Software
A custom mobile application, Q-beRDT (Quantitative-barcode embedded Rapid Diagnostic Test), was written in the Swift programming language and deployed on an iPhone 6s (Apple, Cupertino, CA). Q-beRDT utilized the Scandit Software Development Kit (SDK) to scan QR codes. In preliminary studies, several third-party barcode libraries as well as Apple’s native framework were evaluated, and the Scandit SDK was found to be the most effective at recognizing low contrast QR codes. The mobile application initiates a scanning view and each consecutive frame from the camera is processed by the SDK in search of a machine-readable QR code. When a QR code is recognized, the Q-beRDT application used the dimensions of the QR code for reference and cropped the frame that detected the QR code to include the QR code and the upstream test line. The data payload embedded within the QR code was decoded and displayed to the end-user along with the cropped image of the beRDT. A 1 mm wide linescan was made from the top of the image to the bottom and the average pixel intensity across each horizontal cross-section was calculated. Using the pixel intensity of the QR code () as a constant dark value, and the pixel intensity of the nitrocellulose membrane () as a constant light value, the pixel intensities () in the line scan were normalized () to account for variations in lighting (eq. 1).
| (1) |
The center linescan (1 pixel wide) was displayed to the user. Using the dimensions of the QR code for a size-scale, an algorithm was developed to find test line signal and integrate the area under the peak curve to calculate a test line signal. Finally, Q-beRDT used the REDCap, a web-based research database management platform, Application Programming Interface (API) to upload the following as a new REDCap record: sample ID, test type, lot number, expiration date, test line signal, and the cropped image of the beRDT. Importantly, except for entering a test identifier, the software is entirely automated (see Supporting Material). The simple interface guides the end-user through the software with the ability to go on to the next stage of beRDT analysis, or to re-do the previous step if desired. Q-beRDT only requires manual intervention to point the camera at the beRDT until it is recognized, and to enter a sample identification before uploading the results to REDCap.
3. Results and Discussion
Detection of a machine-readable QR code relies on satisfying a set of standards. In Figures 2–4, we have added annotations to emphasize particular features of the QR code that were used for experimental analysis. These annotations, while helpful in explanations of the results, will interfere with the requirements for necessary QR code recognition and lessen the likelihood of QR code scanning. In Figure 6, there are no annotations and the QR codes of these beRDTs are machine-readable. We have tested them with the freely available Scandit iOS mobile application (the same library that we utilize in our mobile phone application). Videos of successful scanning events of the QR codes in Figures 3–6 are shown as Supplemental Material, as well as time-lapse videos of beRDT processing and a screen recording of the Q-beRDT software.
Fig. 2.
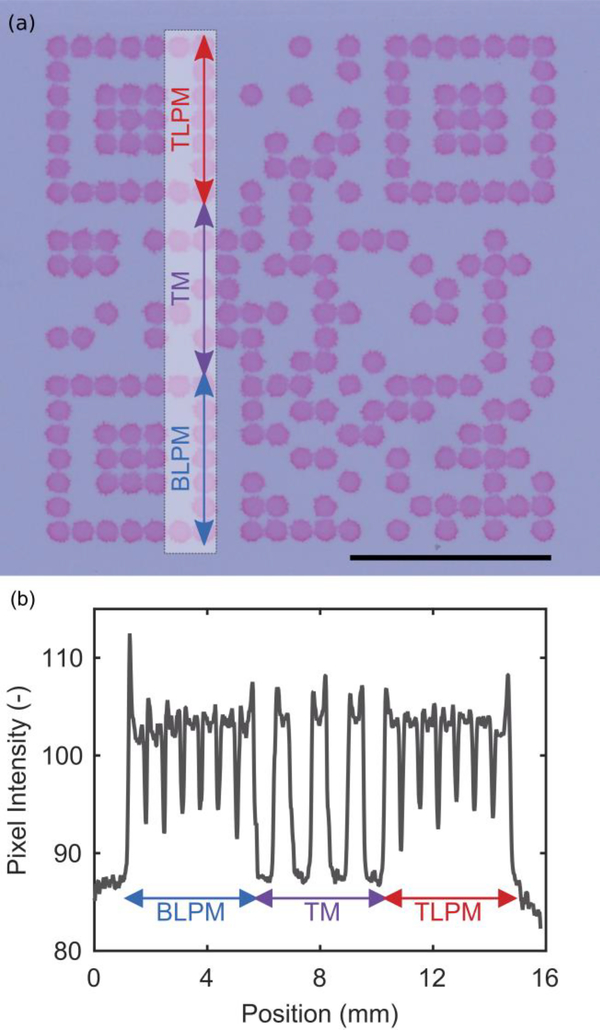
(a) Static beRDT made from a 2 mM Eosin-Y solution. The outer dimensions of the QR code are 12.5 mm by 12.5 mm. Scale bar is 5 mm. (b) The pixel intensity line scan across a series of consecutive modules. (BLPM = bottom left positioning modules, TM = timing modules, TLPM = top left positioning modules)
Fig. 4.
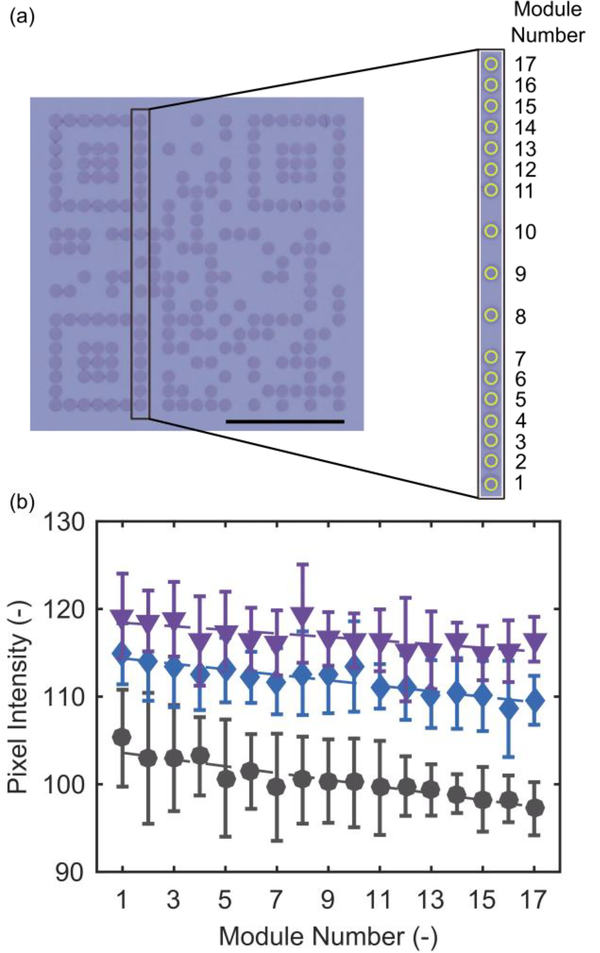
The gradient of average pixel intensity of (a) consecutive modules (yellow circles) in the bottom left positioning pattern, timing pattern, and top left positioning pattern, for (b) different volumes of conjugate added (50 μL purple inverted triangle; 30 μL, blue diamond; 10 μL, black square). (a) Scale bar is 5 mm.
Fig. 6.
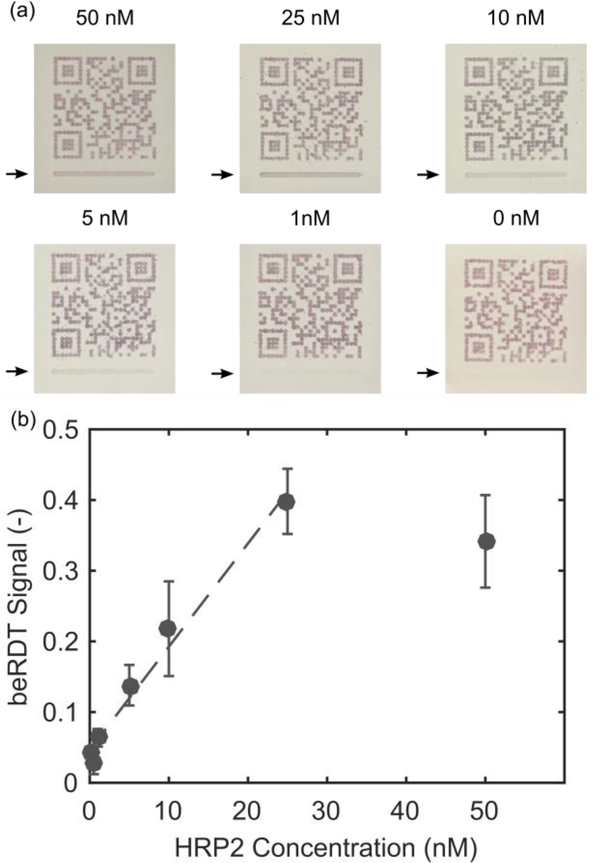
(a) Representative mobile phone images of beRDTs (arrows indicate test line location). (b) Integrated signal from the q-beRDT mobile phone application with varying concentrations of rcHRPII (mean +/− standard deviation, n=3 for each concentration). The dashed line is the linear fit of the data, excluding the 50 nM data points that are outside of the linear range of the test.
Fig. 3.
The pixel intensity within the (a) the inner portion of the bottom left positioning module pattern (yellow box), with goat anti-mouse IgG capture antibodies and mouse anti-HRP2 gold conjugate for detection with varying amounts of (b) volume of conjugate added to the sample, and (c) capture antibody concentration. (b) Antibody ink concentration: black circle = 0.125 mg/mL; blue square = 0.25 mg/mL; purple diamond = 0.5 mg/mL; red triangle = 0.75 mg/mL. (c) Conjugate volume added to sample: black circle = 10 μL; blue square = 20 μL; purple diamond = 30 μL; red triangle = 40 μL; orange inverted triangle = 50 μL. (a) Scale bar is 5 mm.
3.1. Static beRDTs
Successful QR code capture requires that sufficient contrast between dark and light modules is maintained. In addition, overall size must be minimized to keep costs low and facilitate use at the point-of-care. A colorimetric dye, Eosin-Y, was directly deposited onto a nitrocellulose membrane to evaluate how the manufacturing parameters affected these desired outcomes. Fig. 2a shows the result of the optimized manufacturing parameters to produce a 12.5 mm by 12.5 mm QR code. Each dark module consists of a single 40 nL droplet of Eosin-Y, and creates a solid 0.55 mm diameter circle on the nitrocellulose membrane. The dark modules have distinct edges from one another, and are clearly visible on the white nitrocellulose membrane. Some surface “roughness”, where the perimeter of an individual module is slightly jagged, is visible as well. For some of the dark modules, there is a noticeable “coffee-ring” effect where the edges of the droplet are slightly darker in intensity than the center portion of the droplet. This is confirmed with a line scan of pixel intensity that follows along the bottom left positioning modules, the timing pattern, and the top left positioning modules (Fig. 2b). In the pixel intensity line scan, there are spikes in pixel intensity at the edges of the modules. Importantly, the surface roughness and coffee-ring effect do not impact the machine-readable nature of the QR code as evidenced by the rapid detection of the QR code (see supporting material).
3.2. Dynamic beRDT Colorimetric Intensity
Using a QR code in place of a control line requires that the QR code appears and can be recognized by a phone, regardless of the test outcome. There are several variables that affect the intensity of a signal on a rapid diagnostic test. We focused on one fabrication variable, the concentration of the deposited capture antibody, and one operational variable, the volume of detection antibody-gold nanoparticle conjugate added to the test.
Increasing either the volume of conjugate added to the test or the capture antibody concentration of the QR code resulted in darker intensity modules (Fig. 3b–c). At the lowest volume of conjugate, increasing the concentration of the antibody deposited eventually results in saturation at a relatively low pixel intensity. At such low volumes of conjugate added, most of the conjugate binds and the excess antibody remains unbound. In contrast, intensity saturation is seen when the conjugate is in large excess. Generally, as antibody concentration or volume of conjugate increase, the resulting average pixel intensity increase seen in the bottom left positioning modules is linear until saturation. There are other unexplored parameters that might affect QR code performance including membrane porosity, antibody selection, blocking conditions, and running buffer selection that will be evaluated in future efforts.
3.3. Dynamic beRDT Colorimetric Gradient
While average pixel intensity of a group of modules near the leading edge of the QR is one metric to evaluate the colorimetric intensity, it does not take into account the potential for binding of conjugate in the upstream modules to affect the downstream modules. To evaluate this, we analyzed the average pixel intensity of a series of consecutively downstream modules along the bottom left positioning pattern, timing pattern, and top left positioning pattern (Fig. 4a). In Fig. 4b, the resulting change in intensity in downstream modules is shown for a constant capture antibody concentration at 0.5 mg/mL, for different volumes of conjugate. With 10 μL of conjugate, there is less conjugate available for binding at each subsequent module as the sample moves downstream; this results in a lower module intensity for the downstream modules. At this volume, there is insufficient contrast between the dark and light modules for successful QR code recognition. This depletion effect is less pronounced with 30 μL of conjugate, and is negligible at 50 μL of conjugate. At high enough volumes, there is sufficient conjugate available for binding at the downstream sites to maintain a constant pixel intensity. With at least 30 μL of conjugate, the resulting beRDTs have QR codes that are uniform in pixel intensity and are dark enough that they are readily identified by our mobile phone application.
3.4. Dynamic beRDT HRP2 Limit of Detection
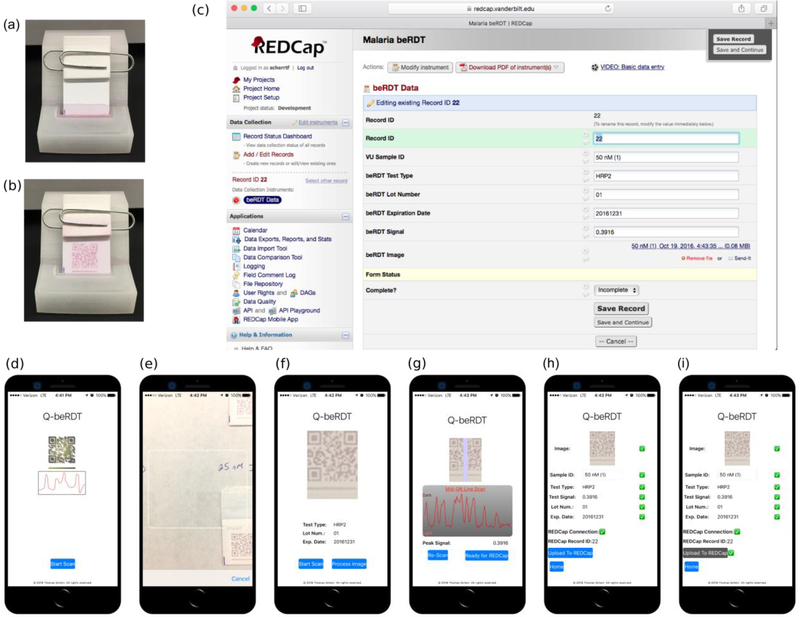
Using the previously identified conditions that resulted in uniform and machine readable QR codes, we determined the limit of detection of the assays and the custom mobile-phone application. Concentrations of HRP2 between 0–50 nM were added to a 3D-printed beRDT holder and sample reservoir (Fig. 5a,b), analyzed by the Q-beRDT software (Fig. 5d–i), and the data was linked to REDCap for storage (Fig. 5c). The beRDT signal, the integrated area of the pixel intensity curve across the test line, was normalized to account for variations in lighting.
Fig. 5.
The 3D printed devices that serve as sample reservoir and test holder, (a) immediately after adding the beRDT and (b) 15 minutes after adding the test to 50 μL of 25 nM ITG, 40 μL of conjugate, and 110 μL of PBSTT. (c) A web browser view of the REDCap record uploaded from Q-beRDT. (d)-(i) Screenshots of Q-beRDT, the mobile application developed to quantitatively analyze beRDTs and send results to REDCap.
The signal linearly increased with increasing HRP2 concentration up to 25 nM after which the signal appeared to saturate (Fig. 6). The signal saturation, as well as the magnitude of the variation from test to test, are commonly seen in lateral flow assays19,34. We determined the statistical limit of detection to be 0.966 nM. HRP2 production rates can vary among strains and developmental stage of the parasite35, but previous work has reported correlations between HRPII concentration and cultured Plasmodium falciparum parasite concentration36. Using this conversion, our limit of detection can be approximated to be 543 parasites/μL.
In this study, we evaluated two parameters (capture antibody concentration and volume of conjugate) with the purpose of making reproducible and easily-detectable QR codes. Even with our focus on generating machine-readable beRDTs, our prototype has a limit of detection within the clinical spectrum of malaria infections37. Under these test conditions, which were optimized to generate reproducible machine-readable QR codes, this limit of detection falls between the high parasitemia values (2000 par/μL and 5000 par/μL) and the low parasitemia value (200 par/μL) that the WHO uses in benchmark testing for commercial RDTs38. Further optimization to improve the limit of detection at the test line would include the evaluation of different antibodies and materials, conjugate fabrication conditions, as well as blocking and running buffers.
4. Conclusion
In this report, we have described the development of barcode embedded rapid diagnostic tests. By converting the control line on a malaria rapid diagnostic test into a mobile phone-readable QR code embedded with manufacturing details, we merge quality assurance, record keeping and reporting, and automated test line analysis into a single reporting channel. The control antibodies in the QR code assist with image processing, and also provide standardized test rejection criterion. Future work will seek to improve test sensitivity as well as investigate the broad potential uses of beRDTs, including direct web-portal access and anti-counterfeit features. This platform could readily be integrated into a variety of mobile health initiatives for malaria, and surveillance efforts for other infectious diseases.
Supplementary Material
5 Acknowledgements
TFS would like to acknowledge support from the Laboratories for Innovation in Global Health Technologies at Vanderbilt University. The authors would like to graciously thank PATH for providing recombinant HRP2.
6 References
- 1.Organization, W. H. World Malaria Report. (2016).
- 2.Bell D, Wongsrichanalai C & Barnwell JW Ensuring quality and access for malaria diagnosis: how can it be achieved? Nature Reviews Microbiology, S7–S20, doi: 10.1038/nrmico1525 (2006). [DOI] [PubMed] [Google Scholar]
- 3.Schellenberg JRMA, Smith T, Alonso PL & Hayes RJ What Is Clinical Malaria - Finding Case Definitions for Field-Research in Highly Endemic Areas. Parasitology Today 10, 439–442, doi:Doi 10.1016/0169-4758(94)90179-1 (1994). [DOI] [PubMed] [Google Scholar]
- 4.Kallander K, Nsungwa-Sabiiti J & Peterson S Symptom overlap for malaria and pneumonia - policy implications for home management strategies. Acta Trop 90, 211–214, doi: 10.1016/j.actatropica.2003.11.013 (2004). [DOI] [PubMed] [Google Scholar]
- 5.Smith T, Hurt N, Teuscher T & Tanner M Is Fever a Good Sign for Clinical Malaria in Surveys of Endemic Communities. Am J Trop Med Hyg 52, 306–310 (1995). [DOI] [PubMed] [Google Scholar]
- 6.Reyburn H et al. Overdiagnosis of malaria in patients with severe febrile illness in Tanzania: a prospective study. Brit Med J 329, 1212–1215, doi: 10.1136/bmj.38251.658229.55 (2004). [DOI] [PMC free article] [PubMed] [Google Scholar]
- 7.Wongsrichanalai C, Barcus MJ, Muth S, Sutamihardja A & Wernsdorfer WH A review of malaria diagnostic tools: Microscopy and rapid diagnostic test (RDT). Am J Trop Med Hyg 77, 119–127 (2007). [PubMed] [Google Scholar]
- 8.Chandramohan D et al. A clinical algorithm for the diagnosis of malaria: results of an evaluation in an area of low endemicity. Tropical Medicine & International Health 6, 505–510, doi:DOI 10.1046/j.1365-3156.2001.00739.x (2001). [DOI] [PubMed] [Google Scholar]
- 9.Alonso PL et al. A Research Agenda for Malaria Eradication: Diagnoses and Diagnostics. Plos Medicine 8, doi:ARTN e1000396 10.1371/journal.pmed.1000396 (2011). [DOI] [PMC free article] [PubMed] [Google Scholar]
- 10.Bell D & Perkins MD Making malaria testing relevant: beyond test purchase. T Roy Soc Trop Med H 102, 1064–1066, doi: 10.1016/j.trstmh.2008.05.007 (2008). [DOI] [PubMed] [Google Scholar]
- 11.Murray CK, Gasser RA, Magill AJ & Miller RS Update on rapid diagnostic testing for malaria. Clin Microbiol Rev 21, 97–+, doi: 10.1128/Cmr.00035-07 (2008). [DOI] [PMC free article] [PubMed] [Google Scholar]
- 12.Coleman RE et al. Comparison of field and expert laboratory microscopy for active surveillance for asymptomatic Plasmodium falciparum and Plasmodium vivax in Western Thailand. Am J Trop Med Hyg 67, 141–144 (2002). [DOI] [PubMed] [Google Scholar]
- 13.Snounou G et al. High-Sensitivity of Detection of Human Malaria Parasites by the Use of Nested Polymerase Chain-Reaction. Mol Biochem Parasit 61, 315–320, doi:Doi 10.1016/0166-6851(93)90077-B (1993). [DOI] [PubMed] [Google Scholar]
- 14.Moody A Rapid diagnostic tests for malaria parasites. Clin Microbiol Rev 15, 66–+, doi:Doi 10.1128/Cmr.15.1.66-78.2002 (2002). [DOI] [PMC free article] [PubMed] [Google Scholar]
- 15.Murray CK, Bell D, Gasser RA & Wongsrichanalai C Rapid diagnostic testing for malaria. Tropical Medicine & International Health 8, 876–883, doi:DOI 10.1046/j.1365-3156.2003.01115.x (2003). [DOI] [PubMed] [Google Scholar]
- 16.Organization, W. H. Malaria Rapid Diagnostic Test Performance. 124 (2011). [Google Scholar]
- 17.Rennie W et al. Minimising human error in malaria rapid diagnosis: clarity of written instructions and health worker performance. T Roy Soc Trop Med H 101, 9–18, doi: 10.1016/j.trstmh.2006.03.011 (2007). [DOI] [PubMed] [Google Scholar]
- 18.Trachsler M, Schlagenhauf P & Steffen R Feasibility of a rapid dipstick antigen-capture assay for self-testing of travellers’ malaria. Tropical Medicine & International Health 4, 442–447, doi:DOI 10.1046/j.1365-3156.1999.00419.x (1999). [DOI] [PubMed] [Google Scholar]
- 19.Scherr TF, Gupta S, Wright DW & Haselton FR Mobile phone imaging and cloud-based analysis for standardized malaria detection and reporting. Sci Rep 6, 28645, doi: 10.1038/srep28645 (2016). [DOI] [PMC free article] [PubMed] [Google Scholar]
- 20.Mukadi P et al. SMS photograph-based external quality assessment of reading and interpretation of malaria rapid diagnostic tests in the Democratic Republic of the Congo. Malar J 14, 26, doi: 10.1186/s12936-014-0535-9 (2015). [DOI] [PMC free article] [PubMed] [Google Scholar]
- 21.Seidahmed OME et al. End-user errors in applying two malaria rapid diagnostic tests in a remote area of Sudan. Tropical Medicine & International Health 13, 406–409, doi: 10.1111/j.1365-3156.2008.02015.x (2008). [DOI] [PubMed] [Google Scholar]
- 22.Organization, W. H. Initiative for Quality Assurance of Malaria Rapid Diagnostic Tests. (2008).
- 23.Feng S et al. Immunochromatographic Diagnostic Test Analysis Using Google Glass. Acs Nano 8, 3069–3079, doi: 10.1021/nn500614k (2014). [DOI] [PMC free article] [PubMed] [Google Scholar]
- 24.Mudanyali O et al. Integrated rapid-diagnostic-test reader platform on a cellphone. Lab on a Chip 12, 2678–2686, doi: 10.1039/c2lc40235a (2012). [DOI] [PMC free article] [PubMed] [Google Scholar]
- 25.You DJ, Park TS & Yoon JY Cell-phone-based measurement of TSH using Mie scatter optimized lateral flow assays. Biosensors & Bioelectronics 40, 180–185, doi: 10.1016/j.bios.2012.07.014 (2013). [DOI] [PubMed] [Google Scholar]
- 26.Yukich JO et al. A description of malaria sentinel surveillance: a case study in Oromia Regional State, Ethiopia. Malaria J 13, doi:Artn 88 10.1186/1475-2875-13-88 (2014). [DOI] [PMC free article] [PubMed] [Google Scholar]
- 27.ISO/IEC. (Geneva, 2000). [Google Scholar]
- 28.Myers NM, Kernisan EN & Lieberman M Lab on Paper: Iodometric Titration on a Printed Card. Anal Chem 87, 3764–3770, doi: 10.1021/ac504269q (2015). [DOI] [PubMed] [Google Scholar]
- 29.Santhiago M, Henry CS & Kubota LT Low cost, simple three dimensional electrochemical paper-based analytical device for determination of p-nitrophenol. Electrochim Acta 130, 771–777, doi: 10.1016/j.electacta.2014.03.109 (2014). [DOI] [Google Scholar]
- 30.Harris PA et al. Research electronic data capture (REDCap)-A metadata-driven methodology and workflow process for providing translational research informatics support. J Biomed Inform 42, 377–381, doi: 10.1016/j.jbi.2008.08.010 (2009). [DOI] [PMC free article] [PubMed] [Google Scholar]
- 31.Martinez AW et al. Simple telemedicine for developing regions: camera phones and paper-based microfluidic devices for real-time, off-site diagnosis. Anal Chem 80, 3699–3707, doi: 10.1021/ac800112r (2008). [DOI] [PMC free article] [PubMed] [Google Scholar]
- 32.Martinez AW, Phillips ST, Butte MJ & Whitesides GM Patterned paper as a platform for inexpensive, low-volume, portable bioassays. Angew Chem Int Edit 46, 1318–1320, doi: 10.1002/anie.200603817 (2007). [DOI] [PMC free article] [PubMed] [Google Scholar]
- 33.Wang Y et al. Thermal Contrast Amplification Reader Yielding 8‐Fold Analytical Improvement for Disease Detection with Lateral Flow Assays. Anal Chem, doi: 10.1021/acs.analchem.6b03406 (2016). [DOI] [PubMed] [Google Scholar]
- 34.Davis KM, Gibson LE, Haselton FR & Wright DW Simple sample processing enhances malaria rapid diagnostic test performance. Analyst 139, 3026–3031, doi: 10.1039/c4an00338a (2014). [DOI] [PMC free article] [PubMed] [Google Scholar]
- 35.Makler MT & Piper RC Rapid Malaria Tests: Where Do We Go After 20 Years? Am J Trop Med Hyg 81, 921–926, doi: 10.4269/ajtmh.2009.09-0202 (2009). [DOI] [PubMed] [Google Scholar]
- 36.Markwalter CF, Ricks KM, Bitting AL, Mudenda L & Wright DW Simultaneous capture and sequential detection of two malarial biomarkers on magnetic microparticles. Talanta 161, 443–449, doi: 10.1016/j.talanta.2016.08.078 (2016). [DOI] [PMC free article] [PubMed] [Google Scholar]
- 37.Trampuz A, Jereb M, Muzlovic I & Prabhu RM Clinical review: Severe malaria. Crit Care 7, 315–323, doi: 10.1186/cc2183 (2003). [DOI] [PMC free article] [PubMed] [Google Scholar]
- 38.Organization, W. H. Malaria rapid diagnostic test performance: results of WHO product testing of malaria RDTs: round 6 (2014–2015). (2015).
Associated Data
This section collects any data citations, data availability statements, or supplementary materials included in this article.


