

Abstract
Glioblastoma multiforme (GBM) is the most common primary CNS cancer and has a poor prognosis. This study searched for significant genes and the mechanisms involved in GBM.
We used the Gene Expression Omnibus (GEO) to test the WHO normal and IV glioma database, used R tool to identify the significant gene, and finally, combined these with The Cancer Genome Atlas (TCGA) to verify the significant genes. Subsequently, we explored the biological mechanisms involved.
Phytanoyl-CoA 2-hydroxylase-interacting protein-like gene (PHYHIPL) is downregulated in grade IV glioma (GBM). The downregulation of PHYHIPL in GBM is accompanied by poor overall survival in the TCGA database, which indicates that PHYHIPL is a protection gene in GBM development. Bioinformatics analysis shows that the poor prognosis with downregulated PHYHIPL may be the result of the TNF signaling pathway and the IL-17 signaling pathway, but good prognosis accompanied by upregulated PHYHIPL may be the result of retrograde endocannabinoid signaling and the cAMP signaling pathway. Protein-protein interactions (PPI) net indicated that PHYHIPL may play a vital role in cell metabolism, and we hypothesize that the downregulation mechanism may be the result of mutations of the β-catenin gene and the endogenous siRNA, as shown in previous studies.
PHYHIPL may be a target gene for the treatment and prognosis of GBM.
MeSH Keywords: Metabolism; RNA, Small Interfering; Tumor Markers, Biological
Background
Glioma is the most common type of primary intracranial tumor [1]. According to the WHO classification of tumors of the central nervous system, there are 4 grades [2], and these grades have a potential value for the determination of prognosis. Through molecular and technical developments, many important and clinically valuable genes have been identified, and epidermal growth factor receptor (EGFR) has been shown to be a regulatory gene for GBM [3]. Gene of phosphate and tension homology deleted on chromosome ten (PTEN) is a tumor-suppressor gene, which can also protect humans from tumor invasion [4]. The mutation of the TP53 gene is a typical mechanism in 18- to 45-year-old glioma patients [5]. Cell proliferation markers also play a vital role in the development of glioma, and a study has demonstrated that Ki67 labeling index and prognosis have statistical significance [6]. Although there are many certifications in the marker genes, they either have a positive or a negative function in glioma. The survive time of grade II glioma tumor is more than 5 years, but patients with high-grade glioma still have a poor clinical prognosis. The grade III glioma tumors survive 2–3 years, while the grade IV glioma tumors survive less than 1 year. Thus, it is necessary to find the marker genes in WHO high-grade glioma tumors. This study searched for the marker gene in grade IV glioma tumors (glioblastoma multiforme (GBM).
There are many methods used to find marker genes. High-throughput gene expression is a general method used to explore the marker genes. The GEO project was initiated in response to the growing demand for a public repository for high-throughput gene expression data. According to shared science data around the world, big data mining is an effective tool for exploring the mechanism of disease development, which is bioinformatics analysis. The Cancer Genome Atlas (TCGA) database comprises 33 types of cancers, and contributes to improving the prevention, diagnosis, and treatment of cancer. We used the GEO to find the marker genes, and then used the TCGA database to verify them. The work flow of the present study is shown in Figure 1.
Figure 1.

The workflow of the study.
In this study, we selected a GEO that provides normal brain and grade IV glioma tumors expression profiling by the array. We found that 47 cases were diagnosed as normal brain (n=13) and GBM (n=34) of any histologic type in initial surgical treatment and fresh frozen material was obtained from an array of dataset GSE50161. The immune marker gene has demonstrated that specific immunotherapeutic approaches may be most effective for each tumor type [7], but there is still a large amount of significant information that needs further analysis.
Material and Methods
The data were downloaded from the TCGA and GEO, according to the TCGA policy, a sample informed consent document that TCGA suggests tissue source sites use when collecting specimens from prospective project participants. This document ensures that patients considering donating tissue specimens to TCGA recognize the risks and benefits of participation and understand the nature of their inclusion in the project. All of the 47 GSE50161 patients were invited to participate in this Institutional Review Board-approved study (COMIRB 95-500 and 09-0906) [7].
First, we selected the array of dataset GSE50161 for analysis, and the array of dataset GSE50161 was downloaded by the GEOquery R package [8]. The dataset contains normal brain (n=13) and GBM (n=34) tissues.
Second, we found the different expression protein coding Genes (DEGs) of GBM in GSE4412, (1) Data pre-processing: The raw data were preprocessed by the GEOquery R package [8]. (2) The gene annotation was by hgu133plus2.db R package [9]. The protein-coding genes were downloaded from Ensembl (http://asia.ensembl.org/biomart/martview/5f7951aaf595394b15e741b577810e7f). (3) DEG analysis. The DEGs in samples were analyzed by the Limma package [10]. We plotted a heat map and the volcano map of DEGs. It is clear the PHYHIPL is a notable DEG. Its logFC=−1.917168, AveExpr=10.60324, t=−4.061331, p.value=1.870214e-04, adj.p.value=9.084314e-04, so we used the TCGA to verify the marker gene.
Third, the overall survival of the marker gene in TCGA-GBM. TCGA portal (http://tumorsurvival.org/about.html) is a web tool used to analyze the prognosis of the marker gene, which was provided by Shutan Xu, Shaying Zhao Lab, University of Georgia. We chose the TCGA-GBM to analyze. The threshold was: the marker gene for gene name, mean ±SD for dividing patient, and choosing all for subtype.
Fourth, we used the GDCRNATools [11] to download the TCGA-GBM RNA-seq data; there are 159 samples in it, including 154 primary tumor samples and 5 normal samples. (1) We plotted PHYHIPL gene expression in 2 different groups, (2) we divided the 154 primary tumor samples into high- and low-expression group according to the mean expression of PHYHIPL gene, and used Limma [10] to explore the DEGs of the 2 group, clusterProfiler R package [12] for further bio-information exploration, the gene ontology (GO), and the Kyoto Encyclopedia of Genes and Genomes (KEGG) pathway.
Finally, we used bioinformatics to explore the PPI net of the marker gene and used the published articles to explore the down-regeneration mechanism. (1) The exploration of the mechanism. We used String to analyze the PPI [13], which has 9’643’763 proteins from 2031 organisms and 1’380’838’440 interactions. It is a powerful web tool for PPI. (2) Although there are few related articles, we still found some significant value of the downregulation mechanism.
Results
DEG analysis
We found that there were 18 764 genes and 2625 different expression genes (DEGs), including 1203 upregulated and 1422 downregulated DEGs. The results are shown by the volcano map in Figure 2, and we showed the DEGs with a heat map in Figure 3. PHYHIPL gene has not been reported before and it was a notable DEG. Therefore, we selected the PHYHIPL gene to explore the expression and prognosis in TCGA-GBM.
Figure 2.

The volcano plot by R tool of GSE 50161. The black point is the unchanged genes; the green point is the downregulated genes; the red is upregulated genes. The threshold was adjusted P-value <0.001 and |log2 fold change (FC)|=1.5 was set.
Figure 3.

The heat map of GSE50161. The blue is the GBM; the red is normal brain tissues. The threshold was adjusted P-value <0.001 and |log2 fold change (FC)|=1.5 was set.
PHYHIPL gene overall survival in TCGA-GBM
The threshold was set as previously stated. Figure 4 shows that patients benefited from high expression of PHYHIPL, with the log-rank P=0.038.
Figure 4.
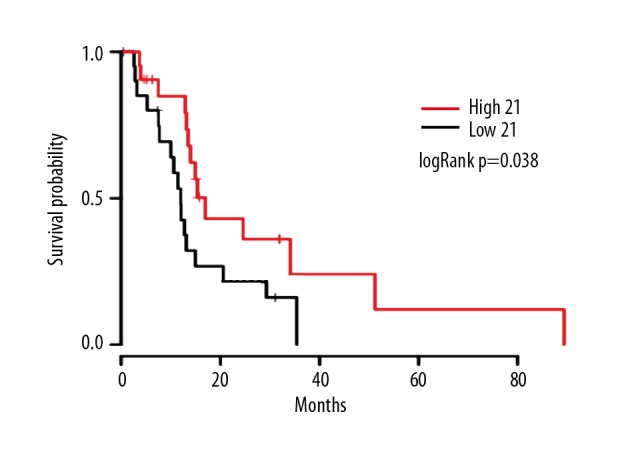
Overall survival. The red is the PHYHIPL high-expression group; the black is the PHYHIPL low-expression group. Log-rank p=0.038.
PHYHIPL gene expression in TCGA-GBM
Figure 5 shows that PHYHIPL gene is expressed less in primary GBM than in normal tissue. t=−8.410, p<0.001, CI=(−2.743, −0.903).
Figure 5.

PHYHIPL expression in TCGA-GBM. The primary tumor mean expression is 3873.513, the solid tissue normal mean expression is 9486.2, the t test was used in the comparison, the t=−8.410, p≤0.001.
PHYHIPL gene in primary GBM
We selected the primary GBM for further analysis and there are 154 primary tumor samples. The mean expression of PHYHIPL gene was 3873.513, so we divided them into 2 groups according to the mean expression: the high-expression sample was 59 and the low-expression sample was 95. DEG analysis also used the Limma package [10]. There were 16 158 genes in it, and the threshold was an adjusted p-value=0.05 and |log2 fold change (FC)|=1 was set. There were 499 upregulated genes and 170 downregulated genes. The volcano map was shown in Figure 6. Subsequently, we used the clusterProfiler R package [12] to explore the downregulated genes and upregulated genes in GO and KEGG pathways (Figures 7, 8).
Figure 6.

The volcano plot of TCGA-GBM. The black point is the unchanged genes; the green point is the downregulated genes; the red is upregulated genes.
Figure 7.

The downregulated DEGs in the GO and KEGG pathways. The threshold was set at minimal size of genes annotated by Ontology term for testing=10, the cutoff value of p-value is 0.05, q value cutoff is 0.2. The size of blots represents the enriched count numbers, the color of blots is the adjusted p-value. It only shows the top 10 enriched GO and the top 5 enriched KEGG pathway. (A) Cellular Component (CC); (B) Biological Process (BP); (C) Molecular Function (MF); (D) KEGG pathway.
Figure 8.

The upregulation DEGs gene ontology and KEGG pathway. The threshold was set at minimal size of genes annotated by Ontology term for testing=10, the cutoff value of p-value is 0.05, q value cutoff is 0.2. The size of blots represents the enriched count numbers, the color of blots is the adjusted p-value. It only shows the top 10 enriched GO and KEGG pathways. (A) Cellular Component (CC); (B) Biological Process (BP); (C) Molecular Function (MF); (D) KEGG pathway.
The GO is constructed of Cellular Component (CC), Biological Process (BP), and Molecular Function (MF). The pictures only show the top 10 Clustering results. CC enrichment suggests that downregulated DEGs were significantly enriched in the extracellular matrix, proteinaceous extracellular matrix, endoplasmic reticulum lumen, and collagen trimer. BP enrichment suggests that downregulated DEGs were significantly enriched in extracellular structure organization, extracellular matrix organization, and skeletal system development. MF was significantly enriched in receptor-ligand activity, enzyme inhibitor activity, cytokine activity, and growth factor binding. The KEGG enrichment suggests that downregulated DEGs were significantly enriched in cytokine-cytokine receptor interaction, the TNF signaling pathway, the IL-17 signaling pathway, transcriptional misregulation in cancer, and AGE-RAGE signaling pathway in diabetic complications. CC enrichment suggests that upregulated DEGs were significantly enriched in postsynapse, synaptic membrane, and neuronal cell body. BP enrichment suggests that upregulated DEGs were significantly enriched in the regulation of membrane potential, modulation of chemical synaptic transmission, and the regulation of trans-synaptic signaling. MF was significantly enriched in channel activity, passive transmembrane transporter activity, and substrate-specific channel activity. The KEGG enrichment suggests that upregulated DEGs were significantly enriched in retrograde endocannabinoid signaling, morphine addiction, the cAMP signaling pathway, and GABAergic synapse.
PPI net
There were 10 proteins in PPI net, including StAR-related lipid transfer domain containing 7(STARD7), outer mitochondrial membrane lipid metabolism regulator (OPA3), enoyl-CoA hydratase 1 (ECH1), dehydrogenase/reductase 4 (DHRS4), peptidase, mitochondrial processing beta subunit (PMPCB), armadillo repeat containing 4 (ARMC4), transmembrane and coiled-coil domains 6 (TMCO6), phosphodiesterase 9A (PDE9A), complement C1q binding protein (C1QBP), and chromosome 1 open reading frame, human C21orf33 (C21orf33). The average node degree was 3.09 and the PPI enriched p-value is 0.0331 (Figure 9).
Figure 9.

The PPI net of PHYHIPL by String. It shows STARD7, OPA3, ECH1, DHRS4, PMPCB, ARMC4, TMCO6, PDE9A, C1QBP, and C21orf33. The average node degree was 3.09 and the PPI enriched p-value was 0.0331.
Discussion
GBM is associated with poor prognosis and is the most common primary CNS cancer. The mechanism is not clear. It contains epigenetic alterations [14,15], mutation [16], copy numbers variations [17], DNA damage [18], microenvironment [19], and extracellular matrix [20]. The downregulated DEGs were significantly enriched in the extracellular matrix and the KEGG enrichment suggests that downregulated DEGs were significantly enriched in the TNF signaling pathway and the IL-17 signaling pathway. The KEGG enrichment suggests that upregulated DEGs were significantly enriched in retrograde endocannabinoid signaling and the cAMP signaling pathway.
The TNF signaling pathway plays a vital role in apoptosis, inflammation, and immunity. It is an important mediator of tumor progress [21]. EGFR gene amplification and mutation are common in GBM, but EGFR inhibitor is not active in GBM, mainly because the TNF-JNK-Axl-ERK signaling pathway mediates the resistance [22]. IL-17 is a pro-inflammatory cytokine that sustains a chronic inflammatory microenvironment that favors tumor formation. The IL-17R-Act1-TRAF4-MEKK3-ERK5 signaling pathway is vital for IL-17 to mediate keratinocyte proliferation and tumor formation [23]. Endocannabinoid signaling plays an antiproliferative role in GBM [24], and forskolin and 3-isobutyl-1-methylxanthine can inhibit the proliferation and proapoptotic activity in glioma stem cells through activating the cAMP signaling pathway [25].
We also found significant value in the PPI. STARD7 is a lipid transfer protein that is a mediator for phosphatidylcholine to mitochondria [26]. Want/β-catenin signaling can enhance the STARD7 expression [27], but in the adrenocortical adenomas, the PHYHIPL was downregulated according to the mutations of the β-catenin gene [28]. OPA3 had a protective function in mitochondria [29]. ECH1 plays a vital role in lymphatic metabolism [30]. DHRS4 is a kind of peroxisomal member [31]. PMPCB is the mediator for the majority of mitochondrial proteins [32]. ARMC4 is a new gene that has been found in peritoneal metastatic gastric carcinoma [33]. PDE9A is expressed highly in the brain, and it is a cGMP-specific phosphodiesterase [34]. C1QBP is a mitochondrial protein [35] that plays a vital role in promoting cell survival. Gene downregulation may be the result of miRNA and siRNA. It was reported that endogenous siRNA derived from RMRP results in off-target effects in humans, and PHYHIPL was identified as the most promising candidate [36].
Conclusions
PHYHIPL is expressed in the brain (RPKM57.9) (Gene ID: 84457). To the best of our knowledge, PHYHIPL has not been previously reported in GBM, so there is sparse related information on the function of PHYHIPL.
Bioinformatics analysis showed that the KEGG enrichment suggests that downregulated DEGs are significantly enriched in the TNF signaling pathway and the IL-17 signaling pathway, and they are the oncology pathways in GBM. The KEGG enrichment analysis suggests that upregulated DEGs are significantly enriched in retrograde endocannabinoid signaling and the cAMP signaling pathway, and they are the tumor-suppressor pathways in GBM. GBM prognosis may be connected to the pathways.
The PPI net showed that PHYHIPL may be a metabolism gene. Thus, we speculate that the PHYHIPL is related to GBM cell mitochondria, which regulates cell metabolism. It is well known that cell metabolism plays a vital role in tumor cell development. The decrease in PHYHIPL gene expression is due to mutations of the β-catenin gene and the endogenous siRNA in GBM. The mechanism should be explored in the future, which will contribute to the treatment and prognosis of GBM.
Data availability (where applicable)
The datasets analyzed are available in the Cancer Genome Atlas data portal and the gene expression omnibus database (GSE50161).
Acknowledgements
Thanks to the Shengxin Skill Tree team (Jimmy, Shipeng Guo, et al.) for support with R skills, and Zhen Xu (South China Normal University) provided help editing the paper.
Footnotes
Source of support: This study was supported by the grants from the Natural Science Foundation of GuangXi (grant no. 2017GXNSFAA198059) and the Key Laboratory of High Morbidity Prevention and Control of Colleges and Universities in GuangXi (grant no. kfkt2017003)
Conflict of interests
None.
References
- 1.Ostrom QT, Gittleman H, Stetson L, et al. Epidemiology of gliomas. Cancer Treat Res. 2015;163:1–14. doi: 10.1007/978-3-319-12048-5_1. [DOI] [PubMed] [Google Scholar]
- 2.Louis DN, Ohgaki H, Wiestler OD, et al. The 2007 WHO classification of tumours of the central nervous system. Acta Neuropathol. 2007;114(2):97–109. doi: 10.1007/s00401-007-0243-4. [DOI] [PMC free article] [PubMed] [Google Scholar]
- 3.Mazzoleni S, Politi LS, Pala M, et al. Epidermal growth factor receptor expression identifies functionally and molecularly distinct tumor-initiating cells in human glioblastoma multiforme and is required for gliomagenesis. Cancer Res. 2010;70(19):7500–13. doi: 10.1158/0008-5472.CAN-10-2353. [DOI] [PubMed] [Google Scholar]
- 4.Furukawa K, Kumon Y, Harada H, et al. PTEN gene transfer suppresses the invasive potential of human malignant gliomas by regulating cell invasion-related molecules. Int J Oncol. 2006;29(1):73–81. [PubMed] [Google Scholar]
- 5.Rasheed BK, McLendon RE, Herndon JE, et al. Alterations of the TP53 gene in human gliomas. Cancer Res. 1994;54(5):1324–30. [PubMed] [Google Scholar]
- 6.Bouvier-Labit C, Chinot O, Ochi C, et al. Prognostic significance of Ki67, p53 and epidermal growth factor receptor immunostaining in human glioblastomas. Neuropathol Appl Neurobiol. 1998;24(5):381–88. doi: 10.1046/j.1365-2990.1998.00137.x. [DOI] [PubMed] [Google Scholar]
- 7.Griesinger AM, Birks DK, Donson AM, et al. Characterization of distinct immunophenotypes across pediatric brain tumor types. J Immunol. 2013;191(9):4880–88. doi: 10.4049/jimmunol.1301966. [DOI] [PMC free article] [PubMed] [Google Scholar]
- 8.Davis S, Meltzer PS. GEOquery: A bridge between the Gene Expression Omnibus (GEO) and BioConductor. Bioinformatics (Oxford, England) 2007;23(14):1846–47. doi: 10.1093/bioinformatics/btm254. [DOI] [PubMed] [Google Scholar]
- 9.Carlson M. R package version 3.0.0. 2015. hgu133plus2 db: Affymetrix Human Genome U133 Plus 2.0 Array annotation data (chip hgu133plus2) [Google Scholar]
- 10.Ritchie ME, Phipson B, Wu D, et al. limma powers differential expression analyses for RNA-sequencing and microarray studies. Nucleic Acids Res. 2015;43(7):e47. doi: 10.1093/nar/gkv007. [DOI] [PMC free article] [PubMed] [Google Scholar]
- 11.Li R, Qu H, Wang S, et al. GDCRNATools: An R/Bioconductor package for integrative analysis of lncRNA, miRNA and mRNA data in GDC. Bioinformatics (Oxford, England) 2018;34(14):2515–17. doi: 10.1093/bioinformatics/bty124. [DOI] [PubMed] [Google Scholar]
- 12.Yu G, Wang LG, Han Y, He QY. clusterProfiler: An R package for comparing biological themes among gene clusters. OMICS. 2012;16(5):284–87. doi: 10.1089/omi.2011.0118. [DOI] [PMC free article] [PubMed] [Google Scholar]
- 13.Szklarczyk D, Franceschini A, Wyder S, et al. STRING v10: protein-protein interaction networks, integrated over the tree of life. Nucleic Acids Res. 2015;43(Database issue):D447–52. doi: 10.1093/nar/gku1003. [DOI] [PMC free article] [PubMed] [Google Scholar]
- 14.Dong Z, Cui H. Epigenetic modulation of metabolism in glioblastoma. Semin Cancer Biol. :2018. doi: 10.1016/j.semcancer.2018.09.002. [Epub ahead of print] [DOI] [PubMed] [Google Scholar]
- 15.Nagarajan RP, Costello JF. Epigenetic mechanisms in glioblastoma multiforme. Semin Cancer Biol. 2009;19(3):188–97. doi: 10.1016/j.semcancer.2009.02.005. [DOI] [PubMed] [Google Scholar]
- 16.Ham SW, Jeon HY, Jin X, et al. TP53 gain-of-function mutation promotes inflammation in glioblastoma. Cell Death Differ. 2018;27(2):103–11. doi: 10.1038/s41418-018-0126-3. [DOI] [PMC free article] [PubMed] [Google Scholar]
- 17.Jones DC, Scanteianu A, Distefano M, et al. Analysis of copy number loss of the ErbB4 receptor tyrosine kinase in glioblastoma. PLoS One. 2018;13(1):e0190664. doi: 10.1371/journal.pone.0190664. [DOI] [PMC free article] [PubMed] [Google Scholar]
- 18.Tuzgen S, Hanimoglu H, Tanriverdi T, et al. Relationship between DNA damage and total antioxidant capacity in patients with glioblastoma multiforme. Clin Oncol. 2007;19(3):177–81. doi: 10.1016/j.clon.2006.11.012. [DOI] [PubMed] [Google Scholar]
- 19.Mondal A, Kumari Singh D, Panda S, Shiras A. Extracellular vesicles as modulators of tumor microenvironment and disease progression in glioma. Front Oncol. 2017;7:144. doi: 10.3389/fonc.2017.00144. [DOI] [PMC free article] [PubMed] [Google Scholar]
- 20.Ulrich TA, de Juan Pardo EM, Kumar S. The mechanical rigidity of the extracellular matrix regulates the structure, motility, and proliferation of glioma cells. Cancer Res. 2009;69(10):4167–74. doi: 10.1158/0008-5472.CAN-08-4859. [DOI] [PMC free article] [PubMed] [Google Scholar]
- 21.Chen G, Goeddel DV. TNF-R1 signaling: A beautiful pathway. Science. 2002;296(5573):1634–35. doi: 10.1126/science.1071924. [DOI] [PubMed] [Google Scholar]
- 22.Guo G, Gong K, Ali S, et al. A TNF-JNK-Axl-ERK signaling axis mediates primary resistance to EGFR inhibition in glioblastoma. Nat Neurosci. 2017;20(8):1074–84. doi: 10.1038/nn.4584. [DOI] [PMC free article] [PubMed] [Google Scholar]
- 23.Wu L, Chen X, Zhao J, et al. A novel IL-17 signaling pathway controlling keratinocyte proliferation and tumorigenesis via the TRAF4-ERK5 axis. J Exp Med. 2015;212(10):1571–87. doi: 10.1084/jem.20150204. [DOI] [PMC free article] [PubMed] [Google Scholar]
- 24.Ellert-Miklaszewska A, Ciechomska IA, Kaminska B. Chapter e11 – Cannabinoid signaling in glioma cells and therapeutic implications. Handbook of Cannabis & Related Pathologies. 2017:e111–e21. [Google Scholar]
- 25.Lv P, Wang W, Cao Z, et al. Fsk and IBMX inhibit proliferation and proapoptotic of glioma stem cells via activation of cAMP signaling pathway. J Cell Biochem. 2019;120(1):321–31. doi: 10.1002/jcb.27364. [DOI] [PubMed] [Google Scholar]
- 26.Horibata Y, Sugimoto H. StarD7 mediates the intracellular trafficking of phosphatidylcholine to mitochondria. J Biol Chem. 2010;285(10):7358–65. doi: 10.1074/jbc.M109.056960. [DOI] [PMC free article] [PubMed] [Google Scholar]
- 27.Rena V, Angeletti S, Panzetta-Dutari G, Genti-Raimondi S. Activation of beta-catenin signalling increases StarD7 gene expression in JEG-3 cells. Placenta. 2009;30(10):876–83. doi: 10.1016/j.placenta.2009.07.010. [DOI] [PubMed] [Google Scholar]
- 28.Durand J, Lampron A, Mazzuco TL, et al. Characterization of differential gene expression in adrenocortical tumors harboring beta-catenin (CTNNB1) mutations. J Clin Endocrinol Metab. 2011;96(7):E1206–11. doi: 10.1210/jc.2010-2143. [DOI] [PubMed] [Google Scholar]
- 29.Pei W, Kratz LE, Bernardini I, et al. A model of Costeff Syndrome reveals metabolic and protective functions of mitochondrial OPA3. Development. 2010;137(15):2587–96. doi: 10.1242/dev.043745. [DOI] [PMC free article] [PubMed] [Google Scholar]
- 30.Zhang J, Sun M, Li R, et al. Ech1 is a potent suppressor of lymphatic metabolism in hepatocarcinoma. Biomed Pharmacother. 2013;67(7):557–60. doi: 10.1016/j.biopha.2013.03.018. [DOI] [PubMed] [Google Scholar]
- 31.Matsunaga T, Endo S, Maeda S, et al. Characterization of human DHRS4: an inducible short-chain dehydrogenase/reductase enzyme with 3beta-hydroxysteroid dehydrogenase activity. Arch Biochem Biophys. 2008;477(2):339–47. doi: 10.1016/j.abb.2008.06.002. [DOI] [PubMed] [Google Scholar]
- 32.Gakh O, Cavadini P, Isaya G. Mitochondrial processing peptidases. Biochim Biophys Acta. 2002;1592(1):63–77. doi: 10.1016/s0167-4889(02)00265-3. [DOI] [PubMed] [Google Scholar]
- 33.Zhang J, Huang JY, Chen YN, et al. Erratum: Whole genome and transcriptome sequencing of matched primary and peritoneal metastatic gastric carcinoma. Sci Rep. 2015;5:15309. doi: 10.1038/srep15309. [DOI] [PMC free article] [PubMed] [Google Scholar]
- 34.Fisher DA, Smith JF, Pillar JS, et al. Isolation and characterization of PDE8A, a novel human cAMP-specific phosphodiesterase. Biochem Biophys Res Commun. 1998;246(3):570–77. doi: 10.1006/bbrc.1998.8684. [DOI] [PubMed] [Google Scholar]
- 35.McGee AM, Douglas DL, Liang Y, et al. The mitochondrial protein C1qbp promotes cell proliferation, migration and resistance to cell death. Cell Cycle. 2011;10(23):4119–27. doi: 10.4161/cc.10.23.18287. [DOI] [PMC free article] [PubMed] [Google Scholar]
- 36.Maida Y, Kyo S, Lassmann T, et al. Off-target effect of endogenous siRNA derived from RMRP in human cells. Int J Mol Sci. 2013;14(5):9305–18. doi: 10.3390/ijms14059305. [DOI] [PMC free article] [PubMed] [Google Scholar]
Associated Data
This section collects any data citations, data availability statements, or supplementary materials included in this article.
Data Availability Statement
The datasets analyzed are available in the Cancer Genome Atlas data portal and the gene expression omnibus database (GSE50161).