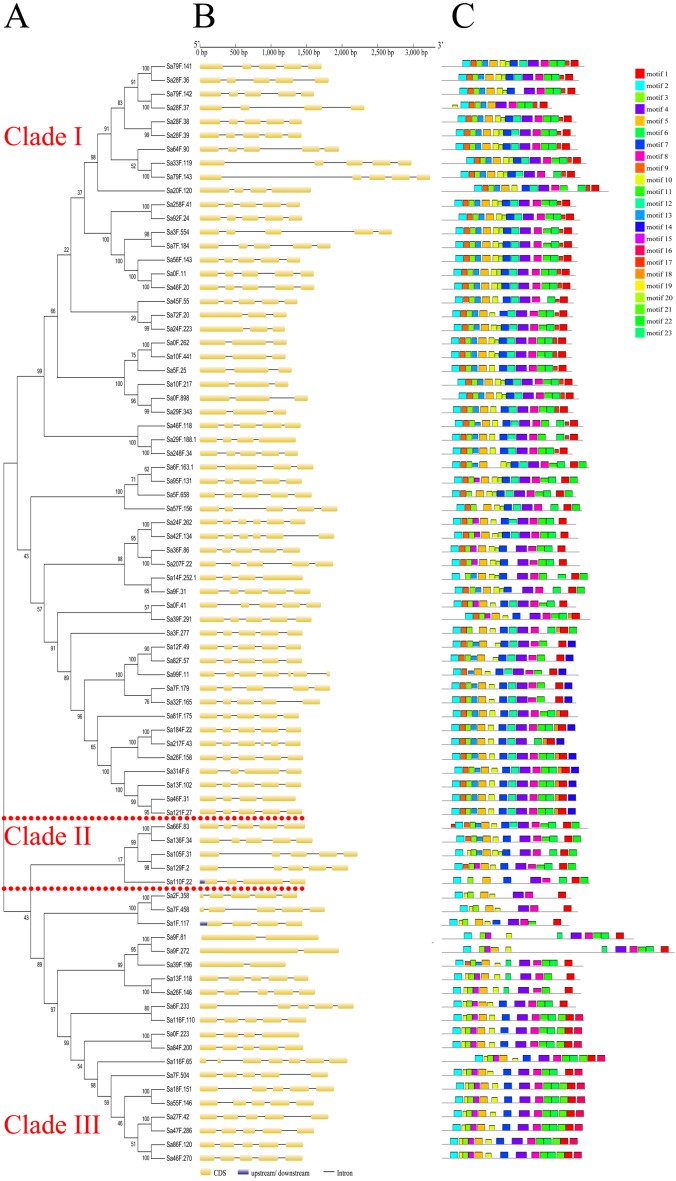
Figure 2. Gene structures and motif compositions of the GELP family in S. alfredii.
(A) The phylogenetic tree of SaGELP amino acid sequences was inferred using the Neighbor-joining method and 1000 bootstrap replicates; (B) Gene structures of SaGELPs. Yellow boxes represent CDS, blue boxes represent upstream or downstream, lines represent introns; (C) Schematic representation of each of the conserved motifs in the SaGELPs selected by the MEME online tool. Different motifs are represented by different colored boxes.

