

Abstract
Mosquito-borne flaviviruses, including dengue virus (DENV) and Zika virus (ZIKV), are a growing public health concern. Systems level analysis of how flaviviruses hijack cellular processes through virus-host protein-protein interactions (PPIs) provide information about their replication and pathogenic mechanisms. We used affinity purification-mass spectrometry (AP-MS) to compare flavivirus-host interactions for two viruses (DENV and ZIKV) in two hosts (human and mosquito). Conserved virus-host PPIs revealed that the flavivirus NS5 protein suppresses interferon stimulated genes by inhibiting recruitment of the transcription complex PAF1C, and that chemical modulation of SEC61 inhibits DENV and ZIKV replication in human and mosquito cells. Finally, we identified a ZIKV-specific interaction between NS4A and ANKLE2, a gene linked to hereditary microcephaly, and showed that ZIKV NS4A causes microcephaly in Drosophila in an ANKLE2-dependent manner. Thus, comparative flavivirus-host PPI mapping provides biological insights, and when coupled with in vivo models, can be used to unravel pathogenic mechanisms.
Keywords: flavivirus, dengue virus, Zika virus, proteomics, PAF1C, interferon stimulated genes, Sec61, endoplasmic reticulum, ANKLE2, microcephaly, Drosophila
Graphical Abstract

Introduction
Vector-borne flaviviruses are a source of emerging and re-emerging infectious diseases. Dengue virus (DENV) is transmitted by mosquitoes and infects nearly 400 million people annually (Bhatt et al., 2013). Zika virus (ZIKV), which is also transmitted by mosquitoes, has a replication cycle similar to DENV (Saiz et al., 2016), but causes a distinct disease. For example, infections in pregnant women are linked to congenital microcephaly (Mlakar et al., 2016) and other developmental defects in infants (de Paula Freitas et al., 2016; Moore et al., 2017). Given the many similarities as well as the striking differences in pathogeneses, comparative studies of DENV and ZIKV should be useful in identifying their underlying causes. These studies will be especially critical for developing antiviral therapies, a priority in light of the absence of effective vaccines for both viruses.
Flaviviruses are positive sense, single-stranded RNA viruses. Their genomes are approximately 11 kilobases in length and encode a single polyprotein that is cleaved by viral and cellular proteases into 10 viral proteins. In addition to genomic RNA, virions are comprised of three structural proteins, Capsid, prM, and Env, that facilitate virion entry and maturation. Non-structural (NS) proteins orchestrate replication, assembly, and release. The functions of the non-structural proteins are still being discovered, but it is well established that NS2B together with NS3 forms the viral protease, NS3 alone serves as the double stranded RNA helicase, NS4A remodels endoplasmic reticulum (ER) membranes to create replication sites, and NS5 is an RNA methyltransferase and RNA-dependent RNA polymerase (Fernandez-Garcia et al., 2009).
Viruses must also hijack a considerable number of host factors to rewire cellular pathways and carry out processes required for replication. This is often achieved through physical interactions between viral and host proteins, and several flavivirus-host protein-protein interactions (PPIs) have been described (Fernandez-Garcia et al., 2009). For example, both DENV and ZIKV NS5 antagonize interferon (IFN) signaling through binding and ubiquitin-mediated degradation of STAT2 (Ashour et al., 2009; Grant et al., 2016).
Unbiased, systematic studies play a powerful role in the effort to identify new virus-host PPIs by elucidating how viruses replicate (Batra et al., this issue; Davis et al., 2015; Jager et al., 2011a; Kane et al., 2015; Ramage et al., 2015; Taguwa et al., 2015), uncovering new functions of host machinery (Chen et al., 2018; Jager et al., 2011b) and revealing how dysfunction of these pathways can cause disease (Eckhardt et al., 2018). Several systematic and unbiased approaches to identify host factors involved in flavivirus replication have been conducted to date (Hafirassou et al., 2017; Mairiang et al., 2013; Marceau et al., 2016), but none have systematically identified flavivirus-host PPIs for multiple flaviviruses directly in the host cells in which they replicate, human and mosquito.
A key advantage of integrating multiple virus-host PPI networks is that this comparative approach can help elucidate similarities and differences in mechanisms of replication and even pathogenesis (Shah et al., 2015). Here, we used a combined proteomic and gene perturbation approach to generate and integrate three complementary flavivirus-host protein interaction networks in human and mosquito hosts to identify similarities that may be targeted therapeutically and isolate possible mechanisms of pathogenesis. Finally, using ZIKV-specific PPIs, an NS4A-ANKLE2 interaction was uncovered and shown to impede brain development in Drosophila, suggesting that this connection is at least, in part, responsible for ZIKV-induced microcephaly.
Results
Generating a high confidence DENV-human protein-protein interaction network
Identifying virus-host interactions can be valuable for understanding how viruses hijack and re-wire host machinery. As a basis for our comparative studies, a DENV-human PPI map was created using an integrated AP-MS and RNAi screening approach (Figure 1A). The open reading frames (ORFs) corresponding to each of the 10 viral proteins of DENV serotype 2 strain 16681 were cloned with a C-terminal 2xStrep affinity tag. Three additional constructs were cloned for expression: a membrane-anchored Capsid (Capsid Anchor), prM and E together since prM is the viral chaperone for folding the E protein (prM/E), and NS2B together with NS3 to mimic an active protease (NS2B3) (Table S1). The tagged proteins were expressed and affinity purified from human HEK293T cells and analyzed by MS.
Figure 1: Summary of the DENV-human protein-protein interaction network.

(A) Overall pipeline for the integrated AP-MS and RNAi approach to define DENV-human PPIs. (B) Schematic of RNAi screening approach. (C) RNAi knockdown efficiency for 37 genes measured by RT-qPCR. (D) Summary of RNAi screening of 350 host factors using quadruplicate measurements. (E) ROC analysis of MiST training using RNAi data, and additional filtering by CompPASS. (F) Functional enrichment analysis by bait. Highly similar categories with significant enrichment (false discovery rate (FDR) corrected q value < 0.05) were combined (Table S4), and the most conservative q values of combined terms are plotted. (*) indicates established role in flavivirus biology. (G) Overlap of DENV-human network with Flaviviridae protein interaction datasets. (H) Overlap of DENV-human network with Flaviviridae genetic datasets.
The resulting proteomic data were subjected to MiST, a scoring system that quantitatively analyzes host-pathogen proteomic AP-MS data (Jager et al., 2011a; Verschueren et al., 2015). Since a large enough list of validated DENV-human PPIs does not exist to benchmark our MiST scoring parameters, gene perturbation was used data to refine MiST scoring, an approach that was successful for hepatitis C virus (HCV) (Ramage et al., 2015). Starting with previously defined weights (Jager et al., 2011a), the top 350 interactors were functionally examined in an RNAi knockdown screen in Huh7 cells, using a DENV Renilla luciferase reporter virus (Samsa et al., 2009) (Figure 1B, Table S2). Knockdown averaged 72%, as measured for 37 genes using RT-qPCR (Figure 1C). Importantly, while this RNAi knockdown approach may lead to false negatives due to redundancy, we controlled for toxicity to avoid false positives associated with perturbing essential genes. DENV-interacting host factors that were previously reported to be flavivirus host dependency factors and their associated complex members were recovered, including SEC61G and SRPR (Krishnan et al., 2008; Zhang et al., 2016), and new potential restriction factors PAF1 and GNL3 (Figure 1D) were also identified. Adding this data to the curated literature set (Figure 1D, Table S2) resulted in the set of 23 benchmark interactions for iterative MiST training (Figure 1E). The optimal DENV MiST weight set (Table S3) identified a total of 498 DENV-human interactions, including 14 of the 23 benchmark interactions. Using a complementary scoring algorithm, CompPASS (Sowa et al., 2009), we further restricted our final list of protein interactions to only those surpassing both the MiST scoring threshold and those found within the top 5% of CompPASS scores for each bait. This collective analysis resulted in a total of 198 high-confidence DENV-human PPIs across 12 distinct baits (Figures 1E, Table S4).
To identify processes and pathways that may be targeted by specific DENV proteins, enrichment analysis was performed on sets of host proteins interacting with individual viral baits (Table S5). This revealed that viral proteins were interacting with host factors that were significantly enriched in biological processes consistent with their subcellular localization and known biology. For example, NS4A was enriched for interaction partners involved in ER and Golgi function (Figure 1F), consistent with its localization (Figures S2 and S3) and role in forming convoluted membranes in the ER (Miller et al., 2007). Furthermore, NS5 was enriched for interaction partners linked to nuclear functions including chromatin modification and RNA processing (Figure 1F), in line with its nuclear localization (Figure S2), and our recent finding that DENV NS5 inhibits splicing of host mRNA (De Maio et al., 2016). Our network is also enriched for interactions with proteins involved in lipid metabolism and ER stress, which could help elucidate the exact mechanisms of these previously known perturbations (Heaton and Randall, 2010; Pena and Harris, 2011).
We also explored the level of overlap between our DENV-human PPI network and other previously published Flaviviridae protein interaction and genetic datasets. There was not significant overlap with Y2H data (p = 0.07, Fisher’s exact test) (Table S4), possibly owing to fundamental differences between the AP-MS and Y2H methods (von Mering et al., 2002). However, previously published AP-MS data shared a significant overlap (Table S4), with a total of 18 common virus-host protein interactions (p < 4e-6, Fisher’s exact test) (Figure 1G). A significant overlap was also seen for 21 genes involved in DENV-human protein interactions that give a Flaviviridae replication phenotype through genetic perturbation methods (p < 2e-3, Fisher’s exact test) (Figure 1H, Table S4), suggesting that our network includes PPIs important for viral replication.
To enable a more detailed examination of the interactions uncovered by our AP-MS approach, we used a network representation to map the DENV-human PPIs surpassing our scoring thresholds (Figure 2). Overlaying interactions from the benchmark dataset and previously published replication phenotypes as well as 149 well-characterized human-human PPIs on the DENV-human PPI network highlighted specific interactions of interest. This included the previously identified interactions between NS1 and complement component C4A (Avirutnan et al., 2010), EI24 and the TRiC chaperone complex (Hafirassou et al., 2017), NS2B3 interacting with members of the CTLH complex (Kobayashi et al., 2007), and NS5 with the PAF1 complex PAF1C (Krogan et al., 2002). Interactions between DENV proteins and p62 (SQSTM1), TTC37, and TRIM26 were also detected, all of which were previously implicated in DENV replication (Marceau et al., 2016; Metz et al., 2015).
Figure 2: The DENV-human protein-protein interaction network.

198 high confidence DENV-human PPIs are shown. Viral baits (grey squares), human prey (blue circles), benchmark interactions used for MiST training (dark blue circles), previously reported Flaviviridae replication phenotype (thick black border), virus-host interactions (solid grey lines), host-host interactions (dashed blue lines).
Comparing ZIKV and DENV-human protein-protein interaction networks
The recently emerged ZIKV shares many aspects of replication and pathogenesis with DENV. To identify potential virus-host protein interactions that might mediate these similarities, AP-MS analysis was extended to ZIKV. ZIKV ORFs for the French Polynesia 2013 H/FP/2013 (ZIKVfp) and Uganda 1947 MR766 (ZIKVug) strains were subjected to AP-MS and MiST scoring using the same strategy employed for the DENV-human interactome (Tables S1 and S4). We focused on Capsid, NS3, NS2B3, NS4A and NS5, since these baits produced high quality data (Figure S1, see STAR Methods for more detail). There was a significant level of overlap between the two strains of ZIKV (63%, p < 2.2e-16, Fisher’s exact test) (Figure S4), and ZIKVfp was chosen for further analysis since it is more closely related to the Brazilian strain causing the current microcephaly-associated epidemic (Wang et al., 2016).
Comparing the DENV-human and ZIKV-human PPI networks revealed a significant overlap of 28 virus-host protein interactions between the DENV and ZIKV AP-MS datasets (p < 7e-9, Fisher’s exact test) (Figure S4). We also considered network overlap at the complex and pathway level to get a higher-level perspective on conservation of flavivirus-host interactions. Enrichment analysis on both datasets allowed for a comparison of biological processes and cellular compartments showed extensive overlap between the two networks (Figures 3A and S5A, Table S5), with toverlap for NS5 was particularly strong (9 out of 17 shared functional categories). The enrichment in interactions involved in gene expression for both DENV and ZIKV underlined the potential role of flavivirus NS5 in regulating host gene expression during infection. The interaction between NS5 and PAF1C stood out since PAF1C was the only complex for which multiple subunits were identified as high confidence interaction partners in both datasets (Figure 3A), and knockdown of PAF1 increased virus reporter activity in the DENV RNAi screen (Figure 1D, Table S2).
Figure 3: Comparative proteomics reveals that flavivirus NS5 antagonizes host restriction factor PAF1C.
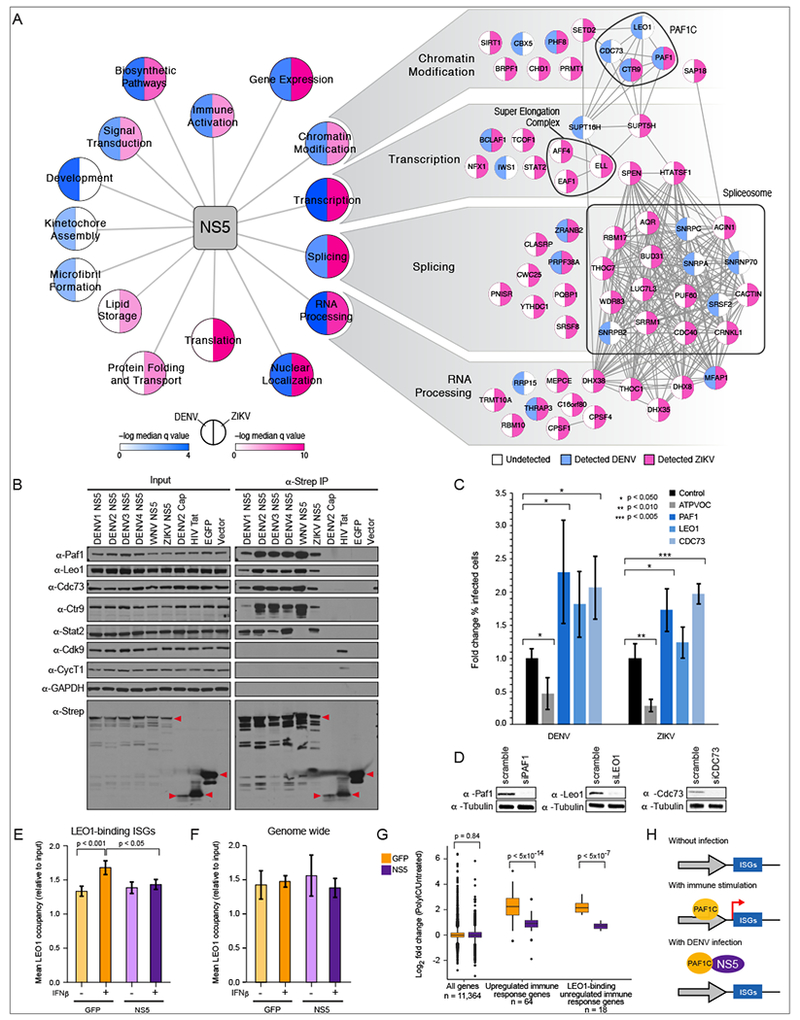
(A) DENV-human (blue) and ZIKV-human (pink) data were compared using gene ontology biological process and cellular compartment categories. Highly similar categories with significant enrichment (FDR corrected q value < 0.05) were combined (Table S5), and median q values of combined terms are plotted. Individual interactions detected in DENV (blue) and ZIKV (pink) datasets are shown for a subset of NS5 enrichment categories. (B) NS5 interaction with PAF1C subunits is conserved across flaviviruses. 2xStrep II tagged NS5 constructs were subjected to AP and Western blot. Stat2 is a positive control for NS5 AP, DENV Cap (Capsid), HIV Tat and EGFP are negative controls. Red triangles indicate band corresponding to bait. (C) Knockdown of PAF1C subunits leads to increased infectivity by DENV and ZIKV. Error bars reflect standard deviation of four replicates. P values were calculated using a paired, one tailed student’s t-test. (D) Knockdown of PAF1C components was confirmed by Western blot. (E) Mean LEO1 occupancy for 67 DENV-induced genes plotted for ChIP-seq triplicates. Error bars reflect standard deviation. P values were calculated using paired, two-tailed Mann-Whitney U-test. (F) NS5 inhibition of LEO1 recruitment is specific to ISGs. (G) Quantitative comparison of genes expressed in NS5- and GFP-expressing cells after immunostimulation. Left side: genome-wide (11,364 genes); Middle: 64 genes differentially regulated by polyIC; Right: Overlap of genes from set of 64 genes in middle panel and the genes whose binding of LEO1 is affected by NS5 (18 genes). (H) Model of NS5 effect on immune response gene expression through interaction with PAF1C.
NS5 inhibits PAF1C recruitment to interferon stimulated genes (ISGs)
PAF1C is a chromatin-associated complex that promotes several key events required for transcriptional elongation. Specifically, PAF1C recruitment to the promoter is required for H3K4 and H3K79 trimethylation (Krogan et al., 2003). Given the conservation of the NS5-PAF1C interaction between DENV and ZIKV, the conservation of this interaction with other medically relevant flaviviruses was explored. Affinity purification and Western analysis showed that the NS5-PAF1C interaction was conserved across all four DENV serotypes, West Nile virus (WNV) and ZIKV (Figure 3B). Detection of STAT2 was used as a positive control for DENV and ZIKV NS5 (Ashour et al., 2009; Grant et al., 2016), while the negative controls DENV Capsid, GFP and empty vector did not associate with PAF1C. HIV Tat served as another control since it is known to interact with nuclear localized regulators of transcription elongation, and known interactions between Tat and CDK9 and Cyclin T1 (CYCT1) (Zhu et al., 1997) were confirmed, but association with PAF1C was not observed.
We next tested if the PAF1 knockdown phenotype observed in our earlier screen (Figure 1C) was conserved across DENV and ZIKV. RNAi knockdown of PAF1C members PAF1, LEO1 and CDC73 all led to an increase in both DENV and ZIKV infectivity relative to a non-targeting siRNA control (Figure 3C and D). Knockdown of host dependency factor ATPVOC was used as a positive control and led to the expected decrease in infectivity (Krishnan et al., 2008).
We hypothesized that NS5 may abrogate antiviral responses by binding to PAF1C to inhibit expression of interferon stimulated genes (ISGs), similar to influenza A virus (IAV) NS1 protein (Marazzi et al., 2012). To test this hypothesis, chromatin immunoprecipitation followed by analysis via sequencing (ChIP-seq) on the PAF1C subunit LEO1 was performed in cells expressing DENV NS5 or GFP following interferon beta (IFNβ) stimulation. Since proteolytically processed DENV NS5 is known to degrade STAT2 and thereby inhibit IFN signaling (Ashour et al., 2009), a non-proteolytically processed NS5 that cannot degrade STAT2 was used (Figure S5B). We focused our analysis on DENV-induced ISGs that also produced an IFNβ-induced LEO1 ChIP-seq signal in GFP-expressing cells and found that LEO1 occupancy increased significantly across the gene bodies of DENV-induced ISGs following IFNβ treatment in GFP-expressing cells (p < 0.0001, two-tailed Mann-Whitney U-test), but not in NS5-expressing cells. The increase in LEO1 occupancy was also specific to these IFNp stimulation of DENV inducible ISGs (Figures 3E, 3F, and S5C).
To determine if NS5 impacts gene expression, RNA-seq analysis was carried out in cells expressing either NS5 or GFP after stimulation with Polyinosinic:polycytidylic acid (polyIC), an immunostimulant that acts upstream of IFN production (Longhi et al., 2009). Compared to cells expressing GFP, NS5-expressing cells significantly suppressed the induction of 64 immune response genes (p < 5×10⁻¹⁴, two-tailed Mann-Whitney U-test) including 18 genes that also showed an NS5-dependent reduction in LEO1 binding (p < 5×10⁻⁷, two-tailed Mann-Whitney U-test) (Figures 3G and S5D, Table S6). Of 19 reported IRF3-dependent genes (Rialdi et al., 2016), 15 were induced by polyIC and down-regulated in an NS5-dependent manner (Table S6), suggesting that at least some of the effect on the immune evasion occurs upstream of IFNβ signaling. Taken together, these data suggest that NS5 inhibits the recruitment of PAF1C to ISGs, an effect that significantly dampens expression of immune response genes (Figure 3H).
Comparing flavivirus interactions across human and mosquito hosts
DENV and ZIKV are mosquito-borne flaviviruses and must hijack host machinery in two vastly different hosts to facilitate basic aspects of viral replication. To understand how mosquito-borne flaviviruses might accomplish this complex task, AP-MS and MiST scoring was performed on DENV baits in Aedes aegypti Aag2 cells using the same strategy that was employed for the creation of the DENV-human network (Tables S1 and S4). Again, we focused on Capsid, NS3, NS2B3, NS4A and NS5 since these baits produced high quality data (Figure S1, see STAR Methods for more detail). We identified 15 interactions shared with the DENV-human interactome at the protein level (p < 5e-7, Fisher’s exact test), and 45 shared at the pathway or complex level (Figure S6A), suggesting that we are uncovering shared biology across both hosts.
To gain a global understanding of how cross-virus and cross-host virus-host PPIs may be conserved at the complex and pathway level, enrichment analyses was performed on all three networks (DENV-human, ZIKV-human and DENV-mosquito) at the level of biological processes and cellular compartments (Figures 4A and S6B, Table S5). One advantage of focusing on interactions conserved across viruses and hosts is that these interactions could serve as a starting point for broad-spectrum antiviral development with limited risk of viral resistance. There was overlap among all three AP-MS datasets for Capsid and NS4A, the latter showing the larger overlap (four out of six shared categories) (Figure S6B).
Figure 4: Pharmacological modulation of SEC61 translocon inhibits DENV and ZIKV replication in human and mosquito cells.

(A) Overlap between DENV-human (blue), ZIKV-human (pink), and DENV-mosquito (orange) NS4A interactions. Left panel: Enrichment analysis using gene ontology biological process categories. Highly similar categories with significant enrichment (FDR corrected q value < 0.05) were combined (Table S5), and median q values of combined terms are plotted. Right panel: individual interactions for a subset of enrichment categories. (B) Targeted proteomic analysis of flavivirus NS4A interaction with SEC61 translocon subunits and SRPR. Error bars reflect standard deviation from triplicates. (C) and (D) Inhibition of viral replication by 500nM CT8 and 1000 nM PS3061. DENV (blue) and ZIKV (pink) replication measured by plaque assay (C) and RT-qPCR of viral RNA (D) in human and mosquito cells. Error bars reflect standard deviation from triplicates. (E) CT8 (500 nM) inhibits DENV viral protein production in HEK 293T cells (MOI = 1). (F) CT8 (500 nM) inhibits DENV viral protein production in HEK 293T cells when added to cells post infection (MOI = 1). (G) Proposed model of cotransin inhibition of flavivirus replication.
Pharmacological modulation of the SEC61 translocon inhibits flavivirus replication
One of the most prominent sets of genes found to interact with DENV and ZIKV NS4A in both human and mosquito cells were classified as being involved in “Organelle Targeting and Organization” (Figure 4A). Included in this category are genes involved in targeting proteins to the ER, Golgi, and mitochondria, and maintaining organelle structure. Factors linked to ER function included the SEC61 translocon and the signal recognition particle receptor (SRPR), which together orchestrate the co-translational insertion of transmembrane proteins into the ER membrane (Shao and Hegde, 2011). While SRPR and SEC61G were highly specific to interactions with NS4A, SEC61A1 and SEC61B were found to interact with many baits in our AP-MS datasets, consistent with the fact that many flavivirus proteins include transmembrane domains and require co-translational translocation into the ER membrane. Targeted proteomics confirmed that while SEC61A1 and SEC61B interact with all of the tested flavivirus transmembrane proteins, SEC61G and SRPR specifically interact with DENV and ZIKV NS4A (Figure 4B).
Given the conservation of the SEC61 interaction for all three proteomic datasets, we next asked if the SEC61 translocon could be targeted by a small molecule for pan-flaviviral inhibition in both humans and mosquitoes. Previous RNAi and CRISPR screens have identified the SEC61 translocon as a flavivirus host dependency factor in human and insect cells (Krishnan et al., 2008; Zhang et al., 2016), and we recently demonstrated the inhibition of DENV replication in primary human monocyte-derived dendritic cells using the substrate-selective co-translational translocation inhibitor (cotransin) CT8 (Maifeld et al., 2011). Here, this analysis was extended to include PS3061, a CT8 analog with overlapping yet distinct pharmacological properties, which inhibited both DENV and ZIKV virion production and replication to nearly undetectable levels (Figure 4C and D). Importantly, cell viability was not decreased compared to the carrier control (Figure S6C). No viral protein production was observed after cotransin treatment (Figure 4E), suggesting that very early stages of viral protein co-translational translocation are impacted. Remarkably, cotransins inhibit viral protein production even when added 12 hours post infection, after initial viral replication complexes have formed (Lindenbach et al., 2013) (Figure 4F). Thus, chemical modulation of SEC61 by cotransins allows targeting of an essential cellular process required for early stages of DENV and ZIKV replication in both human and mosquito cells (Figure 4G).
ZIKV NS4A affects brain development in an ANKLE2-dependent manner
ZIKV is not unique among flaviviruses in its ability to cause microcephaly and other developmental defects (O’Leary et al., 2006; Platt et al., 2018), but the scale of the ZIKV epidemic has increased the urgency to understand the mechanisms behind this neuropathogenesis. Moreover, while ZIKV can cause microcephaly, there is currently no evidence that DENV can. We therefore hypothesized that ZIKV-specific interactions with human proteins involved in brain development contribute to its neuropathogenesis. Comparing the flavivirus-human networks, we identified several such ZIKV-specific interactions (Figure S4), including a connection between NS4A and ANKLE2. Interestingly, ANKLE2 mutations cause an autosomal recessive microcephaly in humans (Shaheen et al., 2018; Yamamoto et al., 2014). These effects are conserved in Drosophila, a well-established model organism for brain development (Wangler et al., 2015), as fly Ankle2 hypomorphic mutants (Ankle2A) are pupal lethal and exhibit microcephaly. Importantly, expression of human ANKLE2 (hANKLE2) in Drosophila Ankle2A mutants rescues the phenotype, indicating conserved functions of ANKLE2 (Yamamoto et al., 2014). Ubiquitous expression of ZIKV NS4A in wild type (WT) animals caused a significant decrease in 3rd instar larval brain volume compared to a CD8-GFP control (p < 0.001, one-way ANOVA, Sidak’s multiple comparisons test) (Figures 5A-C). Expression of hANKLE2 or dAnkle2 rescued this phenotype, while expression of a microcephaly-associated hANKLE2 variant (hANKLE2 Q782X) did not. Importantly, while Ankle2 heterozygous (Ankle2A/+) larvae had normal brain sizes, expression of ZIKV NS4A in these animals resulted in a severe brain volume reduction (p < 0.0001, one-way ANOVA, Sidak’s multiple comparison test) (Figures 5B and C). In addition, at high temperatures (29 °C), NS4A-expressing animals in this background showed extreme brain size reduction and often died earlier than controls (data not shown). This synergistic interaction suggests that Ankle2 is highly sensitive to the presence of NS4A, consistent with PPI-mediated dysfunction. In comparison, DENV2 NS4A induces a less severe phenotype that is not statistically different from wild type brains (Figure 5C). Targeted proteomics revealed that ANKLE2 interacts with both ZIKVug and ZIKVfp NS4A proteins, but a lower intensity interaction with DENV2 NS4A (Figure 5D), consistent with the fact that DENV has not been associated with microcephaly in humans.
Figure 5: ZIKV NS4A expression induces microcephaly in an ANKLE2-dependent manner.
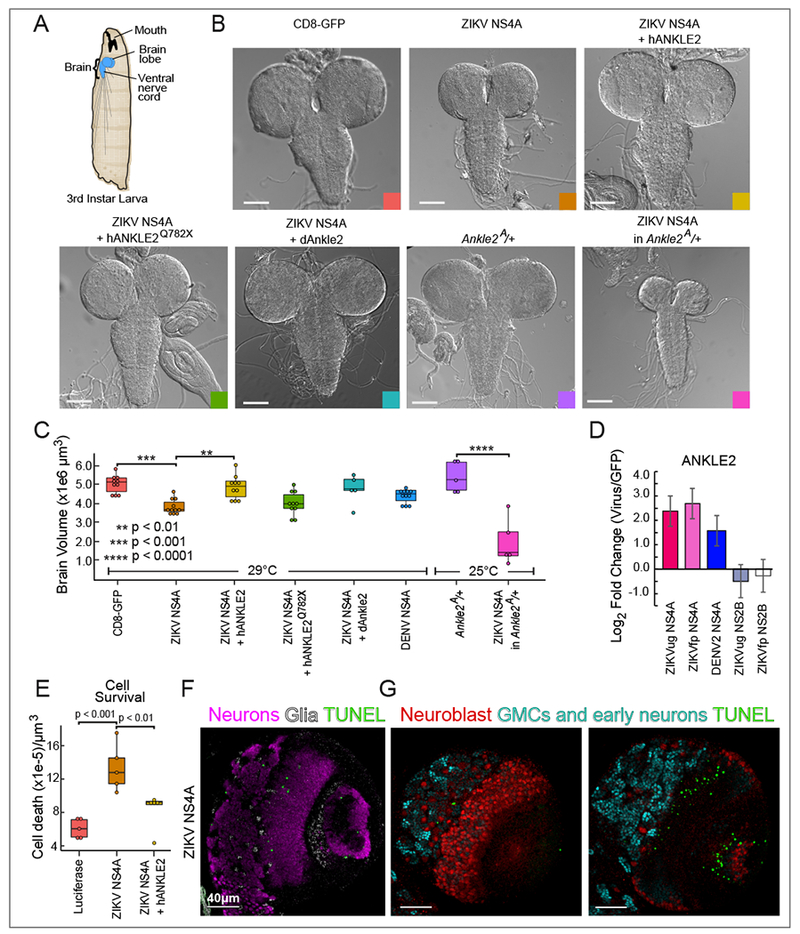
(A) Diagram of D. melanogaster 3rd instar larva brain. (B) Bright field images of 3rd instar brains expressing indicated proteins in a wild type or Ankle2A/+ background (two lower right images). Colored square matches color of corresponding box plot in (C). Scale bar 100 μm. (C) Brain volumes quantified from animals corresponding to panel (A). P values were calculated using one-way ANOVA, Sidak’s multiple comparisons test. (D) Targeted proteomic analysis of ANKLE2 interaction with DENV and ZIKV NS4A. NS2B was used as a negative control. Error bars reflect standard deviation from triplicates. (E) Cell death quantified in 5 brains expressing the indicated proteins using a TUNEL assay. P values were calculated using one-way ANOVA, Tukey’s multiple comparisons test. (F-G) Cell type specific cell death was analyzed using TUNEL followed by immunostaining to identify neurons, glia, and neuroblasts. A single slice was analyzed in each set of images. Scale bar 40 μm. (F) Merged signals for neurons (Elav, purple), glia (Repo, light gray) and TUNEL (green). (G) Merged signals for neuroblasts (Dpn, red), ganglion mother cells and early neuronal lineages (Pros, cyan), and TUNEL (green) from a region of the brain at the surface (left panel) and from a deeper region of the brain (right panel).
Since our previous work showed that Ankle2 loss promotes apoptosis in the larval fly brain (Yamamoto et al., 2014), we tested the effect of ZIKV NS4A on apoptosis. Cell death, as measured by Terminal deoxynucleotidyl transferase dUTP Nick-End Labeling (TUNEL), was significantly increased in 3rd instar larval brains expressing ZIKV NS4A (p < 0.001, one-way ANOVA, Tukey’s multiple comparisons test) and was partially rescued by expression of hANKLE2 (Figure 5E). Larvae expressing NS4A showed TUNEL-positive cells in neurons (Figure 5F) but rarely in neuroblasts (Figure 5G). Furthermore, while these larvae had normal levels of central brain neuroblast numbers, expressing NS4A in the background of heterozygous Ankle2A/+ animals led to a subtle reduction in the number of central neuroblast (Figures 6A and B), a significant reduction in medulla neuroblasts (Figures 6A and C), and reduced proliferation in half of animals tested as shown by EdU incorporation (Figure 6D). Finally, expression of NS4A in neuroblasts or neurons alone did not fully recapitulate the phenotypes observed upon ubiquitous expression (Figure 6E), indicating that multiple cell types throughout the brain are affected by NS4A. The optic lobe and medulla were most severely affected as demonstrated by eyeless-NS4A expression (Figure 6E). Collectively, these data show that NS4A expression inhibits key functions of Ankle2 in the developing brain (Figure 6F).
Figure 6: ZIKV NS4A interacts with Ankle2 and affects neuroblasts.
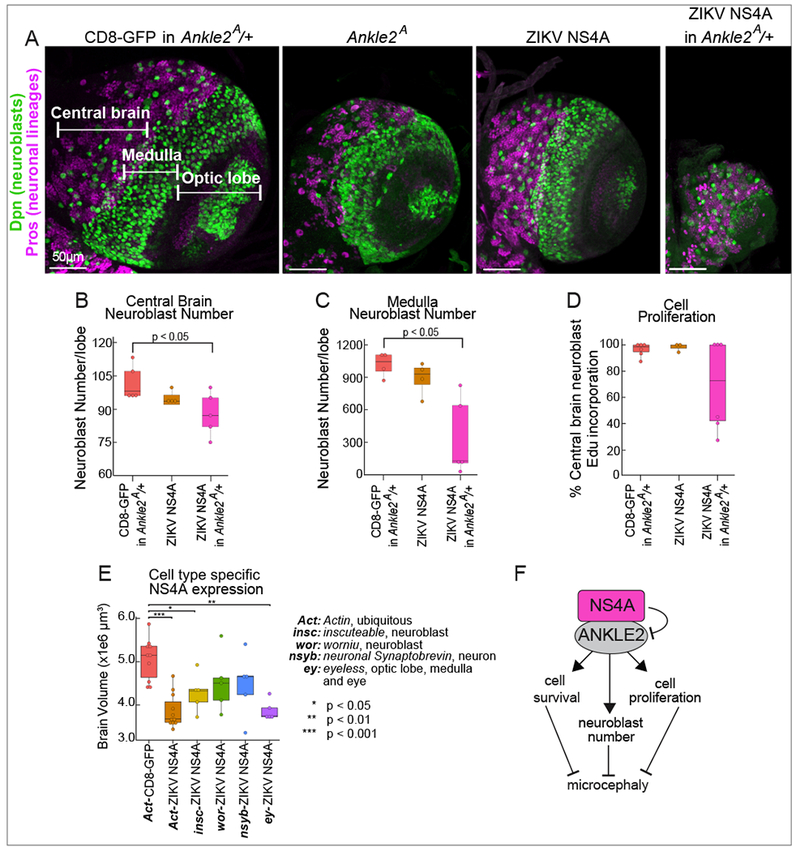
(A) 3rd instar larval brains from animals expressing the indicated proteins ubiquitously (driven by Act-GAL4), and stained for neuroblasts (Dpn, green) and neuronal lineages (Pros, purple) in control animals (CD8-GFP in Ankle2A/+), Ankle2A/Y males, NS4A, or NS4A in Ankle2A/+ animals. The CD8-GFP in control animals was not imaged. Scale bar 50 βm. (B) and (C) Quantification of neuroblasts in brains expressing the indicated proteins using total number of Dpn positive cells in the central brain (B) and medulla (C). (D) Central brain neuroblast proliferation was quantified in brains expressing the indicated proteins based on EdU incorporation in Dpn positive cells. (E) Brain volumes quantified from animals expressing the indicated construct with the indicated driver to test cell type specificity. P values were calculated using one-way ANOVA, Sidak’s multiple comparisons test. Act-NS4A was also shown in Figure 5C. (F) Model of ZIKV NS4A impact on ANKLE2 function and brain development.
Discussion
In this study, we present a systematic comparative analysis of flavivirus-host PPIs. By using a complementary and integrative physical (AP-MS) and gene perturbation (RNAi) approach, a comprehensive DENV-human PPI network for all DENV proteins was generated. This platform was extended to characterize ZIKV-human and DENV-mosquito PPIs to facilitate comparative studies and reveal several new aspects about flavivirus replication and pathogenesis.
Comparative protein-protein interaction mapping reveals a function for NS5-PAF1C interaction in immune evasion
Integrating the DENV and ZIKV interaction networks reveals a mechanism of NS5-mediated IFN antagonism through the NS5-PAF1C interaction. Flavivirus NS5 has been reported to antagonize the IFN signaling pathway via numerous mechanisms, including STAT2 degradation and nuclear translocation (Laurent-Rolle et al., 2014), suppression of IFNAR1 maturation (Lubick et al., 2015) and inhibition of splicing of RIG-I (De Maio et al., 2016). We show that NS5 also inhibits the recruitment of PAF1C to ISGs and subsequent ISG expression, similar to IAV NS1 protein (Marazzi et al., 2012). It will be of interest to examine if other viruses, bacteria or parasites target PAF1C as a general mechanism for inhibition of innate immune responses.
SEC61 is a conserved hub for viral replication and potential drug target
We also demonstrate the utility of comparative virus-host PPI studies in identifying druggable host factors. Using pharmacological modulation of the SEC61 translocon, we confirm its essential role in DENV replication in human cells, and extend this to ZIKV and mosquito cells to demonstrate this strategy’s pan-flavivirus antiviral potential. Targeting host factors with antiviral drugs has the advantage of reducing the likelihood of viral resistance. Importantly, targeting SEC61 further decreases the risk of generating viral resistance due to the virus’ dependence on this host machinery in both human and mosquito cells, requiring any evolutionary adaption away from SEC61 to occur in both hosts.
Genetic and infectious causes of microcephaly via ANKLE2
Of all ZIKV targets identified in our proteomic approach, only ANKLE2 was previously linked to severe microcephaly (Shaheen et al., 2018; Yamamoto et al., 2014). In addition, ANKLE2-associated phenotypes are strikingly similar to ZIKV-associated microcephaly (Moore et al., 2017). Here, we show a potential role for ANKLE2 in ZIKV-induced microcephaly, arguing that severe ANKLE2-associated microcephaly can occur either through genetic loss of ANKLE2 or infectious causes. The observation that human ANKLE2 rescues mutant Ankle2 microcephaly as well as the microcephaly induced by expression of NS4A highlights the usefulness of Drosophila to functionally dissect pathogenic mechanisms (Wangler et al., 2015). Furthermore, experiments with animals heterozygous for Ankle2 demonstrate that a reduction in Ankle2 activity below a certain threshold highly sensitizes animals to NS4A expression and microcephaly. Our collective our data indicate that NS4A inhibits ANKLE2 and thus contributes to ZIKV induced microcephaly. These results underline the utility of PPIs and complementary genetic models in studying human disease to rapidly generate and test hypotheses.
Multiple possible mechanisms for ZIKV-mediated neuropathogenesis
While we show that ZIKV-associated microcephaly acts through the ANKLE2 pathway, it is possible that multiple developmental pathways synergize to promote microcephaly upon ZIKV infection. For example, ZIKV RNA was recently found to bind MSI1, an RNA-binding protein that regulates gene expression of microcephaly gene MCPH1, to facilitate viral replication in neuronal stem cells (Chavali et al., 2017). Disruption of the non-sense mediated decay pathway by ZIKV Capsid could also impact brain development (Fontaine et al., 2018). Furthermore, ZIKV NS2A was found to inhibit brain development in mice through degradation of adherens junction proteins (Yoon et al., 2017). It is also possible that NS4A causes neuropathogenesis through multiple mechanisms as previous studies demonstrate ZIKV NS4A and NS4B can inhibit NSC division through the Akt/mTOR pathway (Liang et al., 2016).
In summary, we show that comparative virus-host PPI mapping is a powerful approach to identify conserved mechanisms of replication and druggable host targets for broad-spectrum therapeutic intervention. When coupled with in vivo models of human disease, this systems-to-mechanism pipeline greatly helps our understanding of pathogenesis.
STAR Methods
CONTACT FOR REAGENT AND RESOURCE SHARING
Further information and requests for resources and reagents should be directed to the Lead Contact, Nevan J. Krogan (nevan.krogan@ucsf.edu).
EXPERIMENTAL MODEL AND SUBJECT DETAILS
Cells
HEK 293T cells (ATCC) (female) were cultured in DMEM/H21 medium supplemented with 10% FBS (Invitrogen), 1% pen/strep and 1% sodium pyruvate. Huh7 cells (Taguwa et al., 2015) (male) were cultured in DMEM/H21 medium supplemented with 10% FBS, 1% pen/strep, 1% sodium pyruvate and 1% non-essential amino acids. U2OS cells (ATCC) (female) were cultured in DMEM medium supplemented with 10% FBS (Invitrogen), 1% pen/strep and 1% glutamine. HeLa S3 cells (Yim et al., 1996) (female) were cultured in DMEM/H21 medium supplemented with 10% FBS (Invitrogen), 1% pen/strep and 1% sodium pyruvate. BHK cells (Aguirre et al., 2017) (unsexed) were cultured in minimal essential medium α (MEM α) (Thermo Fisher), supplemented with 10% FBS (Thermo Fisher), GlutaMAX (Thermo Fisher), 100 U/mL penicillin (Thermo Fisher), 100 μg/mL streptomycin (Thermo Fisher), and 10 mM HEPES (Thermo Fisher). Aag2 cells (Whitfield et al., 2017) (unknown gender) were culture in Schneider’s Drosophila medium (Invitrogen) supplemented with 10% FBS (Invitrogen), 1% pen/strep and 1% non-essential amino acids. C6/36 cells (Alvarez et al., 2005) (unknown gender) were cultured in L-15 medium supplemented with 10% FBS (Invitrogen), 1% pen/strep and 1% non-essential amino acids. All cells used are documented in the Key Resources Table.
KEY RESOURCES TABLE
| REAGENT or RESOURCE | SOURCE | IDENTIFIER |
|---|---|---|
| Antibodies | ||
| Mouse monoclonal anti-Strep II | Qiagen | Cat#34850 |
| Rabbit monoclonal anti-Calnexin | Cell Signalling | Cat#2679; RRID:AB_2228381 |
| Rabbit polyclonal anti-Grasp65 | Peretti et al., 2008 | N/A |
| Rabbit polyclonal anti-Tomm20 | Santa Cruz Biotechnology | Cat#sc-11415 |
| Rabbit polyclonal anti-Tip47 | Abcam | Cat#ab47638; RRID:AB_881572 |
| Anti-mouse Alexafluor 488 | Invitrogen | Cat#A28175; RRID:AB_2536161 |
| Anti-rabbit Alexafluor 555 | Invitrogen | Cat#A27039; RRID:AB_2536100 |
| Rabbit polyclonal anti-Paf1 | Bethyl Labs | Cat#A300-173A; RRID:AB_2159877 |
| Rabbit polyclonal anti-Leo1 | Bethyl Labs | Cat#A300-175A; RRID:AB_2135932 |
| Rabbit polyclonal anti-Ctr9 | Bethyl Labs | Cat#A301-395A; RRID:AB_960973 |
| Rabbit polyclonal anti-Cdc73 | GeneTex | Cat#GTX110280; RRID:AB_1949947 |
| Rabbit polyclonal anti-Stat2 | Santa Cruz Biotechnology | Cat#sc-476; RRID:AB_632437 |
| Rabbit polyclonal anti-Cdk9 | Santa Cruz Biotechnology | Cat#sc-8338; RRID:AB_2260303 |
| Goat polyclonal anti-CycT1 | Santa Cruz Biotechnology | Cat#sc-8127; RRID:AB_2073892 |
| Rabbit monoclonal anti-GAPDH (clone 14C10) | Cell Signalling | Cat#5014; RRID:AB_10693448 |
| Goat anti-rabbit HRP | Bio Rad | Cat#1706515; RRID:AB_2617112 |
| Goat anti-mouse HRP | Bio Rad | Cat#1721011; RRID:AB_2617113 |
| Rabbit anti-goat HRP | Bio Rad | Cat#1721034; RRID:AB_2617114 |
| Mouse monoclonal anti-E (clone 4G2) | Henchal et al., 1982 | N/A |
| Rabbit polyclonal anti-DENV NS2B | GeneTex | Cat#GTX124246; RRID:AB_11170698 |
| Mouse monoclonal anti-βactin | Sigma | Cat#A2228; RRID:AB_476697 |
| Donkey anti-rabbit HRP | GE Healthcare | Cat#NA934; RRID:AB_772206 |
| Sheep anti-mouse HRP | GE Healthcare | Cat#NA931; RRID:AB_772210 |
| Guinea pig polyclonal anti-Deadpan | Gift from Chris Doe, Jim Skeath | RRID:AB_2314299 |
| Rat monoclonal anti-Deadpan (clone 11D1CH11) | Abcam | Cat#ab195172 |
| Mouse monoclonal anti-Prospero (clone MR1A) | Developmental Studies Hybridoma Bank | Cat# Prospero (MR1A); RRID:AB_528440 |
| Rat monoclonal anti-Elav | Developmental Studies Hybridoma Bank | Cat# Rat-Elav-7E8A10 anti-elav; RRID:AB_528218) |
| Mouse monoclonal anti-Repo | Developmental Studies Hybridoma Bank | Cat# 8D12 anti-Repo; RRID:AB_528448 |
| Anti-guinea pig Cy3 | Jackson ImmunoResearch | Cat#106-165-003; RRID:AB_2337423 |
| Anti-mouse Alexafluor 647 | Jackson ImmunoResearch | Cat#115-605-166; RRID:AB_2338914 |
| Bacterial and Virus Strains | ||
| DENV2 16681 | Kinney et al., 1997 | N/A |
| DENV2 16681 Renilla luciferase | Samsa et al., 2009 | N/A |
| DENV2 New Guinea C Strain | Irie et al., 1989 | N/A |
| ZIKV PRVABC59 | Weger-Lucarelli et al., 2017 | N/A |
| ZIKV Mex2-81 | BEI Resources | NR-50280 |
| Chemicals, Peptides, and Recombinant Proteins | ||
| CT8 | Maifeld et al., 2011 | N/A |
| PS3061 | This paper | N/A |
| Deposited Data | ||
| PAF1C ChIP-seq raw and analyzed data | This paper | GEO: GSE110511 |
| RNA-seq raw and analyzed data | This paper | GEO: GSE110512 |
| RNA-seq raw and analyzed data | This paper | GEO: GSE118686 |
| RNA-seq raw and analyzed data | De Maio et al., 2015 | GEO: GSE84285 |
| Proteomics raw data | This paper | Chorum ID 1438 |
| Experimental Models: Cell Lines | ||
| Homo sapiens: HEK 293T | ATCC | CRL-3216 |
| Homo sapiens: Huh7 | Taguwa et al., 2015 | N/A |
| Homo sapiens: HeLa S3 | Yim et al, 1996 | N/A |
| Homo sapiens: U2OS | ATCC | HTB-96 |
| Homo sapiens: A549 | ATCC | CCL-185 |
| Cercopithecus aethiops: Vero | ATCC | CCL-81 |
| Mesocricetus auratus: BHK | Aguirre et al., 2017 | N/A |
| Aedes aegypti: Aag2 | Whitfield et al., 2017 | N/A |
| Aedes albopictus: C6/36 | Alvarez et al., 2005 | N/A |
| Experimental Models: Organisms/Strains | ||
| Drosophila melanogaster: P{Act5C-GAL4}17bFO1 | Bloomington Drosophila Stock Center | BDSC:3954; Flybase: FBti0012292 |
| Drosophila melanogaster: [1] w[1118]; P{w[+mC]=ey3.5-GAL4.Exel}3 | Bloomington Drosophila Stock Center | BDSC:8219; Flybase: FBti0040598 |
| Drosophila melanogaster: w[*]; P{w[+mW.hs]=GawB}insc[Mz1407] | Bloomington Drosophila Stock Center | BDSC:8751; Flybase: FBti0148948 |
| Drosophila melanogaster: w[*]; P{w[+mC]=wor.GAL4.A}2; | Bloomington Drosophila Stock Center | Modified from BDSC:56553; Flybase: FBti0161165 |
| Drosophila melanogaster: w y[1] w[*]; P{w[+m*]=nSyb-GAL4.S}3 | Bloomington Drosophila Stock Center | BDSC:51635; Flybase: FBti0150361 |
| Drosophila melanogaster: P{UAS-LUC.VALIUM1}attP2 | Bloomington Drosophila Stock Center | BDSC:35789; Flybase: FBti0143389 |
| Drosophila melanogaster: Ankle2A/FM7, Kr-GAL4, UAS-GFP | Yamamoto et al., 2014 | N/A |
| Drosophila melanogaster: P{UAS-hANKLE2}attPVK00037 | Yamamoto et al., 2014 | N/A |
| Drosophila melanogaster: P{UAS-hANKLE2 Q782X}attPVK00037 | Yamamoto et al., 2014 | N/A |
| Drosophila melanogaster: P{UAS-mCD8::GFP} | Bloomington Drosophila Stock Center | BDSC:5137; Flybase: FBti0012685 |
| Drosophila melanogaster: P{UAS-ZIKVugNS4A}attPVK00037 | This paper | N/A |
| Drosophila melanogaster: P{UAS-DENVugNS4A}attPVK00037 | This paper | N/A |
| Oligonucleotides | ||
| Primers for esiRNA synthesis, see Table S7 | This paper | N/A |
| siRNA sequences for PAF1C knockdown, see Table S7 | This paper | N/A |
| Primers for qPCR analysis, see Table S7 | This paper | N/A |
| Recombinant DNA | ||
| Protein and DNA sequences of viral coding sequences, see Table S1 | This paper | N/A |
| Software and Algorithms | ||
| MiST | Jager et al., 2011a | https://github.com/kroganlab/mist |
| compPASS | Sowa et al., 2009 | http://bioplex.hms.harvard.edu/downloadComppass.php |
| MaxQuant | Cox and Mann, 2008 | http://www.coxdocs.org/doku.php?id=:maxquant:start |
| Protein Prospector | UCSF | http://prospector.ucsf.edu/prospector/mshome.htm |
| Skyline | MacLean et al., 2010 | https://skyline.ms/project/home/software/Skyline/begin.view? |
| MSstats | Choi et al., 2014 | http://msstats.org |
| Bowtie | Langmead et al., 2009 | http://bowtie-bio.sourceforge.net/index.shtml |
| Bedtool | Quinlan and Hall, 2010 | http://bedtools.readthedocs.io/en/latest/ |
| MACS2 | Zhang et al., 2008 | https://github.com/taoliu/MACS |
| Tophat2 | Kim et al., 2013a | https://ccb.jhu.edu/software/tophat/index.shtml |
| Cuffdiff 2 | Trapnell et al., 2013 | http://cole-trapnell-lab.github.io/cufflinks/cuffdiff/ |
| NGSplot | Shen et al., 2014 | https://github.com/shenlab-sinai/ngsplot |
| GOstats | Falcon and Gentleman, 2007 | https://www.bioconductor.org/packages/release/bioc/html/GOstats.html |
| InParanoid | Sonnhammer and Ostlund, 2015 | http://inparanoid.sbc.su.se/cgi-bin/index.cgi |
Viruses
DENV serotype 2 16681 (Kinney et al., 1997), DENV serotype 2 New Guinea C strain (DENV NGC), ZIKV Puerto Rico 2015 PRVABC59 (Weger-Lucarelli et al., 2017) (ZIKV PR) and ZIKV Mexico 2016 Mex2-81 (BEI Resources, NIAID, NIH) (ZIKV Mex) were used in this study. All viruses were grown in C6/36 cells. All viruses used are documented in the Key Resources Table.
Drosophila melanogaster
All Drosophila melanogaster strains were raised at room temperature (22°0) on standard cornmeal and molasses medium in plastic vials. Experimental crosses were set at 29°C with a 12 hour light/dark cycle except for experiments using the Ankle2A/+ background, which were conducted at 25°C with a 12 hour light/dark cycle. Adult female driver lines were crossed to adult male UAS transgenic lines. Late 3rd instar (gut clearance, extruding spiracles) larval brains of males and females (except Ankle2A heterozygotes, which were female only and Ankle2A hemizygotes, which were male only) were used in brain studies.
METHODS DETAILS
Plasmids
DENV serotype 2 16681, ZIKV French Polynesia 2013 H/FP/2013 (ZIKVfp), and ZIKV Uganda 1947 MR766 (ZIKVug) open reading frames (ORFs) were cloned into pCDNA4_TO with a C-terminal 2xStrep II affinity tag for expression in human cells. DENV ORFs were also cloned into pAc with a C-terminal 2xStrep II affinity tag for expression in mosquito cells. DENV and ZIKV NS4A ORFs were also cloned into a pUAS-attP plasmid for expression in Drosophila melanogaster. Codon optimization for human, Aedes aegypti, or Drosophila melanogaster codon usage was employed to improve expression of poorly expressing viral ORFs. Protein and DNA sequences are provided in Table S1.
Antibodies
Mouse anti-Strep tag antibody 34850 (Qiagen) was used for Western blot and immunofluorescence analysis. Immunofluorescence of organelle markers were done using rabbit anti-Calnexin 2679 (Cell Signaling), rabbit anti-GRASP65 (gift from Sima Lev) (Peretti et al., 2008) and rabbit anti-TOMM20 sc-11415 (Santa Cruz Biotechnology), and rabbit anti-TIP47 (Abcam). Secondary AlexaFluor anti-mouse 488 and anti-rabbit 555 (Invitrogen) were used for detection. Western blot analysis of PAF1C components and controls were done using rabbit anti-PAF1 A300-173A (Bethyl Laboratories), rabbit anti-LEO1 A300-175A (Bethyl Laboratories), rabbit anti-CTR9 A301-395A (Bethyl Laboratories), rabbit anti-CDC73 GTX110280 (GeneTex), rabbit anti-STAT2 sc-476 (Santa Cruz Biotechnology), rabbit anti-CDK9 sc-8338 (Santa Cruz Biotechnology), goat anti-CYCT1 sc-8127 (Santa Cruz Biotechnology), mouse anti-Strep 34850 (Qiagen) and rabbit anti-Gapdh 14C10 (Cell Signaling). Secondary HRP-conjugated goat antimouse and goat anti-rabbit antibodies were used for detection (BioRad). Immunofluorescence of DENV or ZIKV-infected cells was detected by 4G2 monoclonal antibody against flavivirus glycoproteins (gift from Michael Diamond) (Henchal et al., 1982). Fluorescent secondary antibodies were from Life Technologies. Chromatin immunoprecipitation of LEO1 was done using rabbit anti-LEO1 A300-175A (Bethyl Laboratories). Western blot analysis of NS2B was performed using rabbit anti-DENV-NS2B GTX 124246 (GeneTex) and mouse anti-β actin A2228 (Sigma). Secondary HRP-conjugated donkey anti-rabbit NA934 (GE Healthcare) and sheep anti-mouse NA931 (GE Healthcare) were used for detection. Ankle2 assays were conducted using primary antibodies including guinea pig anti-Deadpan (gift from Chris Doe, originally Jim Skeath), mouse anti-Prospero MR1A (Developmental Studies Hybridoma Bank), and mouse anti-Strep (Qiagen) with goat secondary antibodies (Jackson Laboratories). All antibodies used are documented in the Key Resources Table.
Generation of flavivirus-host PPI data
Expression and purification of viral proteins
Viral proteins were expressed in human HEK 293T cells using Polyjet (SignaGen) or in Aag2 cells using TransIT-2020 (Mirus Bio) according to manufacturer instructions. Viral proteins were purified approximately 40 hours post transfection. Cells were washed with D-PBS and lysed in IP Buffer (50 mM Tris-HCl pH 7.4, 150 mM NaCl, 1 mM EDTA) supplemented with 0.5% Nonidet P 40 Substitute (NP40; Fluka Analytical) and complete mini EDTA-free protease and PhosSTOP phosphatase inhibitor cocktails (Roche) and incubated on a tube rotator for 30 minutes. After centrifugation at 3,500 ×g for 20 minutes to pellet debris and rotated with Strep-tactin Sepharose beads (IBA Lifesciences) diluted in IP Buffer and incubated for 2 hours. Strep-tactin beads were washed three times with 1 mL IP Buffer supplemented with 0.05% NP40 and transferred to a new tube with a final wash in 1 mL IP Buffer. All incubation and wash steps were performed at 4°C. Proteins were eluted in 40 μL 2.5 mM D-Desthiobiotin (IBA Lifesciences) in IP Buffer by agitating Strep-tactin beads at room temperature for 30 minutes using a vortex mixer. Lysates and 10% of each eluate were resolved on 4-20% Criterion protein gels (BioRad) to assess Strep-tagged protein expression and affinity purification by Western blot and silver stain (Thermo Fisher), respectively, before submitting 10 βL eluate for mass spectrometry (Figure S1). At least three independent biological replicates were performed for each Strep-tagged viral protein.
Localization of viral proteins
Each DENV-human construct was subjected to immunofluorescence and confocal microscopy to confirm subcellular localization. HeLa S3 cells were grown on coverslips in 24-well plate and transfected with 1 βg of plasmid using Lipofectamine 2000 (Thermo Fisher) according to manufacturer recommendations. One day post-transfection, cells were fixed with 4% paraformaldehyde in PBS for 15 minutes at room temperature, and quenched with 0.1 M glycine in PBS for 15 minutes. Cells were permeabilized with 0.1% Triton-X100 in PBS for 15 minutes at room temperature (mitochondria, Golgi and ER markers) or with 0.01% digitonin in PBS for 30 minutes (lipid droplet markers). Permeabilized cells were blocked with goat serum in PBS for 30 minutes at room temperature. Coverslips were incubated for 1 hour at room temperature with primary antibodies diluted in blocking solution as follows: mouse anti-Strep II (1:1500), rabbit anti-Calnexin (1:50), rabbit anti-GRASP65 (1:800) and rabbit anti-TOMM20 (1:100), rabbit anti-TIP47, (1:1000). Coverslips were extensively washed with PBS, incubated for 1 hour with secondary antibodies diluted in blocking solution and washed with PBS. For staining of lipid droplets, coverslips were incubated with 1 μg/ml Bodipy 493/503 diluted in PBS for 15 minutes and extensively washed with PBS. Finally, coverslips were incubated for 5 minutes with 10 μg/ml of Hoechst 33342 diluted in PBS, washed with PBS and mounted on slides with Prolong Gold antifade mounting solution (ThermoFisher Scientific). Confocal images were obtained with spinning disk confocal microscope (Nikon Ti-E microscope equipped with Yokagawa CSU-22) using 100×/1.4 oil immersion objective. AlexaFluor 488, AlexaFluor 555 and Hoechst 33342 were excited using a 488 nm, 561 nm and 405 nm lasers, respectively.
Mass spectrometry for global proteomics
Purified protein eluates were digested with trypsin for LC-MS/MS analysis. Samples were denatured and reduced in 2M urea, 10 mM NH4HCO3, 2 mM DTT for 30 min at 60C, then alkylated with 2 mM iodoacetamide for 45 min at room temperature. Trypsin (Promega) was added at a 1:100 enzyme:substrate ratio and digested overnight at 37 °C. Following digestion, samples were concentrated using C18 ZipTips (Millipore) according to the manufacturer’s specifications.
For DENV samples, digested peptide mixtures were analyzed by LC-MS/MS on a Thermo Scientific Velos Pro dual linear ion trap mass spectrometry system equipped with a Proxeon Easy nLC II high pressure liquid chromatography and autosampler system. Samples were injected onto a pre-column (2 cm × 100 μm I.D. packed with ReproSil Pur C18 AQ 5 βm particles) in 0.1% formic acid and then separated with a one-hour gradient from 5% to 30% acetonitrile (ACN) in 0.1% formic acid on an analytical column (10 cm × 75 βm I.D. packed with ReproSil Pur C18 AQ 3 mm particles). The mass spectrometer collected data in a data-dependent fashion, collecting one full scan followed by 20 collision-induced dissociation MS/MS scans of the 20 most intense peaks from the full scan. Dynamic exclusion was enabled for 30 seconds with a repeat count of 1. The resulting raw data was matched to protein sequences by the Protein Prospector algorithm. Data were searched against a database containing either SwissProt Human protein sequences or Uniprot Aedes aegypti protein sequence, combined with DENV sequences, concatenated to a decoy database where each sequence was randomized to estimate the FPR. The searches considered a precursor mass tolerance of 1 Da and fragment ion tolerances of 0.8 da, and considered variable modifications for protein N-terminal acetylation, protein N-terminal acetylation and oxidation, glutamine to pyroglutamate conversion for peptide N-terminal glutamine residues, protein N-terminal methionine loss, protein N-terminal acetylation and methionine loss, and methionine oxidation, and constant modification for carbamidomethyl cysteine. Prospector data was filtered using a maximum protein expectation value of 0.01 and a maximum peptide expectation value of 0.05.
For ZIKV samples, peptides were resuspended in 15 μL of 4% formic acid and 3% ACN, and 1-2 μL of sample was loaded onto a 75 μm ID column packed with 25 cm of Reprosil C18 1.9 μm, 120Å particles (Dr. Maisch). Peptides were eluted into a Q-Exactive Plus (Thermo Fisher) mass spectrometer by gradient elution delivered by an Easy1200 nLC system (Thermo Fisher). The gradient was from 4.5% to 32% acetonitrile over 53 minutes. All MS spectra were collected with oribitrap detection, while the 20 most abundant ions were fragmented by HCD and detected in the orbitrap. All data was searched against the SwissProt Human protein sequences, combined with ZIKV sequences. Peptide and protein identification searches, as well as label-free quantitation were performed using the MaxQuant data analysis algorithm, and all peptide and protein identifications were filtered to a 1% false-discovery rate (Cox and Mann, 2008).
Generation of targeted proteomics assays
Digested peptide mixtures were analyzed by LC-MS/MS on a Thermo Scientific Orbitrap Fusion mass spectrometry system equipped with a Proxeon Easy nLC 1200 ultra high-pressure liquid chromatography and autosampler system. Samples were injected onto a C18 column (25 cm × 75 μm I.D. packed with ReproSil Pur C18 AQ 1.9 μm particles) in 0.1% formic acid and then separated with a 80 min gradient from 5% to 40% Buffer B (90% ACN/10% water/0.1% formic acid) at a flow rate of 300 nL/min. The mass spectrometer collected data in a data-dependent fashion, collecting one full scan in the Orbitrap followed by collision-induced dissociation MS/MS scans in the dual linear ion trap for the 20 most intense peaks from the full scan. Dynamic exclusion was enabled for 30 seconds with a repeat count of 1. Charge state screening was employed to reject analysis of singly charged species or species for which a charge could not be assigned. The raw data was matched to protein sequences by the MaxQuant algorithm (version 1.5.2.8) (Cox and Mann, 2008). Data were searched against a database containing SwissProt Human sequences (downloaded 09/2017) as well as Zika and dengue protein sequences, concatenated to a decoy database where each sequence was randomized to estimate the FDR. Variable modifications were allowed for methionine oxidation and protein N-terminus acetylation. A fixed modification was indicated for cysteine carbamidomethylation. Full trypsin specificity was required. The first search was performed with a mass accuracy of +/− 20 parts per million and the main search was performed with a mass accuracy of +/− 4.5 parts per million. A maximum of 5 modifications were allowed per peptide. A maximum of 2 missed cleavages were allowed. The maximum charge allowed was 7+. Individual peptide mass tolerances were allowed. For MS/MS matching, a mass tolerance of 0.8 Da was allowed and the top 8 peaks per 100 Da were analyzed. MS/MS matching was allowed for higher charge states, water and ammonia loss events. The data were filtered to obtain a peptide, protein, and site-level FDR of 0.01. The minimum peptide length was 7 amino acids. SRM assays were generated for selected interactors of ZIKV and DENV NS4A. SRM assay generation was performed using Skyline (MacLean et al., 2010). For all targeted proteins, proteotypic peptides and optimal transitions for identification and quantification were selected based on a spectral library generated from the shotgun MS experiments. The Skyline spectral library was used to extract optimal coordinates for the SRM assays, e.g. peptide fragments and peptide retention times. For each protein 1-25 peptides were selected based on intensity, peptide length as well as chromatographic performance. For each peptide the five best SRM transitions were selected based on intensity and peak shape.
Targeted mass spectrometry
Digested peptide mixtures were analyzed by LC-SRM on a Thermo Scientific TSQ Quantiva MS system equipped with a Proxeon Easy nLC 1200 ultra high-pressure liquid chromatography and autosampler system. Samples were injected onto a C18 column (25 cm × 75 μm I.D. packed with ReproSil Pur C18 AQ 1.9 μm particles) in 0.1% formic acid and then separated with a 80 min gradient from 5% to 40% Buffer B (90% ACN/10% water/0.1% formic acid) at a flow rate of 300 nl/min. SRM acquisition was performed operating Q1 and Q3 at 0.7 unit mass resolution. For each peptide the best five transitions were monitored in a scheduled fashion with a retention time window of 5 min and a cycle time fixed to 2 sec. Argon was used as the collision gas at a nominal pressure of 1.5mTorr. Collision energies were calculated by, CE = 0.0348 * (m/z) + 0.4551 and CE = 0.0271 * (m/z) + 1.5910 (CE, collision energy and m/z, mass to charge ratio) for doubly and triply charged precursor ions, respectively. SRM data was processed using Skyline (MacLean et al., 2010). Protein significance analysis was performed using MSstats (Choi et al., 2014). GFP was overexpressed and purified as a negative control. For each viral protein purification, Sec61, SRPR or ANKLE2 peptides were normalized to the amount detected in a GFP pulldown:
RNAi screening of DENV-human PPI candidates
Endonuclease-derived siRNAs (esiRNAs) targeting DENV-interacting human genes were synthesized in vitro. Target regions of 200-500 nt in length were amplified from Huh7 cDNA and then in vitro transcribed using T7 polymerase. Target regions of genes and primer sequences used to synthesize esiRNAs are listed in Table S7. esiRNAs were reverse transfected into Huh7 cells in 96-well format using DharmaFECT4 (Thermo Fisher) with a total of 25 ng esiRNA and 0.2 μL DharmaFECT4 per well. Three days post-transfection, cells were infected with 10 μL DENV serotype 2 16681 Renilla luciferase reporter virus (Samsa et al., 2009) in 100 μL total volume. Knockdown was confirmed for 37 genes by RT-qPCR using the SensiFAST SYBR One Step kit (Bioline) following RNA isolation using the CellAmp Direct RNA Prep kit (Takara). PCR primers are listed in Table S7. Two days post-infection, luciferase activity was recorded using the Renilla luciferase assay system (Promega) and the Veritas luminometer according to manufacturer protocols. Total cell count was determined using a paired, uninfected sample that was stained with 10 μg/ml of Hoechst 33342 in PBS for 10 minutes. Hoechst 33342-positive nuclei were imaged and quantified on the Cell Insight (Thermo Fisher). Reporter activity was normalized by cell count and compared to controls targeting GFP and Firefly luciferase distributed randomly in 12 wells on each of the 96-well plates. The distribution of the average value over four independent replicates for each knockdown was used to calculate Z-scores.
Toxicity of siRNA knockdown was measured in the absence of infection by Cell Titer Glo (Promega) according to manufacturer instructions. The distribution of the average value over four independent replicates for each knockdown was used to calculate Z-scores. Any genes that resulted in a toxicity Z-score < −1 were excluded from the benchmark MiST training set (see MiST training and proteomic scoring below).
MiST training and scoring of AP-MS data
Proteomic data was scored with the MiST scoring algorithm using spectral counts as the quantifying feature. Clustering of raw MS data, peptide counts per sample and proteins identified per sample were basic quality control metrics used to identify any samples or baits consistently providing poor quality data. Specifically, samples with low spectral counts and protein identification, and/or poor clustering of raw data were not considered for further analysis. A list of known gold standard interactions derived from literature and the RNAi screen was used to train the MiST algorithm by selecting the optimal weights of reproducibility (R), bait specificity (S), and abundance (A) for the dataset. In addition to candidates from the RNAi screen, curated interactions based on targeted studies were included for those which had multiple published articles supporting the interaction The interactions that surpassed this threshold were the NS5-STAT2 and NS1-C4A interactions (Table S2). Since little overlap was observed for published systems-level protein interaction datasets, these were not used as part of the gold standard set. The outputs of this optimization process include receiver operating characteristic (ROC) curves, precision recall curve, area under ROC curves (AUC, and F1-score, which are then used to select the best MiST weights for the dataset based on the recovery rate of gold standard interactions in the dataset. The three MiST weights for reproducibility (R), specificity (S), and abundance (A) were systematically varied to identify a weight set that captured the most benchmark interactions while controlling the false positive rate (FPR) to be less than 5%. The top 10 MiST weight sets and corresponding MiST thresholds giving the maximum AUC with a FPR below 5% were analyzed in detail (Table S2), and the median value of each parameter was used for MiST scoring. The resulting allotment of weights for each of the three variables with this system is R=0.35, S=0.57, and A=0.08. Interactions with a score greater than 0.67 were considered high confidence and kept for downstream analysis.
The DENV networks were also scored with the complementary CompPASS scoring algorithm (Sowa et al., 2009). Only the top five percent of interactions per bait were considered for the confident set using this algorithm. This list of interactions was then compared with the list generated from the MiST results, and the intersecting interactions were used as our final high confidence network. While more conservative, this process is designed to maximize the number of true interactions found while attempting to minimize the number of false positives, and presents a highly confident list of true interactions. DENV-mosquito data was scored identically to the DENV-human data.
The ZIKV data was scored with the MiST scoring algorithm similarly, and using the weights trained on the DENV-human data. The two different strains of the virus were scored together, and the interactions scoring in the top 5% were kept. This resulted in the ZIKVfp and ZIKVug data having a threshold MiST score greater than or equal to 0.72 and 0.69 respectively. The final MiST scored interaction results were further restricted to only interactions that had a spectral count equal or greater than two for at least one replicate. This was to further bolster our confidence in the interaction. After the data was scored, only interactions that fulfilled this spectral count criterion were kept. In addition to using the basic MS quality control metrics described above, ZIKV data analysis was further restricted to baits in which the overlap between ZIKVfp and ZIKVug strains was non-zero. Given the high level of sequence identity between the two strains, we hypothesized that there should be high levels of overlap in the PPI networks. Baits not behaving in this manner were determined to be not of high quality in terms of the AP-MS data.
Enrichment analysis of AP-MS datasets
Enrichment analysis was performed on the list of high confidence PPIs to determine if the data set was enriched for specific terms. Terms from GO (Cellular Components, Molecular Function, Biological Processes), PFAM, KEGG, and CORUM were considered. The level of significance for the enrichment was calculated by a hypergeometric test for each term using all proteins detected in the AP-MS data as the list of total possible proteins (Falcon and Gentleman, 2007). The p values were corrected for multiple comparisons using the Benjamini and Hochberg method to control the false discovery rate (FDR).
For the DENV-mosquito data, Aedes aegypti Uniprot Accession numbers were converted to Drosophila melanogaster Uniprot Accession numbers using the InParanoid ortholog database (Sonnhammer and Ostlund, 2015). For genes without a direct ortholog in the InParanoid database, a best BLASTP strategy was used to identify a possible Drosophila ortholog. Enrichment analysis was done using Drosophila identifiers.
Interolog mapping of mosquito proteins
DENV-mosquito proteomic data was directly compared to dengue-human proteomic data by mapping mosquito-human orthologs using the InParanoid ortholog database (Sonnhammer and Ostlund, 2015) as described above. For genes not included in the InParanoid database, a best BLASTP strategy was used to identify a possible human ortholog. Genes were considered interologs if the ortholog was a high confidence proteomic hit for same the DENV bait in the DENV-human and DENV-mosquito AP-MS datasets.
PAF1C studies
NS5-PAF1C purification and Western blot
C-terminally Strep II-tagged flavivirus NS5 constructs were expressed in HEK 293T and affinity purified as described for viral proteins in Expression and affinity purification of viral proteins. Inputs and eluates were then subjected to Western blotting. Following electrophoresis, proteins were transferred to PVDF (BioRad) with 20% methanol transfer buffer. Membrane was incubated with primary antibodies at 1:1000 overnight at 4°C. Secondary HRP (BioRad) incubation occurred 1:10000 dilution for one hour at room temperature. Signal was detected using Pierce ECL Western Blotting Substrate (Thermo Fisher).
PAF1C depletion and infection
For siRNA knockdown studies, U2OS cells were seeded at 5000 cells/well in 50 μL media per well in 384-well for siRNA knockdown. siRNAs (Sigma) (Table S7) were transfected with HiPerFect (Qiagen) according to manufacturer recommendations at a final siRNA concentration of 20 nM. Cells were infected two or three days after knockdown, at 16000 cells/well. Knockdown was confirmed by Western blot as described above. DENV NGC and ZIKV Mex infections were at MOIs of 0.06 and 0.5, respectively. Infectivity was measured 24 hours post infection by immunostaining and microscopy. Cells were fixed with 4% formaldehyde for 10 minutes, permeabilized with 0.1% Triton X-100 for 15 minutes, washed three times with PBS and blocked with 2% BSA in PBS-T. Cells were stained with mouse anti-4G2 antibody (1:4000) and fluorescent secondary (1:10000), each for one hour at room temperature. The cells were imaged at 10× magnification using an automated imaging platform (ImageXpress Micro, Molecular Devices) with four sites per well. Four fields were imaged for each well, and four wells were analyzed for each condition for each replicate. The number of cells and the number of infected cells were measured using MetaXpress software, and the percentage of infected cells was calculated. The data reflect the results of four independent experiments. P values were calculated using a paired, single-tailed student’s t-test.
PAF1C ChIP-seq and RNA-seq
Huh7 cells stably expressing DENV2 NS5 or GFP were created by electroporation of linearized pCDNA4_TO plasmid and selection with 2 mg/mL Zeocin. Cells were stimulated with 31.25 U/mL IFNβ (Avonex) for 18 hours prior to ChIP. Cells were crosslinked with 1% formaldehyde for five minutes, quenched with 125 mM glycine for five minutes. Cells were scraped, washed two times with cold PBS, and lysed in Cell Lysis Buffer (5mM HEPES-KOH pH 7.9, 85 mM KCl, 0.5% IGEPAL CA-630, 0.5 mM phenylmethane sulfonyl fluoride and cOmplete Protease Inhibitor Cocktail (Roche)). Nuclei were pelleted at 600 g for 10 minutes and lysed with Nuclei Lysis Buffer (50 mM Tris-HCl pH 8.0, 150 mM NaCl, 1mM EDTA, 1% Triton X-100, 0.1% sodium deoxycholate, 0.1% SDS, 0.5 mM phenylmethane sulfonyl fluoride and cOmplete Protease Inhibitor Cocktail (Roche)). Chromatin shearing by water bath sonication (Diagenode Bioruptor) was optimized to produce ~200-300 nucleotide fragments, and protein concentration was quantified by Bradford Assay (Thermo Fisher). Chromatin was immunoprecipitated overnight at 4C using 500μg chromatin and 5μg of anti-LEO1 antibody. To purify antibody-bound chromatin, 50μL of Protein A Dynabeads (Thermo Fisher) were added and incubated at 4C for one hour. Dynabead-bound ChIP samples were washed two times with ChIP Dilution Buffer (50mM Tris-HCl pH 8.0, 150 mM NaCl, 1 mM EDTA and 1% Triton X-100), two times with ChIP High Salt Dilution Buffer (50 mM Tris-HCl pH 8.0, 500 mM NaCl, 1 mM EDTA and 1% Triton X-100), and one time with LiCl Wash Buffer (50 mM Tris-HCl pH 8.0, 250 mM LiCl, 0.5% IGEPAL CA-630 and 0.5% sodium deoxycholate) for five minutes each before being eluted. Samples were reverse crosslinked at 65°C overnight and treated with RNAse A (Fermentas) and Proteinase K (Fermentas). DNA was purified by phenol-chloroform extraction and ethanol precipitation. Library preparation for next generation sequencing was done using NextFLEX ChIP-seq Library Preparation Kit (BioO Scientific) according to manufacturer recommendations. Input and ChIP samples were sequenced on the Illumina HiSeq 4000. Resulting sequence data were Q33 quality filtered, collapsed for duplicate reads and aligned using Bowtie (Langmead et al., 2009) with options set to disregard reads that map to multiple locations. Following alignment, ChIP peaks were called using MACS2 (Zhang et al., 2008) and default parameters, and merged using BEDTools (Quinlan and Hall, 2010).
ISGs were identified using the interferome.org database (Rusinova et al., 2013). DENV-induced ISGs were identified from this larger list of ISGs using RNA-seq data from DENV-infected Huh7 (MOI 3.0) and A549 cells (De Maio et al., 2016) at 18 hours post infection. Library preparation was performed using Stranded RNA-seq Kit with polyA enrichment (KAPA). ISGs significantly increased in expression following DENV infection were identified by Tophat2 (Kim et al., 2013) and Cuffdiff 2 (Trapnell et al., 2013) analysis. The list was further curated to only include genes for which LEO1 occupancy increased by 10% or more after IFNβ treatment in GFP-expressing cells. Occupancy profiles were plotted using NGSplot (Shen et al., 2014). ChIP-seq data reflects the results of three independent experiments. P values were calculated using two-tailed Mann-Whitney U-test.
For gene expression analysis, A549 cells were transfected with GFP- or NS5-expressing plasmid using Polyjet (Signagen) according to manufacturer instructions. After 30 hours, cells were stimulated with polyIC (Tocris) using Lipofectamine 2000 (Thermo Fisher) at a polyIC:Lipofectamine 2000 ratio of 2 μg:1 μL. The final concentration of polyIC was 3 βg/mL. At 12 hours post-stimulation, total cellular RNA was purified by RNeasy column (Qiagen). cDNA was synthesized using SuperScript IV VILO Master Mix with ezDNase Enzyme (ThermoFisher). For Ion Torrent S5 sequencing, libraries were generated with the Ion Ampliseq Transcriptome Human Gene Expression Chef-Ready Kit (Life Technologies) according to the recommended protocol, using 10 ng of starting cDNA across all samples. This panel allows for gene expression measurement of over 20,000 RefSeq genes. The resulting libraries were templated onto Ion 540 Chips using the Ion Chef system and sequenced on the Ion GeneStudio S5 System. Raw data was processed with the Ion Torrent Suite Server v5.8.0 (ThermoFisher). Reads were aligned reads to the hg19 AmpliSeq Transcriptome reference (v1.1) with the coverageAnalysis plugin v5.8.0.8. This plugin also generated quality information. Reads were quantified using the ampliSeqRNA plugin v5.8.0.3 with default settings. Genes with less than ten reads in more than 75% of the samples were removed. Genes were tested for differential expression using DESeq2 v1.18.1 (Love et al., 2014) with shrinkage estimator apeglm v1.0.3 (Zhu et al., 2018) (Table S6). Gene Ontology category GO:0006955 was used to classify immune response genes.
SEC61 translocon studies
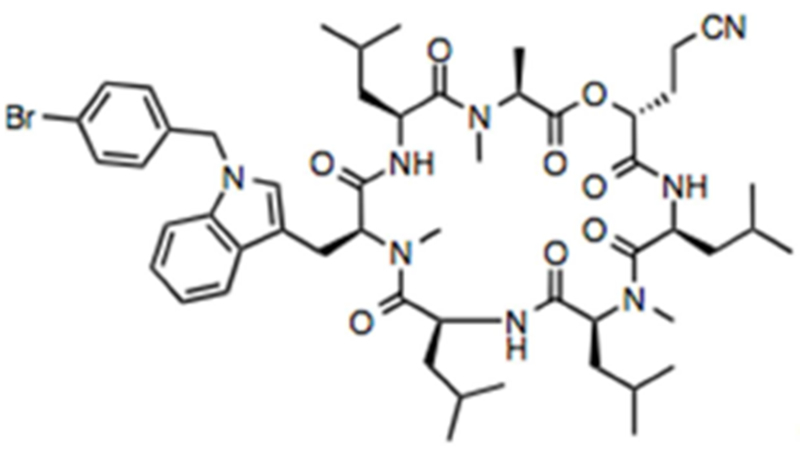
PS3061 synthesis
PS3061 was synthesized by adapting a published solid-phase synthesis of cotransin (Coin et al., 2008) in which (R)-2-hydroxy-4-cyanobutanoic acid and N1-(4-bromobenzyl)-Nα-methyl-L-tryptophan were used instead of D-lactic acid and Nα-methyl-L-phenylalanine, respectively. 1H-NMR (400 MHz; acetone-d6): δ 8.73 (d, J = 10.0 Hz, 1H), 8.02 (d, J = 9.7 Hz, 1H), 7.74 (d, J = 7.6 Hz, 1H), 7.61 (d, J = 6.9 Hz, 1H), 7.50-7.47 (m, 2H), 7.44 (d, J = 8.1 Hz, 1H), 7.27 (s, 1H), 7.20 (t, J = 9.7 Hz, 2H), 7.18-7.09 (m, 2H), 5.39 (s, 2H), 5.11-5.01 (m, 3H), 4.89-4.83 (m, 1H), 4.41-4.33 (m, 2H), 3.30-3.21 (m, 5H), 2.91 (s, 3H), 2.54 (s, 3H), 2.50 (t, J = 6.3 Hz, 2H), 2.22-2.15 (m, 1H), 1.98-1.90 (m, 1H), 1.83-1.71 (m, 3H), 1.64-1.44 (m, 12H), 1.39-1.29 (m, 3H), 1.05 (d, J = 6.3 Hz, 3H), 0.94 (dt, J = 21.9, 7.8 Hz, 19H), 0.36 (d, J = 6.4 Hz, 3H), 0.00 (d, J = 6.6 Hz, 3H), −0.48--0.55 (m, 1H). LCMS (ESI): calculated for C53H76BrN8O8 [M+H]+, 1031.5; Found, 1031.2. 1H NMR and mass spectrometry data are consistent with the proposed structure:
Pharmacological modulation of SEC61
To assess the impact of cotransins on flavivirus replication, Huh7 cells were incubated with DMSO, 500 nM CT8 or PS3061. C6/36 cells were incubated with DMSO, 1000 nM CT8 or PS3061. Huh7 cells were infected with DENV and ZIKV PR at a MOI of 0.1. C6/36 cells were infected with DENV or ZIKV PR at a MOI of 0.001. 72 hours post infection, supernatants were collected and cells lysed in RNA Lysis Buffer (Zymo Research) and stored at −80°C.
To assess the impact of CT8 on DENV protein production, HEK 293T cells were incubated with DMSO or 500 nM CT8 prior to infection with DENV at a MOI of 1. An untreated and uninfected mock sample was included as a control for unspecific protein. Cell lysates were collected in RIPA buffer (Thermo), supplemented with protease inhibitor (Roche), at 6, 12, and 24 hours post infection.
For cotransin time of addition experiments, HEK 293T cells were infected with DENV at a MOI of 1 and cell lysates were collected 24 hours post infection in RIPA buffer (Thermo Fisher). HEK 293T cells were incubated 4 hours before, at the time of, and 4 hours and 12 hours after the infection with 500 nM CT8. An untreated and uninfected mock sample was included as a control for unspecific protein and the positive control was infected but untreated.
Cytotoxicity was measured with the CytoTox 96 Non-Radioactive Cytotoxicity Assay (Promega) per manufacturer’s instructions. C6/36, Huh7, and 293T cells lysate was used as positive controls for the assay, respectively. Percent cell viability =1-(Experimental LDH Release/Maximum LDH Release) × 100. Experiments were done in three biological replicates.
Plaque assay analysis of virion production
The titers of supernatants were determined by limiting-dilution plaque assay on BHK cells. Cells were seeded in 12-well plates (at 1 χ 105 cells/well) overnight. The following day, the medium was removed and serial dilutions of virus supernatants in MEM α, GlutaMAX (Thermo Fisher) were added to the wells (150 μL virus inoculum/well). The cells were then incubated at 33°0 and 5% CO2 for 2 hours. Following this incubation, an overlay consisting of 2% low-melting-point SeaPlaque Agarose (Lonza) in distilled H2O (Thermo Fisher), 5% FBS, and 45% 2X MEM (Thermo Fisher) was added at 1.5 mL per well, and the plates were incubated at 33°C with 5% CO2 for 7 days. After removing the overlay, the plaques were visualized and counted with 1% crystal violet (Fisher) in 30% ethanol (v/v H2O) solution.
RT-qPCR analysis of viral replication
Total RNA was extracted using Quick RNA™ MiniPrep (Zymo Research). 500 ng RNA were reverse transcribed using the iScript cDNA synthesis kit (Bio-Rad) according to manufacturer recommendations. Evaluation of the expression of viral RNA was carried out using iQ SYBR green Supermix (Bio-Rad) according to manufacturer recommendations. Expression levels for viral RNA in C6/36 cells and Huh7 cells were calculated based on the mean Ct values from three technical replicates using 18S and RPS11 housekeeping genes, respectively, to normalize the data. Experiments were done in three biological replicates. Primer sequences are listed in Table S7.
Western analysis of DENV protein production
Sample lysates were collected and protein concentrations were measured by Bradford assay before loading. Following electrophoresis, proteins were transferred to 0.2 μm nitrocellulose membranes (BioRad). Membrane was incubated overnight at 4°C with primary antibodies diluted to 1:1000 and 1:5000 for DENV NS2B and β-Actin, respectively. Secondary HRP (GE) incubation occurred at 1:10000 dilution for one hour at room temperature. Luminescent signal were detected by FluorChem E system (ProteinSimple) using SuperSignal West Pico PLUS Chemiluminiscent Substrate and West Femto Maximum Sensitivity Substrate (Thermo Fisher Cat#: 34580 and Cat#: 34096).
ANKLE2 studies
Creation of transgenic Drosophila stocks
C-terminal Strep II-tagged ZIKV constructs (Table S1) were cloned into pUASt-attB (Bischof et al., 2007) and inserted into the VK37 landing site (Venken et al., 2006). Actin-GAL4 (P{Act5C-GAL4}17bFO1), inscuteable-GAL4 (P{w[+mW.hs]=GawB}insc[Mz1407]), worniu-GAL4 (P{w[+mC]=wor.GAL4.A}2), or neuronal Synaptobrevin-GAL4 (P{w[+m*]=nSyb-GAL4.S}3) were used to ubiquitously express ZIKV proteins at 29°C. UAS-CD8GFP (P{UAS-mCD8::GFP}) and UAS-luciferase (P{UAS-LUC.VALIUM1}attP2) were used as controls..
Immunostaining of Drosophila brains
Brains were dissected in PBS and fixed with 4% PFA/PBS/0.3%Triton for 20 minutes and blocked in PBS/0.3%Triton/1%BSA/5% normal goat serum and incubated in primary antibody in PBS/0.3%Triton/1%BSA overnight. Primary antibodies include guinea pig anti-Deadpan (gift from Chris Doe, originally from Jim Skeath, 1:1000), rat anti-Deadpan (Abcam ab195172, 1:250 or 1:500), mouse anti-Prospero MR1A (Developmental Studies Hybridoma Bank, 1:1000), rat anti-Elav 7E8A10 (Developmental Studies Hybridoma Bank, 1:250) and mouse anti-Repo 8D12 (Developmental Studies Hybridoma Bank, 1:250) and mouse anti-Strep (Qiagen, 1:500) with goat secondary antibodies from Jackson Laboratories used 1:500. Brains were mounted with tape spacers and imaged using a Leica Sp8 with 2 βm sections through the entire brain lobe. Resulting stacks were analyzed using the Surfaces function in Imaris (Bitplane) to quantify brain lobe volume. One lobe from each brain was analyzed.
TUNEL analysis of Drosophila brains
TUNEL was performed using the FragEL DNA Fragmentation Detection Kit (Calbiochem) and analyzed in Imaris with the Spots function. Cell cycle analysis was performed using Click-IT EdU Alexa Fluor 594 or 647 Imaging Kit (Invitrogen). 3rd instar larvae were fed EdU (0.2 mM) for 4hrs and immediately processed for EdU labeling according the manufacturer instructions followed by antibody staining. Percentage of central brain neuroblasts positive for EdU was assessed. Neuroblasts were quantified by counting Deadpan positive cells from the central brain or medulla in whole brain lobe stacks using the spots function in Imaris. One-way ANOVA was used for statistical analysis followed by Sidak’s multiple comparisons test (brain size, neuroblast number, and Edu incorporation) to compare only relevant genotypes or Tukey’s multiple comparisons test (TUNEL).
QUANTIFICATION AND STATISTICAL ANALYSIS
RNAi screening of DENV-human PPI candidates
Normalized reporter activity Z-scores were calculated based on the average value and standard deviation for the measured distribution of 350 total samples plus 12 controls for a total of n = 362 samples. For each sample, the average value of four independent replicates was used. A Z-score > |1.5| was considered to be significant and used as a benchmark for MiST training.
Enrichment analysis of AP-MS data
The level of significance for the enrichment was calculated by a hypergeometric test for each term using all proteins detected in the AP-MS data as the list of total possible proteins (Falcon and Gentleman, 2007). The p values were corrected for multiple comparisons using the Benjamini and Hochberg method to control the false discovery rate (FDR). A FDR-correct p value < 0.05 was considered significant.
Dataset overlap analysis
Fishers exact tests used to calculate the significance of finding overlap between two datasets. A p value < 0.05 was considered significant.
PAF1C studies
For PAF1C siRNA knockdown experiments, the mean value of the fold change in percent infected cells is show for n = 4 replicates, and error bars reflect the standard deviation. P values were calculated using a paired, single-tailed student’s t-test. For PAF1 and STAT2 CRISPR depletion experiments, the mean value the concentration of infectious viral particles (pfu/mL) is show for n = 3 replicates, and error bars reflect the standard deviation. P values were calculated using a paired, single-tailed student’s t-test. For ChIP-seq experiments, the mean fold change in PAF1C enrichment across the entire gene body, and error bars reflect the standard deviation. For ISGs, n = 67 genes, and p values were calculated using two-tailed Mann-Whitney U-test. A p value < 0.05 was considered significant for these experiments. For RNA-seq experiments, an adjusted p value < 0.05 was considered significant. A two-tailed Mann-Whitney U-test was preformed to compare the distribution of log2 fold changes across comparisons (all genes n = 11,364; upregulated immune response genes n = 64; PAF1C-binding upregulated immune response genes n = 18).
In vivo studies in Drosophila
One-way ANOVA was used for statistical analysis followed by Sidak’s multiple comparisons test (brain size, neuroblast number, and Edu incorporation) to compare only relevant genotypes or Tukey’s multiple comparisons test (TUNEL). For brain size, each box plot (Figure 5C), represents total range, first quartile, median, and third quartile, with a total of n = 10 brains quantified for each condition except for ZIKV NS4A + dANKLE2, Ankle2A/+, and ZIKV NS4A in Ankle2A/+ which are 5 brains each. For TUNEL, each box plot (Figure 5E) represents total range, first quartile, median, and third quartile, with a total of n = 5 brains quantified for each condition. A p value < 0.05 was considered significant for these experiments.
DATA AND SOFTWARE AVAILABILITY
All ChIP-seq and RNA-seq data have been deposited in the GEO database under the codes GSE110511, GSE110512, GSE118686. Raw proteomic AP-MS data for DENV-human, ZIKV-human and DENV-mosquito used to generate PPI networks have been deposited to Chorus at https://chorusproject.org under the Project ID 1438.
Supplementary Material
Figure S1: Flavivirus protein expression and purification. Related to Figures 1, 3 and 4. (A) Viral baits were expressed in HEK 293T or Aag2 cells and expression was verified by Western analysis using the mouse anti-Strep II antibody. (B) Following affinity purification, enrichment was verified by silver stain analysis. Expected prey size are indicated below each lane and bands associated with prey are highlighted (red triangle). Some prey were codon optimized to improve expression (red text). Expression for some proteins was improved by the addition of MG132. Representative experiments are shown.
Figure S6: Enrichment analysis of PPI data across DENV and ZIKV datasets reveals SEC61 as a target for inhibition of flavivirus replication in human and mosquito cells. (A) 144 high confidence DENV-mosquito PPIs are displayed. Viral baits (grey squares), mosquito prey (yellow circles), PPIs shared with the DENV-human network (orange circles), complexes shared with DENV-human network (gold circles), virus-host interactions (solid grey lines), host-host interactions (orange lines). Prey names are listed as human orthologs. Host-host interactions are based on human and Drosophila ortholog host-host data. (B) Overlap of DENV-human (blue), ZIKV-human (pink), and DENV-mosquito (orange) data were compared using gene ontology biological process categories. Highly similar categories with significant enrichment (FDR corrected q value < 0.05) were combined (Table S5) and median q values of combined terms are plotted. Right panel: individual interactions as detected in DENV-human (blue), ZIKV-human (pink), and DENV-mosquito (orange) datasets are shown for a subset of enrichment categories. (C) Cell viability of Huh7 and C6/36 cells was quantified by treatment with carrier (DMSO), CT8 or PS3061. CT8 or PS3061 concentration of 500nM and 1000nM were used in Huh7 and C6/36 cells, respectively. Error bars reflect standard deviation from three replicates.
Table S1: Summary of constructs used for AP-MS and Drosophila expression. Related to Figures 1–6. Protein and DNA sequences of viral ORFs for DENV and ZIKV expression in human HEK 293T cells, Aedes aegypti Aag2 cells, and Drosophila melanogaster larva. Codon-optimized sequences are included where applicable.
Table S2: Replication phenotypes of top 350 DENV-human PPI candidates and benchmark interactions. Related to Figure 1. The top candidates based on a HIV MiST score (column B) were chosen for phenotypic screening following RNAi knockdown. Some prey interacted with more than one bait. In this case, the highest scoring bait was included as the most likely interactor (column C). Replication data are given in columns K through N. Interactions that made the cutoff of |Z-score| > 1.5 are considered as benchmark interactors used for MiST training (column O). Benchmark interactions were drawn from internal replication phenotype data or literature (columns Q and R) and literature.
Table S3: Summary of MiST training. Related to Figure 1. Area Under the Curve (AUC) of the receiver operator curve was maximized to identify the most benchmark interactors while keeping the FPR below 5%. The AUC values for the top 10 MiST weight sets were extremely similar, so the median value of the top 10 MiST weights were taken for scoring.
Table S4: Summary of MiST scoring of flavivirus-host PPI networks. Related to Figures 1–4. Flavivrius-host PPIs were scored using DENV-Human MiST weights identified in Table S3. CompPASS scores were also computed (WD, column J). DENV-human PPIs surpassing the MiST threshold are identified in Column X, and PPIs surpassing both the MiST and CompPASS thresholds are identified in column Y. DENV-human PPIs shown in Figure 2 were compared to published datasets to identify conserved PPIs or genes involved in PPIs that also have a replication phenotype (column S). ZIKV-Human PPIs surpassing both the MiST threshold are identified in column T. DENV-mosquito PPIs surpassing both the MiST and CompPASS thresholds are identified in column U. Drosophila orthologs used for enrichment analysis are shown in column V, with the source of the ortholog mapping in column W.
Table S5: Summary of enrichment analysis of high-confidence flavivirus-host PPIs. Related to Figures 1, 3, and 4. Redundant Gene Ontology enrichment categories were combined as Collapsed Terms (column L). Median FDR-correct q values for the collapsed term were used for data visualization in Figures 1F, 3A 4A, S5A and S6B.
Table S6: Summary of upregulated immune response genes in RNA-seq. Related to Figure 3. The log2 fold changes and adjusted p values of all genes which have more than 10 reads in 75% of samples. A subset of 64 genes which are in the “immune response” Gene Ontology category (GO:0006955) with log2 fold changes and adjusted p value less than 0.05 in both comparisons, and have a log2 fold change greater than 1 either comparison are highlighted in column F. A subset of 18 genes which are upregulated immune response genes identified in column F and are also identified as PAFIC-responsive with log2 fold changes and adjusted p value less than 0.05 are highlighted in column G. A subset of 15 genes which are IRF3-dependent with log2 fold changes and adjusted p value less than 0.05 are highlighted in column H.
Table S7: Nucleotide sequences for esiRNA synthesis and siRNAs. Related to Figures 1, 3, and 4. esiRNAs were synthesized using primers designed to amplify the mRNA target region specified in column E. siRNAs were ordered from Sigma or Ambion, with custom sequences or catalog numbers listed. Primers used for qPCR are also included.
Figure S2: Localization of DENV proteins with ER. Related to Figure 1. The indicated Strep-tagged DENV proteins were ectopically expressed in HeLa S3 cells. ER was labeled by anti-Calnexin antibodies (red) and DENV proteins were detected with anti-Strep II antibodies (green). Nuclei were stained with Hoechst 33342 (blue). Scale bar 10 μm.
Figure S3: Localization of DENV proteins with Golgi, Mitochondria and Lipid Droplets. Related to Figure 1. The indicated Strep-tagged DENV proteins were ectopically expressed in HeLa S3 cells. Golgi was labeled by anti-grasp65 antibodies (red). Mitochondria were labeled by anti-Tomm20 antibodies (red). Lipid droplets were co-labeled by Bodipy493/503 (red) and anti-Tip47 antibodies (cyan). DENV proteins were detected with anti-Strep II antibodies (green). Nuclei were stained with Hoechst 33342 (blue). Scale bar 10 μm.
Figure S4: ZIKV-human PPI network. Related to Figure 3. 368 high confidence ZIKVfp-human PPIs are displayed. Viral baits (grey squares), human prey (pink circles), PPIs shared with the ZIKVug strain (dark pink circles), PPIs shared with DENV (pink diamonds), human prey involved in neurodevelopment (pink triangles), virus-host interactions (solid grey lines), host-host interactions (dashed pink lines).
Figure S5: DENV and ZIKV comparative proteomics to identify NS5 antagonism of PAF1C. Related to Figure 3. (A) DENV-human (blue) and ZIKV-human (pink) data were compared using gene ontology biological process and cellular compartment categories. Highly similar categories with significant enrichment (FDR corrected q value < 0.05) were combined (Table S11) and median q values of combined terms are plotted. Individual interactions as detected in DENV (blue) and ZIKV (pink) datasets are shown for a subset of NS5 enrichment categories. (B) Western analysis of NS5- and GFP-expressing cells that were used for LEO1 ChIP-seq experiments. STAT2 expression was unaffected by NS5 expression. GAPDH was used as a loading control, and NS5 and GFP expression were detected by the Strep II tag. (C) ChIP-seq on LEO1 reveals NS5 expression inhibits PAF1C recruitment to DENV-induced ISGs. PAF1C occupancy is plotted along length of gene body for 67 DENV-induced ISGs. Profiles are shown for one representative experiment. (D) Comparison of gene expression of 64 genes that were upregulated by the immunositmulant, polyIC, by two-fold in more in either GFP- (61) or NS5- (3) expressing cells.
Highlights.
Comparative AP-MS reveals shared and virus-specific interactions
NS5 suppresses interferon stimulated genes by inhibiting PAF1C recruitment
Pharmacological modulation of the SEC61 translocon inhibits virus replication
Zika virus NS4A inhibits brain development in vivo in an ANKLE2-dependent manner
Comparing protein-protein interactions across Zika and Dengue viruses reveals both common mechanisms and functionally distinct pathways contributing to infection outcomes.
Acknowledgements
We would like to thank Manon Eckhardt, Judd Hultquist, and Jacqueline Fabius for critical reading of the manuscript, the Krogan group for valuable comments and Sima Lev, Michael Diamond, Chris Doe, Jim Skeath, BEI Resources, and the Bloomington Drosophila Stock Center for providing stocks and reagents and the IDDRC Microscopy Core (NIH/NICHD U54 HD083092). This work was supported by NIH/NIAID F32AI112262 to P.S.S., NIH/NINDS F32NS092270 to N.L., DOD/DARPA HR0011-11-C-0094 (PROPHECY) to R.A., A.V.G, A.F.S and N.J.K., NIH/NIAID U19AI1186101 to A.F.S. and N.J.K., NIH/NIGMS P50 GM082250 to N.J.K., NIH/NIAID R01AI07345, R21AI116022 to A.F.S., UCSF Breast Cancer Research Funds to J.T., and NIH U54NS093793, NIH R24OD022005, and the Huffington Foundation to H.J.B. H.J.B. and N.L. are supported by HHMI.
Footnotes
Publisher's Disclaimer: This is a PDF file of an unedited manuscript that has been accepted for publication. As a service to our customers we are providing this early version of the manuscript. The manuscript will undergo copyediting, typesetting, and review of the resulting proof before it is published in its final citable form. Please note that during the production process errors may be discovered which could affect the content, and all legal disclaimers that apply to the journal pertain.
Declaration of Interests
J.T. is a cofounder and shareholder of Global Blood Therapeutics, Principia Biopharma, Kezar Life Sciences, and Cedilla Therapeutics. J.T. and P.P.S. are listed as inventors on a provisional patent application describing PS3061. All other authors declare no conflicts of interest.
References
- Aguirre S, Luthra P, Sanchez-Aparicio MT, Maestre AM, Patel J, Lamothe F, Fredericks AC, Tripathi S, Zhu T, Pintado-Silva J, et al. (2017). Dengue virus NS2B protein targets cGAS for degradation and prevents mitochondrial DNA sensing during infection. Nat Microbiol 2, 17037. [DOI] [PMC free article] [PubMed] [Google Scholar]
- Alvarez DE, De Lella Ezcurra AL, Fucito S, and Gamarnik AV (2005). Role of RNA structures present at the 3’UTR of dengue virus on translation, RNA synthesis, and viral replication. Virology 339, 200–212. [DOI] [PubMed] [Google Scholar]
- Ashour J, Laurent-Rolle M, Shi PY, and Garcia-Sastre A (2009). NS5 of dengue virus mediates STAT2 binding and degradation. J Virol 83, 5408–5418. [DOI] [PMC free article] [PubMed] [Google Scholar]
- Avirutnan P, Fuchs A, Hauhart RE, Somnuke P, Youn S, Diamond MS, and Atkinson JP (2010). Antagonism of the complement component C4 by flavivirus nonstructural protein NS1. J Exp Med 207, 793–806. [DOI] [PMC free article] [PubMed] [Google Scholar]
- Bhatt S, Gething PW, Brady OJ, Messina JP, Farlow AW, Moyes CL, Drake JM, Brownstein JS, Hoen AG, Sankoh O, et al. (2013). The global distribution and burden of dengue. Nature 496, 504–507. [DOI] [PMC free article] [PubMed] [Google Scholar]
- Bischof J, Maeda RK, Hediger M, Karch F, and Basler K (2007). An optimized transgenesis system for Drosophila using germ-line-specific phiC31 integrases. Proc Natl Acad Sci U S A 104, 3312–3317. [DOI] [PMC free article] [PubMed] [Google Scholar]
- Chavali PL, Stojic L, Meredith LW, Joseph N, Nahorski MS, Sanford TJ, Sweeney TR, Krishna BA, Hosmillo M, Firth AE, et al. (2017). Neurodevelopmental protein Musashi-1 interacts with the Zika genome and promotes viral replication. Science 357, 83–88. [DOI] [PMC free article] [PubMed] [Google Scholar]
- Chen SH, Jang GM, Huttenhain R, Gordon DE, Du D, Newton BW, Johnson JR, Hiatt J, Hultquist JF, Johnson TL, et al. (2018). CRL4(AMBRA1) targets Elongin C for ubiquitination and degradation to modulate CRL5 signaling. Embo Journal 37. [DOI] [PMC free article] [PubMed] [Google Scholar]
- Choi M, Chang CY, Clough T, Broudy D, Killeen T, MacLean B, and Vitek O (2014). MSstats: an R package for statistical analysis of quantitative mass spectrometry-based proteomic experiments. Bioinformatics 30, 2524–2526. [DOI] [PubMed] [Google Scholar]
- Coin I, Beerbaum M, Schmieder P, Bienert M, and Beyermann M (2008). Solid-phase synthesis of a cyclodepsipeptide: cotransin. Org Lett 10, 3857–3860. [DOI] [PubMed] [Google Scholar]
- Cox J, and Mann M (2008). MaxQuant enables high peptide identification rates, individualized p.p.b.-range mass accuracies and proteome-wide protein quantification. Nat Biotechnol 26, 1367–1372. [DOI] [PubMed] [Google Scholar]
- Davis ZH, Verschueren E, Jang GM, Kleffman K, Johnson JR, Park J, Von Dollen J, Maher MC, Johnson T, Newton W, et al. (2015). Global mapping of herpesvirus-host protein complexes reveals a transcription strategy for late genes. Mol Cell 57, 349–360. [DOI] [PMC free article] [PubMed] [Google Scholar]
- De Maio FA, Risso G, Iglesias NG, Shah P, Pozzi B, Gebhard LG, Mammi P, Mancini E, Yanovsky MJ, Andino R, et al. (2016). The Dengue Virus NS5 Protein Intrudes in the Cellular Spliceosome and Modulates Splicing. PLoS Pathog 12, e1005841. [DOI] [PMC free article] [PubMed] [Google Scholar]
- de Paula Freitas B, de Oliveira Dias JR, Prazeres J, Sacramento GA, Ko AI, Maia M, and Belfort R Jr. (2016). Ocular Findings in Infants With Microcephaly Associated With Presumed Zika Virus Congenital Infection in Salvador, Brazil. JAMA Ophthalmol. [DOI] [PMC free article] [PubMed] [Google Scholar]
- Eckhardt M, Zhang W, Gross AM, Von Dollen J, Johnson JR, Franks-Skiba KE, Swaney DL, Johnson TL, Jang GM, Shah PS, et al. (2018). Multiple Routes to Oncogenesis Are Promoted by the Human Papillomavirus-Host Protein Network. Cancer Discov 8, 1474–1489. [DOI] [PMC free article] [PubMed] [Google Scholar]
- Falcon S, and Gentleman R (2007). Using GOstats to test gene lists for GO term association. Bioinformatics 23, 257–258. [DOI] [PubMed] [Google Scholar]
- Fernandez-Garcia MD, Mazzon M, Jacobs M, and Amara A (2009). Pathogenesis of flavivirus infections: using and abusing the host cell. Cell Host Microbe 5, 318–328. [DOI] [PubMed] [Google Scholar]
- Fontaine KA, Leon KE, Khalid MM, Tomar S, Jimenez-Morales D, Dunlap M, Kaye JA, Shah PS, Finkbeiner S, Krogan NJ, et al. (2018). The Cellular NMD Pathway Restricts Zika Virus Infection and Is Targeted by the Viral Capsid Protein. MBio 9. [DOI] [PMC free article] [PubMed] [Google Scholar]
- Grant A, Ponia SS, Tripathi S, Balasubramaniam V, Miorin L, Sourisseau M, Schwarz MC, Sanchez-Seco MP, Evans MJ, Best SM, et al. (2016). Zika Virus Targets Human STAT2 to Inhibit Type I Interferon Signaling. Cell Host Microbe 19, 882–890. [DOI] [PMC free article] [PubMed] [Google Scholar]
- Hafirassou ML, Meertens L, Umana-Diaz C, Labeau A, Dejarnac O, Bonnet-Madin L, Kummerer BM, Delaugerre C, Roingeard P, Vidalain PO, et al. (2017). A Global Interactome Map of the Dengue Virus NS1 Identifies Virus Restriction and Dependency Host Factors. Cell Rep 21, 3900–3913. [DOI] [PubMed] [Google Scholar]
- Heaton NS, and Randall G (2010). Dengue virus-induced autophagy regulates lipid metabolism. Cell Host Microbe 8, 422–432. [DOI] [PMC free article] [PubMed] [Google Scholar]
- Henchal EA, Gentry MK, McCown JM, and Brandt WE (1982). Dengue virus-specific and flavivirus group determinants identified with monoclonal antibodies by indirect immunofluorescence. Am J Trop Med Hyg 31, 830–836. [DOI] [PubMed] [Google Scholar]
- Jager S, Cimermancic P, Gulbahce N, Johnson JR, McGovern KE, Clarke SC, Shales M, Mercenne G, Pache L, Li K, et al. (2011a). Global landscape of HIV-human protein complexes. Nature 481, 365–370. [DOI] [PMC free article] [PubMed] [Google Scholar]
- Jager S, Kim DY, Hultquist JF, Shindo K, LaRue RS, Kwon E, Li M, Anderson BD, Yen L, Stanley D, et al. (2011b). Vif hijacks CBF-beta to degrade APOBEC3G and promote HIV-1 infection. Nature 481, 371–375. [DOI] [PMC free article] [PubMed] [Google Scholar]
- Kane JR, Stanley DJ, Hultquist JF, Johnson JR, Mietrach N, Binning JM, Jonsson SR, Barelier S, Newton BW, Johnson TL, et al. (2015). Lineage-Specific Viral Hijacking of Non-canonical E3 Ubiquitin Ligase Cofactors in the Evolution of Vif Anti-APOBEC3 Activity. Cell Rep 11, 1236–1250. [DOI] [PMC free article] [PubMed] [Google Scholar]
- Kim D, Pertea G, Trapnell C, Pimentel H, Kelley R, and Salzberg SL (2013). TopHat2: accurate alignment of transcriptomes in the presence of insertions, deletions and gene fusions. Genome Biol 14, R36. [DOI] [PMC free article] [PubMed] [Google Scholar]
- Kinney RM, Butrapet S, Chang GJ, Tsuchiya KR, Roehrig JT, Bhamarapravati N, and Gubler DJ (1997). Construction of infectious cDNA clones for dengue 2 virus: strain 16681 and its attenuated vaccine derivative, strain PDK-53. Virology 230, 300–308. [DOI] [PubMed] [Google Scholar]
- Kobayashi N, Yang J, Ueda A, Suzuki T, Tomaru K, Takeno M, Okuda K, and Ishigatsubo Y (2007). RanBPM, Muskelin, p48EMLP, p44CTLH, and the armadillo-repeat proteins ARMC8alpha and ARMC8beta are components of the CTLH complex. Gene 396, 236–247. [DOI] [PubMed] [Google Scholar]
- Krishnan MN, Ng A, Sukumaran B, Gilfoy FD, Uchil PD, Sultana H, Brass AL, Adametz R, Tsui M, Qian F, et al. (2008). RNA interference screen for human genes associated with West Nile virus infection. Nature 455, 242–245. [DOI] [PMC free article] [PubMed] [Google Scholar]
- Krogan NJ, Dover J, Wood A, Schneider J, Heidt J, Boateng MA, Dean K, Ryan OW, Golshani A, Johnston M, et al. (2003). The Paf1 complex is required for histone H3 methylation by COMPASS and Dot1p: linking transcriptional elongation to histone methylation. Mol Cell 11, 721–729. [DOI] [PubMed] [Google Scholar]
- Krogan NJ, Kim M, Ahn SH, Zhong G, Kobor MS, Cagney G, Emili A, Shilatifard A, Buratowski S, and Greenblatt JF (2002). RNA polymerase II elongation factors of Saccharomyces cerevisiae: a targeted proteomics approach. Mol Cell Biol 22, 6979–6992. [DOI] [PMC free article] [PubMed] [Google Scholar]
- Langmead B, Trapnell C, Pop M, and Salzberg SL (2009). Ultrafast and memory-efficient alignment of short DNA sequences to the human genome. Genome Biol 10, R25. [DOI] [PMC free article] [PubMed] [Google Scholar]
- Laurent-Rolle M, Morrison J, Rajsbaum R, Macleod JML, Pisanelli G, Pham A, Ayllon J, Miorin L, Martinez C, tenOever BR, et al. (2014). The interferon signaling antagonist function of yellow fever virus NS5 protein is activated by type I interferon. Cell Host Microbe 16, 314–327. [DOI] [PMC free article] [PubMed] [Google Scholar]
- Liang Q, Luo Z, Zeng J, Chen W, Foo SS, Lee SA, Ge J, Wang S, Goldman SA, Zlokovic BV, et al. (2016). Zika Virus NS4A and NS4B Proteins Deregulate Akt-mTOR Signaling in Human Fetal Neural Stem Cells to Inhibit Neurogenesis and Induce Autophagy. Cell Stem Cell 19, 663–671. [DOI] [PMC free article] [PubMed] [Google Scholar]
- Lindenbach BD, Thiel H.-J.r., and Rice CM (2013). Flaviviridae: the viruses and their replication In Fields Virology, Knipe DM, and Howley PM, eds. (Philadelphia: Wolters Kluwer Health/Lippincott Williams & Wilkins; ), pp. 712–746. [Google Scholar]
- Longhi MP, Trumpfheller C, Idoyaga J, Caskey M, Matos I, Kluger C, Salazar AM, Colonna M, and Steinman RM (2009). Dendritic cells require a systemic type I interferon response to mature and induce CD4+ Th1 immunity with poly IC as adjuvant. J Exp Med 206, 1589–1602. [DOI] [PMC free article] [PubMed] [Google Scholar]
- Love MI, Huber W, and Anders S (2014). Moderated estimation of fold change and dispersion for RNA-seq data with DESeq2. Genome Biol 15, 550. [DOI] [PMC free article] [PubMed] [Google Scholar]
- Lubick KJ, Robertson SJ, McNally KL, Freedman BA, Rasmussen AL, Taylor RT, Walts AD, Tsuruda S, Sakai M, Ishizuka M, et al. (2015). Flavivirus Antagonism of Type I Interferon Signaling Reveals Prolidase as a Regulator of IFNAR1 Surface Expression. Cell Host Microbe 18, 61–74. [DOI] [PMC free article] [PubMed] [Google Scholar]
- MacLean B, Tomazela DM, Shulman N, Chambers M, Finney GL, Frewen B, Kern R, Tabb DL, Liebler DC, and MacCoss MJ (2010). Skyline: an open source document editor for creating and analyzing targeted proteomics experiments. Bioinformatics 26, 966–968. [DOI] [PMC free article] [PubMed] [Google Scholar]
- Maifeld SV, MacKinnon AL, Garrison JL, Sharma A, Kunkel EJ, Hegde RS, and Taunton J (2011). Secretory protein profiling reveals TNF-alpha inactivation by selective and promiscuous Sec61 modulators. Chem Biol 18, 1082–1088. [DOI] [PMC free article] [PubMed] [Google Scholar]
- Mairiang D, Zhang H, Sodja A, Murali T, Suriyaphol P, Malasit P, Limjindaporn T, and Finley RL Jr. (2013). Identification of new protein interactions between dengue fever virus and its hosts, human and mosquito. PLoS One 8, e53535. [DOI] [PMC free article] [PubMed] [Google Scholar]
- Marazzi I, Ho JS, Kim J, Manicassamy B, Dewell S, Albrecht RA, Seibert CW, Schaefer U, Jeffrey KL, Prinjha RK, et al. (2012). Suppression of the antiviral response by an influenza histone mimic. Nature 483, 428–433. [DOI] [PMC free article] [PubMed] [Google Scholar]
- Marceau CD, Puschnik AS, Majzoub K, Ooi YS, Brewer SM, Fuchs G, Swaminathan K, Mata MA, Elias JE, Sarnow P, et al. (2016). Genetic dissection of Flaviviridae host factors through genome-scale CRISPR screens. Nature 535, 159–163. [DOI] [PMC free article] [PubMed] [Google Scholar]
- Metz P, Chiramel A, Chatel-Chaix L, Alvisi G, Bankhead P, Mora-Rodriguez R, Long G, Hamacher-Brady A, Brady NR, and Bartenschlager R (2015). Dengue Virus Inhibition of Autophagic Flux and Dependency of Viral Replication on Proteasomal Degradation of the Autophagy Receptor p62. J Virol 89, 8026–8041. [DOI] [PMC free article] [PubMed] [Google Scholar]
- Miller S, Kastner S, Krijnse-Locker J, Buhler S, and Bartenschlager R (2007). The non-structural protein 4A of dengue virus is an integral membrane protein inducing membrane alterations in a 2K-regulated manner. J Biol Chem 282, 8873–8882. [DOI] [PubMed] [Google Scholar]
- Mlakar J, Korva M, Tul N, Popovic M, Poljsak-Prijatelj M, Mraz J, Kolenc M, Rus K. Resman, Vipotnik T. Vesnaver, Vodusek V. Fabjan, et al. (2016). Zika Virus Associated with Microcephaly. N Engl J Med 374, 951–958. [DOI] [PubMed] [Google Scholar]
- Moore CA, Staples JE, Dobyns WB, Pessoa A, Ventura CV, Fonseca EB, Ribeiro EM, Ventura LO, Neto NN, Arena JF, et al. (2017). Characterizing the Pattern of Anomalies in Congenital Zika Syndrome for Pediatric Clinicians. JAMA Pediatr 171, 288–295. [DOI] [PMC free article] [PubMed] [Google Scholar]
- O’Leary DR, Kuhn S, Kniss KL, Hinckley AF, Rasmussen SA, Pape WJ, Kightlinger LK, Beecham BD, Miller TK, Neitzel DF, et al. (2006). Birth outcomes following West Nile Virus infection of pregnant women in the United States: 2003–2004. Pediatrics 117, e537–545. [DOI] [PubMed] [Google Scholar]
- Pena J, and Harris E (2011). Dengue virus modulates the unfolded protein response in a time-dependent manner. J Biol Chem 286, 14226–14236. [DOI] [PMC free article] [PubMed] [Google Scholar]
- Peretti D, Dahan N, Shimoni E, Hirschberg K, and Lev S (2008). Coordinated lipid transfer between the endoplasmic reticulum and the Golgi complex requires the VAP proteins and is essential for Golgi-mediated transport. Mol Biol Cell 19, 3871–3884. [DOI] [PMC free article] [PubMed] [Google Scholar]
- Platt DJ, Smith AM, Arora N, Diamond MS, Coyne CB, and Miner JJ (2018). Zika virus-related neurotropic flaviviruses infect human placental explants and cause fetal demise in mice. Sci Transl Med 10. [DOI] [PMC free article] [PubMed] [Google Scholar]
- Quinlan AR, and Hall IM (2010). BEDTools: a flexible suite of utilities for comparing genomic features. Bioinformatics 26, 841–842. [DOI] [PMC free article] [PubMed] [Google Scholar]
- Ramage HR, Kumar GR, Verschueren E, Johnson JR, Von Dollen J, Johnson T, Newton B, Shah P, Horner J, Krogan NJ, et al. (2015). A combined proteomics/genomics approach links hepatitis C virus infection with nonsense-mediated mRNA decay. Mol Cell 57, 329–340. [DOI] [PMC free article] [PubMed] [Google Scholar]
- Rialdi A, Campisi L, Zhao N, Lagda AC, Pietzsch C, Ho JSY, Martinez-Gil L, Fenouil R, Chen X, Edwards M, et al. (2016). Topoisomerase 1 inhibition suppresses inflammatory genes and protects from death by inflammation. Science 352, aad7993. [DOI] [PMC free article] [PubMed] [Google Scholar]
- Rusinova I, Forster S, Yu S, Kannan A, Masse M, Cumming H, Chapman R, and Hertzog PJ (2013). Interferome v2.0: an updated database of annotated interferon-regulated genes. Nucleic Acids Res 41, D1040–1046. [DOI] [PMC free article] [PubMed] [Google Scholar]
- Saiz JC, Vazquez-Calvo A, Blazquez AB, Merino-Ramos T, Escribano-Romero E, and Martin-Acebes MA (2016). Zika Virus: the Latest Newcomer. Front Microbiol 7, 496. [DOI] [PMC free article] [PubMed] [Google Scholar]
- Samsa MM, Mondotte JA, Iglesias NG, Assuncao-Miranda I, Barbosa-Lima G, Da Poian AT, Bozza PT, and Gamarnik AV (2009). Dengue virus capsid protein usurps lipid droplets for viral particle formation. PLoS Pathog 5, e1000632. [DOI] [PMC free article] [PubMed] [Google Scholar]
- Shah PS, Wojcechowskyj JA, Eckhardt M, and Krogan NJ (2015). Comparative mapping of host-pathogen protein-protein interactions. Curr Opin Microbiol 27, 62–68. [DOI] [PMC free article] [PubMed] [Google Scholar]
- Shaheen R, Maddirevula S, Ewida N, Alsahli S, Abdel-Salam GMH, Zaki MS, Tala SA, Alhashem A, Softah A, Al-Owain M, et al. (2018). Genomic and phenotypic delineation of congenital microcephaly. Genet Med. [DOI] [PMC free article] [PubMed] [Google Scholar]
- Shao S, and Hegde RS (2011). Membrane protein insertion at the endoplasmic reticulum. Annu Rev Cell Dev Biol 27, 25–56. [DOI] [PMC free article] [PubMed] [Google Scholar]
- Shen L, Shao N, Liu X, and Nestler E (2014). ngs.plot: Quick mining and visualization of next-generation sequencing data by integrating genomic databases. BMC Genomics 15, 284. [DOI] [PMC free article] [PubMed] [Google Scholar]
- Sonnhammer EL, and Ostlund G (2015). InParanoid 8: orthology analysis between 273 proteomes, mostly eukaryotic. Nucleic Acids Res 43, D234–239. [DOI] [PMC free article] [PubMed] [Google Scholar]
- Sowa ME, Bennett EJ, Gygi SP, and Harper JW (2009). Defining the human deubiquitinating enzyme interaction landscape. Cell 138, 389–403. [DOI] [PMC free article] [PubMed] [Google Scholar]
- Taguwa S, Maringer K, Li X, Bernal-Rubio D, Rauch JN, Gestwicki JE, Andino R, Fernandez-Sesma A, and Frydman J (2015). Defining Hsp70 Subnetworks in Dengue Virus Replication Reveals Key Vulnerability in Flavivirus Infection. Cell 163, 1108–1123. [DOI] [PMC free article] [PubMed] [Google Scholar]
- Trapnell C, Hendrickson DG, Sauvageau M, Goff L, Rinn JL, and Pachter L (2013). Differential analysis of gene regulation at transcript resolution with RNA-seq. Nat Biotechnol 31, 46–53. [DOI] [PMC free article] [PubMed] [Google Scholar]
- Venken KJ, He Y, Hoskins RA, and Bellen HJ (2006). P[acman]: a BAC transgenic platform for targeted insertion of large DNA fragments in D. melanogaster. Science 314, 1747–1751. [DOI] [PubMed] [Google Scholar]
- Verschueren E, Von Dollen J, Cimermancic P, Gulbahce N, Sali A, and Krogan NJ (2015). Scoring Large-Scale Affinity Purification Mass Spectrometry Datasets with MiST. Curr Protoc Bioinformatics 49, 8 19, 11–16. [DOI] [PMC free article] [PubMed] [Google Scholar]
- von Mering C, Krause R, Snel B, Cornell M, Oliver SG, Fields S, and Bork P (2002). Comparative assessment of large-scale data sets of protein-protein interactions. Nature 417, 399–403. [DOI] [PubMed] [Google Scholar]
- Wang L, Valderramos SG, Wu A, Ouyang S, Li C, Brasil P, Bonaldo M, Coates T, Nielsen-Saines K, Jiang T, et al. (2016). From Mosquitos to Humans: Genetic Evolution of Zika Virus. Cell Host Microbe 19, 561–565. [DOI] [PMC free article] [PubMed] [Google Scholar]
- Wangler MF, Yamamoto S, and Bellen HJ (2015). Fruit flies in biomedical research. Genetics 199, 639–653. [DOI] [PMC free article] [PubMed] [Google Scholar]
- Weger-Lucarelli J, Duggal NK, Bullard-Feibelman K, Veselinovic M, Romo H, Nguyen C, Ruckert C, Brault AC, Bowen RA, Stenglein M, et al. (2017). Development and Characterization of Recombinant Virus Generated from a New World Zika Virus Infectious Clone. J Virol 91. [DOI] [PMC free article] [PubMed] [Google Scholar]
- Whitfield ZJ, Dolan PT, Kunitomi M, Tassetto M, Seetin MG, Oh S, Heiner C, Paxinos E, and Andino R (2017). The Diversity, Structure, and Function of Heritable Adaptive Immunity Sequences in the Aedes aegypti Genome. Curr Biol 27, 3511–3519 e3517. [DOI] [PMC free article] [PubMed] [Google Scholar]
- Yamamoto S, Jaiswal M, Charng WL, Gambin T, Karaca E, Mirzaa G, Wiszniewski W, Sandoval H, Haelterman NA, Xiong B, et al. (2014). A drosophila genetic resource of mutants to study mechanisms underlying human genetic diseases. Cell 159, 200–214. [DOI] [PMC free article] [PubMed] [Google Scholar]
- Yim TJ, Tang S, and Andino R (1996). Poliovirus recombinants expressing hepatitis B virus antigens elicited a humoral immune response in susceptible mice. Virology 218, 61–70. [DOI] [PubMed] [Google Scholar]
- Yoon KJ, Song G, Qian X, Pan J, Xu D, Rho HS, Kim NS, Habela C, Zheng L, Jacob F, et al. (2017). Zika-Virus-Encoded NS2A Disrupts Mammalian Cortical Neurogenesis by Degrading Adherens Junction Proteins. Cell Stem Cell 21, 349–358 e346. [DOI] [PMC free article] [PubMed] [Google Scholar]
- Zhang R, Miner JJ, Gorman MJ, Rausch K, Ramage H, White JP, Zuiani A, Zhang P, Fernandez E, Zhang Q, et al. (2016). A CRISPR screen defines a signal peptide processing pathway required by flaviviruses. Nature 535, 164–168. [DOI] [PMC free article] [PubMed] [Google Scholar]
- Zhu A, Ibrahim JG, and Love MI (2018). Heavy-tailed prior distributions for sequence count data: removing the noise and preserving large differences. [DOI] [PMC free article] [PubMed]
- Zhu Y, Pe’ery T, Peng J, Ramanathan Y, Marshall N, Marshall T, Amendt B, Mathews MB, and Price DH (1997). Transcription elongation factor P-TEFb is required for HIV-1 tat transactivation in vitro. Genes Dev 11, 2622–2632. [DOI] [PMC free article] [PubMed] [Google Scholar]
Associated Data
This section collects any data citations, data availability statements, or supplementary materials included in this article.
Supplementary Materials
Figure S1: Flavivirus protein expression and purification. Related to Figures 1, 3 and 4. (A) Viral baits were expressed in HEK 293T or Aag2 cells and expression was verified by Western analysis using the mouse anti-Strep II antibody. (B) Following affinity purification, enrichment was verified by silver stain analysis. Expected prey size are indicated below each lane and bands associated with prey are highlighted (red triangle). Some prey were codon optimized to improve expression (red text). Expression for some proteins was improved by the addition of MG132. Representative experiments are shown.
Figure S6: Enrichment analysis of PPI data across DENV and ZIKV datasets reveals SEC61 as a target for inhibition of flavivirus replication in human and mosquito cells. (A) 144 high confidence DENV-mosquito PPIs are displayed. Viral baits (grey squares), mosquito prey (yellow circles), PPIs shared with the DENV-human network (orange circles), complexes shared with DENV-human network (gold circles), virus-host interactions (solid grey lines), host-host interactions (orange lines). Prey names are listed as human orthologs. Host-host interactions are based on human and Drosophila ortholog host-host data. (B) Overlap of DENV-human (blue), ZIKV-human (pink), and DENV-mosquito (orange) data were compared using gene ontology biological process categories. Highly similar categories with significant enrichment (FDR corrected q value < 0.05) were combined (Table S5) and median q values of combined terms are plotted. Right panel: individual interactions as detected in DENV-human (blue), ZIKV-human (pink), and DENV-mosquito (orange) datasets are shown for a subset of enrichment categories. (C) Cell viability of Huh7 and C6/36 cells was quantified by treatment with carrier (DMSO), CT8 or PS3061. CT8 or PS3061 concentration of 500nM and 1000nM were used in Huh7 and C6/36 cells, respectively. Error bars reflect standard deviation from three replicates.
Table S1: Summary of constructs used for AP-MS and Drosophila expression. Related to Figures 1–6. Protein and DNA sequences of viral ORFs for DENV and ZIKV expression in human HEK 293T cells, Aedes aegypti Aag2 cells, and Drosophila melanogaster larva. Codon-optimized sequences are included where applicable.
Table S2: Replication phenotypes of top 350 DENV-human PPI candidates and benchmark interactions. Related to Figure 1. The top candidates based on a HIV MiST score (column B) were chosen for phenotypic screening following RNAi knockdown. Some prey interacted with more than one bait. In this case, the highest scoring bait was included as the most likely interactor (column C). Replication data are given in columns K through N. Interactions that made the cutoff of |Z-score| > 1.5 are considered as benchmark interactors used for MiST training (column O). Benchmark interactions were drawn from internal replication phenotype data or literature (columns Q and R) and literature.
Table S3: Summary of MiST training. Related to Figure 1. Area Under the Curve (AUC) of the receiver operator curve was maximized to identify the most benchmark interactors while keeping the FPR below 5%. The AUC values for the top 10 MiST weight sets were extremely similar, so the median value of the top 10 MiST weights were taken for scoring.
Table S4: Summary of MiST scoring of flavivirus-host PPI networks. Related to Figures 1–4. Flavivrius-host PPIs were scored using DENV-Human MiST weights identified in Table S3. CompPASS scores were also computed (WD, column J). DENV-human PPIs surpassing the MiST threshold are identified in Column X, and PPIs surpassing both the MiST and CompPASS thresholds are identified in column Y. DENV-human PPIs shown in Figure 2 were compared to published datasets to identify conserved PPIs or genes involved in PPIs that also have a replication phenotype (column S). ZIKV-Human PPIs surpassing both the MiST threshold are identified in column T. DENV-mosquito PPIs surpassing both the MiST and CompPASS thresholds are identified in column U. Drosophila orthologs used for enrichment analysis are shown in column V, with the source of the ortholog mapping in column W.
Table S5: Summary of enrichment analysis of high-confidence flavivirus-host PPIs. Related to Figures 1, 3, and 4. Redundant Gene Ontology enrichment categories were combined as Collapsed Terms (column L). Median FDR-correct q values for the collapsed term were used for data visualization in Figures 1F, 3A 4A, S5A and S6B.
Table S6: Summary of upregulated immune response genes in RNA-seq. Related to Figure 3. The log2 fold changes and adjusted p values of all genes which have more than 10 reads in 75% of samples. A subset of 64 genes which are in the “immune response” Gene Ontology category (GO:0006955) with log2 fold changes and adjusted p value less than 0.05 in both comparisons, and have a log2 fold change greater than 1 either comparison are highlighted in column F. A subset of 18 genes which are upregulated immune response genes identified in column F and are also identified as PAFIC-responsive with log2 fold changes and adjusted p value less than 0.05 are highlighted in column G. A subset of 15 genes which are IRF3-dependent with log2 fold changes and adjusted p value less than 0.05 are highlighted in column H.
Table S7: Nucleotide sequences for esiRNA synthesis and siRNAs. Related to Figures 1, 3, and 4. esiRNAs were synthesized using primers designed to amplify the mRNA target region specified in column E. siRNAs were ordered from Sigma or Ambion, with custom sequences or catalog numbers listed. Primers used for qPCR are also included.
Figure S2: Localization of DENV proteins with ER. Related to Figure 1. The indicated Strep-tagged DENV proteins were ectopically expressed in HeLa S3 cells. ER was labeled by anti-Calnexin antibodies (red) and DENV proteins were detected with anti-Strep II antibodies (green). Nuclei were stained with Hoechst 33342 (blue). Scale bar 10 μm.
Figure S3: Localization of DENV proteins with Golgi, Mitochondria and Lipid Droplets. Related to Figure 1. The indicated Strep-tagged DENV proteins were ectopically expressed in HeLa S3 cells. Golgi was labeled by anti-grasp65 antibodies (red). Mitochondria were labeled by anti-Tomm20 antibodies (red). Lipid droplets were co-labeled by Bodipy493/503 (red) and anti-Tip47 antibodies (cyan). DENV proteins were detected with anti-Strep II antibodies (green). Nuclei were stained with Hoechst 33342 (blue). Scale bar 10 μm.
Figure S4: ZIKV-human PPI network. Related to Figure 3. 368 high confidence ZIKVfp-human PPIs are displayed. Viral baits (grey squares), human prey (pink circles), PPIs shared with the ZIKVug strain (dark pink circles), PPIs shared with DENV (pink diamonds), human prey involved in neurodevelopment (pink triangles), virus-host interactions (solid grey lines), host-host interactions (dashed pink lines).
Figure S5: DENV and ZIKV comparative proteomics to identify NS5 antagonism of PAF1C. Related to Figure 3. (A) DENV-human (blue) and ZIKV-human (pink) data were compared using gene ontology biological process and cellular compartment categories. Highly similar categories with significant enrichment (FDR corrected q value < 0.05) were combined (Table S11) and median q values of combined terms are plotted. Individual interactions as detected in DENV (blue) and ZIKV (pink) datasets are shown for a subset of NS5 enrichment categories. (B) Western analysis of NS5- and GFP-expressing cells that were used for LEO1 ChIP-seq experiments. STAT2 expression was unaffected by NS5 expression. GAPDH was used as a loading control, and NS5 and GFP expression were detected by the Strep II tag. (C) ChIP-seq on LEO1 reveals NS5 expression inhibits PAF1C recruitment to DENV-induced ISGs. PAF1C occupancy is plotted along length of gene body for 67 DENV-induced ISGs. Profiles are shown for one representative experiment. (D) Comparison of gene expression of 64 genes that were upregulated by the immunositmulant, polyIC, by two-fold in more in either GFP- (61) or NS5- (3) expressing cells.
Data Availability Statement
All ChIP-seq and RNA-seq data have been deposited in the GEO database under the codes GSE110511, GSE110512, GSE118686. Raw proteomic AP-MS data for DENV-human, ZIKV-human and DENV-mosquito used to generate PPI networks have been deposited to Chorus at https://chorusproject.org under the Project ID 1438.