
Figure 5: ZIKV NS4A expression induces microcephaly in an ANKLE2-dependent manner.
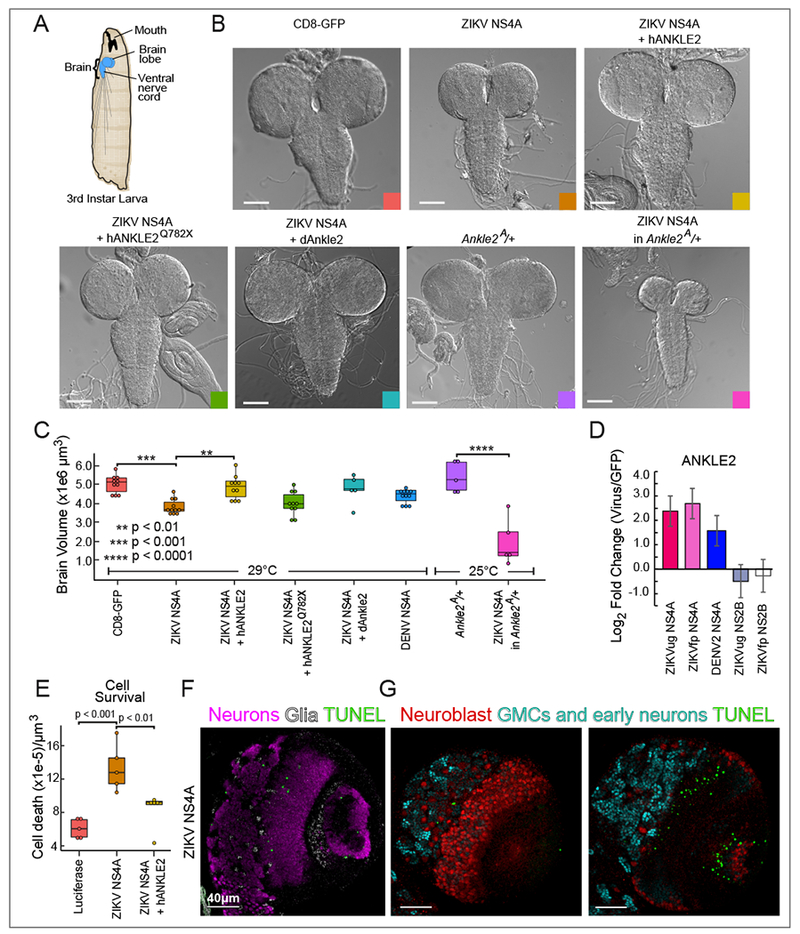
(A) Diagram of D. melanogaster 3rd instar larva brain. (B) Bright field images of 3rd instar brains expressing indicated proteins in a wild type or Ankle2A/+ background (two lower right images). Colored square matches color of corresponding box plot in (C). Scale bar 100 μm. (C) Brain volumes quantified from animals corresponding to panel (A). P values were calculated using one-way ANOVA, Sidak’s multiple comparisons test. (D) Targeted proteomic analysis of ANKLE2 interaction with DENV and ZIKV NS4A. NS2B was used as a negative control. Error bars reflect standard deviation from triplicates. (E) Cell death quantified in 5 brains expressing the indicated proteins using a TUNEL assay. P values were calculated using one-way ANOVA, Tukey’s multiple comparisons test. (F-G) Cell type specific cell death was analyzed using TUNEL followed by immunostaining to identify neurons, glia, and neuroblasts. A single slice was analyzed in each set of images. Scale bar 40 μm. (F) Merged signals for neurons (Elav, purple), glia (Repo, light gray) and TUNEL (green). (G) Merged signals for neuroblasts (Dpn, red), ganglion mother cells and early neuronal lineages (Pros, cyan), and TUNEL (green) from a region of the brain at the surface (left panel) and from a deeper region of the brain (right panel).