

Abstract
The benefits and uses of postmortem computed tomography (PMCT) have been well documented in the forensic pathology and radiology literature in recent years and research into its utility continue in earnest. Opinions and policies regarding who actually interprets the PMCT scans vary between institutions, but in general, scans will be read by a forensic pathologist, a clinical radiologist, or a clinical radiologist with a special interest or training in postmortem imaging. Differences between clinical computed tomography scans and PMCT scans have been well documented and knowledge of these differences, typically those due to postmortem changes, is essential to the reader of the PMCT scan so as to minimize the risk of misinterpretation and, potentially, misdiagnoses.
Keywords: Forensic pathology, PMCT, Postmortem changes, Postmortem computed tomography
Introduction
The utility of postmortem computed tomography (PMCT) has been well documented in the forensic pathology and radiology literature in recent years and research into its utility continue in earnest. A recent article has been published that espouses the practical utility of PMCT (1) and there is great interest in determining if PMCT can supplement or replace traditional autopsy in practice. The decision to implement PMCT in practice is complex, but among the many considerations, forensic pathologists might see the advantages of having additional information to aid their medical decision making and could furthermore appreciate the value of having a complete, independently reviewable dataset of each body coming under their jurisdiction. Legislators and office administrators may appreciate the benefits of the technology in terms of manpower and leverage those advantages in a way that maximizes the value of their increasingly rare forensic pathologists.
Medical examiner/coroner (ME/C) offices utilizing PMCT may have in-house computed tomography (CT) scanners or use hospital/clinical scanners. Policies and actual practices regarding who interprets the PMCT scans vary, but they may be interpreted by a forensic pathologist, a clinical radiologist, or a clinical radiologist with a special interest or training in postmortem imaging. Differences between clinical CT scans and PMCT scans have been well documented and knowledge of these differences, typically those due to postmortem changes, is essential to physicians who interpret PMCT scans so as to decrease the risk of misinterpretation and, therefore, misdiagnoses.
In general, the postmortem changes of lividity or postmortem hypostasis and decomposition can be variably seen on PMCT and will appear differently depending on the tissue or organ examined and on the stage of decomposition. Putrefactive decomposition is usually first appreciated on PMCT as gas production progressing to tissue and organ parenchymal structural loss and then to skeletonization. Not unlike traditional autopsy, postmortem changes detected on PMCT cannot be used to reliably determine the time since death.
Discussion
Subcutaneous Soft Tissues
Livor mortis, or postmortem hypostasis, can be seen in the subcutaneous soft tissues on PMCT in the dependent regions of the body and has features similar to edema, with increased attenuation of the soft tissue and dermis (2,3) and thickening of the dermis when compared to adjacent, nondependent regions of the body.
The subjective extent of rigor mortis and the involved muscle groups is typically assessed by the forensic pathologist at the time of external examination. Lewy et al. stated that there are no specific findings of rigor mortis on PMCT (4). However, Okuma et al. compared the attenuation of the pectoralis major and erector spinae muscles in antemortem (clinical) and PMCT scans of 33 decedents who died of nontraumatic causes and found that the attenuation of these muscles was significantly greater on PMCT compared to the antemortem CT from the same patients (5). They theorized that contraction of skeletal muscle secondary to rigor mortis increases the density of the muscle and thus, increases attenuation on PMCT. It is not clear, however, if increasing the postmortem interval would alter the attenuation of skeletal muscle that was demonstrated in this study. It could also be possible that some of the increased attenuation in the skeletal muscles examined in this study could be due to hypostasis, but the authors did not identify significant differences in attenuation between the two sites of skeletal muscle (one anterior and one posterior) on either antemortem CT or PMCT, given that all decedents were placed supine from the time of death until PMCT. Without any doubt, studying the utility of PMCT to detect rigidity is of little practical value, especially since (at least for the time being) a forensic pathologist is required to physically examine decedent remains. However, being knowledgeable about the possible radiologic correlates of increased postmortem muscle tone/rigidity may aid to prevent overdiagnoses of pathologic findings.
Gas within the subcutaneous soft tissues is readily visible on PMCT and its extent corresponds to the degree and extent of putrefactive decomposition. That said, subcutaneous soft tissue gas may be far more advanced on PMCT than might be appreciated through external and internal examination of decedent remains. Isolated gas may be seen in early decomposition, but care must be taken when assessing these regions for penetrating trauma. In these types of cases, the internal organs, tissues and body cavities should be assessed for gas to assist in determining if the isolated subcutaneous gas is a postmortem artifact or potentially antemortem injury or pathology.
As the process of putrefactive decomposition continues, there will be soft tissue loss until eventual skeletonization; this will be reflected on PMCT as progressive absence of organs and extra-osseous tissues. In addition, significant maggot activity will alter the appearance of tissues and organs and appear as linear and curvilinear soft tissue or surface irregularities of tissue (4).
Central Nervous System
Postmortem hypostasis can be prominent and be present as an increased attenuation in the dural venous sinuses and/or circle of Willis depending on the postmortem positioning of the body (Image 1) (6,7). The “hematocrit effect,” or separation of blood into a high attenuating erythrocyte layer and water attenuating serum layer, may be seen in the larger vessels (7). In a study of 50 patients who had both antemortem and postmortem CT scans, Takahashi et al. found that attenuation in the dorsal part of the superior sagittal sinus increased in 80% of cases and within the transverse sinus or cerebellar tentorium in 48% of cases (8). In addition, Smith et al. described a “lumpy falx” secondary to hyperattenuation of the cortical veins abutting the falx cerebri (7).
Image 1:

Increased cerebral vascular attenuation. Axial noncontrast computed tomography image demonstrating increased attenuation within the posterior, dependent region of the sagittal sinus.
Similar to other organs, the brain will go through progressive decay depending on the duration of the postmortem interval. Autolysis will result in effacement of the gray-white matter junction with blurring and loss of the cortico-medullary junction, decreased cerebral attenuation, and effacement of the sulci and ventricles (4). Levy et al. stated that, in their experience, cerebral autolysis can be identified within 24 to 48 hours after death even if the body has been refrigerated (4); Panda et al. stated that autolysis on PMCT may occur within six hours after death (2).
A retrospective review of 33 postmortem head CT scans with no evidence of trauma and with imaging performed within 72 hours after death showed visualization of the cortical ribbon in 42% of the cases and of the basal ganglia in 91% of the cases. The authors concluded that their results confirmed the need for proper “windowing” (data interpolation) to see the deep gray matter, but did not further elaborate (7). Sieswerda-Hoogendoorn et al. described loss of gray-white matter differentiation in 72-85% of the pediatric population they studied and theorized that this may be due to the differences between the pediatric and adult brain and possibly the length of any resuscitation (9). Christe et al. suggested that the difference of attenuation between the cortex and medulla and the narrowing of the sulci, cisterns, and ventricles on PMCT is due to postmortem hypoxic edema, resulting in brain swelling (6). Similarly, Ishida et al. stated that the ventricles and cisterns are visibly effaced because of mild swelling during the immediate postmortem period (10). It is possible that global hypoxia and ischemia in the immediate perimortem period leads to some degree of brain swelling and the changes seen on PMCT.
Intravascular putrefactive gas is another postmortem change readily identifiable on head CT scans. Gas can be seen within the arterial and venous vasculature and is typically symmetrical (7). The presence of gas within the cerebral vasculature usually accompanies postmortem gas within the systemic vasculature, organs, and tissues. As putrefaction continues, the brain parenchyma collapses to the dependent region of the head; gas can be seen filling the cranial vault and within the spinal canal. Continued putrefactive decomposition will cause the brain to liquefy, acquiring water attenuation with a fluid level within the calvarium (Image 2) (4).
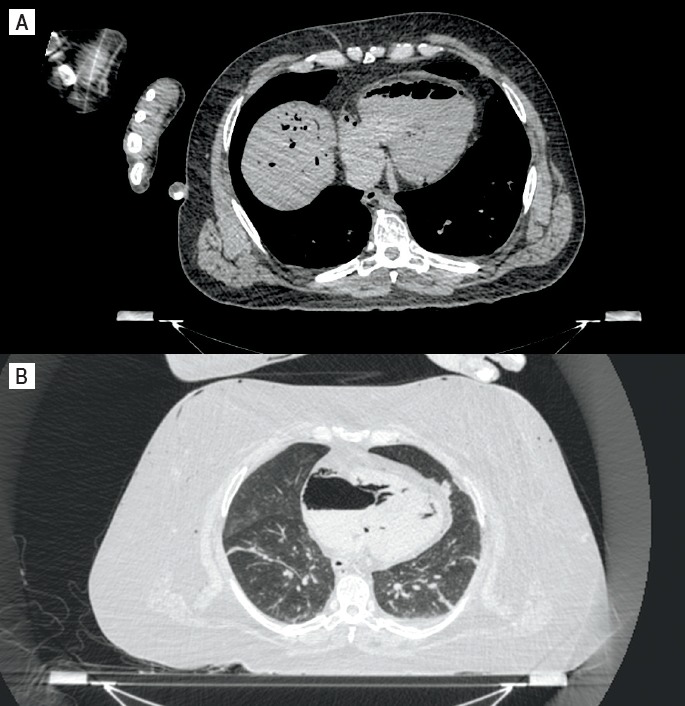
Image 2:

Decomposition pneumocranium. A) Axial noncontrast computed tomography (CT) image demonstrating postmortem gas within the cranial vault, brain parenchyma, and subcutaneous soft tissues. B) Axial noncontrast CT image in lung windows demonstrating moderate decomposition with settling of the brain in the posterior dependent portion of the calvarium. Note the maggots within the left orbit.
Cardiovascular System
Postmortem hypostasis can be very prominent in the heart, aorta, pulmonary arteries, and potentially in any other large caliber artery or vein (Image 3). In the heart, it is most readily seen in the atria presumably because of the decedent being in a supine position (11). Due to the hematocrit effect, fluid levels are seen on PMCT with the high attenuating erythrocyte layer in the most gravity dependent region of the heart or vessel (3,4) and was seen in the heart or great vessels in 52% of 126 consecutive patients who died a nontraumatic death and who were scanned within two hours after death (12).
Image 3:

Hypostasis within the aorta. Axial noncontrast computed tomography image demonstrating hypostasis within the aorta with “hematocrit effect.” The posterior, dependent portion of the aorta has an increased attenuation compared with the superior portion due to the separation of the cellular component of blood and serum.
In addition to hypostasis within the aortic lumen, the aortic wall may also appear hyperattenuated on PMCT. The hyperattenuation is likely secondary to aortic contraction and thickening of the aortic wall, lack of motion artifact, and possibly decreased attenuation of a portion of the aortic luminal contents due to the hematocrit effect (13). Christie et al. suggested that this hyperattenuation could be due to contraction of the aortic wall, luminal loss of pressure, and decreased attenuation of the lumen due to dilution of blood after massive infusion at resuscitation or sedimentation of blood away from the aorta (6). Additionally, Okuma et al. observed an increase in aortic wall thickness when comparing PMCT and antemortem CT on the same patients (14). In a study by Takahashi et al. comparing aortic shape and diameter of the ascending and descending thoracic aorta, and abdominal aorta on antemortem CT and PMCT of the same patient, they showed that the aorta shrunk at all levels and became oval in shape in both the descending thoracic and abdominal portions (15). The authors suggested that the deformation of the descending thoracic and abdominal aorta is due to elasticity and that the anatomical location may cause some compression of the aorta due to surrounding organs.
Egger et al., in a study of the distribution of artifactual gas on postmortem multidetector CT, found that 47% of 119 cases without trauma or invasive medical intervention exhibited gas in the heart cavities and 40% exhibited gas in the liver parenchyma (16). They concluded, therefore, that gas is primarily observed in the deep organs, including the heart and liver, early during the process of putrefactive decomposition. They also stated that gas appeared preferentially in the right heart cavities as compared to the left and occurred in the heart cavities before the parenchyma (Image 4). As mentioned above, intravascular gas due to postmortem putrefactive decomposition tends to be symmetrically distributed throughout the body unless there is focal or asymmetric decomposition (4) and the extent will be dependent on the stage of decomposition and the many variables that affect its progression. Gas embolism has been diagnosed from PMCT scans and subsequently reported in the literature. Determination of the source will be dependent on the circumstances of the death, medical intervention, and the distribution of the gas. It is important to acknowledge that postmortem intravascular gas accumulation is an important and likely mimic of all forms of allegedly pathological gas embolism.
Image 4:
Gas within the right atrium and ventricles. A) Axial noncontrast computed tomography (CT) image demonstrating postmortem gas within the right atrium and ventricle in a nontraumatic death. Note the intrahepatic gas. B) Axial noncontrast CT in lung windows demonstrating predominantly right atrial postmortem gas.
Respiratory System
Livor mortis of the internal organs is most commonly seen, grossly and on PMCT, in the lungs; radiologically, this may be because of the attenuation differences between aerated lung and the pulmonary vasculature (4). Typically, there is increased attenuation of the dependent regions of the lungs (17,18) and ground glass opacification of the dependent regions with a horizontal, gravity dependent, bilateral demarcation line if supine (Image 5) (6,10). Histologically, dependent density correlated with congestion of the pulmonary vasculature and ground glass opacification as pulmonary edema (17,18). Pulmonary edema forms in the postmortem period due to a pressure gradient between the pulmonary vasculature and the alveoli, and alteration of capillary permeability (19). In addition, according to a study by Shiotani et al. comparing to immediate PMCT of the lung, delayed PMCT showed advanced dependent opacity and appearance of consolidation corresponding to congestive pulmonary edema (20). Interestingly, Ishida et al. suggested that the postmortem transudation of fluid into the interstitial spaces and alveoli may result in leakage of fluid into the pleural cavity (21). However, in a study by Levy et al., the volume of pleural effusion (interpreted to mean the postmortem accumulation of fluid in the pleural cavity and not an active antemortem process) was quite small on PMCT performed two to 12 days after drowning deaths, suggesting that the postmortem fluid accumulation due to the dependent movement of fluid may not occur (22). Klein et al., in a paper describing normal pediatric PMCT appearances, stated that the volumes of the lungs decrease and fluid becomes visible in the intrapulmonary septa (3).
Image 5:

Lung hypostasis. A and B, Axial noncontrast computed tomography image in lung windows demonstrating posterior, dependent hypostasis and ground glass opacification with an almost linear demarcation.
Fluid in the pharynx, trachea, and mainstem bronchi can be a normal finding on PMCT (Image 6) (3). Ishida et al. suggested that dependent hypostasis may result in the movement of blood-derived fluid from the pulmonary vasculature into the interstitial spaces and alveoli, and this fluid may flow sequentially upstream to the trachea over time (21). They noted that 1) fluid in the airway is more frequently observed in those individuals with pleural effusions or atelectasis/pulmonary consolidation because of the decreased volume of aerated lung parenchyma and that 2) the volume of airway fluid increased over time regardless of the presence or absence of pleural effusions. However, although the authors stated that they did not account for the possibility that the fluid was derived from the oral cavity, the possibility that the fluid seen in the airways on PMCT represented purge fluid from the gastrointestinal tract was also not addressed. Additionally, it would seem logical that the finding of fluid in the airways would also be dependent on the position of the body after death.
Image 6:

Fluid in the airway. A and B, Axial noncontrast computed tomography image in soft tissue (A) and lung (B) windows demonstrating an air-fluid level within the trachea of this nontraumatic, non-drowning death.
A study of normal cranial PMCT findings in children by Sieswerda-Hoogendoorn et al. found sedimentation in the frontal sinus in 30% and maxillary sinus in 34-40% of the 68 pediatric nondrowning cases they studied and considered it to be a normal postmortem finding (9). It is important to note that this study looked at PMCTs of nondrowning cases; fluid can be seen in the sinuses in bodies found in water, so this finding must be taken in context.
Hepatobiliary and Gastrointestinal Systems
Livor mortis can be visualized within the liver (albeit less commonly than in the lungs) as a vertical attenuation gradient with increasing attenuation from the nondependent to the dependent portions of the liver, and may be seen in the spleen and kidneys (24).
According to Levy et al., the intestinal wall and mesenteric and portal venous systems are generally the first sites of putrefactive gas on PMCT in addition to distention of the small and large intestines (4). This was confirmed in a study by Charlier et al. assessing normal cadaveric changes visualized with postmortem abdominal CT scans in which they stated that putrefactive gas begins with intravascular gas formation and proceeds to gaseous distention of all anatomic spaces, small and large bowels, organs, and soft tissues (24). Egger et al. demonstrated that postmortem gas forms in a consistent distribution pattern and that, after the heart and liver, the second most likely site to contain putrefactive gas was the deep abdominal vessels (both veins and arteries) related to the digestive system (16).
Fischer et al. described PMCT findings of intrahepatic gas development and liver parenchyma changes of nontraumatic deaths (N=5) scanned once per hour over a 24 hour period and found that hepatic portal venous gas is a common finding on PMCT and that the largest amount of intrahepatic gas (IHG) was found in the hepatic venous system (25), similar to a study by Jackowski et al. (23). In their study, Jackowski et al. found that of the 47 cases in which they found IHG, putrefaction was the cause in five; they ultimately concluded that the IHG is a frequent finding in traumatic causes of death and required a systemic gas embolism (23). However, Fischer et al. suggested that IHG could arise from the gastrointestinal tract and move into the venous system which seems plausible in the nontraumatic deaths studied (25). In both studies, it is inferred that IHG is used to mean intravascular gas; Fischer et al. went on to state, then, that gas accumulation due to putrefaction would be expected primarily in the liver parenchyma and not within the hepatic veins (25). However, in this study, the number of cases studied was small and, although one of the inclusion criteria was that they must have received the body less than 24 hours after being found, they estimated postmortem interval using core body temperature and livor and rigor mortis, which are known to be unreliable and did not account for how long the body may have been on scene prior to discovery. What seems to be the take-home message is that hepatic intravascular gas is a common finding on PMCT and its etiology must be considered in the context of the case (Image 7).
Image 7:

Intrahepatic gas. Axial noncontrast computed tomography image demonstrating gas within predominantly the hepatic vasculature of the anterior, nondependent regions of the liver. Note the large amount of gas collection in the adjacent stomach.
Gas distention of the gastrointestinal (GI) tract is a typical postmortem finding secondary to continued gas production by enteric bacteria in the postmortem time period (Image 8) (2, 3, 26). Others suggest cardiopulmonary resuscitation may also contribute to the formation of gas in the gastrointestinal tract (10). In a study of 190 PMCTs obtained within two hours of a nontraumatic death, Shiotani et al. found a correlation between the severity of GI distention on PMCT and the grade of hepatic portal venous gas collection (27). Similarly, in a study to evaluate intrahepatic gas on PMCT, Takahashi et al. reviewed 208 nontraumatic PMCTs and found a correlation between the occurrence of intestinal distention and intrahepatic gas (28). However, this study did not clearly define if intrahepatic gas referred to parenchymal gas, intravascular gas, or both.
Image 8:

Gastrointestinal tract distention. Axial noncontrast computed tomography image in lung windows demonstrating postmortem gastrointestinal gas distention in this individual who did not receive cardiopulmonary resuscitation.
Ishida et al. also described intramural (intestinal wall) gas in the GI tract as a normal postmortem change on PMCT and attributed its presence to ischemia in the perimortem period resulting in increased mucosal permeability to gas (10).
Levy et al. stated that in their experience, the CT attenuation of solid visceral organs such as the liver, spleen, and kidneys do not change until advanced decomposition when the organs begin to fragment, degenerate, and liquefy (4). Levy et al. and Charlier et al. both stated that although the adrenal glands and pancreas are the earliest abdominal organs to undergo autolysis, they generally have a normal appearance on PMCT until putrefactive gas is present (4,24).
Body Cavities
It has been well established that as putrefactive decomposition progresses, gas can accumulate in any of the tissues, organs and body cavities (3, 4, 29, 30). In the body cavities, this may be most prominent as pneumothoraces and pneumoperitoneum (Image 9). Similarly, decompositional fluid can also accumulate in the body cavities (4). In the pediatric population, Klein et al. described that small amounts of free peritoneal fluid in the mesentery, paracolic space, or pelvis is normally present within several hours after death (3). Unfortunately, delineation of the fluid seen in the body cavities can be problematic. In a study of the radiodensities of body cavity fluid on PMCT, Zech et al. found that at a postmortem interval of a few days, the serous body fluids and blood retain Hounsfield unit (HU) values that are similar to the known HU values of these fluids in the living (31). Decompositional fluid, however, fell within a broad range of HU measurements and overlapped the ranges detected for blood and serous fluid, and was not useful for differentiating decompositional fluid and body fluids.
Image 9:

Moderate decomposition. A) Axial noncontrast computed tomography (CT) image of the thorax in lung windows demonstrating postmortem gas throughout the soft tissues and organs. Note the maggots on the anterior skin surface, the large collection of gas within the pericardial sac, the postmortem pneumothoraces, and the homogeneous decompositional fluid within the posterior dependent regions of the thorax. B) Axial noncontrast CT image of the abdomen in lung windows demonstrating postmortem intrahepatic gas, gaseous distention of the stomach, pneumoperitoneum, and homogeneous decompositional fluid within the posterior dependent regions of the abdominal cavity.
Other
In the mummified state, PMCT shows collapse of connective tissues and organs (24). Charred bodies may show, depending on the degree of charring and soft tissue loss (32), irregular organ margins reflecting searing and charring, and organ shrinkage (24).
Conclusion
The use and implementation of PMCT is transforming the practice of forensic pathology throughout the world. Interpreting a PMCT scan differs from interpreting an antemortem CT and radiologists and pathologists must be aware of these differences. Some of these differences arise due to typical postmortem changes such as livor mortis and putrefactive decomposition. It is incumbent on the reader of a PMCT scan to document these changes and interpret them in the context of the case to ensure misinterpretation and, thus, misdiagnoses, do not occur.
ACKNOWLEDGEMENT
The author would like to thank Dr. Evan Matshes for his invaluable review and suggestions. My experience with PMCT would not have been possible without the support of the New Mexico Office of the Medical Investigator.
Footnotes
Financial Disclosure
The author has indicated that he does not have financial relationships to disclose that are relevant to this manuscript
ETHICAL APPROVAL
As per Journal Policies, ethical approval was not required for this manuscript
STATEMENT OF HUMAN AND ANIMAL RIGHTS
This article does not contain any studies conducted with animals or on living human subjects
STATEMENT OF INFORMED CONSENT
No identifiable personal data were presented in this manuscsript
DISCLOSURES & DECLARATION OF CONFLICTS OF INTEREST
The author, reviewers, editors, and publication staff do not report any relevant conflicts of interest
References
- 1.Matshes E.W., Snyder V.S., Andrews S.W. Utilitarian aspects of postmortem computed tomography. Acad Forensic Pathol. 2015. Dec; 5(4): 603–13. [Google Scholar]
- 2.Panda A., Kumar A., Gamanagatti S., Mishra B. Virtopsy computed tomography in trauma: normal postmortem changes and pathologic spectrum of findings. Curr Probl Diagn Radiol. 2015. Sep-Oct; 44(5): 391–406. PMID: 25956952. 10.1067/j.cpradiol.2015.03.005. [DOI] [PubMed] [Google Scholar]
- 3.Klein W.M., Bosboom D.G., Koopmanschap D.H. et al. Normal pediatric postmortem CT appearances. Pediatr Radiol. 2015. Apr; 45(4): 517–26. PMID: 25828355. 10.1007/s00247-014-3258-8. [DOI] [PubMed] [Google Scholar]
- 4.Levy A.D., Harcke H.T., Mallak C.T. Postmortem imaging: MDCT features of postmortem change and decomposition. Am J Forensic Med Pathol. 2010. Mar; 31(1): 12–7. PMID: 20010292. 10.1097/paf.0b013e3181c65e1a. [DOI] [PubMed] [Google Scholar]
- 5.Okuma H., Gonoi W., Ishida M. et al. Comparison of attenuation of striated muscle between postmortem and antemortem computed tomography: results of a longitudinal study. PLos One. 2014. Nov 3; (9)11: e111457 PMID: 25365255. PMCID: PMC4218726. 10.1371/journal.pone.0111457. [DOI] [PMC free article] [PubMed] [Google Scholar]
- 6.Christe A., Flach P., Ross S. et al. Clinical radiology and postmortem imaging (Virtopsy) are not the same: Specific and unspecific postmortem signs. Leg Med (Tokyo). 2010. Sep; 12(5): 215–22. PMID: 20630787. 10.1016/j.legalmed.2010.05.005. [DOI] [PubMed] [Google Scholar]
- 7.Smith A.B., Lattin G.E. Jr., Berran P., Harcke H.T. Common and expected postmortem CT observations involving the brain: mimics of antemortem pathology. AJNR Am J Neuroradiol. 2012. Aug; 33(7): 1387–91. PMID: 22492568. 10.3174/ajnr.a2966. [DOI] [PMC free article] [PubMed] [Google Scholar]
- 8.Takahashi N., Satou C., Higuchi T. et al. Quantitative analysis of intracranial hypostasis: comparison of early postmortem and antemortem CT findings. AJR Am J Roentgenol. 2010. Dec; 195(6): W388–93. PMID: 21098169. 10.2214/ajr.10.4442. [DOI] [PubMed] [Google Scholar]
- 9.Sieswerda-Hoogendoorn T., Beenen L.F., van Rijn R.R. Normal cranial postmortem CT findings in children. Forensic Sci Int. 2015. Jan; 246: 43–9. PMID: 25437903. 10.1016/j.forsciint.2014.10.036. [DOI] [PubMed] [Google Scholar]
- 10.Ishida M., Gonoi W., Okuma H. et al. Common postmortem computed tomography findings following atraumatic death: differentiation between normal postmortem changes and pathologic lesions. Korean J Radiol. 2015. Jul-Aug; 16(4): 798–809. PMID: 26175579. PMCID: PMC4499544. 10.3348/kjr.2015.16.4.798. [DOI] [PMC free article] [PubMed] [Google Scholar]
- 11.Ishida M., Gonoi W., Hagiwara K. et al. Hypostasis in the heart and great vessels of non-traumatic in-hospital death cases on postmortem computed tomography: relationship to antemortem blood tests. Leg Med (Tokyo). 2011. Nov; 13(6): 280–5. PMID: 22000062. 10.1016/j.legalmed.2011.09.004. [DOI] [PubMed] [Google Scholar]
- 12.Shiotani S., Kohno M., Ohashi N. et al. Postmortem intravascular high-density fluid level (hypostasis): CT findings. J Comput Assist Tomogr. 2002. Nov-Dec; 26(6): 892–3. PMID: 12488731. 10.1097/00004728-200211000-00006. [DOI] [PubMed] [Google Scholar]
- 13.Shiotani S., Kohno M., Ohashi N. et al. Hyperattenuating aortic wall on postmortem computed tomography (PMCT). Radiat Med. 2002. Jul-Aug; 20(4): 201–6. PMID: 12296437. [PubMed] [Google Scholar]
- 14.Okuma H., Gonoi W., Ishida M. et al. Greater thickness of the aortic wall on postmortem computed tomography compared with antemortem computed tomography: the first longitudinal study. Int J Legal Med. 2014. Nov; 128(6): 987–93. PMID: 24352561. 10.1007/s00414-013-0955-z. [DOI] [PubMed] [Google Scholar]
- 15.Takahashi N., Higuchi T., Hirose Y. et al. Changes in aortic shape and diameters after death: comparison of early postmortem computed tomography with antemortem computed tomography. Forensic Sci Int. 2013. Feb 10; 225(1-3): 27–31. PMID: 22656269. 10.1016/j.forsciint.2012.04.037. [DOI] [PubMed] [Google Scholar]
- 16.Egger C., Bize P, Vaucher P. et al. Distribution of artifactual gas on post-mortem multidetector computed tomography (MDCT). Int J Legal Med. 2012. Jan; 126(1): 3–12. PMID: 21207230. 10.1007/s00414-010-0542-5. [DOI] [PubMed] [Google Scholar]
- 17.Hyodoh H., Shimizu J., Watanabe S. et al. Time-related course of pleural space fluid collection and pulmonary aeration on postmortem computed tomography (PMCT). Leg Med (Tokyo). 2015. Jul; 17(4): 221–5. PMID: 25657038. 10.1016/j.legalmed.2015.01.002. [DOI] [PubMed] [Google Scholar]
- 18.Shiotani S., Kohno M., Ohashi N. et al. Non-traumatic postmortem computed tomographic (PMCT) findings of the lung. Forensic Sci Int. 2004. Jan 6; 139(1): 39–48. PMID: 14687772. 10.1016/j.forsciint.2003.09.016. [DOI] [PubMed] [Google Scholar]
- 19.Durlacher S.H., Banfield W.G. Jr., Bergner A.D. Post-mortem pulmonary edema. Yale J Biol Med. 1950. Jul; 22(6): 565–72. PMID: 15431685. PMCID: PMC2599206. [PMC free article] [PubMed] [Google Scholar]
- 20.Shiotani S., Kobayashi T., Hayakawa H. et al. Postmortem pulmonary edema: a comparison between immediate and delayed postmortem computed tomography. Leg Med (Tokyo). 2011. May; 13(3): 151–5. PMID: 21315646. 10.1016/j.legalmed.2010.12.008. [DOI] [PubMed] [Google Scholar]
- 21.Ishida M., Gonoi W., Hagiwara K. et al. Fluid in the airway of nontraumatic death on postmortem computed tomography: relationship with pleural effusion and postmortem elapsed time. Am J Forensic Med Pathol. 2014. Jun; 35(2): 113–7. PMID: 24781399. 10.1097/paf.0000000000000083. [DOI] [PubMed] [Google Scholar]
- 22.Levy A.D., Harke H.T., Getz J.M. et al. Virtual autopsy: two- and three-dimensional multidetector CT findings in drowning with autopsy comparison. Radiology. 2007. Jun; 243(3): 862–8. PMID: 17517939. 10.1148/radiol.2433061009. [DOI] [PubMed] [Google Scholar]
- 23.Jackowski C., Sonnenschein M., Thali M.J. et al. Intrahepatic gas at postmortem computed tomography: forensic experience as a potential guide for in vivo trauma imaging. J Trauma. 2007. Apr; 62(4): 979–88. PMID: 17426557. 10.1097/01.ta.0000198733.22654.de. [DOI] [PubMed] [Google Scholar]
- 24.Charlier P., Carlier R., Roffi F. et al. Postmortem abdominal CT: assessing normal cadaveric modifications and pathological processes. Eur J Radiol. 2012. Apr; 81(4): 639–47. 10.1016/j.ejrad.2011.01.054. [DOI] [PubMed] [Google Scholar]
- 25.Fischer F., Grimm J., Kirchhoff C. et al. Postmortem 24-h interval computed tomography findings on intrahepatic gas development and changes of liver parenchyma radiopacity. Forensic Sci Int. 2012. Jan 10; 214(1-3): 118–23. PMID: 21862251. 10.1016/j.forsciint.2011.07.033. [DOI] [PubMed] [Google Scholar]
- 26.Singh M.K., O'Donnell C., Woodford N.W. Progressive gas formation in a deceased person during mortuary storage demonstrated on computed tomography. Forensic Sci Med Pathol. 2009; 5(3): 236–42. PMID: 19669956. 10.1007/s12024-009-9103-y. [DOI] [PubMed] [Google Scholar]
- 27.Shiotani S., Kohno M., Ohashi N., Y et al. Postmortem computed tomographic (PMCT) demonstration of the relation between gastrointestinal (GI) distension and hepatic portal venous gas (HPVG). Radiat Med. 2004. Jan-Feb; 22(1): 25–9. PMID: 15053172. [PubMed] [Google Scholar]
- 28.Takahashi N., Higuchi T., Shiotani M. et al. Intrahepatic gas at postmortem multislice computed tomography in cases of nontraumatic death. Jpn J Radiol. 2009. Aug; 27(7): 264–8. PMID: 19714434. 10.1007/s11604-009-0337-0. [DOI] [PubMed] [Google Scholar]
- 29.Gebhart F.T., Brogdon B.G., Zech W.D. et al. Gas at postmortem computed tomography–an evaluation of 73 non-putrefied trauma and non-trauma cases. Forensic Sci Int. 2012. Oct 10; 222(1-3): 162–9. PMID: 22721934. 10.1016/j.forsciint.2012.05.020. [DOI] [PubMed] [Google Scholar]
- 30.Thali M.J., Yen K., Schweitzer W. et al. Into the decomposed body—forensic digital autopsy using multislice-computed tomography. Forensic Sci Int. 2003. Jul 8; 134(2-3): 109–14. PMID: 12850403. 10.1016/s0379-0738(03)00137-3. [DOI] [PubMed] [Google Scholar]
- 31.Zech W.D., Jackowski C., Buetikofer Y., Kara L. Characterization and differentiation of body fluids, putrefaction fluid, and blood using Hounsfield unit in postmortem CT. Int J Legal Med. 2014. Sep; 128(5): 795–802. PMID: 24903128. 10.1007/s00414-014-1030-0. [DOI] [PubMed] [Google Scholar]
- 32.Thali M.J., Yen K., Plattner T. et al. Charred body: virtual autopsy with multi-slice computed tomography and magnetic resonance imaging. J Forensic Sci. 2002. Nov; 47(6): 1326–31. PMID: 12455658. [PubMed] [Google Scholar]