

Abstract
Background
The bacterial load of Chlamydia trachomatis (CT) is assumed to play a role in transmission and sequelae. We assessed urogenital CT cycle quantification (Cq) values, as an indicator for CT load, of men and women diagnosed by general practitioners (GPs), hospital physicians and the STI clinic.
Methods
Urogenital CT-positive samples (n = 2,055 vaginal swabs, n = 77 cervical swabs, n = 1,519 urine samples and n = 19 urethral swabs) diagnosed by GPs, hospital physicians and the STI clinic from the Maastricht Medical Microbiology Laboratory were included (2012–2016). The outcome measure ‘urogenital Cq values’ was used as an inversely proportional measure for CT load. Among all patients, multivariate linear regression analyses were used to assess primary determinants for mean urogenital Cq values, stratified by sex. Additional clinical determinants were assessed among STI clinic patients.
Results
In men, mean urogenital Cq values were similar between GPs, hospital physicians and the STI clinic (32.7 and 33.5 vs. 32.7; p>0.05). Women visiting the GP had lower urogenital Cq values than women visiting the STI clinic (30.2 vs. 30.9; p = <0.001). Women visiting the hospital had higher urogenital Cq values than women visiting the STI clinic (32.4 vs. 30.9; p = <0.001). Among STI clinic women, urogenital Cq values were lower in women with concurrent anorectal CT and in rectally untested women compared to anorectal CT-negative women (30.7 and 30.6 vs. 33.9; p = <0.001).
Conclusion
Men visiting different STI care providers had similar urogenital Cq values, which could be an indicator for similar CT loads. The lower Cq values of women visiting the GP compared to women visiting the STI clinic could be an indicator for higher CT loads and likely higher transmission potential. Notably, urogenital Cq values of STI clinic women were much lower (>3 Cq) when STI clinic women also had anorectal CT. This finding could indicate higher urogenital CT loads and likely higher chances of transmission and sequelae.
Introduction
Chlamydia trachomatis (CT) is the most prevalent bacterial sexual transmitted infection (STI) worldwide [1]. CT infection can increase the risk of reproductive sequelae in women, such as pelvic inflammatory disease, infertility, and ectopic pregnancy [2].
In several countries, such as Australia, the United Kingdom and the Netherlands, general practitioners (GPs) have a significant role in STI healthcare, as a large proportion of CT infections are diagnosed by GPs [3–6]. Other STI care providers include STI clinics, genitourinary medicine (GUM) clinics and hospital physicians [5, 7, 8]. STI care providers test different populations of patients. Studies have shown differences in age, sex, race and socioeconomic (SES) characteristics of patients visiting different STI care providers [7–9]. CT-positive patients visiting different STI care providers also differ in characteristics such as age, sex, race and SES [7, 8]. Potentially CT-positive patients of different STI care providers also differ in CT bacterial load (hereafter CT load).
The CT load, often expressed as the number of CT bacteria present per milliliter, has been studied over several years [10]. An earlier report by our study group showed comparable urogenital CT load in men and women participating in a Dutch population-based CT screening and STI clinic visitors, arguing similar chances of transmission and sequelae [11]. Previous studies assessing CT load included separate patient populations of STI care providers, such as the STI clinic and GPs [10, 12–14]. Nevertheless, GP, hospital and STI clinic patient populations have never before been compared regarding CT load. Comparing the CT load of patients visiting different STI care providers could expand our understanding of CT-infected patient populations served by our STI care services.
Currently, it is not known what determines a high bacterial CT load in a patient and what its consequences are. Symptoms might be associated with a higher CT load but this remains a matter of debate [10]. It could be relevant to assess determinants for high CT loads. For example, in viral STIs, such as herpes simplex virus and human immunodeficiency virus (HIV), it has been shown that higher viral loads increase transmission potential [10]. However, it is unknown whether this also applies to CT load [10].
Concurrent urogenital and anorectal infections are common among women visiting the STI clinic, i.e. more than 70% of women with urogenital infections also have an anorectal infection [15, 16]. Current guidelines advocate anorectal testing in women based on indication, i.e. after self-report of anal sex and/or symptoms [15]. However, as GPs rarely test women anorectally it remains unknown whether anorectal infections are common among women visiting the GP [17].
Our main objective was to compare the urogenital CT Cq values, as an indicator for CT load, between CT-positive patients tested by GPs, hospital physicians and the STI clinic to obtain more insight in the CT loads of different populations. Our second objective was to assess which clinical determinants were associated with urogenital Cq values.
Methods and materials
Ethics statement
The medical ethics committee of the Maastricht University Medical Center (Maastricht, the Netherlands) approved this study (METC 2017–0251) and waived the need for consent to be collected from participants. Since retrospective data originated from regular care and were analyzed anonymously, no further informed consent for data analysis was obtained.
Study population
In this cross-sectional study, data from 3,899 test consultations of urogenital CT-positive patients ≥16 years (from n = 38,599 consultations; 10.1% CT positive) were obtained from the Medical Microbiology Laboratory of Maastricht University Medical Center (MUMC+) from January 2012 through May 2016. Data included consultations performed by GPs, hospital physicians and the STI clinic. The majority of hospital consultations were performed by gynecologists (42,5%; n = 48) followed by internists (22.1%; n = 25). The proportions of urogenital CT tests performed by the GP, hospital physicians and STI clinic do not reflect the real distribution of STI care provider testing in our region, as we included different geographic serving areas for the STI care providers.
The laboratory provides the same instruction methods for collecting CT samples for GPs, hospital physicians and STI clinic using the same sampling materials. The CT samples were daily transported to the laboratory. All samples were collected in a standardized way and were analyzed in the same laboratory.
All samples were tested for CT with a nucleic acid amplification test (NAAT) (COBAS 4800, Roche Diagnostics, Basel, Switzerland), as per the manufacturer’s protocol [11]. The NAAT-derived cycle quantification (Cq) value is commonly used as a proxy for bacterial load in other infectious diseases; a low Cq value indicates a high load, and vice versa [18–20].
The study population included data from all samples for which the Cq value could be retrieved (98.0%; 3,821/3,899) (Fig 1). For men, data from urine and urethral swabs were available. Mean Cq values from urine (n = 1,519, M = 32.69, SD = 3.20) and urethral swabs (n = 19, M = 32.88, SD = 4.80) were comparable in men (p = 0.86). These data were merged together as ‘urogenital Cq values’.
Fig 1. Flowchart, including Chlamydia trachomatis samples taken by general practitioners, hospital physicians and the STI clinic between January 2012 and May 2016.
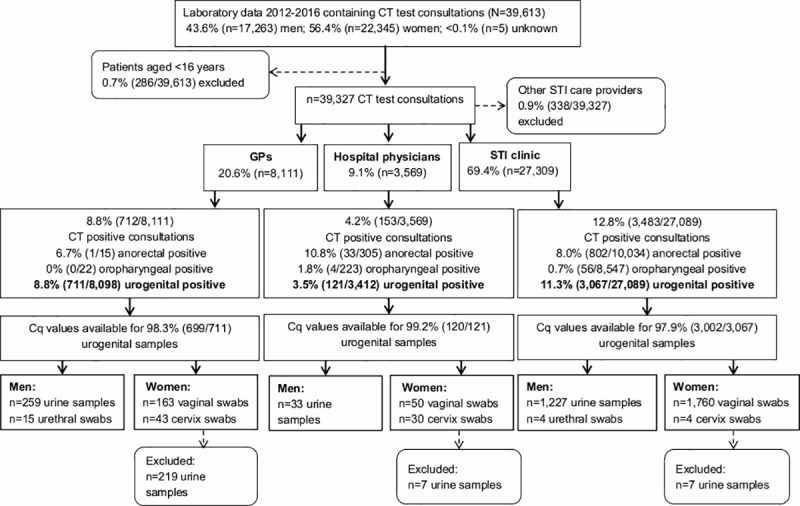
For women, data from urine, vaginal swabs and cervix swabs were available. Mean Cq values from vaginal swabs (n = 1,973, M = 30.86, SD = 3.73) and cervix swabs (n = 77, M = 30.58, SD = 4.24) were comparable in women (p = 0.51). The data were merged together as ‘urogenital Cq values’. Mean Cq values from vaginal swabs (n = 1,973, M = 30.86, SD = 3.73) and urine (n = 233, M = 33.28, SD = 3.60) were significantly different (p = <0.001). Data from urine samples of women were excluded (n = 233), as international guidelines advocate vaginal swabs, as the diagnostic value (sensitivity and specificity) for detecting CT in urine samples is lower compared to vaginal swabs [21–24]. The majority of urine samples from women were taken by GPs (94%; Fig 1).
Cycle quantification validation for CT load
We tested the use of the Cq value as a proxy for CT load by comparing derived Cq values with quantified CT load values from our previous studies [11, 25, 26]. CT load values were available from a subset of the STI clinic population, i.e. n = 103 vaginal swabs from women (S1 Table). In short, we quantified CT load by an in-house TaqMan real-time qPCR to quantify CT OmpA-gene copies/ml [11]. A full description of the CT load quantification has been described elsewhere [11].
S1 Fig shows the high correlation between vaginal Cq values and vaginal CT load (CT/ml log10) (Pearson’s r: -0.80, n = 103, p = <0.001). Therefore, the Cq value is a valid inversely proportional proxy for CT load.
Statistical analyses
The main objective was to compare the outcome measure, i.e. ‘urogenital Cq values’, between the populations visiting different STI care providers. Therefore, the main determinant was STI care provider (GP, hospital physician, or STI clinic).
Analyses were stratified for men and women since CT load varies by sample type and sex [10]. Baseline characteristics were compared between the GP, hospital physician and the STI clinic CT-positive populations using chi-square tests. Univariable and multivariable linear regression analyses were performed to test the association between the main determinant and the outcome, controlling for putative confounders. The putative confounders were available for the whole study population and included age in years (<25, ≥25), SES (low, medium, high, unknown), Neisseria gonorrhoeae (NG) urogenital positive (yes, no, not tested) and HIV positivity (yes, no, not tested). Dutch SES scores based on income, education level and employment were extracted from the Netherlands Institute for Social Research (http://www.scp.nl) per four-digit postal code area of the patient.
Our second objective was to assess potential associations between the outcome measure and clinical determinants (available for the STI clinic population), including concurrent anorectal CT infection (no anorectal test, yes, no), urogenital symptoms (unknown, yes, no), oropharyngeal symptoms (unknown, yes, no), proctitis (unknown, yes, no) and, for men, sexual preference (unknown, MSM, heterosexual men).
For all linear regression analyses, determinants with p<0.05 in the univariable model were included in the multivariable model. To test our main objective, the main determinant ‘STI care provider’ was entered in the multivariable model. Means, betas and 95% confidence intervals (CI) were calculated. Finally, the proportions of low and high Cq values were assessed between the STI care providers based on quartiles and are depicted in Fig 2. Analyses were performed using SPSS V21 (IBM SPSS Statistics for Windows, IBM Corporation, Armonk, New York, USA). A p value of <0.05 was considered statistically significant.
Fig 2. Boxplots and bar diagrams showing the distribution of high- and low Cq values for the GP, hospital and STI clinic population.
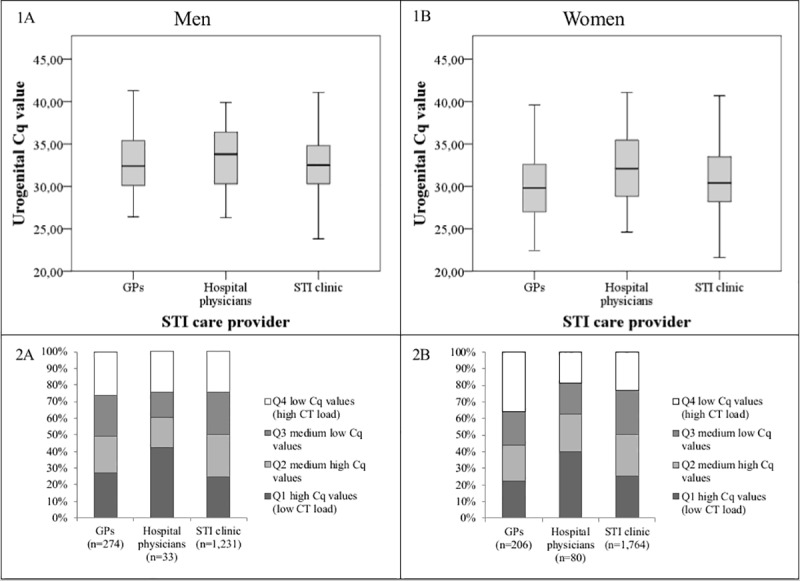
(1) Boxplots showing the distribution of urogenital Cq values between the GP, hospital physicians and STI clinic population for men (A) and women (B). (2) Bar diagrams showing the frequencies of low (high CT load), medium low, medium high and high (low CT load) urogenital Cq values based on quartiles per STI provider for men (A) and women (B).
Results
Study population
Of the 3,588 urogenital samples in the dataset, 42.9% (n = 1,538) were samples from men, and 57.1% (n = 2,050) were samples from women. Baseline characteristics (age, SES, NG and HIV) differed between the CT-positive populations visiting GPs, hospital physicians and the STI clinic in both men and women (Table 1).
Table 1. Baseline characteristics of urogenital Chlamydia trachomatis-positive patient populations visiting the general practitioner, hospital physician or STI clinic for men and women separately, 2012–2016.
| Men | Women | |||||||
|---|---|---|---|---|---|---|---|---|
| GP (n = 274) |
Hospital physicians (n = 33) | STI clinica (n = 1,231) |
P-value | GP (n = 206) | Hospital physicians (n = 80) | STI clinica (1,764) |
P-value | |
| Age in years, % (n) | <0.001 | <0.001 | ||||||
| <25 | 37.2 (102) | 15.2 (5) | 58.1 (715) | 52.9 (109) | 55.0 (44) | 81.6 (1,440) | ||
| ≥25 | 62.8 (172) | 84.8 (28) | 41.9 (516) | 47.1 (97) | 45.0 (36) | 18.4 (324) | ||
| SES, % (n) | <0.001 | <0.001 | ||||||
| Low | 32.8 (90) | 24.2 (8) | 27.1 (333) | 35.4 (73) | 40.0 (32) | 27.1 (478) | ||
| Medium | 32.1 (88) | 33.3 (11) | 28.2 (347) | 30.1 (62) | 30.0 (24) | 25.3(446) | ||
| High | 32.1 (88) | 39.4 (13) | 30.5 (376) | 32.0 (66) | 27.5 (22) | 35.2 (621) | ||
| Unknown | 2.9 (8) | 3.0 (1) | 14.2 (175) | 2.4 (5) | 2.5 (2) | 12.4 (219) | ||
| NG urogenital positive | <0.001 | <0.001 | ||||||
| Yes | 4.0 (11) | 21.2 (7) | 19.5 (240) | 3.9 (8) | 2.5 (2) | 9.3 (164) | ||
| No | 84.3 (231) | 78.8 (26) | 80.5 (991) | 77.2(159) | 82.5 (66) | 90.7 (1,600) | ||
| Not tested | 11.7 (32) | 0.0 (0) | 0.0 (0) | 18.9 (39) | 15.0 (12) | 0.0 (0) | ||
| HIV positive | <0.001 | <0.001 | ||||||
| Yes | 1.5 (4) | 51.5 (17) | 4.2 (52) | 1.5 (3) | 6.3 (5) | 0.2 (4) | ||
| No | 49.6 (136) | 21.2 (7) | 67.3 (828) | 10.2 (21) | 5.0 (4) | 54.8 (966) | ||
| Not tested | 48.9 (134) | 27.3 (9) | 28.5 (351) | 88.3 (182) | 88.8 (71) | 45.0 (794) | ||
a The STI clinic comprised a larger geographic area. Therefore, the data are not applicable for comparing the proportions of CT testing between STI care providers.
Abbreviations: GP, general practitioner; STI, sexually transmitted infection; SES, socioeconomic status; NG, Neisseria gonorrhoeae; HIV, human immunodeficiency virus.
Urogenital Cq values of CT patients compared between STI care providers
In multivariable analyses, mean urogenital Cq values were similar in men diagnosed by GPs (M = 32.7, SD 3.2), hospital physicians (M = 33.5, SD = 3.5) and the STI clinic (M = 32.7, SD = 3.2) (p = 0.36) (Fig 2 and Table 2). Based on quartiles, the proportions of low urogenital Cq values were similar among men visiting GPs (26.3%), hospital physicians (24.2%) and the STI clinic (24.2%) (Fig 2).
Table 2. Primary analyses, including determinants associated with urogenital Chlamydia trachomatis cycle quantification threshold values for men and women.
| Men | Women | |||||||
|---|---|---|---|---|---|---|---|---|
| % (n) | Mean Cq value (SD) | B (95% CI) | Adj. B (95% CI) | % (n) | Mean Cq value (SD) | B (95% CI) | Adj. B (95% CI) | |
| Overall | 100 (1,538) | 32.7 (3.2) | 100 (2,050) | 31.1 (3.8) | ||||
| STI care provider | ||||||||
| GP | 17.8 (274) | 32.7 (3.2) | 0.09 (-0.34–0.51) | 0.22 (-0.26–0.70) | 10.0 (206) | 30.2 (4.2) | -0.68 (-1.21–-0.14) | -0.95 (-1.61–-0.29) |
| Hospital physicians | 2.1 (33) | 33.5 (3.5) | 0.80 (-0.32–1.91) | 0.38 (-0.80–1.56) | 3.9 (80) | 32.4 (4.3) | 1.42 (0.58–2.26) | 1.08 (0.15–2.01) |
| STI clinic | 80.0 (1,231) | 32.7 (3.2) | Ref | Ref | 86.0 (1,764) | 30.9 (3.7) | Ref | Ref |
| Age in years | ||||||||
| <25 | 53.4 (822) | 32.5 (3.1) | -0.51 (-0.83– -0.19) | -0.37(-0.70–0.03) | 77.7 (1,593) | 30.6 (3.7) | -1.10 (-1.49 –-0.72) | -1.17 (-1.57– -0.77) |
| ≥25 | 46.6 (716) | 33.0 (3.) | Ref | Ref | 22.3 (457) | 31.7 (3.9) | Ref | Ref |
| SES | ||||||||
| Low | 28.0 (431) | 32.9 (3.3) | Ref | 28.4 (583) | 31.0 (3.8) | Ref | ||
| Medium | 29.0 (446) | 32.7 (3.2) | -0.15 (-0.58–0.28) | 26.0 (532) | 30.9 (3.7) | -0.10 (-0.54–0.34) | ||
| High | 31.0 (477) | 32.7 (3.1) | -0.52 (-1.07–0.04) | 34.6 (709) | 30.6 (3.7) | -0.44 (-0.85–-0.30) | ||
| Unknown | 12.0 (184) | 32.3 (3.3) | -0.33 (-0.87–0.22) | 11.0 (226) | 31.1 (3.7) | 0.12 (-0.46–0.70) | ||
| NG urogenital positivea | ||||||||
| Yes | 3.8 (58) | 33.9 (3.2) | Ref | Ref | 2.2 (45) | 31.8 (3.1) | Ref | |
| No | 94.0 (1,446) | 32.6 (3.2) | -1.27 (-2.11–-0.42) | -1.20 (-2.05–-0.36) | 95.3 (1,954) | 30.8 (3.7) | -0.97 (-2.08–0.14) | |
| Not tested | 2.2 (34) | 33.1 (3.7) | -0.83 (-2.19–0.53) | -0.65(-2.07–0.77) | 2.5 (51) | 30.9 (4.5) | -0.90 (-2.40–0.60) | |
| HIV positive | ||||||||
| Yes | 4.7 (73) | 33.8 (3.2) | Ref | Ref | 0.6 (12) | 33.5 (4.4) | Ref | Ref |
| No | 79.6 (1,224) | 32.7 (3.2) | -1.13 (-1.89–-0.38) | -0.82 (-1.64–-0.01) | 74.6 (1,530) | 30.9 (37) | -2.57 (-4.69–-0.44) | -1.91 (-4.06–0.25) |
| Not tested | 15.7 (241) | 32.2 (3.3) | -1.60 (-2.44–-0.76) | -1.44(-2.36– -0.52) | 24.8 (508) | 30.7 (3.8) | -2.80 (-4.94–-0.65) | -2.02 (-4.16–0.12) |
a For men, only GP patients were not tested for NG. For women, GP and hospital physician patients were not tested for NG.
Statistically significant associations are depicted in bold (p<0.05). Abbreviations: Cq, cycle quantification threshold; GP, general practitioner; STI, sexually transmitted infection; SES, socioeconomic status; NG, Neisseria gonorrhoeae; HIV, human immunodeficiency virus; B, beta; CI, confidence interval.
In multivariable analyses, urogenital Cq values were lower for women visiting the GP compared to women visiting the STI clinic (M = 30.2, SD = 4.2 vs. M = 30.9, SD = 3.7, p<0.001). Urogenital Cq values were higher for women visiting hospital physicians (M = 32.4, SD = 4.3, p<0.001) compared to women visiting the STI clinic. Based on quartiles, the proportion of low urogenital Cq values of CT positive women was higher for GPs (35.9%) compared to hospital physicians (18.8%) and the STI clinic (23.2%) (Fig 2).
Other determinants associated with urogenital Cq values
In multivariable analyses, age <25 years (compared to age ≥ 25 years), no concurrent NG (compared to concurrent NG), HIV negative and not being tested for HIV (compared to HIV positive) were associated with lower Cq values in men (Table 2).
Furthermore, age <25 years (compared to age ≥ 25 years) was associated with lower Cq values in women (Table 2).
Clinical determinants in STI clinic patients
In multivariable analyses, having no concurrent NG (compared to NG positive), not being tested for HIV (compared to HIV positive) and having urogenital symptoms (compared to having no urogenital symptoms) were associated with lower urogenital Cq values in men (Table 3).
Table 3. Additional analyses, including determinants associated with urogenital Chlamydia trachomatis cycle threshold values for men and women visiting the STI clinic.
| Men | Women | |||||||
|---|---|---|---|---|---|---|---|---|
| % (n) | Mean Cq value (SD) | B (95% CI) | Adj. B (95% CI) | % (n) | Mean Cq value | B (95% CI) | Adj. B (95% CI) | |
| Overall | 100 (1,231) | 32.7 (3.2) | 100 (1,764) | 30.9 (3.7) | ||||
| Age in years | ||||||||
| <25 | 58.1 (715) | 32.4 (3.1) | -0.53 (-0.89– -0.16) | -0.21 (-0.58–0.17) | 81.6 (1,440) | 30.7 (3.6) | -1.16 (-1.59 –-0.72) | -0.83 (-1.28– -0.39) |
| ≥25 | 41.9 (516) | 33.0 (3.3) | Ref | Ref | 18.4 (324) | 31.8 (3.8) | Ref | Ref |
| SES | ||||||||
| Low | 27.1 (333) | 32.8 (3.2) | Ref | 27.1 (478) | 31.0 (3.7) | Ref | ||
| Medium | 28.2 (347) | 32.8 (3.2) | -0.05 (-0.53–0.44) | 25.3 (446) | 30.9 (3.7) | -0.07 (-0.54–0.40) | ||
| High | 30.5 (376) | 32.6 (3.1) | -0.19 (-0.67–0.28) | 35.2 (621) | 30.6 (3.6) | -0.33 (-0.77–0.10) | ||
| Unknown | 14.2 (175) | 32.3 (3.3) | -0.48 (-1.07–0.11) | 12.4 (219) | 31.2 (3.8) | 0.21 (-0.37–0.80) | ||
| NG urogenital positive | ||||||||
| Yes | 3.8 (47) | 34.2 (3.2) | Ref | Ref | 2.2 (38) | 31.6 (3.1) | Ref | |
| No | 96.2 (1,184) | 32.6 (3.2) | -1.59 (-2.52–-0.65) | -1.57 (-2.50–-0.64) | 97.8 (1,726) | 30.8 (3.7) | -1.01 (-2.18–0.17) | |
| HIV positive | ||||||||
| Yes | 4.2 (52) | 34.1 (3.3) | Ref | Ref | 0.2 (4) | 34.0 (4.9) | Ref | |
| No | 87.8 (1,081) | 32.7 (3.2) | -1.42 (-2.31–-0.53) | -0.93 (-1.93–0.06) | 85.3 (1,505) | 30.9 (3.7) | -3.09 (-6.67–0.50) | |
| Not tested | 8.0 (98) | 31.9 (3.0) | -2.23 (-3.30–-1.15) | -1.84 (-3.02–-0.65) | 14.5 (255) | 30.7 (3.2) | -3.31 (-6.92–0.29) | |
| Concurrent urogenital and anorectal CT infection | ||||||||
| No anorectal test | 83.7 (1,030) | 32.5 (3.1) | -1.04 (-2.38–0.30) | 73.9 (1,304) | 30.6 (3.6) | -3.28 (-3.96– -2.59) | -3.01(-3.71– -2.31) | |
| yes | 4.8 (59) | 33.7 (3.6) | 0.09 (-0.88–1.06) | 19.7 (348) | 30.7 (3.3) | -3.20 (-3.96– -2.44) | -3.08 (-3.84– -2.32) | |
| No | 11.5 (142) | 33.6 (3.5) | Ref | 6.3 (112) | 33.9 (3.6) | Ref | Ref | |
| Urogenital symptoms | ||||||||
| Unknown | 9.7 (120) | 33.7 (3.3) | 0.54 (-0.09–1.18) | 0.39 (-0.36–1.14) | 19.6 (346) | 30.7 (3.5) | -0.49 (-1.00–0.02) | |
| Yes | 50.8(625) | 32.1 (3.2) | -1.05 (-1.43– -0.68) | -1.11 (-1.49– -0.73) | 54.6 (963) | 30.8 (3.7) | -0.43 (-0.84–-0.02) | |
| No | 39.5 (486) | 33.1 (3.1) | Ref | Ref | 25.8 (455) | 31.2 (3.6) | Ref | |
| Oropharyngeal symptoms | ||||||||
| Unknown | 9.7 (120) | 33.7 (3.3) | 1.10 (0.49–1.70) | 0.39 (-0.36–1.14) | 19.6 (346) | 30.7 (3.5) | -0.18 (-0.61–0.26 | |
| Yes | 6.0 (74) | 32.0 (3.3) | -0.61 (-1.37–0.14) | -0.37 (-1.11–0.37) | 7.3 (129) | 31.2 (3.9) | 0.28 (-0.38–0.94) | |
| No | 84.2 (1,037) | 32.6 (3.2) | Ref | Ref | 73.1 (1,289) | 30.9 (3.7) | Ref | |
| Proctitis | ||||||||
| Unknown | 9.7 (120) | 33.7 (3.3) | 1.15 (0.55–1.76) | 0.39 (-0.36–1.14) | 19.6 (346) | 30.7 (3.5) | -0.17 (-0.61–0.26) | |
| Yes | 6.5 (80) | 32.7 (3.4) | 0.17 (-0.56–0.90) | 0.13 (-0.60–0.87) | 5.3 (93) | 31.3 (4.1) | 0.43 (-0.34–1.20) | |
| No | 83.8 (1,031) | 32.5 (3.2) | Ref | Ref | 75.1 (1,325) | 30.9 (3.7) | Ref | |
| Sexual orientationa | ||||||||
| MSM | 11.9 (147) | 33.5 (3.5) | Ref | Ref | na | na | na | na |
| Heterosexual men | 72.1 (888) | 32.4 (3.1) | -1.17 (-1.73–-0.62) | -0.53 (-1.15–0.08) | na | na | na | na |
| Unknown | 15.9 (196) | 33.3 (3.1) | -0.30 (-0.98–0.39) | -0.18 (-0.97–0.61) | na | na | na | na |
a Determinant only assessed among STI clinic men.
Statistically significant associations are depicted in bold (p<0.05). Abbreviations: Cq, cycle quantification threshold; GP, general practitioner; STI, sexual transmitted infection; SES, socioeconomic status; NG, Neisseria gonorrhoeae; HIV, human immunodeficiency virus; B, beta; CI, confidence interval; na, not applicable.
Furthermore, age <25 years (compared to age ≥ 25 years), having no anorectal CT test and having a concurrent anorectal CT infection (compared to no anorectal CT infection) were associated with lower Cq values in women (Table 3).
Discussion
To date, our study is the first to compare urogenital Cq values, as a potential indicator for CT load, of men and women diagnosed by GPs, hospital physicians and the STI clinic. Among all STI care providers, men visiting GPs, hospital physicians and the STI clinic had similar urogenital Cq values and likely similar urogenital CT loads. Women diagnosed by GPs had lower Cq values than women visiting the STI clinic, which could be indicative for higher urogenital CT loads. Whereas women visiting the hospital had higher urogenital Cq values than women visiting the STI clinic; likely indicative for lower CT loads. Of all determinants studied, only a few determinants were statistically associated with urogenital Cq values. However, one determinant, assessed among STI clinic visitors, was notable as the adjusted mean difference was much higher (> 3 Cq) compared to all other determinants.
A strength of the current study is the large number of included samples from different STI care providers. Furthermore, the additional analyses on clinical determinants in the STI clinic population allowed us to increase our understanding of what type of patients have lower urogenital Cq values and, therefore, likely higher urogenital CT loads. Furthermore, vaginal Cq values and vaginal CT loads were highly correlated. Therefore, vaginal Cq values were a valid indicator for vaginal CT loads.
A general limitation of CT load-based studies is that the variability of low and high CT loads, and therefore high and low Cq values, in populations and individuals seems dependent of different factors, including time of diagnosis since infection; this hampers interpretation. For example, our study group assessed the natural course of the CT load during infection between screening and treatment and observed a decrease in CT load in 17–41% of the STI clinic patients dependent on sample type [26]. A limitation of the current study was that we were unable to validate Cq values for (1) other populations than the STI clinic population and (2) for urine samples of men. Therefore, it remains unclear whether Cq values of the GP- and hospital population are a valid proxy for CT load in GP- and hospital populations and whether Cq values are a valid indicator for CT loads in urine samples. Our outcome measure ‘urogenital Cq values’ provides an indication of CT load. However, estimating the number of gene copy numbers per milliliter (often expressed as CT/milliliter) would have led to more accurate estimates of CT load. The Cq values in the current study are not reproducible for all NAAT used for CT detection. For example, if our study was repeated with a Siemens Versant NAAT, different Cq values could be produced. However, the relative differences between the Cq values of, for example, the GP, hospital and STI clinic population will be the same. Furthermore, we were unable to assess whether symptoms (urogenital symptoms, oropharyngeal symptoms and proctitis) were a result of a CT infection. Therefore, the symptoms could be caused by other STI’s such as herpes simplex virus, Mycoplasma genitalium or Trichomonas vaginalis. However, as those STI’s occur to a much lesser extent among STI clinic visitors in the Netherlands the influence seems to be low [27, 28]. Furthermore, as we used urogenital Cq values as a proxy for CT load caution is needed when comparing our results to studies that used the actual CT load as an outcome measure.
The purpose of the current study was to provide insight in the CT load of populations visiting different STI care providers. The clinical relevance of our main finding, suggesting different CT loads between women visiting the GP, hospital and STI clinic, remains debatable as the exact role of CT load remains unknown [10]. Therefore, results of the current study will not lead to clinical consequences. Earlier, our study group deemed a difference of 1 log load (3.3 Cq) as clinically relevant to overcome potential technical variations when measuring the CT load within the same patient over time [26]. However, in the current study we averaged Cq values over an entire population, i.e. GP, hospital and STI clinic population. Therefore, even a smaller difference than 3.3 Cq could be clinically or microbiologically relevant. Still, the exact cut-off value for a relevant difference in CT load between populations remains unknown.
One determinant showed an adjusted difference of 3.08 Cq, related to anorectal CT, which was much higher than all other determinants. Dubbink and colleagues also observed a higher urogenital CT load among South-African women concurrently infected with anorectal CT [29]. It is likely that the majority of STI clinic women who were not anorectally tested also had an anorectal infection since more than 70% of the STI clinic women with a urogenital infection also have a concurrent anorectal infection [15, 16]. Indeed, urogenital Cq values were comparable for STI clinic women who had diagnosed concurrent urogenital and anorectal CT infections and STI clinic women who were not anorectally tested. Those STI clinic women who were only urogenitally CT positive and not anorectally tested were likely treated with azithromycin, as azithromycin is the first choice treatment for urogenital CT in the Netherlands [30]. Therefore, possible undiagnosed concurrent anorectal CT infections could be not adequately treated, as the efficacy of azithromycin, compared to doxycycline, may be lower for anorectal CT infections [23, 31]. Likely women with concurrent urogenital and anorectal CT infections could have higher transmission potential, yet this remains unclear. Recently, our study groups showed a borderline significant association (P = 0.054) between lower vaginal Cq values, i.e. likely higher CT loads, and not reaching microbiological cure for vaginal CT in women treated with azithromycin [32]. Therefore, some women with concurrent vaginal and (untested) anorectal infections in our study may not be microbiologically cured when treated with azithromycin as they tend to have lower Cq values and therefore potentially higher CT loads [32]. Notably, anorectal testing was rarely performed by GPs and hospital physicians (Fig 1), as has also been shown before [8, 17, 33]. However, according to international guidelines, anorectal testing should at least be performed in men and women reporting anorectal intercourse or symptoms [23, 24]. Still, it remains unknown to which extent women visiting the GP report anal intercourse. However, it is unlikely that this would be 0.2%, as a population based study showed that 10.5% of women report to have anorectal intercourse in the past year [34].
Two explanations could possibly explain the lower Cq values of women visiting the GP compared to women visiting the STI clinic. First, lower urogenital Cq values of women visiting the GP could be related with symptoms, as symptoms could be associated with higher CT loads [10]. A study by van Bergen and colleagues showed that only 20% of the patients with STI related symptoms visit the STI clinic, whereas the majority of symptomatic patients visit the GP (63%) [35]. Second, women visiting the STI clinic could have higher Cq values, and therefore likely lower CT loads, due to frequent CT infections. It has been shown that the CT load is lower when having repeat CT infections [36]. Moreover, retesting rates are higher for the STI clinic population compared to the GP population what could strengthen this explanation [37]. The higher Cq values of women visiting the hospital may be due to different sampling moments during the infection [11, 38]. It is likely that women visit the hospital at a later stageof the infection than women visiting the STI clinic, which could have impact on the Cq values, and therefore likely CT loads, as CT loads tend to decrease over time [26].
Younger women (<25 years) had significantly lower urogenital Cq values, i.e. potentially higher CT loads, than older (≥25 years) women. Others report that partial immunity acquired to past CT infection could possibly lead to lower CT load with increasing age [39]. The lower urogenital Cq values of men without concurrent NG and men who were not tested for HIV remains unexplained. Men with urogenital symptoms had lower Cq values, i.e. likely higher urogenital CT loads, than men without urogenital symptoms. Symptoms associated with higher urogenital CT load in men have been observed in several studies [11, 40, 41]. An explanation for higher urogenital CT loads could be that higher CT loads induce a greater inflammatory response [11].
We excluded all urine samples of women (n = 233). Almost all urine samples were taken by the GP (94%). GPs should consider collecting self-sampled vaginal swabs of women, as the sensitivity and specificity of vaginal swabs for detecting CT are much higher compared to urine samples [22–24].
Conclusions
The patient characteristics of male CT patients diagnosed by GPs, hospital physicians and STI clinic differed by type of STI care provider. However, the urogenital Cq values of men were similar, arguing similar CT loads and chances of transmission and sequelae. Women visiting the GP had lower urogenital Cq values than women visiting the STI clinic, which could be an indicator for higher urogenital CT loads. Whereas women visiting the hospital had higher urogenital Cq values than women visiting the STI clinic, which could be an indicator for lower urogenital CT loads. The impact, in terms of transmission and sequelae, of lower Cq values, and likely higher CT loads, needs to be explored further. Notably, much lower urogenital Cq values, and likely higher urogenital CT loads, were observed when STI clinic women also had anorectal CT and in STI clinic women who were not anorectally tested but who are prone to have an undiagnosed anorectal infection. Likely those STI clinic women with anorectal infections have higher chances of transmission and sequelae.
Supporting information
Abbreviations: SES, socioeconomic status; CT, Chlamydia trachomatis; NG, Neisseria gonorrhoeae; HIV, human immunodeficiency virus.
(DOCX)
(TIF)
Acknowledgments
The authors acknowledge the Medical Microbiology Laboratory of Maastricht University Medical Center (MUMC+) for providing the laboratory data, particularly Brian van der Veer (MUMC+) for providing the Chlamydia trachomatis cycle quantification data.
Data Availability
Due to the Dutch law of protection of personal information (wet bescherming personengegevens Wbp or Personal Data Protection Act: http://wetten.overheid.nl/BWBR0011468/geldigheidsdatum_13-07-2015), it is not allowable to distribute or share any personal data that can be traced back (directly or indirectly) to an individual. Although the Chlamydia trachomatis data used in our study are third-party data, which cannot be traced back to an individual, interested researchers are required to provide their name and institution to avoid misuse of this sensitive data and to align with the Dutch law of protection of personal information. Therefore, interested researchers may contact the head of the data-archiving (Helen Sijstermans: Helen.sijstermans@ggdzl.nl) to receive the data.
Funding Statement
The authors received no specific funding for this work.
References
- 1.Newman L, Rowley J, Vander Hoorn S, Wijesooriya NS, Unemo M, Low N, et al. Global Estimates of the Prevalence and Incidence of Four Curable Sexually Transmitted Infections in 2012 Based on Systematic Review and Global Reporting. PLoS One. 2015;10(12):e0143304 10.1371/journal.pone.0143304 [DOI] [PMC free article] [PubMed] [Google Scholar]
- 2.Haggerty CL, Gottlieb SL, Taylor BD, Low N, Xu F, Ness RB. Risk of sequelae after Chlamydia trachomatis genital infection in women. J Infect Dis. 2010;201 Suppl 2:S134–55. 10.1086/652395 . [DOI] [PubMed] [Google Scholar]
- 3.Bowring AL, Gouillou M, Guy R, Kong FY, Hocking J, Pirotta M, et al. Missed opportunities—low levels of chlamydia retesting at Australian general practices, 2008–2009. Sex Transm Infect. 2012;88(5):330–4. 10.1136/sextrans-2011-050422 . [DOI] [PubMed] [Google Scholar]
- 4.Santella AJ, Pollack A, Harrison C, Sawleshwarkar SN, Britt HC, Hillman RJ. Management rates of sexually transmissible infections by Australian general practitioners, 2000–2012. Sex Health. 2014;11(1):52–7. 10.1071/SH13179 . [DOI] [PubMed] [Google Scholar]
- 5.Wetten S, Mohammed H, Yung M, Mercer CH, Cassell JA, Hughes G. Diagnosis and treatment of chlamydia and gonorrhoea in general practice in England 2000–2011: a population-based study using data from the UK Clinical Practice Research Datalink. BMJ Open. 2015;5(5):e007776 10.1136/bmjopen-2015-007776 [DOI] [PMC free article] [PubMed] [Google Scholar]
- 6.Visser M, van Aar F, Op de Coul E, Slurink I, van Wees D, Hoenderboom B, et al. Sexually transmitted infections in the Netherlands in 2017. Rijksinstituut voor Volksgezondheid en Milieu RIVM, 2018-06-21. Report No. [Google Scholar]
- 7.Batteiger TA, Dixon BE, Wang J, Zhang Z, Tao G, Tong Y, et al. Where Do People Go for Gonorrhea and Chlamydia Tests: A Cross-sectional View of the Central Indiana population, 2003–2014. Sex Transm Dis. 2018. 10.1097/OLQ.0000000000000928 . [DOI] [PubMed] [Google Scholar]
- 8.den Heijer CD, van Liere GA, Hoebe CJ, van Bergen JE, Cals JW, Stals FS, et al. Who tests whom? A comprehensive overview of Chlamydia trachomatis test practices in a Dutch region among different STI care providers for urogenital, anorectal and oropharyngeal sites in young people: a cross-sectional study. Sex Transm Infect. 2016;92(3):211–7. 10.1136/sextrans-2015-052065 . [DOI] [PubMed] [Google Scholar]
- 9.Clifton S, Mercer CH, Woodhall SC, Sonnenberg P, Field N, Lu L, et al. Patterns of chlamydia testing in different settings and implications for wider STI diagnosis and care: a probability sample survey of the British population. Sex Transm Infect. 2017;93(4):276–83. 10.1136/sextrans-2016-052719 [DOI] [PMC free article] [PubMed] [Google Scholar]
- 10.Vodstrcil LA, McIver R, Huston WM, Tabrizi SN, Timms P, Hocking JS. The Epidemiology of Chlamydia trachomatis Organism Load During Genital Infection: A Systematic Review. J Infect Dis. 2015;211(10):1628–45. 10.1093/infdis/jiu670 . [DOI] [PubMed] [Google Scholar]
- 11.Dirks JA, Wolffs PF, Dukers-Muijrers NH, Brink AA, Speksnijder AG, Hoebe CJ. Chlamydia trachomatis load in population-based screening and STI-clinics: implications for screening policy. PLoS One. 2015;10(3):e0121433 10.1371/journal.pone.0121433 [DOI] [PMC free article] [PubMed] [Google Scholar]
- 12.Gomes JP, Borrego MJ, Atik B, Santo I, Azevedo J, Brito de Sa A, et al. Correlating Chlamydia trachomatis infectious load with urogenital ecological success and disease pathogenesis. Microbes Infect. 2006;8(1):16–26. 10.1016/j.micinf.2005.05.014 . [DOI] [PubMed] [Google Scholar]
- 13.Agrawal T, Vats V, Salhan S, Mittal A. Determination of chlamydial load and immune parameters in asymptomatic, symptomatic and infertile women. FEMS Immunol Med Microbiol. 2009;55(2):250–7. 10.1111/j.1574-695X.2008.00530.x . [DOI] [PubMed] [Google Scholar]
- 14.Walker J, Tabrizi SN, Fairley CK, Chen MY, Bradshaw CS, Twin J, et al. Chlamydia trachomatis incidence and re-infection among young women—behavioural and microbiological characteristics. PLoS One. 2012;7(5):e37778 10.1371/journal.pone.0037778 [DOI] [PMC free article] [PubMed] [Google Scholar]
- 15.van Liere G, Dukers-Muijrers N, Levels L, Hoebe C. High Proportion of Anorectal Chlamydia trachomatis and Neisseria gonorrhoeae After Routine Universal Urogenital and Anorectal Screening in Women Visiting the Sexually Transmitted Infection Clinic. Clin Infect Dis. 2017;64(12):1705–10. 10.1093/cid/cix243 . [DOI] [PubMed] [Google Scholar]
- 16.van Liere GA, Hoebe CJ, Wolffs PF, Dukers-Muijrers NH. High co-occurrence of anorectal chlamydia with urogenital chlamydia in women visiting an STI clinic revealed by routine universal testing in an observational study; a recommendation towards a better anorectal chlamydia control in women. BMC Infect Dis. 2014;14:274 10.1186/1471-2334-14-274 [DOI] [PMC free article] [PubMed] [Google Scholar]
- 17.Wijers J, van Liere G, Hoebe C, Cals JWL, Wolffs PFG, Dukers-Muijrers N. Test of cure, retesting and extragenital testing practices for Chlamydia trachomatis and Neisseria gonorrhoeae among general practitioners in different socioeconomic status areas: A retrospective cohort study, 2011–2016. PLoS One. 2018;13(3):e0194351 10.1371/journal.pone.0194351 . [DOI] [PMC free article] [PubMed] [Google Scholar]
- 18.Bolotin S, Deeks SL, Marchand-Austin A, Rilkoff H, Dang V, Walton R, et al. Correlation of Real Time PCR Cycle Threshold Cut-Off with Bordetella pertussis Clinical Severity. PLoS One. 2015;10(7):e0133209 10.1371/journal.pone.0133209 [DOI] [PMC free article] [PubMed] [Google Scholar]
- 19.Dionne LL, Raymond F, Corbeil J, Longtin J, Gervais P, Longtin Y. Correlation between Clostridium difficile bacterial load, commercial real-time PCR cycle thresholds, and results of diagnostic tests based on enzyme immunoassay and cell culture cytotoxicity assay. J Clin Microbiol. 2013;51(11):3624–30. Epub 2013/08/24. 10.1128/JCM.01444-13 ; PubMed Central PMCID: PMCPmc3889743. [DOI] [PMC free article] [PubMed] [Google Scholar]
- 20.Ott SJ, Musfeldt M, Ullmann U, Hampe J, Schreiber S. Quantification of intestinal bacterial populations by real-time PCR with a universal primer set and minor groove binder probes: a global approach to the enteric flora. J Clin Microbiol. 2004;42(6):2566–72. 10.1128/JCM.42.6.2566-2572.2004 [DOI] [PMC free article] [PubMed] [Google Scholar]
- 21.Van Bergen JEAM, et al. Standard of the National Society for General Practice: the STI consultation [NHGStandaard: Het soa-consult]. Huisarts en Wetenschap. 2013;56(9):450–63. [Google Scholar]
- 22.Lunny C, Taylor D, Hoang L, Wong T, Gilbert M, Lester R, et al. Self-Collected versus Clinician-Collected Sampling for Chlamydia and Gonorrhea Screening: A Systemic Review and Meta-Analysis. PLoS One. 2015;10(7):e0132776 10.1371/journal.pone.0132776 [DOI] [PMC free article] [PubMed] [Google Scholar]
- 23.Workowski KA. Centers for Disease Control and Prevention Sexually Transmitted Diseases Treatment Guidelines. Clin Infect Dis. 2015;61 Suppl 8:S759–62. 10.1093/cid/civ771 . [DOI] [PubMed] [Google Scholar]
- 24.Lanjouw E, Ouburg S, de Vries HJ, Stary A, Radcliffe K, Unemo M. 2015 European guideline on the management of Chlamydia trachomatis infections. International journal of STD & AIDS. 2016;27(5):333–48. 10.1177/0956462415618837 . [DOI] [PubMed] [Google Scholar]
- 25.van Liere GA, Dirks JA, Hoebe CJ, Wolffs PF, Dukers-Muijrers NH. Anorectal Chlamydia trachomatis Load Is Similar in Men Who Have Sex with Men and Women Reporting Anal Sex. PLoS One. 2015;10(8):e0134991 10.1371/journal.pone.0134991 [DOI] [PMC free article] [PubMed] [Google Scholar]
- 26.Dirks JA, van Liere GA, Bogers S, Dukers-Muijrers NH, Wolffs PF, Hoebe CJ. Natural Course of Chlamydia trachomatis Bacterial Load in the Time Interval between Screening and Treatment in Anogenital Samples. PLoS One. 2015;10(12):e0145693 10.1371/journal.pone.0145693 [DOI] [PMC free article] [PubMed] [Google Scholar]
- 27.Visser M vAF, Op de Coul ELM, Slurink IAL, van Wees DA, Hoenderboom BM, den Daas C, Woestenberg PJ, Götz HM, van Sighem AI, Nielen M, van Benthem BHB. Sexually transmitted infections in the Netherlands in 2017 2017 [2–7–2018]. Available from: https://www.rivm.nl/Documenten_en_publicaties/Wetenschappelijk/Rapporten/2018/Juni/Sexually_transmitted_infections_in_the_Netherlands_in_2017.
- 28.van der Veer C, van Rooijen MS, Himschoot M, de Vries HJ, Bruisten SM. Trichomonas vaginalis and Mycoplasma genitalium: age-specific prevalence and disease burden in men attending a sexually transmitted infections clinic in Amsterdam, the Netherlands. Sex Transm Infect. 2016;92(1):83–5. 10.1136/sextrans-2015-052118 . [DOI] [PubMed] [Google Scholar]
- 29.Dubbink JH, de Waaij DJ, Bos M, van der Eem L, Bebear C, Mbambazela N, et al. Microbiological Characteristics of Chlamydia trachomatis and Neisseria gonorrhoeae Infections in South African Women. J Clin Microbiol. 2016;54(1):200–3. 10.1128/JCM.02848-15 [DOI] [PMC free article] [PubMed] [Google Scholar]
- 30.De Vries H, van Dam A, Bax C. Seksueel Overdraagbare Aandoeningen Multidisciplinaire Richtlijn Update 2018 2018 [3–9–2018]. Available from: www.soaaids.nl/nl/professionals/beroepsgroep/arts/professioneel-handelen/de-specialist.
- 31.Kong FY, Tabrizi SN, Fairley CK, Vodstrcil LA, Huston WM, Chen M, et al. The efficacy of azithromycin and doxycycline for the treatment of rectal chlamydia infection: a systematic review and meta-analysis. The Journal of antimicrobial chemotherapy. 2015;70(5):1290–7. Epub 2015/02/01. 10.1093/jac/dku574 . [DOI] [PubMed] [Google Scholar]
- 32.Dukers-Muijrers N, Wolffs PFG, Vries H, Gotz HM, Heijman T, Bruisten S, et al. Treatment effectiveness of azithromycin and doxycycline in uncomplicated rectal and vaginal Chlamydia trachomatis infections in women: a multicentre observational study (FemCure). Clin Infect Dis. 2019. 10.1093/cid/ciz050 . [DOI] [PMC free article] [PubMed] [Google Scholar]
- 33.Foschi C, Nardini P, Banzola N, D'Antuono A, Compri M, Cevenini R, et al. Chlamydia trachomatis infection prevalence and serovar distribution in a high-density urban area in the north of Italy. J Med Microbiol. 2016;65(6):510–20. 10.1099/jmm.0.000261 . [DOI] [PubMed] [Google Scholar]
- 34.Mercer CH, Tanton C, Prah P, Erens B, Sonnenberg P, Clifton S, et al. Changes in sexual attitudes and lifestyles in Britain through the life course and over time: findings from the National Surveys of Sexual Attitudes and Lifestyles (Natsal). Lancet. 2013;382(9907):1781–94. 10.1016/S0140-6736(13)62035-8 [DOI] [PMC free article] [PubMed] [Google Scholar]
- 35.van Bergen JE, Kerssens JJ, Schellevis FG, Sandfort TG, Coenen TT, Bindels PJ. Sexually transmitted infection health-care seeking behaviour in the Netherlands: general practitioner attends to the majority of sexually transmitted infection consultations. International journal of STD & AIDS. 2007;18(6):374–9. 10.1258/095646207781024883 . [DOI] [PubMed] [Google Scholar]
- 36.Gupta K, Bakshi RK, Van Der Pol B, Daniel G, Brown L, Press CG, et al. Repeated Chlamydia trachomatis infections are associated with lower bacterial loads. Epidemiol Infect. 2018:1–3. 10.1017/S0950268818002704 . [DOI] [PMC free article] [PubMed] [Google Scholar]
- 37.Dukers-Muijrers NH, van Liere GA, Hoebe CJ. Re-screening Chlamydia trachomatis positive subjects: a comparison of practices between an STI clinic, general practitioners and gynaecologists. Sex Transm Infect. 2013;89(1):25–7. 10.1136/sextrans-2011-050467 . [DOI] [PubMed] [Google Scholar]
- 38.Price MJ, Ades AE, Angelis DD, Welton NJ, Macleod J, Soldan K, et al. Mixture-of-exponentials models to explain heterogeneity in studies of the duration of Chlamydia trachomatis infection. Stat Med. 2013;32(9):1547–60. 10.1002/sim.5603 . [DOI] [PubMed] [Google Scholar]
- 39.Batteiger BE, Xu F, Johnson RE, Rekart ML. Protective immunity to Chlamydia trachomatis genital infection: evidence from human studies. J Infect Dis. 2010;201 Suppl 2:S178–89. 10.1086/652400 [DOI] [PMC free article] [PubMed] [Google Scholar]
- 40.Jalal H, Verlander NQ, Kumar N, Bentley N, Carne C, Sonnex C. Genital chlamydial infection: association between clinical features, organism genotype and load. J Med Microbiol. 2011;60(Pt 7):881–8. 10.1099/jmm.0.028076-0 . [DOI] [PubMed] [Google Scholar]
- 41.Michel CE, Sonnex C, Carne CA, White JA, Magbanua JP, Nadala EC Jr., et al. Chlamydia trachomatis load at matched anatomic sites: implications for screening strategies. J Clin Microbiol. 2007;45(5):1395–402. 10.1128/JCM.00100-07 [DOI] [PMC free article] [PubMed] [Google Scholar]
Associated Data
This section collects any data citations, data availability statements, or supplementary materials included in this article.
Supplementary Materials
Abbreviations: SES, socioeconomic status; CT, Chlamydia trachomatis; NG, Neisseria gonorrhoeae; HIV, human immunodeficiency virus.
(DOCX)
(TIF)
Data Availability Statement
Due to the Dutch law of protection of personal information (wet bescherming personengegevens Wbp or Personal Data Protection Act: http://wetten.overheid.nl/BWBR0011468/geldigheidsdatum_13-07-2015), it is not allowable to distribute or share any personal data that can be traced back (directly or indirectly) to an individual. Although the Chlamydia trachomatis data used in our study are third-party data, which cannot be traced back to an individual, interested researchers are required to provide their name and institution to avoid misuse of this sensitive data and to align with the Dutch law of protection of personal information. Therefore, interested researchers may contact the head of the data-archiving (Helen Sijstermans: Helen.sijstermans@ggdzl.nl) to receive the data.