Abstract
The KCl cotransporter (KCC) plays a significant role in the ionic and osmotic homeostasis of many cell types. Four KCC isoforms have been cloned. KCC1 and KCC4 activity is osmolality-sensitive and involved in volume regulation. KCC2, a neuronal-specific isoform, can lower intracellular Cl− and is critical for inhibitory GABA responses in the mature central nervous system. KCC3, initially cloned from vascular endothelial cells, is widely but not universally distributed and has an unknown physiological significance. Here we show a tight link between the expression and activity of KCC3 and cell growth by a NIH/3T3 fibroblast expression system. KCC3 activity is sensitive to [(dihydroindenyl)oxy] alkanoic acid (DIOA) and N-ethylmaleimide and is regulated by tyrosine phosphorylation. Osmotic swelling does not activate KCC3, and the process of regulatory volume decrease is refractory to DIOA, indicating that KCC3 is not involved in volume regulation. KCC3 expression enhances cell proliferation, and this growth advantage can be abolished by the inhibition of KCC3 by DIOA. Fluorescence-activated cell sorting measurements and Western blot analysis show DIOA caused a significant reduction of the cell fraction in proliferative phase and a change in phosphorylation of retinoblastoma protein (Rb) and cdc2, suggesting that KCC3 activity is important for cell cycle progression. Insulin-like growth factor-1 up-regulates KCC3 expression and stimulates cell growth. Tumor necrotic factor-α down-regulates KCC3 expression and causes growth arrest. These data indicate that KCC3 is an important KCC isoform that may be involved in cell proliferation.
The KCl cotransporter (KCC) has been implicated not only in regulatory volume decrease but also in transepithelial salt absorption, renal K+ secretion, myocardial K+ loss during ischemia, and regulation of neuronal Cl− concentrations (1–3). A major advance in the understanding of KCC has been the recent identification of genes that encode four KCC isoforms. KCC1 is a “housekeeping” isoform for cell volume regulation (4). KCC2, a neuronal-specific isoform, by lowering intracellular Cl−, is critical for inhibitory GABA responses in the mature central nervous system (5, 6). The KCC3 gene is located on chromosome 15q13, which colocalizes with the gene for myoclonal epilepsy, and the mRNA of KCC3 has been found in vascular endothelial cells, heart, kidney, brain, placenta, liver, and lung (7–9). Despite the wide distribution of KCC3, next to nothing is known about the functional and regulatory properties of this isoform. KCC4, predominantly found in heart and kidney, is volume-sensitive and also contributes to volume regulation (9, 10).
The present study was aimed at characterizing the regulation and function of the recently cloned human KCC3 by using the NIH/3T3 fibroblast expression system. NIH/3T3 cells, which, unlike many other cell types [such as human embryonic kidney (HEK)-293 cells and Xenopus oocytes], do not have endogenous KCC activity and therefore provide a suitable system for expression. We demonstrate that KCC3 plays an important role in the regulation of cell growth.
Materials and Methods
Cell Culture, Transfection, and Treatment.
The NIH/3T3 7–4 cell line (11–13), derived from mouse NIH/3T3 fibroblasts, was used to study KCC3 function. This cell line contains an inducible Ha-rasVal12 oncogene, regulated by the Escherichia coli lac operator/repressor system (11, 14). The full-length KCC3 cDNA construct was subcloned into the eukaryotic expression vector pCDNA3.1 (Invitrogen). Plasmids were transfected into NIH/3T3 7–4 cells by lipofection (11, 12). Cells transfected with empty vector were the control. To assess proliferation, cells were plated at the density of 105 per dish on 60-mm dishes and the medium changed every 2 days. Counts were performed with the aid of a hemocytometer by using trypan blue exclusion (0.08%) to monitor viability. The parental NIH/3T3 7–4 cells contain plasmids pSVlacOras and p3′SS (14), in which the expression of Ha-ras can become doubly induced by a nonmetabolizable lactose analogue, isopropyl-β-d-thiogalactoside (IPTG) (11, 12). In our preliminary results, the NIH/3T3 7–4 cells with stable KCC3 transfection still reserve the characteristic of IPTG-induced ras overexpression.
Reverse Transcriptase–PCR (RT-PCR).
Total RNAs were isolated by RNeasy Mini Kit (Qiagen, Chatsworth, CA). After annealing 5 μg of total RNA with oligo(dT), cDNA was prepared with Superscript II (Life Technologies, Gaithersburg, MD). Two oligonucleotide primer pairs were synthesized over regions specific for the human KCC3 cDNA. For the first primer pair, forward (5′-GGAAGTAACATGGCACTTTTCG-3′) and reverse (5′-CAGGGCCATGAGCACGAGCGTG-3′) primers were used to amplify a 597-bp fragment from KCC3 (hKCC3: nucleotides 200–796). For the second primer pair, forward (5′-CTATCCTTGCCATCCTGACC-3′) and reverse (5′-GCAGCAGTTGTCACTCGAAC-3′) primers were used to amplify a 1,099-bp fragment from KCC3 (hKCC3: nucleotides 1723–2821). The positive control was total RNA isolated from the human cervical cancer SiHa cell line (15). PCR was carried out as described in detail elsewhere (15). Briefly, after the reaction contents were heated for 3 min at 94°C, 30 cycles of PCR were performed (each consisting of incubation of 30 sec at 94°C, 30 sec at 55°C, and 1 min at 72°C). To assess the possibility of differential expression of KCC3 mRNA under different culture conditions, semiquantitative RT-PCR techniques with β-actin as the internal standard were used (15).
Functional K+ (86Rb+) and 36Cl− Efflux Assays.
Unidirectional K+ efflux was measured in 80–90%
confluent cells grown on 6-well plates with
86Rb+ as a tracer. Cells
were preincubated with isotonic culture medium loaded with 2 μCi/ml
86Rb+ for 2 h at
37°C. After preincubation, cells were washed rapidly seven times with
PBS. Then, appropriate efflux medium [containing 0.1 mM ouabain (O)
and 0.01 mM bumetanide (B) to inhibit the
Na+-K+ pump and the
Na+K+2Cl−
cotransporter, respectively] was added and preincubated for 30 min in
the isotonic flux medium containing (in mM): NaCl 90, KCl 5,
MgCl2 1, CaCl2 1.5, glucose
5, Hepes 5, and mannitol 100, titrated to pH 7.4 with NaOH (300 ±
3 mosmol l−1). The hypotonic medium was
identical except the concentration of mannitol was reduced, resulting
in an osmolality of 275 ± 3, 250 ± 3, 220 ± 3 and
200 ± 3 mosmol l−1, respectively. Release
of 86Rb+ from preloaded
cells was measured in the efflux medium at indicated time intervals
over 15 min. Cells were finally lysed with 0.5 M NaOH.
86Rb+ efflux rate constants
were estimated from the negative slope of the graph of
ln[Xi(t)/Xi(t
= 0)] vs. time (t), where
Xi(t = 0) denotes the total
amount of 86Rb+ inside the
cells at the beginning of the efflux time course, and
Xi(t) denotes the amount of
86Rb+ inside the cells at
the time point of t. To study KCC activity, the
Cl− dependence of K+
(86Rb+) efflux was examined
by substituting NO or
CH3OSO
 for
Cl− in the efflux medium. Measurement of
Cl− efflux followed the same protocol except
that O was omitted.
Determination of Cell Cycle Stage by Fluorescence-Activated Cell Sorting (FACS).
Cellular DNA content was determined after propidium iodide staining in a Becton Dickinson FACScan. Cells were harvested, fixed in cool 70% ethanol for 6 h, and then incubated with 1 mg⋅ml−1 RNase and 20 g⋅ml−1 propidium iodide for at least 30 min. For each cell population, 10,000 cells were analyzed by FACS and the proportion in G0/G1, S and G2/M phases estimated by using the modfit cell cycle analysis program (Ver. 2.0, Verity Software House, Topsham, ME). Cells were classified as in G0/G1, G2/M, and S phase from the fluorescence intensity (16).
Measurements of Cell Volume and Intracellular Cl− Content.
Cell volume was measured at room temperature as described previously (17–19). Briefly, cells were harvested and transferred to Petri dishes to achieve cell attachment for ≈30 min. Then isotonic solution or hypotonic solution with or without the chemical tested at room temperature was superfused at 2 ml⋅min−1. Cells were viewed by an Olympus IX70 inverted microscope equipped with Hoffman modulation optics (Olympus, Tokyo). To monitor the change of cell size, the microscope was coupled to a video camera system, and the images were recorded in real time and analyzed by the public domain NIH image program. The majority of cells observed were spheroid, and the relative volume change (V/Vo) was calculated from the cross-sectional surface area at the beginning (So) and during (S) the experiments from the relation: V/Vo = (S/So)3/2 (18).
Intracellular Cl− content were measured by a dual-label isotope technique (20) involving transmembrane 36Cl− equilibrium and [3H]inulin as extracellular space marker. Cells were incubated for up to 45 min in a Cl− medium containing 36Cl− (2 μCi/ml) and [3H]inulin (1 μCi/ml). The cell suspensions were then centrifuged through a mixture of Mazola corn oil and dibutylphthalate (3:10). The pellet was extracted with 2% SDS, and the radioactivity was determined by liquid scintillation counting.
Western Immunoblotting for Cell Cycle Analysis.
Cells from different culture conditions were harvested on ice with protein sample buffer. Protein concentrations were determined with a Bio-Rad protein assay. Equal amounts of proteins were separated by 10% SDS/PAGE and transferred to polyvinylidene difluoride (Stratagene) membranes. Extracts were tested for the expression of selected cell cycle-related proteins by the following antibodies: phospho-retinoblastoma protein (Rb) (Ser-795) and phospho-cdc2 (Tyr-15) (Cell Signaling Technology, Beverly, MA). All Western blots first probed with the phospho-specific antibodies were stripped and reprobed with β-actin antibody (Amersham Pharmacia) as an internal standard. Phosphorylated levels were analyzed by scanning densitometry, and the results were expressed as arbitrary units.
Results
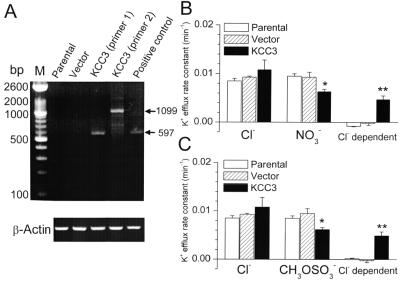
To study the cellular and molecular mechanisms underlying KCC3 regulation, we developed KCC3 expression in the NIH/3T3 7–4 cell line stably transfected with human KCC3 cDNA. To estimate the expression of the KCC3 gene, mRNA was isolated from parental, mock-transfected (transfected with empty vector), and transfected cells. By using specific KCC3 primers, the RT-PCR results reveal that mRNA transcripts of KCC3 were present in transfected cells but not in either the parental cells or cells after mock transfection (Fig. 1A).
Figure 1.
Molecular identification and functional expression of KCC3 in NIH/3T3
7–4 cells. (A) KCC3 and β-actin mRNA levels measured
by RT-PCR in parental cells, cells transfected with empty vector, and
cells transfected with human KCC3 cDNA. Positive control was total RNA
isolated from human cervical cancer SiHa cell line. The primer pairs
produced PCR products of the predicted sizes of 597 and 1,099 bp for
primer pairs 1 and 2, respectively. M, DNA molecular mass
marker. (B and C) K+
transport in Cl−-containing or Cl−-free
efflux medium. In Cl−-free efflux medium,
NO (B) or
CH3OSO
 (C) was used to
replace Cl−. The Cl−-dependent K+
flux (KCC3 activity) was defined as the efflux difference between
Cl− and NO
 (or
CH3OSO
 media. Each value represents
mean ± SEM (n = 6). *,
P < 0.05; **, P
< 0.01 compared with control group (parental cells) by unpaired
t test.
KCC activity was subsequently studied in these cells by using
86Rb+ as a congener of
K+. KCC is defined as the
Cl−-dependent K+ transport
measured in the presence of O and B to inhibit the
Na+-K+ pump and the
Na+K+2Cl−
cotransporter, respectively (1, 2). The Cl−
dependence of K+ transport was examined by
substituting NO , or
CH3OSO
 for
Cl− in the efflux medium (Fig. 1 B
and C). In parental and mock-transfected cells, the
K+ efflux was the same in the
Cl−-containing medium and
Cl−-free medium, i.e., the O- and B-insensitive
Cl−-dependent K+ efflux
was nearly zero, and there was no endogenous KCC activity
in these cells. In contrast, cells stably transfected with KCC3 showed
a large Cl−-dependent K+
component ranging from 30 to 40% of total K+
efflux (Fig. 1 B and C). The KCC3 isoform is
therefore the only O- and B-insensitive
Cl−-dependent pathway for
K+ efflux in the transfected cells.
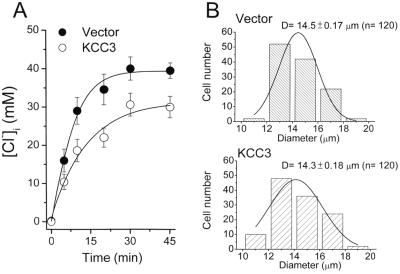
Estimated by 36Cl− equilibrium (Fig. 2A), basal intracellular Cl− concentration ([Cl−]i) in the control cells (mock transfection) is 39.5 ± 1.8 mM (n = 3), and KCC3 transfection significantly decreases [Cl−]i to 30 ± 2.8 mM (n = 3, P < 0.05). There is no significant difference in cell size between these cell lines (Fig. 2B).
Figure 2.
Measurements of intracellular Cl− concentration ([Cl−]i) and cell size. (A) Calculation of [Cl−]i in the mock-transfected cells (transfected with empty vector) and KCC3-transfected cells by 36Cl− equilibrium. Each point represents mean ± SEM (n = 3). (B) Distribution of cell sizes. The histogram of cell diameters (D) (n = 120) was constructed with a bin width of 2 μm. The smooth curve overlaying the histogram is all data fitted by Gaussian distribution.
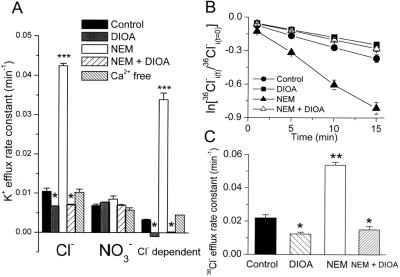
Further experiments were performed to look at aspects of KCC3 regulation and to confirm that KCC3 is a KCl cotransporter. Fig. 3A shows that the O- and B-insensitive Cl−-dependent K+ efflux is completely abolished by the KCC inhibitor, 20 μM DIOA. Treatment of KCC3-transfected cells with N-ethylmaleimide (NEM) (0.5 mM) led to a 4-fold stimulation of K+ efflux, which was completely Cl−-dependent and sensitive to DIOA (20 μM) inhibition (Fig. 3A). Removal of Ca2+ proved that the activity of KCC3 was calcium-independent. Stimulation by NEM, a cysteine-alkylating agent acting via kinase-dependent regulation, and the DIOA inhibition of B-insensitive K+ transport are two major characteristics of KCC (1, 3). Consistently, in complementary Cl− transport experiments, 20 μM DIOA showed an inhibitory effect on Cl− efflux, whereas 0.5 mM NEM stimulated the Cl− efflux in the KCC3 transfected cells (Fig. 3 B and C). On the other hand, the Cl− efflux was not sensitive to either DIOA or NEM in parental and mock-transfected cells (data not shown). These results establish that KCC3 functions as a KCl cotransporter.
Figure 3.
Signaling cascades involved in the regulation of KCC3 activity. (A) KCC3 activity is inhibited by 20 μM DIOA and stimulated by 0.5 mM NEM, which is sensitive to DIOA (20 μM) inhibition. KCC3 activity is independent of Ca2+ signaling. For Ca2+-free condition, KCC3-transfected cells were preincubated with 50 μM BAPTA-AM for 30 min, and then efflux was measured in Ca2+-free medium containing 1.5 mM EGTA. [BAPTA-AM, 1,2-bis(2-aminophenoxy)ethane-N, N, N′, N′-tetraacetic acid tetrakis(aceto-xymethyl ester)]. (B and C) The Cl− efflux in KCC3-transfected cells is sensitive to DIOA and NEM. Time courses of Cl− efflux (B) from KCC3-transfected cells treated with 20 μM DIOA or 0.5 mM NEM or 20 μM DIOA plus 0.5 mM NEM. Graph shows logarithm of fraction of original intracellular 36Cl− remaining as a function of time. (C) Summary of Cl− efflux rates calculated from the time-course results. To investigate the drug effects on K+ or Cl− efflux, KCC3-transfected cells were preincubated with 0.05% DMSO (control group) or drugs for 15 min at room temperature and then exposed to flux medium in the presence or absence of drugs. Each value in this figure represents mean ± SEM (n = 6). *, P < 0.05; **, P < 0.01; ***, P < 0.005 compared with control group.
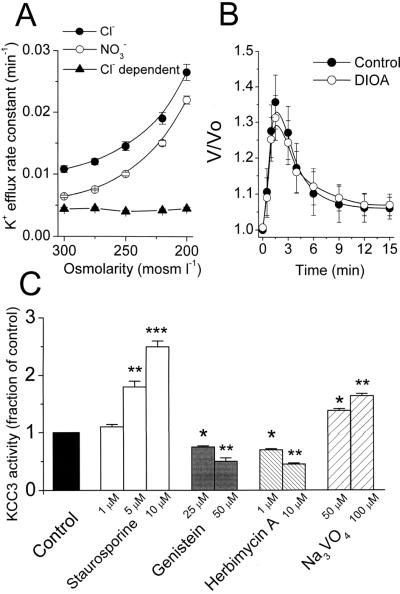
One of the most significant functions for KCC is to promote the regulation of cell volume (1–3). Osmotic swelling is therefore one of the important mechanisms shown to control the activity of KCC1 as well as KCC4 (4, 10). To assess the KCC3 activity challenged by osmotic stress, we investigated the effect of osmotic gradient on the O- and B-insensitive Cl−-dependent K+ efflux. As shown in Fig. 4A, the total K+ efflux was proportionally increased at lower osmolalities, but the Cl−-dependent component of K+ efflux was refractory to osmotic swelling. Further, the process of regulatory volume decrease was insensitive to 20 μM DIOA (Fig. 4B). Thus KCC3 did not participate in volume regulation of these cells. This is a significant functional difference between KCC3 and other KCC isoforms.
Figure 4.
KCC3 activity is not involved in volume regulation and is regulated by tyrosine phosphorylation. (A) The Cl−-dependent K+ efflux (KCC3 activity) is not activated by hypotonic shock. Each point represents mean ± SEM (n = 6). (B) Time courses of volume changes in KCC3-transfected cells after superfusion with hypotonic bath solution (220 mosmol l−1) in the absence or presence of 20 μM DIOA. The y axis (V/Vo) depicts cell volume at the indicated times divided by cell volume at zero time. Each point represents mean ± SEM (n = 50 cells). (C) KCC3 activity is sensitive to 5 and 10 μM staurosporine stimulation and is inhibited by tyrosine kinase inhibitors (genistein and herbimycin A) and potentiated by tyrosine phosphatase inhibitor (Na3VO4). To investigate the drug effects on K+ efflux, KCC3-transfected cells were preincubated with 0.05% DMSO (control group) or drugs for 15 min at room temperature and then exposed to flux medium in the presence or absence of drugs. Each bar represents mean ± SEM (n = 6). *, P < 0.05; **, P < 0.01; ***, P < 0.005 compared with control group.
As shown in Fig. 4C, 1 μM staurosporine did not activate KCC3 activity significantly. However, KCC3 activity, measured at increasing staurosporine concentrations, increased by 78 and 150% at 5 and 10 μM staurosporine treatment, respectively (Fig. 4C). KCC3 activity was inhibited by tyrosine kinase inhibitors genistein and herbimycin A and potentiated by tyrosine phosphatase inhibitor Na3VO4 (Fig. 4C). This indicates that tyrosine phosphorylation is involved in KCC3 regulation.
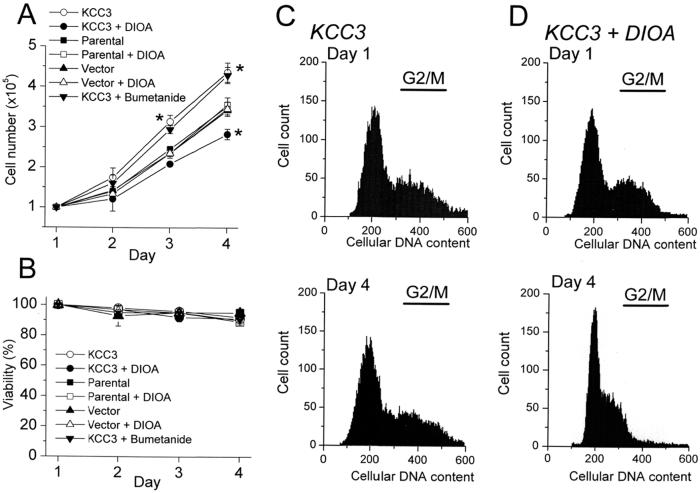
The obvious question to be answered is “what is the physiological significance of KCC3?” because KCC3 has been reported to have a broad distribution among tissues (7–9). The physiological mechanisms involved in ion homeostasis may have broader roles in phenomena such as cell proliferation and cell death (21). We have shown previously that human cervical carcinogenesis was accompanied by a pronounced up-regulation of KCC3 expression (15). In vascular endothelial cells, the expression of KCC3 mRNA was up-regulated by vascular endothelial growth factor (7). We therefore proposed that changes in KCC3 expression might contribute to cell growth or pathological conditions in cell proliferation. Accordingly, the effect of KCC3 overexpression on cell proliferation was studied. Compared with parental or mock-transfected cells, KCC3 expression enhanced cell growth that could be abolished by KCC inhibitor 20 μM DIOA (Fig. 5A). In the KCC3-transfected cells, the KCC3 activity could be completely inhibited by this concentration of DIOA (Fig. 2A). On the other hand, DIOA showed no effect on the growth curves of parental or mock-transfected cells, because there was no endogenous KCC activity in these cells (Figs. 1 and 3A). Importantly, the viability of these various cell types under different treatments was unimpaired (Fig. 5B). This indicates that the effect of DIOA is specific and is not caused by an indirect toxic effect.
Figure 5.
KCC3 expression enhances cell proliferation that could be abolished by KCC inhibitor DIOA. Cell numbers (A) were counted initially (Day 1) and at the indicated time point with the aid of a hemocytometer by using trypan blue exclusion (0.08%) to monitor cell viability (B) after incubation with 20 μM DIOA or 1 μM B. Each point in the curves represents mean ± SEM (n = 5). *, P < 0.05, compared with control group (parental cells) at the indicated time point. (C and D) Representative results of FACS measurements to determine cell cycle stages of KCC3-transfected cells under normal culture condition (C) or incubated with 20 μM DIOA (D).
A reduction in [Cl−]i has been reported to activate Na+K+2Cl− cotransporter (NKCC) in HEK-293 cells (20). To rule out the possibility that the advantage of KCC3-transfected cells in proliferation is because of NKCC activation, we test the effect of B on cell growth. As shown in Fig. 5A, the growth curve of KCC3-transfected cells was insensitive to 1 μM B, a concentration, which could inhibit 40–50% NKCC activity (20).
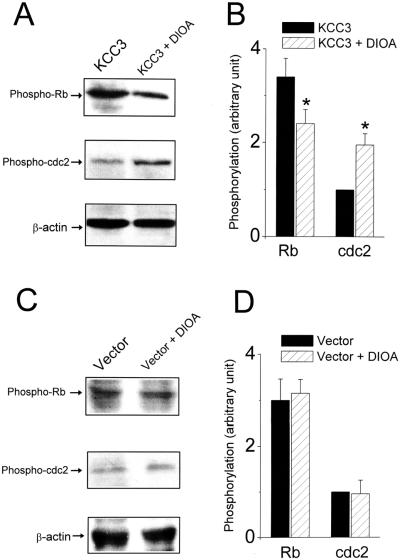
We investigated further whether the inhibitory effect of DIOA on cell growth was because of a block in the progression of cell cycle. FACS measurements showed that 33 ± 1% (n = 5) of KCC3-transfected cells were in G2/M phase under normal culture conditions for 3 days. In contrast, in the presence of 20 μM DIOA for 3 days, only 15 ± 2% (n = 5) of KCC3-transfected cells were in G2/M (P < 0.01; Fig. 5 C and D). More importantly, the phosphorylation of Rb and cdc2 kinase, two key regulators controlling progression through the restriction point from G1 into S phase and from G2 into M phase, respectively, was affected by the pharmacological blockade of KCC3. As depicted in Fig. 6 A and B, treatment with 20 μM DIOA for 3 days decreased the phosphorylated active form of Rb and increased the phosphorylated inactive form of cdc2 kinase in KCC3-transfected cells. On the other hand, the phosphorylation of Rb and cdc2 kinase was insensitive to DIOA treatment in mock-transfected cells (Fig. 6 C and D). Thus these results suggest that KCC3 activity is important for the progression of the cell cycle clock.
Figure 6.
Pharmacological blockade of KCC3 activity by DIOA changes the phosphorylation of Rb and cdc2 kinase in KCC3-transfected cells. (A and C) Western blot analysis of phospho-Rb and phospho-cdc2 after 3-day incubation without or with 20 μM DIOA in KCC3 (A) or mock-transfected (C) cells. All Western blots first probed with phospho-Rb or phospho-cdc2 antibodies were stripped and reprobed with β-actin antibody as the internal standard. (B and D) Phosphorylated levels of Rb or cdc2 kinase were analyzed by scanning densitometry with β-actin as the internal standard. Results were expressed as arbitrary units. Each bar represents mean ± SEM (n = three independent experiments). *, P < 0.05, compared between groups in the absence or presence of DIOA.
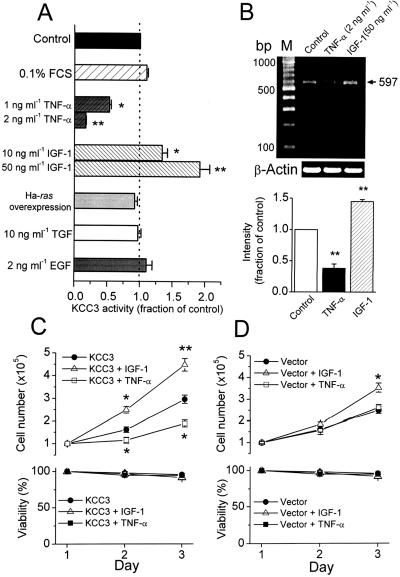
However, results based on the mere up-regulation in cell proliferation can be taken, at best, as suggestive but not as conclusive evidence for a role of this transporter in cell proliferation. Hence, we studied KCC3 activity under various culture conditions to test whether KCC3 activity is regulated by specific growth factors or cytokines. As shown in Fig. 7A, insulin-like growth factor-1 (IGF-1) stimulated KCC3 activity dose dependently, whereas tumor necrotic factor-α (TNF-α) inhibited KCC3 activity dose dependently when KCC3-transfected cells were treated with IGF-1 or TNF-α for 24 h in serum-free medium. Consistently, the expression of KCC3 mRNA was up-regulated by IGF-1 and down-regulated by TNF-α (Fig. 7B). TNF-α also induced growth arrest in KCC3-transfected cells but had no effect on the growth pattern of mock-transfected cells (Fig. 7 C and D). Although IGF-1 stimulated the growth of mock-transfected cells, the proliferation of KCC3-transfected cells was more sensitive to IGF-1 stimulation (Fig. 7 C and D). However, KCC3 activity was insensitive to the following treatments: (i) serum starvation for 24 h; (ii) oncogenic Ha-ras overexpression induced by IPTG; (iii) incubation with transforming growth factor or epidermal growth factor for 24 h (Fig. 7A).
Figure 7.
KCC3 expression is down-regulated by TNF-α and up-regulated by IGF-1. (A) KCC3 activity is inhibited by TNF-α but stimulated by IGF-1 dose dependently. The control group is KCC3-transfected cells cultured in DMEM containing 10% FCS. To investigate the effect of growth factors or cytokines on KCC3 activity, the transfected cells were cultured with serum-deprived (0.1% FCS) DMEM in the presence of various growth factors or cytokine for 24 h. To induce oncogenic Ha-ras overexpression, KCC3-transfected cells were cultured with serum-deprived medium in the presence of 2.5 mM IPTG for 48 h. TGF, transforming growth factor; EGF, epidermal growth factor. Each bar represents mean ± SEM (n = 6). *, P < 0.05; **, P < 0.01 compared with control group. (B) The expression of KCC3 mRNA was down-regulated by TNF-α and up-regulated by IGF-1, demonstrated by semiquantitative RT-PCR with β-actin as the internal standard. Each bar represents mean ± SEM (n = 3). **, P < 0.01 compared with control group by unpaired t test. (C and D) Effects of IGF-1 (50 ng⋅ml−1) and TNF-α (2 ng⋅ml−1) on the growth and viability of cells with KCC3 or mock transfection. Each point in the curves represents mean ± SEM (n = 5). *, P < 0.05; **, P < 0.01 compared with control group (without drug treatment) at the indicated time point by unpaired t test.
Discussion
The KCCs are members of the cation–chloride cotransporter gene family and fall into two phylogenetic subgroups: KCC1 paired with KCC3 and KCC2 paired with KCC4 (10). In the present study, we establish the functional and pharmacological characterizations of the recently cloned human KCC3 (8) by using the NIH/3T3 fibroblast expression system. KCC3 shares some common characteristics with other KCC isoforms, e.g., activity is stimulated by NEM and inhibited by DIOA. Despite 75–77% homology to KCC1 (7, 8), the regulation and function of KCC3 and KCC1 are very different. For example, KCC1 plays a dominant role in regulatory volume decrease in erythrocytes and some epithelial cells (1–3, 15), but KCC3 does not contribute to cell volume regulation. Staurosporine, a protein kinase inhibitor of high potency and broad specificity, is reported to stimulate KCC activity in various cell types (8, 22). For example, the half-maximum stimulatory concentration of staurosporine is about 0.5 μM to activate KCC1 in human erythrocytes (23). However, 2 μM staurosporine did not activate KCC1 activity in HEK-293 cells transfected with full-length rabbit KCC1 (24). In KCC3-transfected HEK-293 cells, 5 μM staurosporine gave a 3-fold stimulation in KCC3 activity (8). Compared with KCC1 in human erythrocytes (23) and KCC3 in HEK-293 cells (8), the staurosporine effect was much attenuated in our model. The present study also shows that tyrosine phosphorylation is involved in the regulation of KCC3 activity. Fgr and Hck, two members of the Src family of tyrosine kinases, have been proposed to be involved in the regulation of KCC1 in red blood cells (25), but the physiological input to these tyrosine kinases on KCC3 regulation is unknown. Recently, it has been shown that protein kinase G can regulate KCC3 expression in primary cultures of rat vascular smooth muscle cells (26).
The present study demonstrates the function of KCC3 in cell proliferation. KCC3 expression enhances cell growth, and this proliferative advantage can be antagonized by pharmacological blockade of KCC3 activity. In red blood cells, 20 μM DIOA inhibits KCC and has no effect on NKCC activity (27). However, it inhibited both KCC and NKCC in HEK cells (20). Here we demonstrated 1 μM B, a concentration sufficient to inhibit 40–50% NKCC activity, did not affect the growth curve of KCC3 transfected cells. This indicates the growth advantage of KCC3-transfected cells is not because of lower [Cl−]i, which would activate NKCC. Therefore, the present observation is a specific inhibitory effect of DIOA on KCC3 function rather than the result of nonspecific inhibition of other ion transporters. More importantly, the pharmacological inhibition of KCC3 activity by DIOA induced a significant decrease of cell numbers in the proliferative phase as shown by FACS measurements. It is likely that KCC3 activity is important for cell cycle progression. The core components controlling cell cycle progression are various specific cyclin-dependent kinases (cdks) and the kinase regulatory subunits, the cyclins. The role of each cyclin is to activate a specific cdk and direct the activated kinase complex to the appropriate substrate. The activated substrates (e.g., phosphorylated Rb and dephosphorylated cdc2) then execute the key steps in cell cycle progression. KCC activity may affect intracellular K+ and Cl− levels in many cell types (1–3). Here we found that [Cl−]i was 9 mM lower than control in KCC3 transfected cells, which was consistent with the direction of net Cl− transport through KCC. We therefore propose that the activation of specific cyclin-dependent kinases may be ion-sensitive and is linked with the KCC3 activity. This hypothesis is supported by the results of Western blot analysis for cell cycle proteins. The phosphorylated forms of two key cell cycle regulators, Rb and cdc2 kinase, were significantly changed by the pharmacological blockade of KCC3 activity by DIOA in KCC3-transfected cells. On the other hand, the phosphorylation of Rb and cdc2 kinase was insensitive to DIOA in the mock-transfected cells.
The present study also shows that IGF-1 up-regulates KCC3 mRNA expression, stimulates KCC3 activity, and enhances cell growth. On the other hand, TNF-α down-regulates KCC3 mRNA expression, inhibits KCC3 activity, and causes growth arrest. In human endothelial cells, mRNA of KCC3 could be up-regulated by vascular endothelial growth factor and down-regulated by TNF-α (7). This evidence supports the notion that the activity of KCC3 is sensitive to specific growth factors and cytokines, and this sensitivity is directly associated with cell growth. Because KCC3 is not universally expressed in all cell types, KCC3 cannot be essential for the growth process. However, it is very likely to be important in most epithelia under normal or pathophysiological growth conditions.
In conclusion, this study demonstrates that KCC3 plays a regulatory role in promoting cell growth instead of showing the classical KCC function in cell volume regulation.
Acknowledgments
This work was supported by the Wellcome Trust (J.C.E.), the National Science Council, Taiwan (C.Y.C. and H.S.L.), the Swire Education Trust (M.R.S.), and National Institutes of Health Grant R-37 DK33640 (P.B.D.).
Abbreviations
- KCC
KCl cotransporter
- DIOA
[(dihydroindenyl)oxy] alkanoic acid
- IPTG
isopropyl-β-d-thiogalactoside
- RT-PCR
reverse transcriptase–PCR
- Rb
retinoblastoma
- O
ouabain
- B
bumetanide
- NEM
N-ethylmaleimide
- IGF-1
insulin-like growth factor-1
- TNF-α
tumor necrotic factor-α
- HE
human embryonic kidney
- NKCC
Na+K+2Cl− cotransporter
Footnotes
This paper was submitted directly (Track II) to the PNAS office.
References
- 1.Lauf P K, Bauer J, Adragna N C, Fujise H, Zade-Oppen A M, Ryu K H, Delpire E. Am J Physiol. 1992;263:C917–C932. doi: 10.1152/ajpcell.1992.263.5.C917. [DOI] [PubMed] [Google Scholar]
- 2.Lauf P K, Adragna N C. Cell Physiol Biochem. 2000;10:341–354. doi: 10.1159/000016357. [DOI] [PubMed] [Google Scholar]
- 3.Ellory J C, Gibson J S, Stewart G W. Contrib Nephrol. 1998;123:220–239. doi: 10.1159/000059915. [DOI] [PubMed] [Google Scholar]
- 4.Gillen C M, Brill S, Payne J A, Forbush B., 3rd J Biol Chem. 1996;271:16237–16244. doi: 10.1074/jbc.271.27.16237. [DOI] [PubMed] [Google Scholar]
- 5.Rivera C, Voipio J, Payne J A, Ruusuvuori E, Lahtinen H, Lamsa K, Pirvola U, Saarma M, Kaila K. Nature (London) 1999;397:251–255. doi: 10.1038/16697. [DOI] [PubMed] [Google Scholar]
- 6.Kakazu Y, Akaike N, Komiyama S, Nabekura J. J Neurosci. 1999;19:2843–2851. doi: 10.1523/JNEUROSCI.19-08-02843.1999. [DOI] [PMC free article] [PubMed] [Google Scholar]
- 7.Hiki K, D'Andrea R J, Furze J, Crawford J, Woollatt E, Sutherland G R, Vadas M A, Gamble J R. J Biol Chem. 1999;274:10661–10667. doi: 10.1074/jbc.274.15.10661. [DOI] [PubMed] [Google Scholar]
- 8.Race J E, Makhlouf F N, Logue P J, Wilson F H, Dunham P B, Holtzman E J. Am J Physiol. 1999;277:C1210–C1219. doi: 10.1152/ajpcell.1999.277.6.C1210. [DOI] [PubMed] [Google Scholar]
- 9.Mount D B, Mercado A, Song L, Xu J, George A L, Jr, Delpire E, Gamba G. J Biol Chem. 1999;274:16355–16362. doi: 10.1074/jbc.274.23.16355. [DOI] [PubMed] [Google Scholar]
- 10.Mercado A, Song L, Vazquez N, Mount D B, Gamba G. J Biol Chem. 2000;275:30326–30334. doi: 10.1074/jbc.M003112200. [DOI] [PubMed] [Google Scholar]
- 11.Chang M Y, Jan M S, Won S J, Liu H S. Biochem Biophys Res Commun. 1998;248:62–68. doi: 10.1006/bbrc.1998.8911. [DOI] [PubMed] [Google Scholar]
- 12.Liu H S, Chen C Y, Lee C H, Chou Y I. Br J Cancer. 1998;77:1777–1786. doi: 10.1038/bjc.1998.296. [DOI] [PMC free article] [PubMed] [Google Scholar]
- 13.Chang M Y, Won S J, Yang B C, Jan M S, Liu H S. Exp Cell Res. 1999;248:589–598. doi: 10.1006/excr.1999.4436. [DOI] [PubMed] [Google Scholar]
- 14.Liu H S, Scrable H, Villaret D B, Lieberman M A, Stambrook P J. Cancer Res. 1992;52:983–989. [PubMed] [Google Scholar]
- 15.Shen M R, Chou C Y, Ellory J C. Pflügers Arch. 2000;440:751–760. doi: 10.1007/s004240000338. [DOI] [PubMed] [Google Scholar]
- 16.MacFarlane S N, Sontheimer H. Glia. 2000;30:39–48. doi: 10.1002/(sici)1098-1136(200003)30:1<39::aid-glia5>3.0.co;2-s. [DOI] [PubMed] [Google Scholar]
- 17.Lepple-Wienhues A, Szabo I, Laun T, Kaba N K, Gulbins E, Lang F. J Cell Biol. 1998;141:281–286. doi: 10.1083/jcb.141.1.281. [DOI] [PMC free article] [PubMed] [Google Scholar]
- 18.Ross P E, Cahalan M D. J Gen Physiol. 1995;106:415–444. doi: 10.1085/jgp.106.3.415. [DOI] [PMC free article] [PubMed] [Google Scholar]
- 19.Urbach V, Leguen I, O'Kelly I, Harvey B J. J Membr Biol. 1999;168:29–37. doi: 10.1007/s002329900495. [DOI] [PubMed] [Google Scholar]
- 20.Gillen C M, Forbush B., 3rd Am J Physiol. 1999;276:C328–C336. doi: 10.1152/ajpcell.1999.276.2.C328. [DOI] [PubMed] [Google Scholar]
- 21.Lang F, Busch G L, Ritter M, Volkl H, Waldegger S, Gulbins E, Haussinger D. Physiol Rev. 1998;78:247–306. doi: 10.1152/physrev.1998.78.1.247. [DOI] [PubMed] [Google Scholar]
- 22.Bize I, Dunham P B. Am J Physiol. 1994;266:C759–C770. doi: 10.1152/ajpcell.1994.266.3.C759. [DOI] [PubMed] [Google Scholar]
- 23.Godart H, Ellory J C. J Physiol. 1996;491:423–434. doi: 10.1113/jphysiol.1996.sp021226. [DOI] [PMC free article] [PubMed] [Google Scholar]
- 24.Lauf P K, Zhang J, Gagnon K B, Delpire E, Fyffe R E, Adragna N C. Cell Physiol Biochem. 2001;11:143–160. doi: 10.1159/000047802. [DOI] [PubMed] [Google Scholar]
- 25.De Franceschi L, Fumagalli L, Olivieri O, Corrocher R, Lowell C A, Berton G. J Clin Invest. 1997;99:220–227. doi: 10.1172/JCI119150. [DOI] [PMC free article] [PubMed] [Google Scholar]
- 26.Di, Fulvio M, Lincoln T M, Lauf P K, Adragna N C. J Biol Chem. 2001;276:21046–21052. doi: 10.1074/jbc.M100901200. [DOI] [PubMed] [Google Scholar]
- 27.Garay R P, Nazaret C, Hannaert P A, Cragoe E J., Jr Mol Pharmacol. 1988;33:696–701. [PubMed] [Google Scholar]


