

Abstract
Bacteria exhibit complex responses to biologically active small molecules. These responses include reductions in transcriptional and translational efficiency, alterations in metabolic flux, and in some cases, dramatic changes in growth and morphology. Here, we describe Min-1, a novel small molecule that inhibits growth of Gram-positive bacteria by targeting the cell envelope. Sub-inhibitory levels of Min-1 inhibits sporulation in Streptomyces venezuelae and reduces growth rate and cell length in Bacillus subtilis. The effect of Min-1 on B. subtilis cell length is significant at high growth rates sustained by nutrient rich media but drops off when growth rate is reduced during growth on less energy rich carbon sources. In each medium, Min-1 has no impact on the proportion of cells containing FtsZ-rings, suggesting that Min-1 reduces the mass at which FtsZ assembly is initiated. The effect of Min-1 on size is independent of UDP-glucose, which couples cell division to carbon availability, and the alarmone ppGpp, which reduces cell size via its impact on fatty acid synthesis. Min-1 activates the LiaRS stress response, which is sensitive to disruptions in the lipid II cycle and the cell membrane, and also compromises cell membrane integrity. Therefore, this novel synthetic molecule inhibits growth at high concentrations and induces a short-cell phenotype at sub-inhibitory concentrations that is independent of known systems that influence cell length, highlighting the complex interactions between small molecules and cell morphology.
INTRODUCTION
The impact of antibiotics on cell morphology has been an area of investigation since 1952.1 Since then, we have learned that treating different bacteria with antibiotics of varying targets and concentrations can induce different cell morphologies. These can be used as a tool to understand the underlying molecular mechanisms that govern cell growth and development as well as aid in identifying the targets of novel antibiotics. This cytological profiling approach of characterizing the effects of antibiotics on cell morphology and subcellular organization has been harnessed to identify the target pathways for both known antibiotics and novel natural products.2,3 Specifically, the nature of morphological changes induced by antimicrobial exposure are often suggestive of the compound’s general macromolecular target. Activation of the SOS response by DNA damaging agents such as mitomycin C, bleomycin, and ciprofloxacin result in cell filamentation through the direct binding of FtsZ by SulA in Escherichia coli4 or YneA in Bacillus subtilis.5 Inhibition of fatty acid synthesis by cerulenin slows the rate of cell envelope synthesis and results in reduced cell size in E. coli, B. subtilis, and Saccharomyces cerevisiae.6 The small molecule A22 binds the ATP-binding pocket of MreB, an actin-like protein that serves as a treadmilling platform for peptidoglycan synthesis, resulting in significant changes in cell width in rod-shaped bacteria.7,8 In previous work we identified compounds, including Fil-1, Fil-2 and Fil-3, that inhibit division in several Gram-positive bacteria, resulting in cell filamentation, and strongly inhibit spore development in the actinomycete S. coelicolor.9,10 While some of these connections between antibiotic target and induced cell morphology are well-characterized, our understanding of how cells maintain their size and how it is influenced by external factors such as antibiotics is still an ongoing line of research.
Here we report another Streptomyces sporulation inhibitor and novel molecule, Min-1, inhibits the growth of Gram-positive bacteria, including B. subtilis and S. aureus, by targeting the cell envelope. Min-1 mediated growth inhibition is concentration-dependent and accompanied by a distinct short cell phenotype in B. subtilis at sub-inhibitory concentrations. Analysis of Min-1 treated cells suggests that the short cell phenotype is a result of disruption of the cell envelope and is independent of UgtP and ppGpp. The effect of Min-1 on cell size is significant in nutrient rich media supporting rapid growth, but its effect on cell size is modest in defined minimal media. Combining the short cell phenotype with the observation that Min-1 treatment does not alter the proportion of cells containing FtsZ-rings suggests that the compound reduces the mass at which FtsZ assembly is initiated. Min-1 activates the LiaRS stress response associated with disruption of the lipid II cycle, has no impact on the cell-wall damage sensing σW extracytoplasmic function sigma factor, increases membrane permeability, and disrupts membrane potential. These effects are related to those demonstrated for the antibacterial peptide nisin, however, unlike nisin, supplementing the media with magnesium does not block the effects of Min-1. These findings reinforce the importance of the cell envelope in determining cell size and describe the bioactivity of a novel molecule discovered by screening against Streptomyces sporulation.
RESULTS AND DISCUSSION
Min-1 inhibits Streptomyces sporulation at sub-inhibitory concentrations
Min-1 is a synthetic molecule (Figure 1A) identified in a screen of 30,569 small molecules for compounds that blocked sporulation of Streptomyces coelicolor.9 It was of interest because, while the molecule blocked spore formation, it appeared to have relatively little effect on formation of vegetative substrate hyphae or sporogenic aerial hyphae.
Figure 1.

Effect of Min-1 on S. venezuelae development. a) Chemical structure of Min-1. b) Spot diffusion assay of S. venezuelae lawns treated with vancomycin and Min-1. c) SEM image of the S. venezuelae lawn in the Min-1 sub-MIC region. d) SEM image of untreated S. venezuelae lawn with arrows indicating septation of the hyphae.
To confirm the original screening result we tested Min-1 against the distantly related species Streptomyces venezuelae. Normally, S. venezuelae colonies go through a cycle of growth in which they first produce a beige mycelium of filamentous substrate hyphae. Later, they produce a white layer of sporogenic aerial hyphae, which grow upwards, conferring a white, fuzzy appearance to the colony surface. When the aerial hyphae sporulate, they turn green due to the activation of the whiE spore pigment genes.
We spotted 1 µL of 25 mM Min-1 on a lawn of S. venezuelae spores and, following growth, observed a zone of inhibition surrounded by a white halo. Further from the source of Min-1, the lawn exhibited the characteristic green pigmentation of S. venezuelae (Figure 1B). The white halo indicates a region where cells failed to express the whiE genes, a classic indication of a sporulation block in streptomycetes.10 In contrast, compounds like vancomycin, which inhibit growth but not sporulation, conferred a typical zone of inhibition with no white halo.
To confirm this phenotype, we used scanning electron microscopy (SEM) to image the surface of the bacterial lawn. Cells sampled from the green zone grew in chains of septated hyphae, indicating normal division into spores (Figure 1D). In contrast, cells in the white halo region lacked septated hyphae (Figure 1C). This confirms that Min-1 blocks sporulation in S. venezuelae indicating that this is a general effect of the drug against this genus. Min-1 had no other observable effects on the filamentous Streptomyces cells.
Min-1 inhibits growth of Gram-positive bacteria and reduces cell length of B. subtilis
Streptomyces cells employ molecular mechanisms for cell growth and division that are similar to those of rod shaped and coccoid bacteria though they deploy them differently. We therefore predicted that Min-1 might have antibiotic activity against other bacteria. Indeed, when we treated B. subtilis and S. aureus with Min-1 we found that it inhibited growth at a minimum inhibitory concentration (MIC) of 31 µM when cultured in LB medium (Table 1). The MIC of Min-1 against B. subtilis declined with the medium-supported growth rate, decreasing 2-fold in both S750-glucose and S750-glycerol indicating greater antimicrobial potency under these slower growth conditions. The compound had no inhibitory effect against E. coli at concentrations up to 100 µM though it was able to inhibit the growth of the hyperpermeable strain MC1061 11 at 61 µM. This suggests that the lipopolysaccharide (lps) layer of the Gram-negative outer membrane blocks access of Min-1 to a potential target(s).
Table 1.
Min-1 inhibits growth of Gram-positive organisms.
| Strain | Min-1 MIC (µM) |
|---|---|
| B. subtilis JH642 (LB) | 31 |
| B. subtilis JH642 (S750-glucose) | 16 |
| B. subtilis JH642 (S750-glycerol) | 16 |
| S. aureus ATCC 29213 | 30 |
| S. aureus ATCC BAA-44 | 22 |
| S. aureus ATCC BAA-41 | 33 |
| E. coli K-12 | >250 |
| E. coli MC1061 | 61 |
We explored the phenotypic effects of Min-1 on B. subtilis cultured in several different media (Figure 2A) supporting a range of doubling times. In LB-glucose, B. subtilis grew with a doubling time of ~21 min and reached an average length of 5.59 µm. Addition of 3 µM Min-1 reduced cell size to 4.78 µm but had no effect on growth rate. Higher concentrations of the drug further decreased size and growth rate, with 12 µM Min-1 reducing the average cell size by ~40% to 3.42 µm and increasing the doubling time to ~29 min. While Min-1 exposure reduced cell length, we did not observe any other significant morphological changes upon Min-1 treatment (Figure 2B).
Figure 2.

Min-1 inhibits growth of Gram-positive organisms and reduces cell length in B. subtilis. a) Impact of increasing concentrations of Min-1 on B. subtilis cell length cultured in LB-glucose, S750-glucose, and S750-glycerol. Larger and darker points represent higher Min-1 concentrations, from 0 µM to 12 µM. Error bars represent the standard error of the mean from three biological replicates with at least 100 cell lengths measured per replicate. b) Microscopy images of untreated (left) and Min-1 treated at 6 µM (right) B. subtilis cultured in LB-glucose.
Despite having greater antibiotic potency in defined S750 media (Table 1), Min-1’s effect on cell length was greatly reduced when B. subtilis was cultured in minimal media. Untreated cells cultured in S750-glucose12 grew slower and were significantly smaller than cells cultured in LB-glucose, reaching an average length of 3.17 µm. Treatment with 12 µM Min-1 reduced cell length to 2.94 µm. Similarly, untreated cells cultured in S750-glycerol reached an average length of 2.8 µm, which was reduced to 2.51 µm by treatment with 12 µM Min-1. Therefore, the effect of Min-1 on cell length was influenced by growth conditions: it was greatest when cells were growing rapidly in rich, undefined medium and did not have a significant effect in defined media supporting slower growth rates.
While a reduction in cell size is accompanied by slower growth rate under nutrient-limiting conditions, as we observed in the untreated cultures, the two factors are not strictly linked. Alterations in temperature,13 transcription inhibition,6 and thymine limitation14 can result in changes to either growth rate or cell size without impacting the other, demonstrating that the cell cycle can be decoupled from growth. Also, while various molecules and mechanisms induce cell filamentation (ciprofloxacin, ampicillin) or rounding (A22, mecillinam), small molecule induced cell shortening is a less frequently observed and understood phenotype.15 Disruption of some cellular mechanisms, specifically UgtP16 and fatty acid synthesis,6 have resulted in short cells and cytological profiling studies have shown that small molecule membrane disruption at high concentrations can lead to short cells.15 We were therefore interested in further understanding the bioactivity of this molecule and how it disrupts cell growth and the cell cycle.
Structural analogs of Min-1 have altered effects on growth rate and cell length
To identify chemical features responsible for growth inhibition and the short cell phenotype we compared the activities of Min-1 with 13 structural analogues. The results indicate that minor changes in structure have profound effects on the molecule’s activity (Figure 3). For example, when compared with Min-1, the analogues Min-1–5, Min-1–8, Min-1–9, Min-1–10, Min-1–11, Min-1–12 and Min-1–14 had greatly reduced potency (MIC greater than 100 µM) or in some cases no ability to block growth (MIC greater than 250 µM). Min-1–3, Min-1–13, Min-1–15 were active but exhibited higher MICs than the parent molecule, indicating lower potency. The potency of Min-1–6 and Min-1–9 were similar to Min-1’s in this assay and Min-1–7 exhibited improved potency with an MIC of 10 μM. We note that a dynamic light scattering experiment indicated that, unlike the rest of the compounds, M1–3, M1–4, M1–7 and M1–15 were prone to aggregation (not shown).
Figure 3.

Structure and activity of Min-1 analogs against B. subtilis and S. aureus
Changes to Min-1 structure also altered the effects of the molecules on cell length in B. subtilis cultured in LB-glucose (Figure 4). Testing the analogs against B. subtilis at 6 µM, we observed that the more active molecules also shortened cells to a greater degree (Figure 4A). Indeed, we observed a striking correlation between the reduction in growth rate and the short cell phenotype (Figure 4B). This suggests that the effect of Min-1 on cell size is directly coupled to its antimicrobial potency when cultured in nutrient rich media.
Figure 4.

a) Min-1 analogs demonstrate a link between cell length phenotype and inhibitory activity when cultured in LB-glucose, with the more active analogs inducing a shorter cell phenotype. b) The Min-1 analogs that reduce growth rate, as shown by cell doublings per hour, also have a greater impact on cell length. Error bars for each panel represent the standard error of the mean from three biological replicates with at least 100 cell lengths measured per replicate.
Min-1 disrupts coordination between growth and FtsZ ring assembly
Polymerization of the tubulin homologue FtsZ into a ring-like structure establishes the location of the bacterial division site. The FtsZ ring serves as a framework for assembly of the division machinery and is thus an excellent marker for cell cycle progression. The proportion of cells with FtsZ rings localized at midcell in a population reflects the relative time at which rings first form following the previous cell division. This frequency remains constant if the time at which rings first form relative to the time from cell birth to division is unchanged. In B. subtilis, the percentage of cells with FtsZ rings is high (~90%) in long, fast growing bacteria cultured in nutrient rich medium, consistent with their rapid mass doubling time. In contrast, the percentage of cells with FtsZ rings is lower in short, slow growing bacteria cultured in nutrient poor medium, consistent with their longer cell cycle time.17
To assess the influence of Min-1 on the cell cycle, we first determined the effect of Min-1 on the fraction of cells with FtsZ rings during growth in LB-glucose, a nutrient rich medium. Consistent with previous findings,17 an average of 95.4% of cells grown in LB-glucose contained a visible FtsZ-ring. This number was reduced to 79.1% and 63.7% in S750-glucose and S750-glycerol respectively, demonstrating that shorter and slower growing cells cultured in minimal media and different carbon sources display a delay in FtsZ ring formation.
Based on the reduction in growth rate and cell size induced by Min-1, we excepted Min-1 to also reduce the proportion of cells containing FtsZ rings relative to the untreated population. Strikingly, cells cultured with up to 12 μM Min-1 exhibited no significant change in the proportion of cells with FtsZ-rings in all three media (Figure 5A). In B. subtilis cultures treated with 12 μM Min-1 we observed an average of 91.8% of cells cultured in LB-glucose, 83.9% in S750-glucose, and 71.7% in S750-glycerol contained FtsZ-rings.
Figure 5.

Min-1 disrupts coordination between growth and FtsZ ring assembly independent of known cell size mechanisms. a) Proportion of treated B. subtilis cells with FtsZ rings is reduced with decreasing nutrient availability, but is not impacted over changing growth rates induced by increasing Min-1 concentrations. Min-1 treatment concentrations range from 0 µM (light, small) to a maximum of 12 µM (dark, large). b) The cell length to Z-ring ratio decreases as the growth rate slows at higher Min-1 concentrations. c) Cell length of knock-out mutants in the B. subtilis UgtP pathway, including ugtP, gtaB, and pgcA treated with 6 µM Min-1. d) Impact of 6 µM Min-1 on the cell length of a ppGpp null B. subtilis strain. Error bars for each panel represent the standard error of the mean from at least three biological replicates with at least 100 cells measured per replicate.
Changes in the length-to-ring ratio of a population of cells can help to identify instances in which a treatment disrupts coordination between growth and the cell cycle. Quantifying the total length of cells in the population and the number of FtsZ-rings present when cultured in LB-glucose revealed an average cell length-to-ring ratio of 7.3 µm/FtsZ rings (Figure 5B). Addition of up to 12 µM Min-1 reduced this ratio to 4.7. The degree to which Min-1 affected the length-to-ring ratio varied with the growth medium, decreasing from 4.8 in untreated culture to 4.2 with 12 µM Min-1 in cells cultured in S750-glucose, and from 5.5 to 4.4 in cells cultured in S750-glycerol. Together these data suggest that Min-1 reduces the mass at which FtsZ assembly is initiated, disrupting the coordination between growth and FtsZ-ring assembly, and that this effect is most significant when cells are grown in nutrient rich media.
To evaluate possible mechanisms through which Min-1 could impact cell length, we first investigated the UDP-glucose dependent division-inhibitor and glycosyltransferase UgtP.16 UgtP coordinates carbon availability with cell size in B. subtilis via changes in FtsZ assembly dynamics. During growth in carbon rich medium, high concentrations of its substrate UDP-glucose stimulates interaction between UgtP and FtsZ, delaying assembly of the division machinery and linking nutrient availability to cell length. Because UgtP impacts the cell cycle, defects in the three genes in the UDP-glucose biosynthesis pathway, ugtP, gtaB and pgcA reduce cell length under nutrient rich conditions but do not substantially impact growth rate.
To evaluate whether Min-1 acts through UgtP to induce the short cell phenotype, we compared the effect of Min-1 on wild type cells with its effects on strains bearing ugtP::cat, gtaB::spc, and pgcA::Tn10 mutations. As expected, the lengths of the untreated mutants were ~20% shorter than wild-type (Figure 5C). Application of 6 µM Min-1 to each mutant strain cultured in LB-glucose reduced cell length by an additional 10–15%, an effect equivalent to that on wild type cells. Furthermore, the MIC of Min-1 against the mutants was 31 μM, identical to that in the wild type. This demonstrates that Min-1 action is independent of the UgtP pathway.
ppGpp is a pleiotropic inhibitor of macromolecular synthesis in bacteria that reduces cell size, largely due to its impact on lipid synthesis.6 To determine whether the cell length effect of Min-1 is mediated through ppGpp, we tested Min-1 against a ppGpp-deficient strain of B. subtilis (JH642 ΔyjbM ΔywaC::kan ΔrelA::mls).18 If the cell shortening and growth inhibition phenotypes were mediated through Min-1 induction of ppGpp we would expect the ppGpp-deficient strain to be resistant to the Min-1 induced shortening and growth inhibition. Consistent with Min-1 impacting growth independently of ppGpp, the MIC of Min-1 for the ppGpp-deficient strain is the same as wild-type B. subtilis (31 µM). We also found that treatment with 6 µM of Min-1 reduced the length of ppGpp-deficient B. subtilis by more than 20%, the same magnitude as observed following treatment of the wild-type strain (Figure 5D). This demonstrates that Min-1 acts independently of ppGpp.
Min-1 targets the cell envelope
The cell envelope plays a vital role in determining and maintaining cell shape. To assess the possible impact of Min-1 on cell wall synthesis, we used two B. subtilis reporter strains, PliaI-lacZ19 and PσW-lacZ.20 These reporters are activated upon inhibition of different components of the cell wall synthesis machinery. PliaI is the promoter of the LiaRS two-component system that is strongly activated by direct interference with the lipid II cycle or by daptomycin, and, to a lesser extent, certain organic solvents and alkaline shock.21,22 Lipid II transports precursors for the biosynthesis of peptidoglycan across the bacterial membrane and this pathway is the target of many different antibiotics, including bacitracin,23 nisin,24 teixobactin 25 and malacidin A.26 σW is an extracytoplasmic function (ECF) sigma factor that activates a cell wall stress response to antibiotics that interfere with the assembly of peptidoglycan, including vancomycin and the β-lactams, but less so for those that directly interfere with the lipid II cycle.27,28
When we applied Min-1 to the PliaI-lacZ reporter strain we observed a clear blue halo around the zone of inhibition (Figure 6A), indicating activation of the reporter. In contrast, when we applied Min-1 to a PσW-lacZ B. subtilis reporter strain we did not observe any reporter activation (Figure 6A). This suggests that Min-1 targets the cell envelope at the membrane, either through the lipid II cycle or by directly disrupting membrane integrity.
Figure 6.
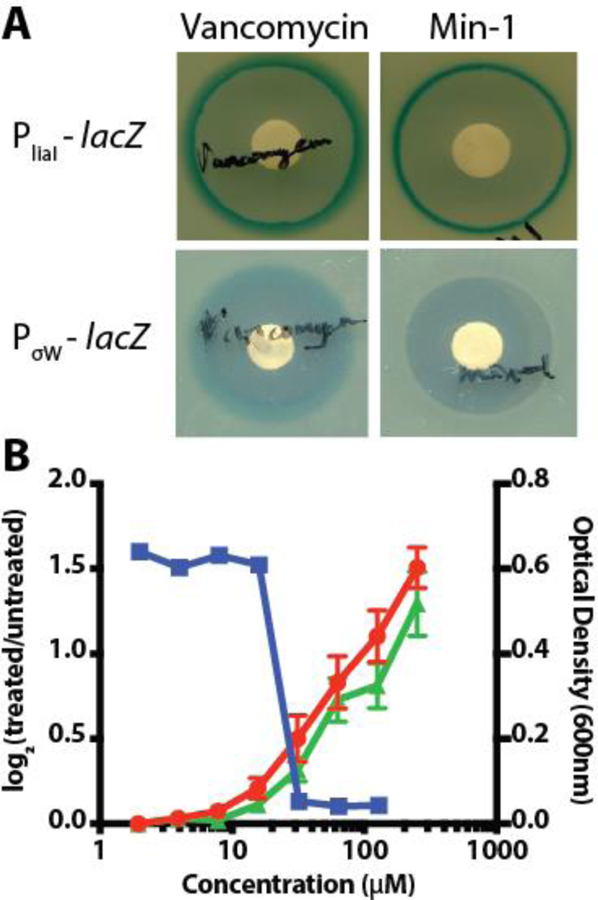
Min-1 targets the cell envelope. a) Impact of Min-1 and control antibiotics on B. subtilis reporter strains for cell wall assembly (PliaI-lacZ and PσW-lacZ). b) TO-PRO-3 iodide fluorescence (red ● - left axis), DiOC2(3) fluorescence (green ▲ - left axis) and B. subtilis optical density at 600 nm (■ - right axis) with increasing Min-1 treatment concentration. Error bars represent the standard error of the mean from three replicates.
Interestingly, this activity profile resembles that of nisin, an antimicrobial peptide that elicits a positive response from PliaI-lacZ21 but not PσW-lacZ.27 It has also been reported that sub-MIC concentrations of nisin reduce cell length in B. subtilis.29 Nisin action involves direct binding of lipid II with the concomitant inhibition of peptidoglycan synthesis; moreover, nisin also forms depolarizing pores across the cell membrane. This membrane activity is considered to be its principle mechanism of antimicrobial action.24
To determine whether Min-1 has an effect on membrane potential and permeability, we employed the DNA-binding fluorescent dyes, TO-PRO-3 iodide and DiOC2(3). TO-PRO-3 iodide strongly fluoresces when bound to DNA, however, it is unable to cross intact bacterial membranes and can therefore be used to monitor membrane integrity.30,31 DiOC2(3) is a cell permeant dye that, in response to a bacterial membrane potential, quenches its fluorescence output. Disruption of the membrane potential reduces this quenching and significantly increases the fluorescence emission intensity.32 These dyes can be combined into a single assay to distinguish disruption of membrane permeability from depolarization.31 Consistent with disruption of both the cell membrane integrity and depolarization, Min-1 cells exhibited a significant increase in TO-PRO-3 iodide and DiOC2(3) fluorescence beginning at the sub-inhibitory concentration of 10 µM and increasing through the MIC (Figure 6B).
Finally, to determine whether protecting membrane integrity compromises the antibacterial effect of Min-1, we performed a checkerboard assay in which varying concentrations of Min-1 were incubated with cells in the presence of varying concentrations of supplemental Mg2+. Supplemental magnesium stabilizes the bacterial membrane, as demonstrated by its ability to stabilize spheroplasts33,34 and ability to mitigate osmotic shock.35 It has also been used to suppress activation of the ywaC cell-wall stress response when treated with various antibiotics that target the cell envelope.36 We observed no effect of added Mg2+ on the MIC of Min-1, indicating that the action of the compound is more complex than simple disruption of the membrane. In contrast, the addition of supplemental Mg2+ had a strong protective effect against nisin: the MIC was doubled in the presence of 5 mM Mg2+ and increased more than 8-fold by 40 mM Mg2+ (Figure 7B). In summary, these data suggest that Min-1 compromises the lipid II cycle, thereby activating LiaRS. This could involve a direct interaction with lipid II or one of the enzymes that binds to it. Alternatively, Min-1 might interact with the membrane, compromising lipid II indirectly.
Figure 7.

Supplemental magnesium does not impact growth inhibition of Min-1. Checkerboards of (a) Min-1 and supplemental magnesium and (b) nisin and supplemental magnesium against B. subtilis grown in LB.
Min-1 is a novel inhibitor of bacterial growth.
We have demonstrated that Min-1, discovered initially for its capacity to inhibit sporulation in streptomycetes, also has antibacterial activity against B. subtilis and S. aureus, conferring a distinctive short cell phenotype at sub-MIC concentrations on the latter. The reduction in B. subtilis cell size is accompanied by an increase in mass doubling time but does not change the proportion of cells exhibiting FtsZ-rings. Therefore, Min-1’s effect does not involve compromising cell cycle progression while reducing cell length. Instead, we propose that the reduced cell size at sub-MIC concentrations is the result of FtsZ-rings forming at reduced cell mass relative to an untreated population. This effect is independent of two known cell size regulators that result in short cell phenotypes: the UgtP pathway and ppGpp. Rather, the mechanism by which this occurs involves depolarization of the membrane and a defect in the lipid II cycle, resulting in the activation of the LiaRS stress response.
The morphological impact of numerous antibiotics have been described previously and, to our knowledge, the spectrum of effects exhibited by Min-1 is not common. For example, of 43 known antibiotics that have undergone cytological profiling, 11 resulted in a reduction in cell length.15 These include ionophores or other molecules that destabilize the bacterial membrane, such as nisin, CCCP, nigericin, and spirohexenolide A, or target fatty acid synthesis, such as cerulenin or triclosan. Therefore, either direct or indirect disruption of the membrane inhibits membrane expansion and results in reductions in cell length. This could be caused by reduction in nutrient uptake or disruption of ATP synthesis via membrane depolarization. However, Min-1 also induces the LiaRS stress response, which is also activated by the lipid II targeting nisin, bacitracin, and vancomycin, and the membrane disrupting daptomycin, but not the membrane disrupting molecules peptides polymyxin B or friulimicin B.37 This level of specificity suggests that the action of Min-1 is more complex than simple membrane disruption.
METHODS
Bacterial Strains, Reagents, and General Methods
The following strains were used for MIC determination of Min-1 and its analogs, B. subtilis JH642, S. aureus ATCC 29213, S. aureus ATCC BAA-44, S. aureus ATCC BAA-41, E. faecalis ATCC29212, E. coli K-12 and E. coli MC1061. Microscopy was performed using B. subtilis JH642. Streptomyces sporulation assay was performed using S. venezuelae. The B. subtilis reporter strains used are as follows: B. subtilis HB0050 23 and B. subtilis BFS2470 (liaI).24 The UgtP pathway mutants strains used were AHL35 (gtaB::spc), PL1310 (pgcA::Tn10 cat) and BW421 (ugtP::cat).2 Growth media was liquid or agar Lysogeny Broth (LB) for all strains with the exception of S. venezuelae, which was grown on MYM agar at 30oC. For cell size assays, LB broth was supplemented with 0.2% glucose and S750 minimal media18 was supplemented with either 1% glucose or glycerol, and due to the JH642 auxotrophies, 40 µg/ml Trp and Phe. All chemicals were purchased from Sigma Aldrich. Antibiotic selection was performed using the following concentrations, erythromycin (1 µg mL−1), neomycin (10 µg mL−1), lincomycin (25 µg mL−1), chloramphenicol (25 µg mL−1) and spectinomycin (50 µg mL−1).
Streptomyces development inhibition assay and Scanning Electron Microscopy
S. venezuelae spore stock was diluted in sterile saline, spread on MYM agar and allowed to dry. 1 µL of Min-1 was then spotted into the agar and allowed to dry before incubating at 30 oC for 48 hours. For other antibiotics, 10 µL was added to a drug disk prior to being placed on the agar plate. In order to prepare the samples for SEM, the agar was cut at the edge of the zone of inhibition and fixed with 2% glutaraldehyde in 0.1% sodium cacodylate buffer followed by sputter coating with gold. Images were obtained using an FEI XL30 ESEM.
Determination of minimum inhibitory concentration
The minimum inhibitory concentration (MIC) defines the lowest concentration of a compound required to inhibit the growth. A single colony was grown in 5 mL of liquid growth media. Following overnight growth, the culture was diluted 100-fold into fresh LB, S750-glucose or S750-glycerol medium and incubated at 37 oC until the cells reached mid-log phase (OD600 of 0.3 to 0.5). The cells were diluted 10,000-fold into fresh medium and the MIC determined for each of the strains by adding 198 µL of the diluted cells to wells of a clear 96-well plate containing the compound at 2-fold dilutions. The plates were incubated at 37 oC overnight and the MIC determined as the lowest concentrations that inhibited growth as measured by OD600 in a BioTek Eon plate reader.
B. subtilis reporter assays
Screening for activation of PliaI and PσW was performed by disc diffusion. A single colony of the reporter strain was incubated in growth media overnight at 37 oC with the corresponding antibiotics. The overnight culture was diluted 20-fold in liquid LB and 500 µL of the diluted culture was added to an LB agar plate containing 500 µL of a 2% X-Gal solution. The antibiotics were either spotted directly to the LB agar plate or absorbed into a drug disk that was placed on the agar prior to incubating overnight at 37 oC. After incubation, the plates were scored for appearance of the blue rings at or near the edge of the zone of inhibition.
Membrane potential and permeability disruption
An overnight culture of B. subtilis JH642 was sub-cultured and grown to a mid-log growth phase (OD600 = 0.4) in liquid LB media at 37 oC on a rotating incubator set to 300 rpm. Cells were pelleted at 3000g for 10 minutes, the supernatant decanted, and washed twice in PBS+ (PBS supplemented with 10 mM glucose and 0.5 mM MgCl2). The pellet was then resuspended in PBS+ and diluted to an OD600 of 0.1. Concurrently, a blank PBS+ sample was also prepared. Dyes were aliquoted into both samples to a final concentration of 625 nM TO-PRO-3 Iodide (λEx = 600 nm, λEm = 650 nm) and 10 µM DiOC2(3) (λEx = 450 nm, λEm = 510 nm). Samples were allowed to incubate in darkness at room temperature for 5 minutes, then subject to compound treatment. Fluorescence was read immediately following treatment using a BioTek Synergy H1 plate reader.
Cell length measurements and FtsZ immunofluorescence labeling
B. subtilis strains were cultured on a roller drum at 37 oC from a single colony in LB + 0.2% glucose to OD600 = 0.2, then diluted 1:100 in LB-glucose with sub-inhibitory concentrations of Min-1 and grown to early exponential phase (OD600 = 0.15–0.3). For samples cultured in minimal media, cells where first cultured from a single colony in S750-glucose or S750-glycerol at 37 oC overnight. The overnight cultures were diluted into minimal medium to an OD600 = 0.005, then cultured to OD600 = 0.2 before being diluted 1:100 with, and without, Min-1 as indicated for the LB-glucose cultures. Early exponential phase samples were fixed with paraformaldehyde/glutaraldehyde (2.6%/0.008%) for 15 min at room temperature followed by a 30-min incubation on ice. Fixed cells were then adhered to an 18 well slide with 1% poly-l-lysine. Adherent cells were briefly incubated with 1 mg mL−1 lysozyme, then washed with PBS, followed by incubation with wheat germ agglutinin-tetramethylrhodamine to label the cell wall. FtsZ rings were labeled by immunofluorescence, using affinity-purified polyclonal rabbit anti-FtsZ antibody18 followed by a goat anti-rabbit secondary antibody conjugated to Alexa-488. Images were acquired with an Olympus BX51 microscope with an OrcaERG camera and captured using Nikon Elements. Cell lengths were determined by manually measuring the distance between adjacent septa using Nikon Elements analysis software. Cells were scored as positive for FtsZ-ring formation if they contained a fluorescent band across the width of the cell, two fluorescent foci across from one another at midcell, or a single focus visible at the midpoint of an invaginating septum.
ACKNOWLEDGEMENTS
We would like to thank J.D. Wang for the ppGpp null strains used in this study. We also acknowledge funding support from the National Institutes of Health (grants R35 GM127331 and RO1 GM064671) to P.A.L and the Canadian Institute for Health Research (grant MOP-133636) for J.R.N.
References
- 1.Pulvertaft RJV (1952) The effect of antibiotics on growing cultures of Bacterium coli. J. Pathol. Bacteriol 64, 75–89. [DOI] [PubMed] [Google Scholar]
- 2.Lamsa A, Lopez-Garrido J, Quach D, Riley EP, Pogliano J, and Pogliano K (2016) Rapid Inhibition Profiling in Bacillus subtilis to Identify the Mechanism of Action of New Antimicrobials. ACS Chem. Biol 11, 2222–2231. [DOI] [PMC free article] [PubMed] [Google Scholar]
- 3.Nonejuie P, Trial RM, Newton GL, Lamsa A, Ranmali Perera V, Aguilar J, Liu W-T, Dorrestein PC, Pogliano J, and Pogliano K (2016) Application of bacterial cytological profiling to crude natural product extracts reveals the antibacterial arsenal of Bacillus subtilis. J. Antibiot 69, 353–361. [DOI] [PMC free article] [PubMed] [Google Scholar]
- 4.Trusca D, Scott S, Thompson C, and Bramhill D (1998) Bacterial SOS checkpoint protein SulA inhibits polymerization of purified FtsZ cell division protein. J. Bacteriol 180, 3946–3953. [DOI] [PMC free article] [PubMed] [Google Scholar]
- 5.Kawai Y, Moriya S, and Ogasawara N (2003) Identification of a protein, YneA, responsible for cell division suppression during the SOS response in Bacillus subtilis. Mol. Microbiol 47, 1113–1122. [DOI] [PubMed] [Google Scholar]
- 6.Vadia S, Tse JL, Lucena R, Yang Z, Kellogg DR, Wang JD and Levin PA, (2017) Fatty Acid Availability Sets Cell Envelope Capacity and Dictates Microbial Cell Size. Curr. Biol 27, 1757–1767.e5 [DOI] [PMC free article] [PubMed] [Google Scholar]
- 7.Bean GJ, Flickinger ST, Westler WM, McCully ME, Sept D, Weibel DB, and Amann KJ (2009) A22 Disrupts the Bacterial Actin Cytoskeleton by Directly Binding and Inducing a Low-Affinity State in MreB. Biochemistry 48, 4852–4857 [DOI] [PMC free article] [PubMed] [Google Scholar]
- 8.Tropini C, Lee TK, Hsin J, Desmarais SM, Ursell T, Monds RD, and Huang KC (2014) Principles of Bacterial Cell-Size Determination Revealed by Cell-Wall Synthesis Perturbations. Cell Rep 9, 1520–1527. [DOI] [PMC free article] [PubMed] [Google Scholar]
- 9.Craney A, Ozimok C, Pimentel-Elardo SM, Capretta A, and Nodwell J (2012) Chemical Perturbation of Secondary Metabolism Demonstrates Important Links to Primary Metabolism. Chem. Biol 19, 1020–1027. [DOI] [PubMed] [Google Scholar]
- 10.Jani C, Tocheva E, McAuley S, Jensen G, and Nodwell J (2015) Streptomyces: a screening tool for bacterial cell division inhibitors. J. Biomol. Screen 20, 275–284. [DOI] [PMC free article] [PubMed] [Google Scholar]
- 11.Casadaban MJ, and Cohen SN (1980) Analysis of gene control signals by DNA fusion and cloning in Escherichia coli. J. Mol. Biol 138, 179–207. [DOI] [PubMed] [Google Scholar]
- 12.Jaacks KJ, Healy J, Losick R, and Grossman AD. (1989) Identification and characterization of genes controlled by the sporulation-regulatory gene spo0H in Bacillus subtilis. J. Bacteriol 171, 4121–4129. [DOI] [PMC free article] [PubMed] [Google Scholar]
- 13.Schaechter M, Maaløe O, and Kjeldgaard NO (1958) Dependency on Medium and Temperature of Cell Size and Chemical Composition during Balanced Growth of Salmonella typhimurium. J. Gen. Microbiol 19, 592–606. [DOI] [PubMed] [Google Scholar]
- 14.Si F, Li D, Cox SE, Sauls JT, Azizi O, Sou C, Schwartz AB, Erickstad MJ, Jun Y, Li X, and Jun S (2017) Invariance of Initiation Mass and Predictability of Cell Size in Escherichia coli. Curr. Biol 27, 1278–1287. [DOI] [PMC free article] [PubMed] [Google Scholar]
- 15.Nonejuie P, Burkart M, Pogliano K, and Pogliano J (2013) Bacterial cytological profiling rapidly identifies the cellular pathways targeted by antibacterial molecules. Proc. Natl. Acad. Sci. U. S. A, 110, 16169–16174. [DOI] [PMC free article] [PubMed] [Google Scholar]
- 16.Weart RB, Lee AH, Chien A, Haeusser DP, Hill NS and Levin PA (2017) A metabolic sensor governing cell size in bacteria. Cell 130, 335–347. [DOI] [PMC free article] [PubMed] [Google Scholar]
- 17.Weart RB, and Levin PA (2003) Growth rate-dependent regulation of medial FtsZ ring formation. J. Bacteriol 185, 2826–2834. [DOI] [PMC free article] [PubMed] [Google Scholar]
- 18.Kriel A, Bittner AN, Kim SH, Liu K, Tehranchi AK, Zou WY, Rendon S, Chen R, Tu BP, and Wang JD (2012) Direct Regulation of GTP Homeostasis by (p)ppGpp: A Critical Component of Viability and Stress Resistance. Mol. Cell 48, 231–241. [DOI] [PMC free article] [PubMed] [Google Scholar]
- 19.Jordan S, Junker A, Helmann JD, and Mascher T (2006) Regulation of LiaRS-dependent gene expression in Bacillus subtilis: identification of inhibitor proteins, regulator binding sites and target genes of a conserved cell envelope stress-sensing two-component system. J. Bacteriol 188, 5153–5166. [DOI] [PMC free article] [PubMed] [Google Scholar]
- 20.Huang X, Fredrick KL, and Helmann JD (1998) Promoter Recognition by Bacillus subtilis sigW: Autoregulation and Partial Overlap with the sigX Regulon. J. Bacteriol 180, 3765–3770. [DOI] [PMC free article] [PubMed] [Google Scholar]
- 21.Mascher T, Zimmer SL, Smith TA, and Helmann JD (2004) Antibiotic-inducible promoter regulated by the cell envelope stress-sensing two-component system LiaRS of Bacillus subtilis. Antimicrob. Agents Chemother 48, 2888–2896. [DOI] [PMC free article] [PubMed] [Google Scholar]
- 22.Radeck J, Fritz G, and Mascher T (2017) The cell envelope stress response of Bacillus subtilis: from static signaling devices to dynamic regulatory network. Curr. Genet 63, 79–90. [DOI] [PubMed] [Google Scholar]
- 23.Siewert G, and Strominger JL (1967) Bacitracin: an inhibitor of the dephosphorylation of lipid pyrophosphate, an intermediate in the biosynthesis of the peptidoglycan of bacterial cell walls. Proc. Natl. Acad. Sci. U.S.A 57, 767–773. [DOI] [PMC free article] [PubMed] [Google Scholar]
- 24.Wiedemann I, Breukink E, van Kraaij C, Kuipers OP, Bierbaum G, de Kruijff B, and Sahl HG (2001) Specific binding of nisin to the peptidoglycan precursor lipid II combines pore formation and inhibition of cell wall biosynthesis for potent antibiotic activity. J. Biol. Chem 276, 1772–1779. [DOI] [PubMed] [Google Scholar]
- 25.Ling LL, Schneider T, Peoples AJ, Spoering AL, Engels I, Conlon BP, Mueller A, Schäberle TF, Hughes DE, Epstein S, Jones M, Lazarides L, Steadman VA, Cohen DR, Felix CR, Fetterman KA, Millett WP, Nitti AG, Zullo AM, Chen C, and Lewis K (2015) A new antibiotic kills pathogens without detectable resistance. Nature 517, 455–459. [DOI] [PMC free article] [PubMed] [Google Scholar]
- 26.Hover BM, Kim S-H, Katz M, Charlop-Powers Z, Owen JG, Ternei MA, Maniko J, Estrela AB, Molina H, Park S, Perlin DS, and Brady SF (2018) Culture-independent discovery of the malacidins as calcium-dependent antibiotics with activity against multidrug-resistant Gram-positive pathogens. Nat Microbiol, 3, 415–422. [DOI] [PMC free article] [PubMed] [Google Scholar]
- 27.Cao M, Wang T, Ye R, and Helmann JD (2002) Antibiotics that inhibit cell wall biosynthesis induce expression of the Bacillus subtilis σW and σM regulons. Mol. Microbiol 45, 1267–1276. [DOI] [PubMed] [Google Scholar]
- 28.Helmann JD (2016) Bacillus subtilis extracytoplasmic function (ECF) sigma factors and defense of the cell envelope. Curr. Opin. Microbiol 30, 122–132. [DOI] [PMC free article] [PubMed] [Google Scholar]
- 29.Hyde AJ, Parisot J, McNichol A, and Bonev BB (2006) Nisin-induced changes in Bacillus morphology suggest a paradigm of antibiotic action. Proc. Natl. Acad. Sci. U.S.A 103, 19896–19901. [DOI] [PMC free article] [PubMed] [Google Scholar]
- 30.Xing Y-H, Wang W, Dai S-Q, Liu T-Y, Tan J-J, Qu G-L, Li Y-X, Ling Y, Liu G, Fu X-Q, and Chen H-P (2014) Daptomycin exerts rapid bactericidal activity against Bacillus anthracis without disrupting membrane integrity. Acta Pharmacol. Sin 35, 211–218. [DOI] [PMC free article] [PubMed] [Google Scholar]
- 31.McAuley S, Huynh A, Czarny TL, Brown E, and Nodwell J (2018) Membrane activity profiling of small molecule B. subtilis growth inhibitors utilizing novel duel-dye fluorescence assay. Medchemcomm 9, 554–561. [DOI] [PMC free article] [PubMed] [Google Scholar]
- 32.Novo D, Perlmutter N, Hunt R, and Shapiro H (2000) Multiparameter Flow Cytometric Analysis of Antibiotic Effects on Membrane Potential, Membrane Permeability, and Bacterial Counts of Staphylococcus aureus and Micrococcus luteus. Antimicrob. Agents Chemother, 44, 827–834 [DOI] [PMC free article] [PubMed] [Google Scholar]
- 33.Lederberg J (1956) Bacterial Protoplasts Induced by Penicillin Proc. Natl. Acad. Sci. U.S.A, 42, 574–577. [DOI] [PMC free article] [PubMed] [Google Scholar]
- 34.Zinder ND, and Arndt WF (1956) Production of Protoplasts of Escherichia coli by Lysozyme Treatment. Proc. Natl. Acad. Sci. U.S.A, 42, 586–590 [DOI] [PMC free article] [PubMed] [Google Scholar]
- 35.Neu HC, and Heppel LA (1965) The release of enzymes from Escherichia coli by osmotic shock and during the formation of spheroplasts. J. Biol. Chem 240, 3685–3692. [PubMed] [Google Scholar]
- 36.Czarny TL, Perri AL, French S, and Brown E (2014) Discovery of Novel Cell Wall-Active Compounds Using PywaC, a Sensitive Reporter of Cell Wall Stress, in the Model Gram-Positive Bacterium Bacillus subtilis. Antimicrob. Agents Chemother, 58, 3261–3269. [DOI] [PMC free article] [PubMed] [Google Scholar]
- 37.Wecke T, Zühlke D, Mäder U, Jordan S, Voigt B, Pelzer S, Labischinski H, Homuth G, Hecker M, and Mascher T (2009) Daptomycin versus Friulimicin B: in-depth profiling of Bacillus subtilis cell envelope stress responses. Antimicrob. Agents Chemother, 53, 1619–1623. [DOI] [PMC free article] [PubMed] [Google Scholar]