Abstract
Our hypothesis is that leptin release is controlled neurohormonally. Conscious, male rats bearing indwelling, external, jugular catheters were injected with the test drug or 0.9% NaCl (saline), and blood samples were drawn thereafter to measure plasma leptin. Anesthesia decreased plasma leptin concentrations within 10 min to a minimum at 120 min, followed by a rebound at 360 min. Administration (i.v.) of lipopolysaccharide (LPS) increased plasma leptin to almost twice baseline by 120 min, and it remained on a plateau for 360 min, accompanied by increased adipocyte leptin mRNA. Anesthesia largely blunted the LPS-induced leptin release at 120 min. Isoproterenol (β-adrenergic agonist) failed to alter plasma leptin but reduced LPS-induced leptin release significantly. Propranolol (β-receptor antagonist) produced a significant increase in plasma leptin but had no effect on the response to LPS. Phentolamine (α-adrenergic receptor blocker) not only increased plasma leptin (P < 0.001), but also augmented the LPS-induced increase (P < 0.001). α-Bromoergocryptine (dopaminergic-2 receptor agonist) decreased plasma leptin (P < 0.01) and blunted the LPS-induced rise in plasma leptin release (P < 0.001). We conclude that leptin is at least in part controlled neurally because anesthesia decreased plasma leptin and blocked its response to LPS. The findings that phentolamine and propranolol increased plasma leptin concentrations suggest that leptin release is inhibited by the sympathetic nervous system mediated principally by α-adrenergic receptors because phentolamine, but not propranolol, augmented the response to LPS. Because α-bromoergocryptine decreased basal and LPS-induced leptin release, dopaminergic neurons may inhibit basal and LPS-induced leptin release by suppression of release of prolactin from the adenohypophysis.
Keywords: plasma leptin‖ketamine‖isoproterenol‖propanolol‖phentolamine
The close interrelationships among the immune, endocrine, and nervous systems allow the organism to respond as a whole to different types of stress and changes in the environment. Rather than acting independently, these systems are closely interrelated through their messenger molecules: cytokines, hormones, neurotransmitters, neuropeptides, and nitric oxide. Thus, a complex network allows the organism to respond to noxious stimuli and changes in the environment to preserve homeostasis (1).
In inflammatory stress induced by peripheral or central administration of lipopolysaccharide (LPS) in rodents, there are a number of changes in the immune system such as: stimulation of release of acute phase proteins, induction of nitric oxide synthase activity and synthesis, and increased release of cytokines (2–7). Proinflammatory cytokines, such as tumor necrosis factor α and IL-1, released from immune cells reach the central nervous system (CNS) and increase release of corticotrophin-releasing hormone that activates the pituitary–adrenal axis (8). LPS also alters the release of other pituitary hormones in rats, increasing prolactin release and decreasing growth hormone, thyroid-stimulating hormone, and luteinizing hormone release (5). There are a variety of other changes in the CNS caused by LPS as well, many of which probably are mediated by LPS-induced cytokine release, such as alterations of central and peripheral catecholamine levels (9, 10) and alteration of neurotransmitter release in different areas of the brain (11). These result in induction of fever, loss of appetite, libido, and somnolence, and many metabolic changes.
Leptin is a cytokine (12–15), and, like other proinflammatory cytokines, such as tumor necrosis factor α, IL-1, and IL-6, leptin also is secreted in response to the inflammatory stress induced by LPS (1, 16). In previous research, we have determined that i.v. injection of LPS in conscious, freely moving rats bearing indwelling, jugular catheters increased plasma leptin concentrations 100% over baseline concentrations within 2 h (16). Similar results also were found in experiments in mice (17). Recent research in humans showed that plasma leptin levels were increased in survivors of acute sepsis (18), and it was shown in another in vivo paradigm in mice that leptin exerted a protective effect on tumor necrosis factor α-induced sepsis (19), suggesting that leptin might be an antistress cytokine.
Plasma leptin concentrations have a circadian rhythm, with values peaking in the middle of the night in both humans (20) and rats (21). There is also an ultradian rhythm of plasma leptin in humans (20). These studies suggest that leptin release is controlled by the CNS. That anesthetization and surgical stress significantly decreased plasma leptin concentration in male rats (22) led us to hypothesize that stress-induced alterations in leptin release are also under the control of the CNS. Therefore, we decided to evaluate the role of anesthesia in a different model of stress, namely, the inflammatory stress induced by LPS. Because anesthesia alters the activity of the sympathetic nervous system, we studied the effect of isoproterenol (β-adrenergic agonist), propranolol (β-adrenergic antagonist), α-bromoergocryptine (a dopamine 2 agonist), and phentolamine (α-adrenergic antagonist) alone or in the presence of LPS on plasma leptin concentrations.
Materials and Methods
Animals.
Adult male rats (350–400 g) of the Holtzman strain (Harlan–Sprague–Dawley) were used. Upon arrival, the animals were allowed to acclimate for 2 weeks in a room with controlled temperature (23–25°C) and lighting (lights on from 7 a.m. to 7 p.m.). A standard pellet diet and tap water were available ad libitum. Procedures involving animals were approved by the Pennington Biomedical Research Center–Institutional Animal Care and Use Committee.
Drugs.
All of the drugs were purchased from Sigma with the exception of the anesthetic (ketamine/acepromazine/xylazine), which was provided by the Division of Comparative Biology at Pennington Biomedical Research Center. The drugs were freshly prepared on the day of the experiment and dissolved in (0.15 M NaCl) saline with the exception of α-bromoergocryptine, which was dissolved in ethanol (ETOH) at a concentration of 16 mg/ml, and, thereafter, it was diluted in saline to the final concentration. The final concentration of ETOH was 18.75%. α-Bromoergocryptine (5 mg/kg) was injected i.v. at a volume of 0.5 ml. LPS (0127:B8) (0.15 mg/kg) was also injected i.v. at a volume of 0.5 ml. The other drugs, isoproterenol, propranolol, and phentolamine, were injected i.p. at a dose of 10 mg/kg dissolved at a volume of 0.4 ml of saline. Phentolamine was sonicated until complete dissolution in an ultrasonic device (Bransonic 2210; Danbury, CT).
Repeated Blood Sampling.
One day before blood sampling, a silastic catheter was introduced into the right external jugular vein and advanced to the right atrium according to the technique of Harms and Ojeda (23) by using i.p. ketamine/acepromazine/xylazine anesthesia (90 + 2 + 6 mg/ml, respectively), 0.1 ml/100 g body weight.
After the operation, the rats were housed singly in cages overnight in the experimental room. One hour before the experiment, polyethylene tubing filled with 0.9% NaCl (saline) containing 500 units/ml heparin was connected to the jugular catheter, and 0.5 ml of 500 units/ml heparin was injected. Immediately after collection of the initial (0.6 ml) blood sample (time − 15 min), the test substance dissolved in 0.5 ml of saline or the saline diluent was injected i.v. over a period of 30 sec. Fifteen minutes later (time 0), LPS or saline was injected. Thereafter, subsequent samples were withdrawn at 15, 30, 120, 240, and 360 min. Each time, the volume of blood withdrawn was replaced by an equal volume of saline containing 50 units/ml heparin. Blood was centrifuged (650 × g) during 15 min, and plasma was stored at −70°C until determination of leptin.
Plasma Leptin Determination.
Leptin was measured by RIA with rat leptin kits purchased from Linco Research Immunoassay (St. Charles, MO). The intraassay and interassay coefficients of variation were 3.7% and 4.2%, respectively. The curve was linear between 1 and 20 ng/ml.
Leptin mRNA Analysis.
Total RNA was isolated from epididymal fat pads by using RNAzol B, followed by precipitation with isopropanol and ethanol washes according to the manufacturer's instructions (Tel-Test, Friendswood, TX). Protection assays were performed by the protocol as described (24), with some modifications. A 342-bp fragment of rat leptin cDNA cloned into PCRII vector was kindly provided by Ruth B. S. Harris (Louisiana State University). The construct was linearized with BsaI and used to generate a 32P-labeled antisense cRNA by using a riboprobe kit (Promega) with T7 RNA polymerase. The total RNA (12 μg) was hybridized with 250,000 cpm of gel-purified 32P-labeled antisense probe in 20 μl of buffer containing 80% deionized formamide, 40 mm piperazine-N-N′-bis (2-ethanesulfonic acid) (pH 6.4), 0.4 M NaCl, and 1 mM EDTA for 16 h at 45°C. All samples were hybridized to 250,000 cpm of 32P-labeled labeled cyclophilin cRNA to normalize the leptin mRNA values. After hybridization, the samples were digested with 5 units of RNase I (Promega) in the presence of RNase digestion buffer containing 10 mM Tris⋅HCl (pH 7.5), 5 mM EDTA, and 200 mM sodium acetate at 37° for 1 h. The digestion reaction was terminated by the addition of 3 μl of 20% SDS and 10 μg yeast-transfer RNA. Protected hybrids were precipitated with 2–3 vol of ethanol, denatured, and electrophoresed on a 5% polyacrylamide gel containing 7 M urea. The integrated optical density of bands of the autoradiographic exposures from each gel were quantified by scanning densitometry.
Statistical Analysis.
Statistical differences between two means were calculated by Student's t test when the data passed the normality and equal variance test. When the data did not pass the normality and equal variance test, a nonparametric test was performed, namely, the Mann–Whitney U test. The data are expressed as percentage of the initial value, where the initial concentration of plasma leptin was considered 100%. In the isoproterenol experiments, the Delta Minimum was calculated, taking the maximum difference obtained below the baseline leptin concentration. The area under the curve and all of the statistical analysis were performed with graph pad prism 3.
Results
Effect of Anesthesia on LPS-Induced Leptin Release.
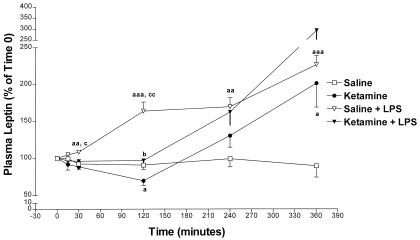
Saline (0.4 ml) or ketamine/acepromazine/xylazine (90 + 2 + 6 mg/ml, respectively; 0.1 ml/100 g body weight), the same dose used in our previous research (22), was injected i.p. at −15 min. By time 0, the anesthetic decreased leptin concentrations and there was a very significant difference between the anesthetic-treated rats and the control group (P < 0.001) (Fig. 1). In this and the following experiments, a second i.v. control injection of saline or LPS (0.15 mg/kg) was administered at time 0 (Fig. 2). After time 0, the anesthetic further decreased leptin concentrations that reached their minimum at 120 min (P < 0.05) vs. saline-treated rats. There was a very significant, negative linear regression between −15 min and 120 min in the anesthetic-treated rats (P = 0.003 and r = 0.98; data not shown). Thereafter, between 120 and 360 min, there was a rebound in plasma leptin concentration that exceeded the values in the saline-treated rats at 360 min (P < 0.05), nearly a 2-fold increase over the starting value. During this time, 120–360 min, there was a positive linear regression of plasma leptin with time (P = 0.01, r = 0.999) (data not shown) in the anesthetized rats.
Figure 1.
The effect of ketamine/acepromazine/xylazine anesthesia (90 + 2 + 6 mg/ml, respectively; 0.1 ml/100 g body weight) on leptin release 15 min after injection. The number of animals (n) = 13 in both groups. In this and subsequent figures, bars or symbols represent the mean response at each time point. The vertical line above or below the bars or symbols represents 1 SEM. ***, P < 0.001 vs. saline.
Figure 2.
The effect of ketamine/acepromazine/xylazine anesthesia (90 + 2 + 6 mg/ml, respectively; 0.1 ml/100 g body weight) on leptin release. The number of animals (n) = 7 in the saline-treated and anesthetized groups; n = 6 in the saline + LPS-injected rats and in the anesthetic + LPS-treated group. a, P < 0.05 vs. saline; aa, P < 0.01 vs. saline; aaa, P < 0.001 vs. saline; b, P < 0.05 vs. ketamine alone; c, P < 0.05 vs. ketamine + LPS; cc, P < 0.01 vs. ketamine + LPS.
After LPS injection, plasma leptin concentrations gradually increased, reaching a significant difference at 30 min (P < 0.01), plateaued from 120 to 240 min, and then climbed to a maximum, more than 2-fold increase at 360 min (P < 0.001). In the presence of LPS, ketamine partially blocked the LPS-induced leptin release by 65% at 120 min (Fig. 2) [P < 0.01 vs. (saline + LPS)-treated rats; P < 0.05 vs. ketamine alone]. Thereafter, there was a rebound in plasma leptin concentration in ketamine plus LPS-injected rats that rose to a peak at 360 min of almost 300% over its initial value. The largest differences among the four groups were obtained at 120 min as shown in Fig. 2.
Effect of Isoproterenol (β-Adrenergic Agonist) on LPS-Induced Leptin Release.
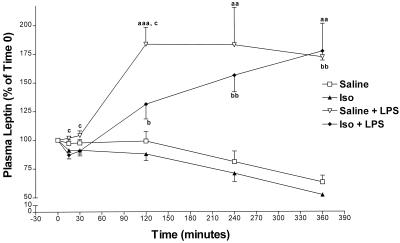
Isoproterenol, injected at the same dose (10 mg/kg) used to block LPS-induced tumor necrosis factor α release (25), or saline was injected i.p. at −30 min. At time 0, there were no significant differences in plasma leptin between the isoproterenol- and saline-treated groups (data not shown). Saline-injected rats presented no significant differences from the isoproterenol-treated group at any time point; however, calculation of the Delta Minimum between the saline- and isoproterenol-treated groups revealed that isoproterenol significantly decreased plasma leptin concentrations (P < 0.05; data not shown). LPS was injected at time 0, resulting in a similar pattern of plasma leptin as that in Fig. 2 (Fig. 3). Isoproterenol partially decreased LPS-induced plasma leptin concentration at 120 min by 40% (P < 0.05; Fig. 3). The area under the curve was calculated between 0 and 120 min, showing that isoproterenol decreased LPS-induced leptin release (P < 0.01 vs. saline + LPS; data not shown).
Figure 3.
The effect of 10 mg/kg i.p. isoproterenol (Iso) (agonist β-adrenergic) on leptin release. n = 8 in the saline-treated rats and in the Iso-injected group; n = 7 in the saline + LPS treated-animals and in the Iso + LPS-injected rats. aa, P < 0.01 vs. saline; aaa, P < 0.001 vs. saline; b, P < 0.05 vs. Iso alone (25); bb, P < 0.01 vs. Iso alone; c, P < 0.05 vs. Iso + LPS.
Effect of Propranolol on LPS-Induced Leptin Release.
Saline or propranolol (10 mg/kg) at the same dose used previously (25) was injected at −15 min. There were no significant differences between −15 and 0 min between saline- and propranolol-treated rats (data not shown). Thereafter, in the presence of propranolol, plasma leptin concentrations were not significantly higher at 240 and 360 min than in the saline-treated rats (Fig. 4). Propranolol had no effect on LPS-induced leptin release (Fig. 4).
Figure 4.
The effect of 10 mg/kg propranolol (β-adrenergic antagonist) on leptin release. The number of animals (n) = 8 in the saline-injected group, n = 10 in the propranolol-treated animals, n = 9 in the saline + propranolol-injected animals, and n = 13 in the propranolol + LPS-treated rats. *, P < 0.05 vs. saline.
Effect of Phentolamine (α-Adrenergic Antagonist) on LPS-Induced Leptin Release.
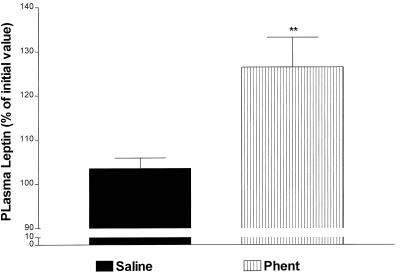
Saline or phentolamine (10 mg/kg) at the same dose used in previous studies (25) was injected i.p. at −15 min. Phentolamine alone produced a highly significant increase of 20% (P < 0.01 vs. saline) in plasma leptin concentration within 15 min (Fig. 5). Thereafter, phentolamine alone increased plasma leptin concentrations at 120 min that rose further at 240 min (P < 0.01 and P < 0.001 vs. saline, respectively; Fig. 6). In the presence of LPS, phentolamine increased plasma leptin concentrations above those detected in the saline + LPS-treated rats between 120 and 360 min (P < 0.01 at 120 min and P < 0.05 at 240 and 360 min vs. saline + LPS; Fig. 6).
Figure 5.
The effect of 10 mg/kg i.p. phentolamine (Phent) (α-adrenergic antagonist) on leptin release 10 min after injection. n = 17 in the saline-injected group and n = 11 in the phentolamine-treated group; **, P < 0.01 vs. saline.
Figure 6.
The effect of 10-mg/kg i.p. phentolamine (Phent) (α-adrenergic antagonist) on leptin release. The number of animals (n) = 7 in the saline-injected group, n = 5 in the Phent-treated animals, n = 10 in the saline + LPS-injected animals, and n = 6 in the Phent + LPS-treated rats. a, P < 0.05 vs. saline; aa, P < 0.01 vs. saline; aaa, P < 0.001 vs. saline; bbb, P < 0.001 vs. Phent alone; c, P < 0.05 vs. saline + LPS; cc, P < 0.01 vs. saline + LPS. Standard error plotted below the mean is represented by a thin line; those above the mean are represented by thick lines.
Effect of α-Bromoergocryptine on LPS-Induced Leptin Release.
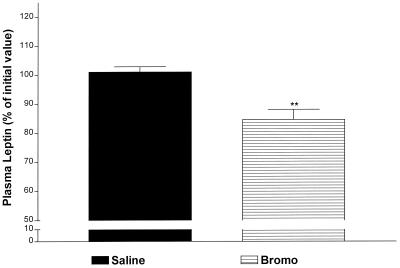
Saline or α-bromocryptine (5 mg/kg) at the same dose used previously (25) was injected i.v. at −15 min. Between −15 and 0 min, α-bromoergocryptine alone decreased plasma leptin highly significantly by 18% (P < 0.01 vs. saline; Fig. 7) as reported (25). Thereafter, plasma leptin concentration in the α-bromoergocryptine-treated rats remained lower than the saline-treated rats at 30 min (P < 0.05 vs. saline; Fig. 8). Thereafter, plasma leptin concentrations gradually increased in the α-bromoergocryptine-injected animals, but the values were not significantly greater than the initial concentrations. In contrast, values in the saline-injected rats declined progressively and significantly after 30 min to reach a minimum at 360 min. This resulted in significant increases in plasma leptin in the bromocryptine- vs. saline-injected rats (P < 0.01 at every time point between 120 and 360 min; Fig. 8). In the presence of LPS, α-bromoergocryptine decreased LPS-induced leptin release between 0 and 120 min (P < 0.01 at 15 min, P < 0.05 at 30 min, and P < 0.001 at 120 min vs. saline + LPS-treated rats) (Fig. 8).
Figure 7.
The effect of 5 mg/kg i.v. α-bromoergocryptine (Bromo) (dopaminergic-2 agonist) on leptin release. The values are expressed as a percentage of the initial values and were obtained 15 min after i.p. injection of saline or Bromo. The number of animals (n) = 13 in both groups. **, P < 0.01 vs. saline.
Figure 8.
The effect of 5 mg/kg i.v. bromocryptine (Bromo) (dopaminergic-2 agonist) on leptin release. The number of animals (n) = 7 in the saline-treated animals and the Bromo-injected group; n = 6 in the saline + LPS-treated rats and in the Bromo + LPS-injected animals. a, P < 0.05 vs. saline; aa, P < 0.01 vs. saline; aaa, P < 0.001 vs. saline; bb, P < 0.01 vs. Bromo alone; bbb, P < 0.001 vs. Bromo alone; c, P < 0.05 vs. Bromo + LPS; cc, P < 0.01 vs. Bromo + LPS; ccc, P < 0.001 vs. Bromo + LPS.
Effect of LPS on Leptin mRNA in Epididymal Fat Pads.
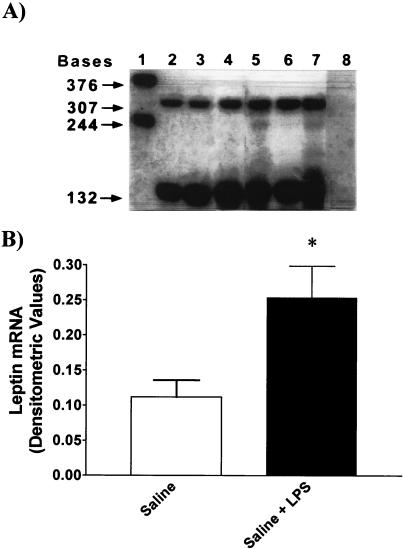
LPS increased leptin mRNA by 2.3-fold (P < 0.05 vs. saline; Fig. 9).
Figure 9.
(A) Representative autoradiogram showing the detection of leptin (307 bases) mRNA expressed in total fat RNA (12 μg) from control (lanes 2–4) and LPS-treated rats (lanes 5–7) and digested cyclophilin (132 bases; lanes 2–7). Lane 1 illustrates the undigested, full-length RNA probes for leptin (376 bases) and cyclophilin (244 bases). In lane 8, where no hybridization is seen, 12 μg of yeast tRNA was used. (B) Composite drawings showing the densitometric quantitation of the bands from two blots corresponding to the fat leptin mRNA isolated from control and LPS (*, P < 0.05 vs. saline).
Discussion
That plasma leptin concentration declined gradually in anesthetized male rats during surgery led us to hypothesize that leptin secretion was under neural control (22). To assess the neural control of leptin, we used another type of stress, namely, the inflammatory stress induced by LPS that is known to increase leptin release (16). Furthermore, it was shown that LPS increased catecholamine levels in the CNS (9, 11) and in the periphery (10) and also activated the hypothalamic–pituitary–adrenal axis (5, 6). Therefore, we considered the present paradigm as a suitable model to assess the neural control of leptin.
Our previous results had shown that LPS evoked a rapid and long-lasting increase in plasma leptin concentrations, with the first increase obtained within 10 min and a plateau existing from 2 to 6 h. The current results show that at 6 h there was a highly significant increase in leptin mRNA in epididymal fat pads induced by LPS. The early release of leptin within 10 min could not have occurred by new synthesis of leptin and, instead, must be caused by release of stored leptin that has been found in pinocytotic vesicles in adipocytes (26). Therefore, presumably, LPS acts on its receptors within the brain or receptors on afferent neurons, such as vagal afferents, to activate neural or hormonal mechanisms that evoke exocytosis of leptin-containing vesicles, which accounts for the initial elevation of plasma leptin. This is followed by induction of leptin mRNA, which stimulates leptin synthesis, contributing to the release that occurs later along with that of preformed leptin.
As in our previous results with placement of jugular catheters in anesthetized rats (22), plasma leptin decreased in the current experiments. Moreover, anesthesia also decreased LPS-induced plasma leptin release in the same period, providing further support for our concept that leptin is under neural control. Surprisingly, ketamine anesthesia either alone or in the presence of LPS provoked a rebound in plasma leptin levels after 120 min that reached concentrations similar to or even greater than those present in the LPS-treated rats. We hypothesize that this rebound may be caused by decreased negative feedback of the depressed plasma leptin concentrations during anesthesia, which, at the termination of anesthesia, act centrally to stimulate leptin release.
To understand further the possible role of the sympathetic nervous system in LPS-induced leptin release, we studied the effects of α- and β-adrenergic agonists and antagonists on the response to LPS. Injection of the β-adrenergic agonist, isoproterenol, slightly but significantly decreased plasma leptin concentrations and, in the presence of LPS, largely blunted the LPS-induced increase in plasma leptin concentrations. Recently, it has been shown that there is noradrenergic innervation not only of brown but also of white fat (27). That propranolol increased baseline concentrations of plasma leptin is consistent with the hypothesis that there is β-adrenergic inhibitory tone depressing leptin release during resting conditions. However, in the presence of LPS, propranolol slightly but not significantly decreased LPS-induced leptin release, suggesting that the inhibitory β tone under resting conditions was not present after injection of LPS. Therefore, our data suggest that either circulating epinephrine and/or norepinephrine or norepinephrine released from noradrenergic terminals may inhibit leptin release by acting on β-adrenergic receptors present on cell membranes of the adipocytes (28).
Phentolamine, the α-adrenergic antagonist, induced a rapid and highly significant increase in plasma leptin either alone or in the presence of LPS, suggesting that there is a strong inhibitory tone acting through the α-adrenergic receptors to inhibit not only basal but LPS-stimulated leptin release.
Recently, we found that prolactin stimulated leptin release and that α-bromoergocryptine, a dopaminergic-2 receptor agonist that inhibits prolactin release from the anterior pituitary gland, decreased plasma leptin concentrations (21), results that were obtained independently by Gualillo et al. (29). Moreover, we have shown previously that LPS increased prolactin release (5) in a similar experimental paradigm as that used here. Thus, it is likely that LPS-induced prolactin release increases leptin release by activation of prolactin receptors on adipocytes (30). Therefore, we studied the effect of α-bromoergocryptine, an inhibitor of prolactin release, alone or in the presence of LPS. As in the case of anesthesia, α-bromoergocryptine alone or in the presence of LPS decreased plasma leptin concentrations initially, but this decrease was followed by a later rebound of a lesser extent than that observed in the ketamine experiments. The rebound in both cases may be related to the initial lowering of plasma leptin, reducing its negative feedback. Then, as the drug or anesthesia dissipates, an increase in leptin release follows, leading to the rebound in plasma levels, which presumably is caused by increased prolactin release.
The decline in leptin in the bromocryptine-injected animals was much less than in the anesthetized animals, and the rebound was also less, perhaps because the lesser decrease in plasma leptin compared with that of anesthetized rats resulted in a lesser negative feedback of leptin in these animals.
We hypothesize that LPS acts on the CNS to inhibit the secretion of dopamine, removing the inhibition exerted by tuberoinfundibullar dopaminergic neurons on the secretion of prolactin (PRL) (see summary diagram, Fig. 10). Therefore, the secretion of PRL is increased from the lactotropes. Thereafter, PRL circulates to the adipose tissue and, acting on its receptors (PRLr) on the adipocytes, increases the release of leptin that is stored in pinocytotic vesicles in the cytoplasma adjacent to the cell membrane. The sympathetic nervous system exerts a tonic inhibitory effect on leptin release—mediated predominantly by α-adrenergic and, to a lesser extent, by β-adrenergic receptors—that is still present and may be augmented by LPS.
Figure 10.
For description, see Discussion. Opened arrows indicate inhibition, and solid arrows indicate stimulation. DAn, tuberoinfundibullar dopaminergic neurons; DA, dopamine; ME, median eminence; PV, portal vessels; L, lactotropes; AP, anterior pituitary; PRL, prolactin; PRLr, PRL receptors; D2r, DA2 receptors; Lm, leptin mRNA; LV, leptin vesicles; A, adipocyte; E, epinephrine; NE, norepinephrine; A-αr, α-adrenergic receptors; A-βr, β-adrenergic receptors; AM, adrenal medulla; S, sympathetic.
Acknowledgments
We thank Judy Scott for her excellent secretarial assistance. This work was supported by National Institutes of Health Grants MH51853 (S.M.M.), ES09627 (W.L.D.), and ES09106 (W.L.D.).
Abbreviations
- LPS
lipopolysaccharide
- CNS
central nervous system
References
- 1.McCann S M, Kimura M, Yu W H, Mastronardi C A, Rettori V, Karanth S. In: Vitamins and Hormone. Litwack G, editor. New York: Academic; 2001. pp. 29–62. [DOI] [PubMed] [Google Scholar]
- 2.Wong M L, Rettori V, Al-Shekhlee A, Bongiorno P B, Canteros G, McCann S M, Gold P W, Licinio J. Nat Med. 1996;5:581–584. doi: 10.1038/nm0596-581. [DOI] [PubMed] [Google Scholar]
- 3.McCann S M, Kimura M, Karanth S, Yu W H, Rettori V. Ann NY Acad Sci. 1998;840:174–184. doi: 10.1111/j.1749-6632.1998.tb09561.x. [DOI] [PubMed] [Google Scholar]
- 4.Gottschall P E, Komaki G, Arimura A. Neuroendocrinology. 1992;6:935–938. doi: 10.1159/000126328. [DOI] [PubMed] [Google Scholar]
- 5.Rettori V, Dees W L, Hiney J K, Lyson K, McCann S M. Neuroimmunomodulation. 1994;1:251–258. doi: 10.1159/000097173. [DOI] [PubMed] [Google Scholar]
- 6.Turnbull A V, Lee S, Rivier C. Ann NY Acad Sci. 1998;840:434–443. doi: 10.1111/j.1749-6632.1998.tb09582.x. [DOI] [PubMed] [Google Scholar]
- 7.Fattori E, Cappelletti M, Costa P, Sellitto C, Cantoni L, Carelli M, Faggioni R, Fantuzzi G, Ghezzi P, Poli V. J Exp Med. 1994;180:1243–1250. doi: 10.1084/jem.180.4.1243. [DOI] [PMC free article] [PubMed] [Google Scholar]
- 8.Kakizaki Y, Watanobe H, Kohsaka A, Suda T. Endocr J. 1999;46:487–496. doi: 10.1507/endocrj.46.487. [DOI] [PubMed] [Google Scholar]
- 9.Wang Y S, White T D. J Neurochem. 1999;72:652–660. doi: 10.1046/j.1471-4159.1999.0720652.x. [DOI] [PubMed] [Google Scholar]
- 10.Song D K, Im Y B, Jung J S, Suh H W, Huh S O, Park S W, Wie M B, Kim Y H. J Neurochem. 1999;72:1625–1633. doi: 10.1046/j.1471-4159.1999.721625.x. [DOI] [PubMed] [Google Scholar]
- 11.MohanKumar S M, MohanKumar P S, Quadri S K. Brain Res. 1999;824:232–237. doi: 10.1016/s0006-8993(99)01206-8. [DOI] [PubMed] [Google Scholar]
- 12.Madej T, Boguski M S, Bryant S H. FEBS Lett. 1995;373:13–18. doi: 10.1016/0014-5793(95)00977-h. [DOI] [PubMed] [Google Scholar]
- 13.Rock F L, Altmann S W, van Heek M, Kastelein R A, Bazan J F. Horm Metab Res. 1996;12:649–652. doi: 10.1055/s-2007-979871. [DOI] [PubMed] [Google Scholar]
- 14.Kline A D, Becker G W, Churgay L M, Landen B E, Martin D K, Muth W L, Rathnachalam R, Richardson J M, Schoner B, Ulmer M, et al. FEBS Lett. 1997;407:239–242. doi: 10.1016/s0014-5793(97)00353-0. [DOI] [PubMed] [Google Scholar]
- 15.Zhang F, Basinski M B, Beals J M, Briggs S L, Churgay L M, Clawson D K, DiMarchi R D, Furman T C, Hale J E, Hsiung H M, et al. Nature (London) 1997;387:206–209. doi: 10.1038/387206a0. [DOI] [PubMed] [Google Scholar]
- 16.Mastronardi C A, Yu W H, McCann S M. Neuroimmunomodulation. 2000;8:94–97. doi: 10.1159/000026458. [DOI] [PubMed] [Google Scholar]
- 17.Finck B N, Kelley K W, Dantzer R, Johnson R W. Endocrinology. 1998;139:2278–2283. doi: 10.1210/endo.139.5.6012. [DOI] [PubMed] [Google Scholar]
- 18.Bornstein S R, Licinio J, Tauchnitz R, Engelmann L, Negrao A B, Gold P, Chrousos G P. J Clin Endocrinol Metab. 1998;83:280–283. doi: 10.1210/jcem.83.1.4610. [DOI] [PubMed] [Google Scholar]
- 19.Takahashi N, Waelput W, Guisez Y. J Exp Med. 1999;189:207–212. [PMC free article] [PubMed] [Google Scholar]
- 20.Licinio J, Negrão A B, Mantzoros C, Kaklamani V, Wong M-L, Bongiorno P B, Mulla A, Cearnal L, Veldhuis J D, Flier J S, et al. Proc Natl Acad Sci USA. 1998;95:2541–2546. doi: 10.1073/pnas.95.5.2541. [DOI] [PMC free article] [PubMed] [Google Scholar]
- 21.Mastronardi C A, Walczewska A, Yu W H, Karanth S, Parlow A F, McCann S M. Proc Exp Biol Med. 2000;224:152–158. doi: 10.1046/j.1525-1373.2000.22414.x. [DOI] [PubMed] [Google Scholar]
- 22.Mastronardi C A, Yu W H, McCann S M. Proc Exp Biol Med. 2001;226:296–300. doi: 10.1177/153537020122600405. [DOI] [PubMed] [Google Scholar]
- 23.Harms P C, Ojeda S R. J Appl Physiol. 1974;36:391–392. doi: 10.1152/jappl.1974.36.3.391. [DOI] [PubMed] [Google Scholar]
- 24.Ausubell F M, Bent R, Kingston R E, Moore D D, Seidman J G, Smith J A, Struhl K, editors. Current Protocol in Molecular Biology. New York: Wiley; 1993. pp. 4.7.1–4.7.8. [Google Scholar]
- 25.Mastronardi, C. A., Yu, W. H. & McCann, S. M. (2001) Neuroimmunomodulation, in press. [DOI] [PubMed]
- 26.Bornstein S R, Abu-Asab M, Glasow A, Path G, Hauner H, Tsokos M, Chrousos G P, Scherbaum W A. Diabetes. 2000;49:532–538. doi: 10.2337/diabetes.49.4.532. [DOI] [PubMed] [Google Scholar]
- 27.Bartness T J, Bamshad M. Am J Physiol. 1998;275:R1399–R1411. doi: 10.1152/ajpregu.1998.275.5.R1399. [DOI] [PubMed] [Google Scholar]
- 28.Scriba D, Aprath-Husmann I, Blum W F, Hauner H. Eur J Endocrinol. 2000;143:439–445. doi: 10.1530/eje.0.1430439. [DOI] [PubMed] [Google Scholar]
- 29.Gualillo O, Lago F, Garcia M, Menendez C, Senaris R, Casanueva F F, Dieguez C. Endocrinology. 1999;140:5149–5153. doi: 10.1210/endo.140.11.7147. [DOI] [PubMed] [Google Scholar]
- 30.McAveney K M, Gimble J M, Yu-Lee L. Endocrinology. 1996;137:5723–5726. doi: 10.1210/endo.137.12.8940406. [DOI] [PubMed] [Google Scholar]


