

Abstract
Background/Objectives:
Coffee consumption has been found to be associated with reduced risk of chronic conditions such as liver disease. However, less is known about the association between coffee and liver-related hospitalizations and deaths.
Subjects/Methods:
We conducted a prospective analysis on 14,208 participants aged 45–64 years from the Atherosclerosis Risk in Communities (ARIC) study. Coffee consumption (cups/day) was assessed using food frequency questionnaires at visit 1 (1987–89) and visit 3 (1993–95). Liver-related hospitalizations were defined as a hospitalization with any International Classification of Diseases, Ninth Revision (ICD-9) code related to liver disease identified through cohort surveillance. Liver-related death was defined as any death with a liver disease ICD-9 code listed anywhere on the death certificate form.
Results:
There were 833 incident cases of liver-related hospitalizations over a median follow-up of 24 years and 152 liver-related deaths over a median follow-up of 25 years. Participants who were in the highest category of coffee consumption (≥3 cups/day) were more likely to be men, whites, current smokers, and current alcohol drinkers. In our fully adjusted model, consuming ≥3 cups/day of coffee was significantly associated with a reduced risk of liver-related hospitalizations compared with never drinkers (hazard ratio: 0.79, 95% CI: 0.63–0.99). There were no significant associations between coffee consumption and liver-related deaths after adjusting for covariates.
Conclusions:
Coffee drinkers may be at lower risk for liver-related hospitalizations. This supports current evidence that low and moderate levels of coffee may be protective to the liver.
Introduction
The 2015–2020 Dietary Guidelines for Americans suggest that moderate coffee consumption (up to 3–5 cups/d) can be incorporated into healthy eating styles (1). Studies have found that coffee consumption may be associated with lower risk of type 2 diabetes (2, 3), coronary heart disease (4), some cancers (5, 6), and all-cause mortality (7–10). Evidence suggests that there may be an inverse association between consumption of coffee and liver disease risk, but few studies have looked at coffee’s relationship with liver-related hospitalizations and deaths.
Many studies have found an inverse association between coffee and liver enzymes, including alanine aminotransferase (ALT), aspartate aminotransferase (AST), and gamma-glutamyltransferase (GGT) (9, 11–13). Some studies have also suggested that coffee is associated with reduced risk of chronic liver disease, hepatocellular carcinoma, and cirrhosis (alcoholic and non-alcoholic) (12–16). These results consistently suggest that coffee is protective of liver disease regardless of the etiology, which may be due to anti-inflammatory and anti-fibrotic mechanisms. However, few longitudinal studies have examined the effects of coffee consumption on the development of symptomatic liver disease, identified through hospitalization and death records.
Our study seeks to examine the association between coffee consumption and risk of liver-related hospitalizations and deaths in the Atherosclerosis Risk in Communities (ARIC) study, a large community-based study.
Subjects and Methods
Study Population
The ARIC study enrolled 15,792 middle-aged (45–64 years) men and women at visit 1 (1987–1989) from 4 U.S. communities: Forsyth County, North Carolina; Jackson, Mississippi; suburbs of Minneapolis, Minnesota; and Washington County, Maryland (17). Five subsequent follow-up visits were performed in 1990–1992 (visit 2), 1993–1995 (visit 3), 1996–1998 (visit 4), 2011–2013 (visit 5), 2016–2017 (visit 6), and visit 7 is ongoing. Participants who were neither black nor white (n=48), as well as blacks residing in Washington County, Maryland (n=33), and blacks residing in Minneapolis, Minnesota (n=22) were excluded due to small numbers of these population subgroups. Other exclusions included participants who do not have data on glucose measurements and participants who were not fasting prior to venipuncture (n=699), participants without measured height and weight for the calculation of body mass index (BMI) (n=10) or missing alcohol status (n=59). We further excluded those who had extreme values for total energy intake, i.e. for women, <500 or >3,500 kcal/d, and for men, <700 or >4,500 kcal/d (n=253), were missing >15 food frequency questionnaire (FFQ) items (n=1), were missing data on coffee consumption (n=4), or were missing the necessary dietary data to assess diet quality using the Dietary Approaches to Stop Hypertension (DASH) score (n=455). A total of 14,208 participants from the ARIC study were included in our main analysis (Figure 1). The institutional review boards of all participating institutions approved the study protocol, and all participants gave informed consent at each visit.
Figure 1.
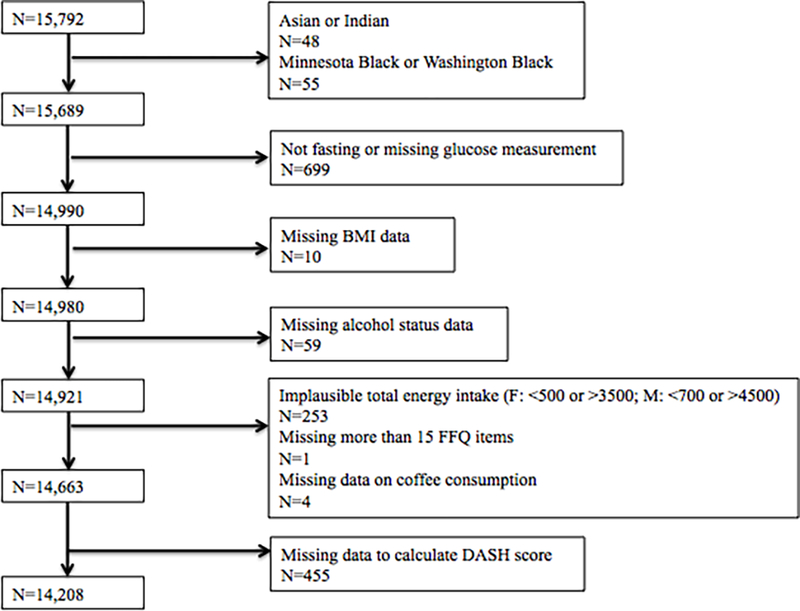
Flowchart of selection of ARIC study participants for the present study
Abbreviations: ARIC, Atherosclerosis Risk in Communities; BMI, body mass index; DASH; Dietary Approaches to Stop Hypertension; FFQ, food frequency questionnaire
Assessment of Coffee Consumption
At visit 1 (1987–89) and visit 3 (1993–95), a trained interviewer administered a 66-item semi-quantitative FFQ to participants in person. Participants were asked to report their frequency of consuming an 8-ounce (236.6 mL) cup of regular (non-decaffeinated) coffee on average over the past year. Participants selected one of nine frequency options: almost never, 1–3 cups/month, 1 cup/week, 2–4 cups/week, 5–6 cups/week, 1 cup/day, 2–3 cups/day, 4–6 cups/day, and >6 cups/day. The categorical responses were then converted into a continuous variable measured in cups/week. We incorporated repeated assessments of coffee intake at visit 1 and visit 3 using a cumulative approach to increase precision, i.e. by calculating the mean of coffee consumption reported at visit 1 and visit 3 for those who remained event-free by visit 3 (18). We used coffee consumption as assessed at visit 1 for those participants who had a liver-related event prior to visit 3 and for those participants who were missing data on coffee consumption at visit 3. We then re-categorized this continuous variable into five categories: never, <1 cup/day, 1-<2 cup/day, 2-<3 cups/day, and ≥3 cups/day.
Assessment of Liver Outcomes
In the ARIC study, hospitalization reports are obtained during annual telephone contact with study participants or their proxies and additionally from active surveillance of hospitalizations in the study community hospitals. The main outcome was incident hospitalization with a liver-related diagnosis listed in the discharge record (henceforth referred to as “liver-related hospitalization”). Liver-related hospitalization was defined using a comprehensive list of liver disease-related International Classification of Diseases, Ninth Revision (ICD-9) codes (Supplemental Table 1) (19). Briefly, the following ICD-9 codes were included: 70.2–70.9 (viral hepatitis), 571.0–571.9 (chronic liver disease and cirrhosis), 456.0–456.2, 572.2–572.8, 573, 789.5, 289.4, 567.2 (sequelae), 570 (acute liver necrosis), 155.x (liver cancer), and 139.8, 573.3, 573.8, 573.9, 789.5×b (other).
The secondary outcome was liver-related death, which was defined as having an ICD-9 code representing a liver-related death anywhere on the death certificate (Supplemental Table 1). Deaths were ascertained by review of death certificate forms, linkage to the National Death Index database, and by annual follow-up phone interviews with proxies. We conducted a sensitivity analysis using only cases where liver disease was listed as the primary cause of death. Time to liver disease-related events was calculated from baseline (visit 1 at 1987–1989) through December 31, 2014.
Our third outcome included 3 measures of elevated liver enzymes: aspartate aminotransferase (AST) >40 international units per liter (IU/L), alanine aminotransferase (ALT) >40 IU/L, and gamma-glutamyltransferase (GGT) >60 IU/L. Serum levels of AST, ALT, and GGT were measured in specimens collected from participants during study visit 2 (1990–1992). Participants were asked to fast for 12 hours prior to blood specimen collection. In 2012–2013, the liver enzymes were measured using Roche Diagnostics reagents on the Roche Modular P800 Chemistry analyzer (Indianapolis, Indiana).
Assessment of Covariates
Socio-demographic (age, sex, race, education), and lifestyle (smoking status, physical activity, alcohol intake, diet quality) factors were self-reported at baseline on a questionnaire which was administered by trained interviewers (17). Given the fact that racial groups were not uniformly distributed across the four study center, race and study center were combined into a single variable. Physical activity during leisure time was quantified as a score using time and intensity of each activity, with scores ranging from one, representing the lowest amount of physical activity, to five, representing the highest amount of physical activity (17). We categorized level of education as less than high school, high school or equivalent, and college and above.
We classified alcohol consumption as never, former, current (moderate), and current (heavy) drinkers. Women who consumed less than one alcoholic beverage per day and men who consumed less than two alcoholic beverages per day were considered to be moderate alcohol drinkers. Women who consumed one or more alcoholic beverages per day and men who consumed two or more alcoholic beverages per day were considered to be heavy alcohol drinkers.
As a measure of diet quality, the DASH diet score was calculated using an a priori defined index which accounts for dietary intake of fruits, vegetables, whole grains, nuts and legumes, low-fat dairy products, red and processed meat, sweetened beverages, and sodium (20). Cumulative energy intake was calculated in the same manner as cumulative coffee consumption, using total energy intake from both visits 1 and 3, if applicable.
Clinical factors included BMI, calculated as weight (kg)/height (m2), fasting glucose (mg/dL), and diabetes. We defined diabetes status as having a diagnosis of diabetes diagnosed by a physician, recent (within the past two weeks) use of medication for diabetes, or elevated fasting blood glucose (≥126 mg/dL). Visit 2 high-sensitivity C-reactive protein (hsCRP) (mg/L) was measured in serum using a latex-particle enhanced immunoturbidimetric assay kit (Roche Diagnostics, Indianapolis, Indiana) and read on the Roche Modular P800 Chemistry analyzer (Roche Diagnostics).
Statistical Analysis
Baseline characteristics were reported across categories of coffee consumption. We used chi-square tests to test the significance of categorical variables and analysis of variance to test the significance of continuous variables. Subsequently, we used Cox proportional hazards regression models to estimate the hazard ratios (HR) and associated 95% confidence intervals (CI) for incident liver-related hospitalization or death among different categories of coffee intake. We evaluated three progressively adjusted models. Model 1 included total energy intake, age, sex, race-center, and education; Model 2 was additionally adjusted for health behaviors including smoking status, level of physical activity, alcohol consumption, and diet quality assessed using the DASH diet score. Model 3 was additionally adjusted for BMI. As a sensitivity analysis, we additionally adjusted for hsCRP levels. Due to 2,057 participants missing hsCRP levels, we included 12,151 participants in the analysis. We tested for trend using the median value within each coffee consumption category. We analyzed consumption of coffee as a continuous variable in order to express the risk of liver-related hospitalization or death per one additional cup of coffee per day. We performed additional analyses to test the consistency of our findings across subgroups identified a priori defined by sex, smoking status, obesity status, race, and alcohol status, using the likelihood ratio test to formally test for interaction. In addition, we conducted two sensitivity analyses: 1) we excluded individuals (n=1,234) with elevated liver enzymes at visit 2 for the outcome of liver-related hospitalizations and 2) we defined the outcome of liver-related death as only those participants who had liver-related death as their primary code on the death certificate.
To examine the cross-sectional association between coffee consumption and elevated liver enzymes, we used logistic regression models to estimate odds ratios (95% CI) across categorical levels of coffee consumption and per additional cup of coffee as a continuous variable (cups/day). We used the same sequentially built models as for the primary outcome.
Statistical significance was set a priori at P<0.05. All analyses were performed using Stata software (version 14.0; StataCorp, College Station, TX, USA).
Results
Baseline Characteristics
We included 14,208 participants in our study, of whom 19% almost never drank coffee, 21% drank <1 cup/day, 25% drank 1-<2 cups/day, 15% drank 2-<3 cups/day, and 19% drank ≥3 cups/day. The mean age of participants was 54.1 years and more than half (55.6%) were female. Participants in the highest category of coffee consumption were more likely to be male, whites, and current smokers (Table 1). Blacks made up 36.4% of the never drinker group compared to 7.1% of the ≥3 cups/day group. Participants with lower BMI, lower fasting glucose levels, and without diabetes were more likely to be in the highest category of coffee consumption. The percentage of participants with elevated liver enzymes decreased with higher coffee consumption.
Table 1.
Baseline characteristics according to coffee consumption categories (N=14,208)
| Coffee Consumption Levelsa |
||||||
|---|---|---|---|---|---|---|
| Baseline Characteristics | Never (n=2,754) | <1 cup/d (n=3,030) | 1-<2 cups/d (n=3,590) | 2-<3 cups/d (n=2,088) | ≥3 cups/d (n=2,746) | Pe |
| Age, years | 53.9 ± 6 | 54.3 ± 6 | 54.6 ± 6 | 54.1 ± 6 | 53.5 ± 5 | <0.001 |
| Female, % | 63.6 | 56.9 | 56.2 | 50.8 | 49.1 | <0.001 |
| Race, % | <0.001 | |||||
| White | 63.7 | 69.3 | 70.4 | 84.2 | 92.9 | |
| Black | 36.4 | 30.7 | 29.6 | 15.8 | 7.1 | |
| Education level, % | <0.001 | |||||
| Less than high school | 24.7 | 22.3 | 26.2 | 21.0 | 18.1 | |
| High school or equivalent | 40.3 | 40.4 | 40.1 | 41.5 | 44.7 | |
| College or above | 35.0 | 37.2 | 33.7 | 37.6 | 37.2 | |
| Smoking status, % | <0.001 | |||||
| Never smoker | 55.3 | 51.0 | 42.0 | 35.3 | 23.4 | |
| Former smoker | 25.9 | 30.9 | 34.8 | 35.8 | 34.8 | |
| Current smoker | 18.8 | 18.1 | 23.3 | 28.9 | 41.8 | |
| Alcohol statusb, % | <0.001 | |||||
| Never | 37.3 | 29.1 | 25.4 | 17.0 | 12.3 | |
| Former | 19.6 | 17.5 | 18.6 | 17.9 | 18.1 | |
| Current, heavy | 6.1 | 8.0 | 10.0 | 11.9 | 14.2 | |
| Current, moderate | 37.1 | 45.4 | 46.0 | 53.2 | 55.4 | |
| Physical activity index scorec | 2.4 ± 0.8 | 2.4 ± 0.8 | 2.4 ± 0.8 | 2.5 ± 0.8 | 2.5 ± 0.8 | 0.002 |
| BMI, kg/m2 | 28.2 ± 6 | 28.0 ± 5 | 27.8 ± 5 | 27.1 ± 5 | 26.7 ± 5 | <0.001 |
| Diabetes, % | 13.3 | 11.4 | 11.0 | 8.7 | 6.1 | <0.001 |
| Fasting glucose, mg/dL | 109.5 ± 40 | 106.8 ± 32 | 107.7 ± 35 | 105.5 ± 33 | 102.9 ± 26 | <0.001 |
| hsCRP, mg/Ld | 4.8 ± 8 | 4.4 ± 7 | 4.2 ± 6 | 4.0 ± 7 | 3.8 ± 7 | <0.001 |
| Coffee consumptiona, 8-oz cups/d | 0 | 0.4 ± 0.3 | 1.2 ± 0.3 | 2.2 ± 0.2 | 4.9 ± 1.3 | <0.001 |
| Total energy intakea, kcal/d | 1,464 ± 531 | 1,446 ± 494 | 1,487 ± 505 | 1,509 ± 530 | 1,559 ± 533 | <0.001 |
| DASH diet score (8–40) | 24.3 ± 5 | 24.4 ± 5 | 23.8 ± 5 | 23.8 ± 5 | 23.7 ± 5 | <0.001 |
| Elevated liver enzymesd, % | ||||||
| AST (>40 IU/L) | 3.0 | 2.4 | 2.2 | 1.9 | 1.4 | 0.003 |
| ALT (>40 IU/L) | 2.4 | 2.3 | 2.4 | 1.8 | 2.1 | 0.7 |
| GGT (>60 IU/L) | 10.1 | 9.4 | 8.5 | 7.5 | 6.7 | <0.001 |
Note: Values for categorical variables are given as percentage; for continuous variables, as mean ± standard deviation. One 8-ounce cup = 236.6 mL.
Dietary factors (coffee, total energy) were estimated using cumulative average intake. The average of visit 1 and visit 3 dietary data for those who did not have an event and who were not censored prior to visit 3. For those who had a liver-related hospitalization or were censored prior to visit 3, dietary data from visit 1 was used.
Moderate alcohol consumption defined as <1 drink/day for women and <2 drinks/day for men; heavy alcohol consumption defined as ≥1 drink/day for women and ≥2 drinks/day for men
Physical activity index score calculated based on intensity and time of sport and exercise during leisure time; 1-lowest and 5-highest
High-sensitivity C-reactive protein and liver enzymes were measured at study visit 2 (1990–1992).
Chi-square tests were used to test significance of categorical variables and analysis of variance was used to test significance of continuous variables.
Abbreviations: ALT, alanine aminotransferase; AST, aspartate aminotransferase; BMI, body mass index; d, day; DASH, Dietary Approaches to Stop Hypertension; GGT, gamma-glutamyltransferase; hsCRP, high-sensitivity C-reactive protein; IU/L; international units per liter; kcal/d, kilocalories per day; kg/m2, kilograms per meter squared; mg/dL, milligrams per deciliter; mg/L, milligrams per liter; oz, ounce
Coffee Consumption and Liver-Related Hospitalizations
Among the 14,208 participants, 833 (6%) had a liver-related hospitalization over a median follow-up of 24 years. There was an inverse association between increasing frequency of coffee consumption and risk of liver-related hospitalization, after adjusting for age, sex, race-center, education, total energy intake, physical activity, smoking, alcohol status, and DASH diet score (Model 2; HR for ≥3 cups/day vs. never: 0.77, 95% CI: 0.61–0.97; p for trend = 0.04; Table 2). After additional adjustment for BMI in model 3, higher coffee consumption remained inversely associated with risk of liver-related hospitalization but only for the highest level of coffee consumption (HR for ≥3 cups/day vs. never: 0.79, 95% CI: 0.63–0.99). After additionally adjusting for hsCRP, estimates were similar to the main results for liver-related hospitalizations (Supplemental Table 2). In a sensitivity analysis excluding participants who had elevated liver enzymes at visit 2, all categories of coffee consumption were protective of liver-related hospitalizations compared to never drinkers in model 3 (Supplemental Table 3). However, none of the associations were significant and there was no significant trend.
Table 2.
Risk of liver-related hospitalization by coffee consumption categories
| Coffee Consumption Levelsa | |||||||
|---|---|---|---|---|---|---|---|
| Never (n=2,754) | <1 cup/d (n=3,030) | 1-<2 cups/d (n=3,590) | 2-<3 cups/d (n=2,088) | ≥3 cups/d (n=2,746) | P for trend | Continuous (per 1 cup/d) | |
| # events (%) | 165 (6.0) | 177 (5.8) | 224 (6.2) | 112 (5.4) | 155 (5.6) | ||
| Incidence rate per 1,000 person-years | 2.9 | 2.7 | 2.9 | 2.6 | 2.7 | ||
| Model 1 | 1 (ref.) | 0.89 (0.72–1.10) | 0.97 (0.79–1.18) | 0.88 (0.69–1.12) | 0.91 (0.73–1.14) | 0.6 | 0.99 (0.96–1.04) |
| Model 2 | 1 (ref.) | 0.88 (0.71–1.09) | 0.93 (0.76–1.13) | 0.82 (0.64–1.05) | 0.77 (0.61–0.97) | 0.04 | 0.96 (0.92–1.00) |
| Model 3 | 1 (ref.) | 0.89 (0.72–1.10) | 0.93 (0.76–1.14) | 0.83 (0.65–1.06) | 0.79 (0.63–0.99) | 0.06 | 0.96 (0.92–1.00) |
Note: Unless otherwise indicated, values given as hazard ratio (95% confidence interval). One 8-ounce cup = 236.6 mL. Model 1: Adjusted for total energy intake, age, sex, race-center, education level; model 2: model 1 + smoking, physical activity, alcohol status, DASH diet score; model 3: model 2 + BMI
Average of visit 1 and visit 3 coffee intake calculated for participants with no liver hospitalization event or with hospitalization event after visit 3; visit 1 coffee intake used for participants with hospitalization event between visits 1 and 3.
There were no significant interactions between coffee and liver-related hospitalizations by sex (p=0.9), smoking status (p=0.9), obesity status (p=0.7), or race (p=0.2) (Figure 2). However, there was a significant interaction by alcohol status (p<0.001). While an inverse association was observed between coffee and liver-related hospitalizations among current (moderate and heavy) and never drinkers, there was a direct association for former drinkers (Supplemental Table 4).
Figure 2.
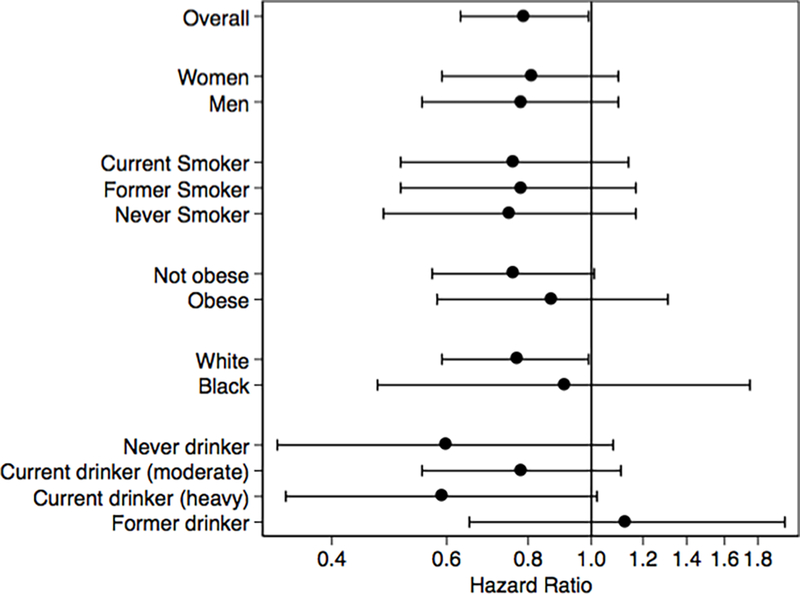
Adjusteda hazard ratios for liver-related hospitalization comparing ≥3 cups/d to never drinker category for the overall study population and according to population subgroups
Dots represent hazard ratios and lines represent 95% confidence intervals. Hazard ratios (on logarithmic scale) for liver-related hospitalizations are presented for 3 or more cups of coffee per day versus never.
aAdjusted for total energy intake, age, sex, race-center, education level, smoking, physical activity, alcohol status, DASH diet score, and BMI (Model 3).
Abbreviations: BMI, body mass index; DASH; Dietary Approaches to Stop Hypertension
Coffee Consumption and Liver-Related Death
There were 152 (1%) liver-related deaths over a median follow-up of 25 years. Higher frequency of coffee consumption appeared to be associated with a lower risk of liver-related death in Models 2 and 3 for all categories of coffee consumption (HRs<1), which was similar to associations for liver-related hospitalizations (Table 3). However, the associations were not statistically significant. After additionally adjusting for hsCRP level, estimates for liver-related death were similar to the main results for liver-related death (Supplemental Table 2). In the sensitivity analysis that assessed only participants who had liver disease listed as the underlying cause of death, there was no statistically significant association between coffee consumption and liver-related death, although the hazard ratio suggested an inverse relationship for ≥3 cups/day vs. never in Model 3 (Supplemental Table 5).
Table 3.
Risk of liver-related death by coffee consumption categories
| Coffee Consumption Levelsa | |||||||
|---|---|---|---|---|---|---|---|
| Never (n=2,754) | <1 cup/d (n=3,030) | 1-<2 cups/d (n=3,590) | 2-<3 cups/d (n=2,088) | ≥3 cups/d (n=2,746) | P for trend | Continuous (per 1 cup/d) | |
| # events (%) | 30 (1.1) | 33 (1.1) | 39 (1.1) | 21 (1.0) | 29 (1.1) | ||
| Incidence rate per 1,000 person-years | 0.52 | 0.49 | 0.50 | 0.48 | 0.49 | ||
| Model 1 | 1 (ref.) | 0.87 (0.53–1.44) | 0.88 (0.55–1.42) | 0.93 (0.53–1.64) | 1.00 (0.60–1.70) | 0.8 | 1.02 (0.93–1.12) |
| Model 2 | 1 (ref.) | 0.86 (0.52–1.42) | 0.81 (0.50–1.32) | 0.81 (0.46–1.44) | 0.77 (0.45–1.33) | 0.4 | 0.96 (0.88–1.06) |
| Model 3 | 1 (ref.) | 0.86 (0.53–1.42) | 0.82 (0.51–1.33) | 0.83 (0.47–1.47) | 0.80 (0.46–1.37) | 0.5 | 0.97 (0.88–1.07) |
Note: Unless otherwise indicated, values given as hazard ratio (95% confidence interval). One 8-ounce cup = 236.6 mL. Model 1: Adjusted for total energy intake, age, sex, race-center, education level; model 2: model 1 + smoking, physical activity, alcohol status, DASH diet score; model 3: model 2 + BMI
a Average of visit 1 and visit 3 coffee intake calculated for participants with no liver hospitalization event or with hospitalization event after visit 3; visit 1 coffee intake used for participants with hospitalization event between visits 1 and 3.
Coffee Consumption and Elevated Liver Enzymes
There was a linear inverse association between coffee consumption and elevated AST, ALT, and GGT after adjusting for covariates (Table 4). For each additional cup of coffee consumed per day, participants had a 17% lower odds of elevated AST (OR: 0.83, 95% CI: 0.77–0.91), a 7% lower odds of elevated ALT (OR: 0.93, 95% CI: 0.86–1.00), and an 11% lower odds of elevated GGT (OR: 0.89, 95% CI: 0.86–0.93).
Table 4.
Adjusteda odds of elevated liver enzymes according to coffee consumption levels
| Coffee Consumption Levelsb | |||||||
|---|---|---|---|---|---|---|---|
| Never (n=2,754) | <1 cup/d (n=3,030) | 1-<2 cups/d (n=3,590) | 2-<3 cups/d (n=2,088) | ≥3 cups/d (n=2,746) | P for trend | Continuous (per 1 cup/d) | |
| AST (>40 IU/L) | 1 (ref.) | 0.75 (0.53–1.06) | 0.69 (0.49–0.97) | 0.56 (0.37–0.86) | 0.37 (0.24–0.58) | <0.001 | 0.83 (0.77–0.91) |
| ALT (>40 IU/L) | 1 (ref.) | 0.98 (0.67–1.42) | 0.99 (0.69–1.42) | 0.67 (0.42–1.05) | 0.74 (0.49–1.11) | 0.06 | 0.93 (0.86–1.00) |
| GGT (>60 IU/L) | 1 (ref.) | 0.90 (0.74–1.09) | 0.76 (0.63–0.92) | 0.68 (0.54–0.86) | 0.58 (0.46–0.73) | <0.001 | 0.89 (0.86–0.93) |
Note: Unless otherwise indicated, values given as odds ratio (95% confidence interval). One 8-ounce cup = 236.6 mL.
Adjusted for total energy intake, age, sex, race-center, education level, smoking, physical activity, alcohol status, DASH diet score, BMI
Average of visit 1 and visit 3 coffee intake calculated for participants with no liver hospitalization event or with hospitalization event after visit 3; visit 1 coffee intake used for participants with hospitalization event between visits 1 and 3.
Abbreviations: ALT, alanine aminotransferase; AST, aspartate aminotransferase; GGT, gamma-glutamyltransferase; IU/L; international units per liter
Discussion
In this large, community-based cohort study, we observed that coffee consumption was associated with reduced risk of liver-related hospitalization. Men, whites, and current smokers were more likely to drink higher amounts of coffee. Although we observed inverse associations between coffee and liver-related hospitalizations in our fully adjusted model, the association was significant only for the category of ≥3 cups/day compared to never drinkers.
The association between coffee consumption and liver-related hospitalizations differed by alcohol status. There was a protective association for never drinkers and current drinkers (moderate and heavy) but a direct association among former drinkers. This may be because former drinkers are more likely to be overrepresented by former heavy drinkers and alcoholics, who may have severely damaged livers so that any amount of coffee may not be able to reduce their risk of a liver-related hospitalization.
There have been many observational studies that examined the association between coffee and liver-related outcomes in the U.S. and globally; however, there has been heterogeneity in the assessment of liver diseases. In general, the results point towards an inverse association between coffee and liver disease. Cross-sectional studies have found that coffee is inversely associated with liver enzymes that are a marker for liver damage (11, 12). We found similar inverse associations as the odds of elevated levels of AST, ALT, and GGT decreased as coffee consumption increased. Cohort and case-control studies that examined coffee and cirrhosis found an inverse association as well (13, 14, 21). One study examined 9,849 participants from the National Health and Nutrition Examination Survey I Epidemiologic Follow-Up Study and used ICD-9-CM codes to identify cases of chronic liver disease and cirrhosis (14). They found that participants who drank more than 2 cups per day had a lower risk of chronic liver disease compared to those who drank less than 1 cup per day (HR: 0.43, 95% CI: 0.24–0.78) (14). Another study of 125,580 participants found that participants who drank at least 4 cups per day had an 80% (HR: 0.20, 95% CI: 0.10–0.40) reduced risk of alcoholic cirrhosis compared to participants who never drank coffee (13).
A meta-analysis that included 16 studies examined coffee consumption and hepatic fibrosis and cirrhosis and found that coffee consumers, compared to non-consumers, were less likely to develop cirrhosis (OR: 0.61, 95% CI: 0.45–0.84) and advanced hepatic fibrosis (OR: 0.73, 95% CI: 0.58–0.92) (22). Another meta-analysis found that each additional cup of coffee consumed per day decreased the risk of hepatocellular carcinoma (RR, risk ratio: 0.85, 95% CI: 0.81–0.90) and chronic liver disease (RR: 0.74, 95% CI: 0.65–0.83) (15). Our results are consistent with the previous literature since we observed inverse associations for coffee consumption with liver-related hospitalizations.
The biological mechanism for how coffee affects the liver has not been definitively established since there are many biologically active components in coffee. Some studies suggest that antioxidants, which are present in both caffeinated and decaffeinated coffee, may have a beneficial effect on the liver (23). Coffee may help alleviate inflammation in the liver through antioxidants that increase plasma concentration of glutathione, which prevents scar formation (24). Furthermore, coffee may reduce systemic and liver oxidative stress and also change the expression and concentrations of proteins and cytokines in the liver (25). Animal models have suggested that coffee and caffeine reduce transforming growth factor-β (TGF-β), a major liver regulatory cytokine involved in liver fibrosis (26). One study found that coffee was protective of cirrhosis in rats through reducing TGF-β, which attenuated the inflammatory and fibrotic processes through lowering the expression of connective tissue growth factor (27). Some of the effects may also be mediated through improvements in glucose metabolism and insulin resistance (2, 3). Studies suggest that components in coffee such as chlorogenic acid inhibit the absorption of glucose and therefore reduce glucose production and oxidative stress in the liver (28, 29).
There are some limitations in the present study. Outcome ascertainment was based on ICD-9 codes from hospitalization and death records which may have resulted in under-ascertainment. Liver disease can be asymptomatic and some individuals with undiagnosed liver disease may not have been included in the analysis. Coffee consumption was self-reported, which may have resulted in misclassification. However, we attempted to increase accuracy by using the average amount of coffee reported during visits 1 and 3. The semi-quantitative FFQ administered in the ARIC study assessed both quantity and frequency of coffee consumed, but there was no information provided on type of coffee beans, brewing method, or added sugar and cream. Further, our study had very few cases for our secondary outcome of liver-related death, which limited the statistical power to detect significant associations for this outcome.
There are several strengths in our study. Our study population was a large, community-based population of blacks and whites, which allows for broad generalizability of our study findings. Additionally, there was a long follow-up time. Coffee consumption was assessed at two time points and the average was used when applicable, which improved the precision of this estimate.
Our study found an inverse association between coffee and liver-related hospitalizations. Our findings echo previous studies that have found coffee to be inversely associated with liver disease; therefore, moderate quantities of coffee (3–5 cups/day) can be incorporated into a healthy diet.
Supplementary Material
Acknowledgments:
The authors thank the staff and participants of the ARIC study for their important contributions. The Atherosclerosis Risk in Communities study has been funded by the National Heart, Lung, and Blood Institute, National Institutes of Health, Department of Health and Human Services, under Contract nos. (HHSN268201700001I, HHSN268201700002I, HHSN268201700003I, HHSN268201700004I, HHSN268201700005I).
Ms. Hu was supported by a grant from the National Institutes of Health (NIH)/National Heart, Lung, and Blood Institute (training grant T32 HL007024). Dr. Rebholz was supported by a mentored research scientist development award from the National Institute of Diabetes and Digestive and Kidney Diseases (K01 DK107782). Dr. Selvin was supported by NIH/NIDDK grants K24DK106414 and R01DK089174.
Footnotes
Conflict of Interest: None
Disclaimers: None
References
- 1.U.S. Department of Health and Human Services and U.S. Department of Agriculture. 2015–2020 Dietary Guidelines for Americans. Accessed on 25 Oct. 2017. Available from: http://health.gov/dietaryguidelines/2015/guidelines/.
- 2.Floegel A, Pischon T, Bergmann MM, Teucher B, Kaaks R, Boeing H. Coffee consumption and risk of chronic disease in the European Prospective Investigation into Cancer and Nutrition (EPIC)-Germany study. Am J Clin Nutr. 2012;95(4):901–8. [DOI] [PubMed] [Google Scholar]
- 3.Ding M, Bhupathiraju SN, Chen M, van Dam RM, Hu FB. Caffeinated and decaffeinated coffee consumption and risk of type 2 diabetes: a systematic review and a dose-response meta-analysis. Diabetes Care. 2014;37(2):569–86. [DOI] [PMC free article] [PubMed] [Google Scholar]
- 4.Ding M, Bhupathiraju SN, Satija A, van Dam RM, Hu FB. Long-term coffee consumption and risk of cardiovascular disease: a systematic review and a dose-response meta-analysis of prospective cohort studies. Circulation. 2014;129(6):643–59. [DOI] [PMC free article] [PubMed] [Google Scholar]
- 5.Bhoo-Pathy N, Peeters PH, Uiterwaal CS, Bueno-de-Mesquita HB, Bulgiba AM, Bech BH, et al. Coffee and tea consumption and risk of pre- and postmenopausal breast cancer in the European Prospective Investigation into Cancer and Nutrition (EPIC) cohort study. Breast Cancer Res. 2015;17:15. [DOI] [PMC free article] [PubMed] [Google Scholar]
- 6.Zhou Q, Luo ML, Li H, Li M, Zhou JG. Coffee consumption and risk of endometrial cancer: a dose-response meta-analysis of prospective cohort studies. Sci Rep. 2015;5:13410. [DOI] [PMC free article] [PubMed] [Google Scholar]
- 7.Ding M, Satija A, Bhupathiraju SN, Hu Y, Sun Q, Han J, et al. Association of Coffee Consumption With Total and Cause-Specific Mortality in 3 Large Prospective Cohorts. Circulation. 2015;132(24):2305–15. [DOI] [PMC free article] [PubMed] [Google Scholar]
- 8.Freedman ND, Park Y, Abnet CC, Hollenbeck AR, Sinha R. Association of coffee drinking with total and cause-specific mortality. N Engl J Med. 2012;366(20):1891–904. [DOI] [PMC free article] [PubMed] [Google Scholar]
- 9.Gunter MJ, Murphy N, Cross AJ, Dossus L, Dartois L, Fagherazzi G, et al. Coffee Drinking and Mortality in 10 European Countries: A Multinational Cohort Study. Ann Intern Med. 2017;167(4):236–47. [DOI] [PMC free article] [PubMed] [Google Scholar]
- 10.Park SY, Freedman ND, Haiman CA, Le Marchand L, Wilkens LR, Setiawan VW. Association of Coffee Consumption With Total and Cause-Specific Mortality Among Nonwhite Populations. Ann Intern Med. 2017;167(4):228–35. [DOI] [PMC free article] [PubMed] [Google Scholar]
- 11.Xiao Q, Sinha R, Graubard BI, Freedman ND. Inverse associations of total and decaffeinated coffee with liver enzyme levels in National Health and Nutrition Examination Survey 1999–2010. Hepatology. 2014;60(6):2091–8. [DOI] [PMC free article] [PubMed] [Google Scholar]
- 12.Saab S, Mallam D, Cox GA 2nd, Tong MJ. Impact of coffee on liver diseases: a systematic review. Liver Int. 2014;34(4):495–504. [DOI] [PubMed] [Google Scholar]
- 13.Klatsky AL, Morton C, Udaltsova N, Friedman GD. Coffee, cirrhosis, and transaminase enzymes. Arch Intern Med. 2006;166(11):1190–5. [DOI] [PubMed] [Google Scholar]
- 14.Ruhl CE, Everhart JE. Coffee and tea consumption are associated with a lower incidence of chronic liver disease in the United States. Gastroenterology. 2005;129(6):1928–36. [DOI] [PubMed] [Google Scholar]
- 15.Bravi F, Tavani A, Bosetti C, Boffetta P, La Vecchia C. Coffee and the risk of hepatocellular carcinoma and chronic liver disease: a systematic review and meta-analysis of prospective studies. Eur J Cancer Prev. 2017;26(5):368–77. [DOI] [PubMed] [Google Scholar]
- 16.Bravi F, Bosetti C, Tavani A, Gallus S, La Vecchia C. Coffee reduces risk for hepatocellular carcinoma: an updated meta-analysis. Clin Gastroenterol Hepatol. 2013;11(11):1413–21 e1. [DOI] [PubMed] [Google Scholar]
- 17.The Atherosclerosis Risk in Communities (ARIC) Study: design and objectives. The ARIC investigators. Am J Epidemiol. 1989;129(4):687–702. [PubMed] [Google Scholar]
- 18.Willet W Nutritional Epidemiology. 3 ed: Oxford University Press; 2013. [Google Scholar]
- 19.Kim WR, Brown RS Jr., Terrault NA, El-Serag H Burden of liver disease in the United States: summary of a workshop. Hepatology. 2002;36(1):227–42. [DOI] [PubMed] [Google Scholar]
- 20.Rebholz CM, Crews DC, Grams ME, Steffen LM, Levey AS, Miller ER 3rd, et al. DASH (Dietary Approaches to Stop Hypertension) Diet and Risk of Subsequent Kidney Disease. Am J Kidney Dis. 2016;68(6):853–61. [DOI] [PMC free article] [PubMed] [Google Scholar]
- 21.Gallus S, Bertuzzi M, Tavani A, Bosetti C, Negri E, La Vecchia C, et al. Does coffee protect against hepatocellular carcinoma? Br J Cancer. 2002;87(9):956–9. [DOI] [PMC free article] [PubMed] [Google Scholar]
- 22.Liu F, Wang X, Wu G, Chen L, Hu P, Ren H, et al. Coffee Consumption Decreases Risks for Hepatic Fibrosis and Cirrhosis: A Meta-Analysis. PLoS One. 2015;10(11):e0142457. [DOI] [PMC free article] [PubMed] [Google Scholar]
- 23.Gutierrez-Grobe Y, Chavez-Tapia N, Sanchez-Valle V, Gavilanes-Espinar JG, Ponciano-Rodriguez G, Uribe M, et al. High coffee intake is associated with lower grade nonalcoholic fatty liver disease: the role of peripheral antioxidant activity. Ann Hepatol. 2012;11(3):350–5. [PubMed] [Google Scholar]
- 24.Esposito F, Morisco F, Verde V, Ritieni A, Alezio A, Caporaso N, et al. Moderate coffee consumption increases plasma glutathione but not homocysteine in healthy subjects. Aliment Pharmacol Ther. 2003;17(4):595–601. [DOI] [PubMed] [Google Scholar]
- 25.Vitaglione P, Morisco F, Mazzone G, Amoruso DC, Ribecco MT, Romano A, et al. Coffee reduces liver damage in a rat model of steatohepatitis: the underlying mechanisms and the role of polyphenols and melanoidins. Hepatology. 2010;52(5):1652–61. [DOI] [PubMed] [Google Scholar]
- 26.Dranoff JA, Feld JJ, Lavoie EG, Fausther M. How does coffee prevent liver fibrosis? Biological plausibility for recent epidemiological observations. Hepatology. 2014;60(2):464–7. [DOI] [PMC free article] [PubMed] [Google Scholar]
- 27.Arauz J, Moreno MG, Cortes-Reynosa P, Salazar EP, Muriel P. Coffee attenuates fibrosis by decreasing the expression of TGF-beta and CTGF in a murine model of liver damage. J Appl Toxicol. 2013;33(9):970–9. [DOI] [PubMed] [Google Scholar]
- 28.Svilaas A, Sakhi AK, Andersen LF, Svilaas T, Strom EC, Jacobs DR Jr., et al. Intakes of antioxidants in coffee, wine, and vegetables are correlated with plasma carotenoids in humans. J Nutr. 2004;134(3):562–7. [DOI] [PubMed] [Google Scholar]
- 29.Arion WJ, Canfield WK, Ramos FC, Schindler PW, Burger HJ, Hemmerle H, et al. Chlorogenic acid and hydroxynitrobenzaldehyde: new inhibitors of hepatic glucose 6-phosphatase. Arch Biochem Biophys. 1997;339(2):315–22. [DOI] [PubMed] [Google Scholar]
Associated Data
This section collects any data citations, data availability statements, or supplementary materials included in this article.