

SUMMARY
Neutrophils are attracted to and generate dense swarms at sites of cell damage in diverse tissues, often extending the local disruption of organ architecture produced by the initial insult. Whether the inflammatory damage resulting from such neutrophil accumulation is an inescapable consequence of parenchymal cell death has not been explored. Using a combination of dynamic intravital imaging and confocal multiplex microscopy, we report here that tissue-resident macrophages rapidly sense the death of individual cells and extend membrane processes that sequester the damage, a process that prevents the initiation of the feedforward chemoattractant signaling cascade that results in neutrophil swarms. Through this “cloaking” mechanism, the resident macrophages prevent neutrophil-mediated inflammatory damage, maintaining tissue homeostasis in the face of local cell injury that occurs on a regular basis in many organs due to mechanical and other stresses.
Graphical Abstract
INTRODUCTION
Inflammation is a multicellular host response to infectious or physical tissue damage, involving a complex, tightly orchestrated sequence of events. It begins with an initiation phase at the onset of infection or sterile cell injury, during which chemoattractant signals promote immune cell recruitment, followed by propagation and enhancement of the initial hematopoietic cell response, and ending with the eventual resolution of the lesion through clearance of the inflammatory cells and repair of the underlying tissue damage. The latter resolution event may take place with or without scarring that can disrupt optimal tissue homeostasis and function (Medzhitov, 2008). Neutrophils and recruited cells of the mononuclear phagocyte system (MPS) play pivotal roles in this sequence of events, dominating the early infiltrate and provide a critical, fast-acting layer of innate defense.
Inflammation, however, is not always beneficial to the host. Innate immune cell activation, particularly neutrophil function, is a contributing factor to different aspects of disease pathology (e.g. myocardial infarction, pneumonia) both in rodents and humans (Nicolas-Avila et al., 2017; Rock et al., 2010; Weiss, 1989). The powerful weaponry neutrophils possess to combat pathogens can cause substantial collateral damage, which then amplifies further immune cell activation, loss of functional tissue, and eventual organ dysfunction (Brandes et al., 2013). The capacity of the innate immune cellular response to increase tissue damage beyond that created by the inciting infection or lesion itself, suggests that early checkpoints controlling the inflammatory response must be in place to counter unnecessary recruitment and secondary damage mediated by these effector cells. However, what such checkpoints might be and whether they operate merely to attenuate the magnitude or duration of otherwise typical neutrophil infiltration responses or might actually prevent such potentially tissue damaging actions of the innate immune system remain largely unknown.
Among the cells likely to play a central role in such putative regulatory activities are cells of the MPS. Macrophage transcriptional signatures are common in tissue samples from individuals or experimental animals with variety of disease processes (Murray, 2017; Wynn et al., 2013). The MPS is comprised of macrophages resident to all tissues as well as migratory monocytes that primarily circulate in the bloodstream and infiltrate tissues upon initiation of the inflammatory cascade, where they can become definitive macrophages (Geissmann et al., 2010). Fate mapping studies have revealed a strong development component to this dichotomy: Resident tissue macrophages (RTM) are primarily of prenatal origin (yolk sac or fetal liver), whereas monocytes are continuously produced by definitive, post-natal hematopoiesis (Ginhoux and Guilliams, 2016). Defects in the RTM compartment are often associated with developmental disorders and disruptions of physiological tissue equilibrium states (Gordon and Martinez-Pomares, 2017; Okabe and Medzhitov, 2016), highlighting the homeostatic functions executed by these macrophages, while circulating monocytes have long been implicated in the various aspects of the inflammatory cascade (Murray, 2018). However, how RTM other than brain microglial cells directly respond to tissue damage, has not been carefully explored, despite the probable contribution of such cells to regulation of local inflammatory responses (Medzhitov, 2008).
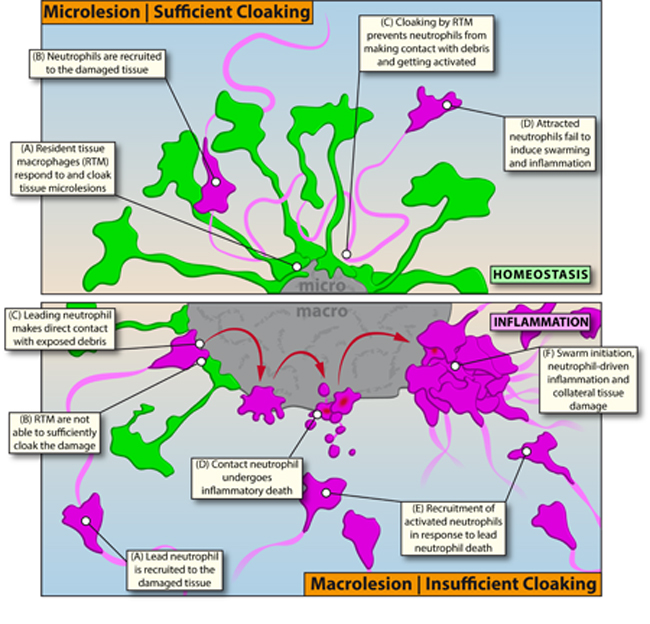
In this study, we use high-resolution intravital as well as static multi-parameter in situ imaging techniques to examine the very early stages of inflammatory responses to sterile tissue damage. We identified a regulatory mechanism that involves tissue-sessile, interstitial RTM acting as very local, dynamic first-responders to small-scale (single cell) tissue damage. By physically sequestering or “cloaking” pro-inflammatory debris, the RTM actively prevented initiation of a previously defined neutrophil recruitment and swarming cascade (Lammermann et al., 2013), thus disrupting potential tissue-damaging inflammatory responses at the earliest possible stage. Failure of the RTM-mediated cloaking process led to unchecked local inflammatory responses, neutrophil swarms, and collateral tissue damage that required secondary containment of neutrophil-driven inflammation by recruited migratory monocytes. Thus, by cloaking tissue lesions, RTM set a tissue-specific critical threshold for innate immune cell activation, constituting a previously unrecognized immune checkpoint involving the active prevention of steady-state inflammatory damage.
RESULTS
Endogenous Neutrophils Fail to Swarm at Microlesions
Neutrophil congregation is a key feature of most peripheral inflammatory responses and follows distinctive dynamic patterns described as neutrophil swarming, which comprises the recruitment and collective, directed movement of inflammatory neutrophils towards a focus in response to the prior activation of one or more “leading” neutrophils (Lammermann et al., 2013; Ng et al., 2011). To study regulatory pathways orchestrating this activation in greater detail in vivo, we developed an intravital imaging platform involving the peritoneal wall (Figure S1A; Movie S1A). The peritoneal serosa provided a useful site with a clear anatomical structure (Figure S1B; Movie S1B) along with minimal optical and physical barriers, enabling in-depth, high-resolution imaging of inflammation and cell recruitment kinetics. This model also permitted topical application of small-molecule inhibitors or antibodies for in situ-labeling of cells (Figure S1C–S1D).
To record extravascular neutrophil dynamics, we topically applied chemokines to attract neutrophils into the peritoneum, leading to accumulation within 40–60 minutes. As expected, neutrophils displayed strong swarming behavior in response to both pathogens (Figure S1E; Movie S2A) and sterile laser-induced damage (Figure 1A; Movie S2B). In both cases, cells followed sequential activation patterns (Movie S2C–S2D): The neutrophils first approaching the damage site displayed exploratory movements (Figure 1B), followed by one or more of the cells undergoing terminal activation upon direct contact with the debris. This event was marked by distinct morphological changes and nuclear uptake of propidium iodide consistent with cell death (Figure 1B; Figure S1F–S1G). This activation was subsequently followed by the attraction of a large number of activated neutrophils directly targeted the damage, migrating in a very directed manner from many cell diameters away from the lesion site and displaying clear swarming behavior at the site of damage (Figure 1B–1C; Figure S1G–S1I). Examining the site of neutrophil swarming using auto-fluorescence and second harmonic signals over time revealed the destructive potential of this process. The recruited and aggregating neutrophils broke down the coagulated tissue but also expanded the primary damage to initially unaffected, healthy tissue, with disruption and partial destruction of collagen fibers. The result was substantial local collateral tissue damage due to the swarming response (Figure 1D; Movie S2E). These features all were consistent with prior studies in a sterile injury model in the mouse ear skin (Lammermann et al., 2013).
Figure 1. Endogenous Neutrophils Fail to Swarm at Microlesions.

A) Pre-recruited neutrophils (magenta) swarming at a macrolesion (grey). Scale bar, 30 μm. Representative of 3 experiments. See Movie S2B.
B) Leading neutrophils (magenta) undergo cell death (cyan outline) upon contact (*) with macrolesion (grey) and initiate swarming. Scale bar, 10 μm. See Movie S2C.
C) Distance-time plot of individual tracks of pre-recruited neutrophils migrating towards a macrolesion (bottom of the graph). Track color = chemotactic index; X = neutrophil death; # = swarming. Representative of 3 experiments. See Figure S1H.
D) Changes in injury size (top; grey) and collagen structure (bottom) at a macrolesion with pre-recruited neutrophils over time. Scale bar, 30 μm. Representative of 2 experiments. See Movie S2E.
E) Pre-recruited neutrophils (magenta) swarming at a macrolesion (top) or a microlesion (bottom). Scale bar, 30 μm. Representative of 4 experiments. See Movie S2G.
F) Changes in injury size (top; grey) and collagen structure (bottom) at a microlesion with pre-recruited neutrophils over time. Scale bar, 30 μm. Representative of 3 experiments. See Movie S2H.
G) Swarming behavior of endogenously recruited neutrophils (magenta) at a macrolesion (grey). Scale bar,50 μm. Representative of 2 experiments. See Movie S2I.
H) Individual tracks of pre-recruited (top) versus endogenously recruited neutrophils (bottom) at microlesions (outline). Scale bar, 20 μm. Representative of 3 experiments. See Movie S2J.
I) Distance-time plot of tracks of pre-recruited (left) vs. endogenously recruited (right) neutrophils migrating towards a microlesion. Track color = chemotactic index; X = neutrophil death; # = swarming; * = wandering behavior. See Figure S1H. Representative of 3 experiments. See Movie S2J.
Given the damage that neutrophil responses to cell injury imposed, we asked if there existed discriminatory thresholds for neutrophil activation that would prevent such undesirable responses by impeding unnecessary swarming. In particular, we considered whether the accidental, non-apoptotic death of single cells, which might well be a frequent event in various tissue sites due to mechanical or other stresses (e.g. in muscles or at pleural or visceral serosal surfaces), could be prevented from routinely eliciting an inflammatory response that might contribute to progressive organ injury. To simulate such individual necrotic cell death, we scaled down the size of the laser-induced lesion to the single-cell level (= microlesion) (Figure S2A–S2D). In an initial series of experiments, we used chemoattractants to pre-elicit neutrophil migration into the tissue so that they were present at the time the stromal lesion was initiated by the laser pulse. Such extravascular neutrophils engaged in direct contact with the exposed debris (Figure S2E–S2F; Data File S1), displaying the same terminal activation patterns (Figure S2G; Movie S2F) and subsequent swarming dynamics at microlesions (Figure 1E-top) as seen with macrolesions (Figure 1E-bottom; Figure S2H; Movie S2G). Likewise, such swarming at a microlesion eventually resulted in similar collateral damage to cellular and acellular stromal components of the tissue (Figure 1F; Figure S2I; Movie S2H). Extravascular neutrophils able to rapidly access cell debris thus appeared to respond in an all-or-nothing fashion, showing similar swarming dynamics at both macro-and microlesions.
A fundamental mechanistic concept of swarming is the secretion of secondary mediators (e.g., LTB4) by activated neutrophils, which act in a signaling relay mode to promote recruitment of inflammatory cells over longer distances within the tissue (Afonso et al., 2012; Lammermann et al., 2013). We thus sought to study not only the behavior of pre-elicited neutrophils, but to adapt our experimental setup to capture the endogenous response to the damage. Induction of a macrolesion in a naive, untreated tissue reliably drove recruitment of neutrophils within the first hour, showing delayed but similar terminal activation patterns and swarming as seen with pre-elicited neutrophils (Figure 1G; Movie S2I). However, compared to the dynamics of pre-recruited neutrophils (Figure 1H top), the endogenous response at small microlesions differed considerably (Figure 1H bottom; Movie S2J): Neutrophils were still attracted to the site of damage, but mostly displayed exploratory wandering movements and failed to undergo terminal inflammatory activation or induce swarming (Figure 1I; Figure S2J).
Resident Tissue Macrophages Cloak Tissue Microlesions
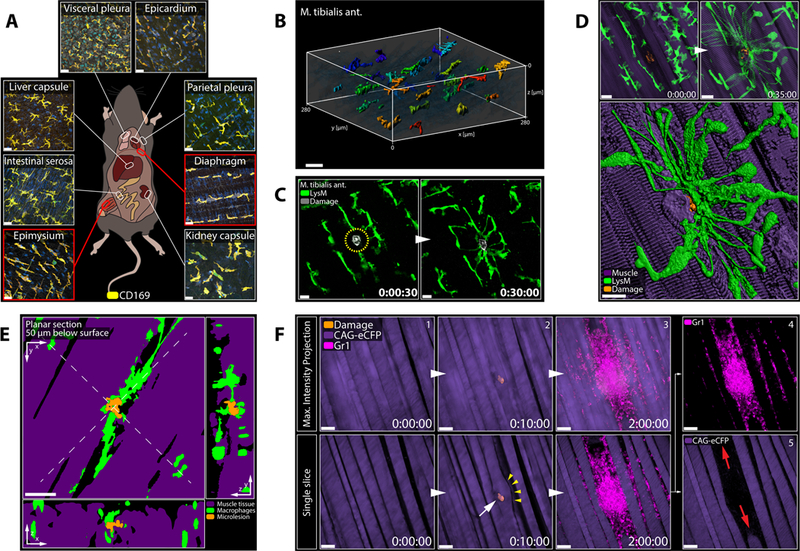
To understand why endogenously recruited neutrophils -in contrast to pre-elicited extravascular neutrophils -failed to swarm at microlesions, we investigated the dynamic behavior of other cells in the tissue. Embedded amongst fibroblasts, we found a large population of evenly distributed RTM (Figure 2A; Figure S3A; Data File S2A), which were non-migratory but whose cellular processes exhibited a continuous sampling and endocytosis behavior (Figure S3B; Movie S3A). Within 1–3 minutes of damage induction, however, RTM quickly sent out multiple spreading pseudopods towards the lesion, while still remaining sessile and fixed in position with respect to the main cell body (Figure 2B; Movie S3B).
Figure 2. Resident Tissue Macrophages are Dynamic First Responders to Tissue Damage.
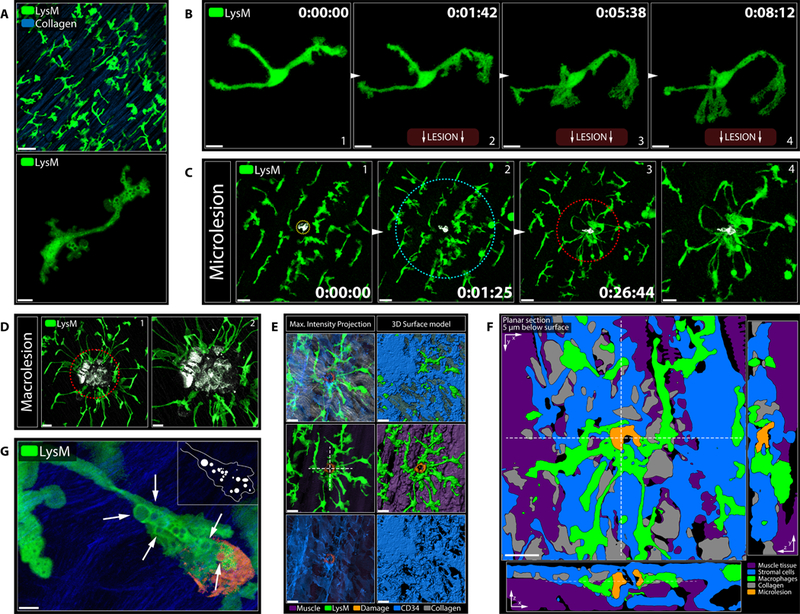
A) Peritoneal serosa (top) and close-up image of an RTM (bottom) under resting conditions. Scale bars, 5 μm (top) and 50 μm (bottom). See Movie S3A.
B) First minutes of an individual RTM (green) responding to a sterile tissue injury (bottom; not shown). Scale bar, 10 μm. See Movie S3B.
C) RTM (green) responding to a microlesion (grey). Image (4) shows (3) in higher magnification. Circles indicate inner (red) and outer (cyan) response zone around the damage. Scale bars, 20 μm (1–3) and 10 μm (4). See Movie S3C.
D) Different magnifications of RTM (green) responding to a macrolesion (grey). Scale bars, 20 μm (left) and 10 μm (right).
E) Cloaking RTM and stromal cells covering a microlesion. Max intensity projection (left); 3D surface model (right). See Data File S2C. Scale bar, 20 μm. Dashed cross marks cross section in Figure 2F. Representative of > 5 experiments.
F) Planar cross sections of 3D object in Figure 2E. See Data File S2D. Scale bar, 20 μm.
G) Large endosomes (arrows) in a cloaking RTM (green) at a microlesion (orange). Scale bar, 5 μm.
This early dynamic response was observed in RTM within a radius of 100–150 μm around the lesion (“sensing”). Pseudopods originating from RTM within 50–100 μm eventually closed in on the outer perimeter of microlesions (“convergence”; Figure 2C), while cells further away retracted the initial probing pseudopods and continued with regular sampling dynamics. This divided the tissue and localized RTM into an inner and an outer response zone around the damage. Being numerically restricted as well as sessile with a limited radius of action, this dynamic macrophage response was far more effective at covering microlesions, where pseudopods were able to cloak all or nearly all of the visible damage (Figure 2C; Movie S3C; Data File S2B) as compared to larger regions of injury (Figure 2D). Together with the surrounding immobile stromal cells bodies, the cloaking processes covered the exposed part of the microlesion almost completely, rendering the damage functionally inaccessible to probing neutrophils (Figure 2E and 2F; Data File S2C–S2D).
At the site of lesion cloaking, large vesicles emerged indicating enhanced endocytic activity of the responding RTM (Figure 2G). This suggested that cloaking might both physically sequester the damage away from subsequently arriving neutrophils, while also scavenging damage-associated molecular products (DAMPs) released from the injured / dead cells (Uderhardt et al., 2012). Together, this inhibition of damage sensing appeared to prevent the activation and propagation of the leukotriene-dominated feed-forward recruitment sequence that is necessary for swarming (Lammermann et al., 2013).
Cloaking Prevents Neutrophil-Driven Inflammation
To test directly whether RTM cloaking actively prevents swarming, we took advantage of the fact that several RTM populations selectively express the lectin CD169 and can thus be reliably distinguished from monocytes and neutrophils (Figure S3C). The CD169-DTR mouse model allowed us to specifically deplete RTM in the peritoneum using diphtheria toxin (DT) without affecting other relevant phagocyte populations (Figure S3D–S3F).
RTM-depletion in CD169-DTR mice had no impact on the timing or extent of neutrophil recruitment, activation, and subsequent swarming at macrolesions, with comparable infiltrates within the first hours in control-and DT-treated animals (Figure 3A). Similar results were obtained with a model of acute peritonitis (Figure S3G). These results indicated that CD169-expressing RTM were not acting as sentinels of sterile insult but were dispensable for the initiation of an inflammatory response to macroscopic damage. In contrast, RTM-depletion dramatically changed the inflammatory dynamics at a microlesion: In CD169-DTR mice treated with DT to deplete the RTM and prevent cloaking, the leading neutrophils made extensive contact with the debris, underwent terminal activation, and induced swarming (Figure 3B–3C; Movie S4A;) with typical inflammatory dynamic patterns (Figure 3D; Figure S3H). These findings showed that RTM were able to prevent neutrophil swarming at microlesions, but not at macrolesions.
Figure 3. Cloaking by RTM Prevents Neutrophil Activation and Subsequent Swarming.
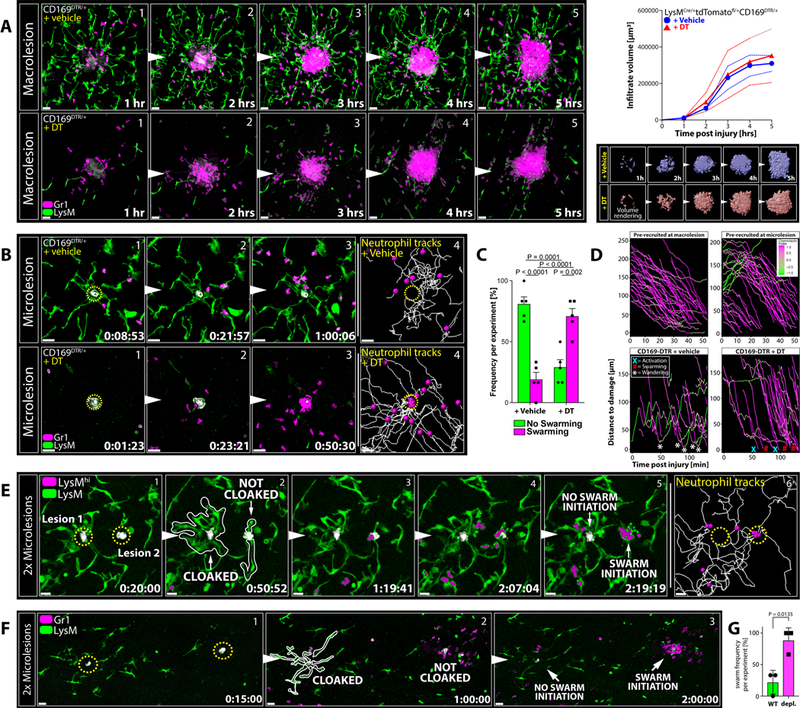
A) RTM (green) and neutrophils (magenta) responding to macrolesions (grey) in CD169-DTR mice treated with vehicle (top; blue graph) or DT (bottom; red graph). Scale bar, 30 μm. Graphs show infiltrate volumes (means ± SEM as dashed lines) over time. Bottom pictures show surface volume renderings of infiltrates. n = 4 animals per group.
B) RTM (green) and neutrophils (magenta) responding to microlesions (grey) in CD169-DTR mice treated with vehicle (top) or DT (bottom). Scale bar, 30 μm. n = 5 animals per group. See Movie S4A.
C) Frequencies of neutrophil swarming (magenta) versus successful cloaking by RTM (= no swarming; green) at microlesions in vehicle-(left) or DT-treated (right) CD196-DTR mice. Two-way ANOVA; n = 5 animals per group with 5–7 microlesions per mouse; means ± SEM.
D) Top: Distance-time plot showing tracks of pre-recruited neutrophils migrating towards a macro-(top left) or microlesion (top right). Bottom: Distance-time plot showing individual tracks of endogenously recruited neutrophils migrating towards a microlesion in vehicle-(bottom left) or DT-treated (right) CD169-DTR mice. X = neutrophil death; # = swarming; * = wandering behavior. See Figure S1H.
E) RTM (green) and neutrophils (green/magenta) responding to two sequential microlesions (grey) set close to each other at minute 0 (left lesion 1) and at minute 20 (right lesion 2). Scale bar, 20 μm. Representative of 3 experiments. See Movie S4B.
F) RTM (green) and neutrophils (magenta) responding to two micro-lesions set simultaneously in an RTM-rich (left lesion) or RTM-lacking (right lesion) area in partially RTM-depleted mice. Scale bar, 30 μm. Representative of 3 experiments with 3 sets of lesions per mouse. See Figure S3K–S3O.
G) Frequency of neutrophil swarm initiations in RTM-rich (WT) versus RTM-depleted (depl.) areas within the same field-of-view (Figure 3F). Unpaired t test; n = 3 animals per group with 3 microlesion sets per mouse; means ± SEM.
Quantitative Limitations to Cloaking Efficiency
Given their numeric and spatial limitations, we speculated that RTM cloaking would fail not only when the macrophages were confronted with large scale damage (macrolesions) but also when challenged with multiple microlesions at once. Indeed, two sequential microlesions set close to each other after enough time for the initial damage to begin the RTM response process allowed only the first lesion to be sufficiently cloaked, while the latter remained highly exposed. Neutrophils recruited to the uncloaked second site of damage became activated and initiated swarming, while the initial cloaked lesion maintained free of inflammation (Figure 3E; Figure S3I–S3J; Movie S4B). These observations indicate that the RTM do not provide a large-scale diffusive barrier to neutrophil activation in the tissue but act very locally to constrain neutrophil responses within the confines of their extended cellular processes at the site of tissue damage and that this response system has evolved to deal with only very limited cell damage in a local region at any one time.
When substantially depleted in a post-natal host, RTM can be replaced by monocyte precursors. The replacement cells adopt much of the tissue-specific transcriptional profile of prenatally-derived RTM over the course of several weeks, though the replacement cells do differ in some respects from the normal RTM and whether they perform an equivalent function as their pre-natal predecessors remains unclear (Ginhoux and Guilliams, 2016). We therefore used a LysM-Cre x Csf1r-DTR model to deplete monocytes and RTM by short-term diphtheria toxin (DT) treatment (Schreiber et al., 2013) (Figure S3E–S3F), followed by adoptive transfer of donor bone marrow cells (Figure S3K–S3L). This produced an animal with repopulation of host monocytes and new RTM, creating a chimera of host-and donor-derived macrophages in the tissue (Figure S3M). DT re-treatment 8 weeks later (Figure S3N) specifically depleted host DTR-positive macrophages without affecting donor-derived DTR-negative RTM, creating RTM-rich and RTM-depleted areas within the same tissue, as indicated by dextran uptake (Figure S3O). As expected, donor-derived RTM readily cloaked microlesions in their vicinity (Figure 3F), while uncloaked lesions in RTM-depleted areas readily caused neutrophil swarming and inflammation (Figure 3F–3G). Taken together with the multiple lesion study, these results reveal that spatial organization and lesion density, not just size, dictate the effectiveness of RTM cloaking in response to sterile damage, rendering the inhibitory process most effective at widely spaced, individual microlesions (Figure S3P).
Sequential Sensing of Damage-Associated Alarmins Drives Cloaking
Dynamic tracking of individual RTM pseudopods from the inner and outer zone around the lesion suggested a biphasic kinetic during the cloaking response, comprising an initial sensing phase (inner and outer zone) and a subsequent convergence process (Figure 4A and 2C; Figure S4A–4B). Nucleotides act as short-range activators of innate immune cells and are among the earliest intracellular molecules released from damaged cells (Venereau et al., 2015). Transcriptional analysis of RTM revealed the expression of multiple receptors capable of sensing different nucleoside di-and/or triphosphates (Figure 4B). Removing extracellular nucleotides locally with apyrase almost completely blocked early RTM activation in response to damage and severely impaired cloaking of microlesions (Figure 4C). Targeting specific nucleotide receptors or receptor classes individually failed to interfere with cloaking and only blocking nucleotide sensing entirely could replicate the apyrase effect, which suggested a high level of receptor signaling redundancy (Figure 4C; Figure 4D).
Figure 4. Sequential Sensing of Damage-Associated Alarmins Drives Cloaking.
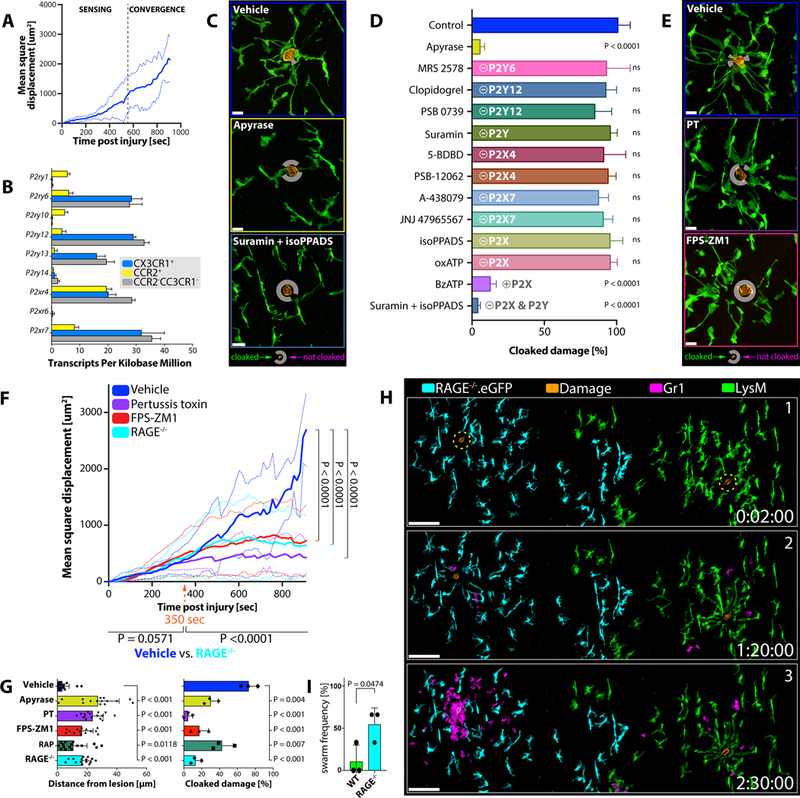
A) Mean square displacement of individual RTM pseudopods moving towards a micro-lesion over time. Data pooled from three independent tracking experiments. See Figure S4A–S4B.
B) P2 receptor expression in different phagocyte populations isolated from peritoneal tissues of Cx3cr1gfp/+Ccr2rfp/+ mice (n = 3). Normalized reads per kilobases; means ± SEM.
C) RTM (green) responses 30 minutes after damage induction (orange) in mice pre-treated with vehicle (top), apyrase (mid) or suramin/isoPPADS (bottom). n = 3–5 animals per group with 2–3 lesions per mouse. Scale bar, 15 μm. White circles mark un-cloaked areas.
D) Comparison of RTM cloaking capacities upon inhibitor treatment. n = 2–3 animals per group with 2–3 lesions per mouse. One-way ANOVA; each condition compared to the naïve control; means ± SEM.
E) RTM (green) responses 30 minutes after damage (orange) induction in mice treated with vehicle (top), PT (mid) or FPS-ZM1 (bottom). n = 3–5 animals per group with 2–3 lesions per mouse. Scale bar, 15 μm.
F) Mean square displacement of individual RTM pseudopods moving towards a microlesion in WT mice treated with vehicle (blue), FPS-ZM1 (red) or pertussis toxin (purple), and RAGE−/−(cyan) mice over time. Data pooled from three independent tracking experiments for each condition. Two-way ANOVA; means ± SEM. See Figure S4C.
G) Distances of pseudopods to microlesions (left) and physically cloaked area (right; pooled data from three independent experiments) 30 minutes after damage induction in WT mice treated with vehicle (blue), apyrase (yellow), pertussis toxin (PT; purple), FPS-ZM1 (red) or RAGE Antagonist Peptide (RAP; green), or RAGE−/−(cyan) mice. Two-way ANOVA; means ± SEM. See Figure S4C.
H) Responses of wildtype RTM (green) versus RAGE−/−.eGFP RTM (cyan) to simultaneously induced microlesions (orange) and subsequent neutrophil behavior (magenta). See Figure S4D. Scale bar, 100 μm. Representative of 3 experiments with 3 sets of lesions per mouse.
I) Frequency of neutrophil swarm initiations in wild type (WT) versus RAGE-deficient (RAGE−/−) areas. Unpaired t test; n = 3 animals per group with 3 lesion sets per mouse; means ± SEM.
Given the short half-life and range of extracellular nucleotides, we further speculated that other DAMPs could be involved in the full cloaking response. Pre-treatment of RTM with pertussis toxin (PT) did not interfere with initial lesion sensing but prevented the extending pseudopods from making contact with the damage, pointing to a contribution of G protein-mediated signaling during the convergence phase (Figure 4E and 4F; Figure S4B). The receptor for advanced glycation end products (RAGE) is expressed in numerous immune and non-immune cell populations, promiscuously senses a plethora of different alarmins like various AGEs, S100 family proteins, and the chromatin protein HMGB1, and operates in a predominantly PT-sensitive manner (Degryse et al., 2001). By blocking RAGE with two different pharmacological inhibitors as well as using RAGE knockout mice (Constien et al., 2001), we could indeed phenocopy the effect of PT on the convergence phase of cloaking without affecting initial sensing (Figure 4E–4G; Figure S4C).
Global RAGE-deficiency also affects inflammatory activation of neutrophils (Huebener et al., 2015). We therefore adoptively transferred wildtype and RAGE−/−.eGFP bone marrow into monocyte/macrophage-depleted hosts to specifically study RAGE-deficiency on the cloaking ability of RTM (Figure S4D). Taking advantage of the non-random chimerism of host-and donor derived RTM 8 weeks after transfer, we induced microlesions in areas enriched with RAGE−/−or wild type (WT) cells (Figure 4H) and directly compared their cloaking responses. RAGE-deficiency caused incomplete cloaking responses, similar to what we observed with pharmacologic inhibition (Figure 4H), eventually permitting infiltrating neutrophils to make physical contact with the debris and initiate swarm formation (Figure 4H–4I). This data indicated that activation of RTM in response to sterile tissue damage was initiated by nucleotide-induced signaling while sensing of secondary alarmins was necessary for pseudopod extensions to complete the cloaking process.
Late Stage Events in Lesion Resolution with and without RTM Cloaking
To investigate the longer-term consequences that an absence of cloaking has on tissue homeostasis, we established an experimental system that allowed us to follow and re-image the same microlesions over time, using prominent deep vessel patterns to map the damage site (Figure 5A). At 22 hours after microlesion wounding, we consistently failed to detect neutrophil swarms in control mice (Figure 5B left), with most of the microlesions having either vanished or markedly shrunk in size (Figure 5C). Conversely, RTM-depletion in CD169-DTR mice reliably caused inflammatory swarming at microlesions that were still evident 22 hours later (Figure 5B right), with most lesions increasing in size (Figure 5C) and showing enhanced collagen displacement (Figure 5D). This indicated that lack of RTM allowed not only neutrophil-driven inflammation at microlesions but also affected healthy tissue by causing collateral damage. Cloaking, in turn, promoted healing of the microwounds in a non-phlogistic manner.
Figure 5. Failure of Cloaking Causes Collateral Damage and Requires Containment by Migratory Monocytes.
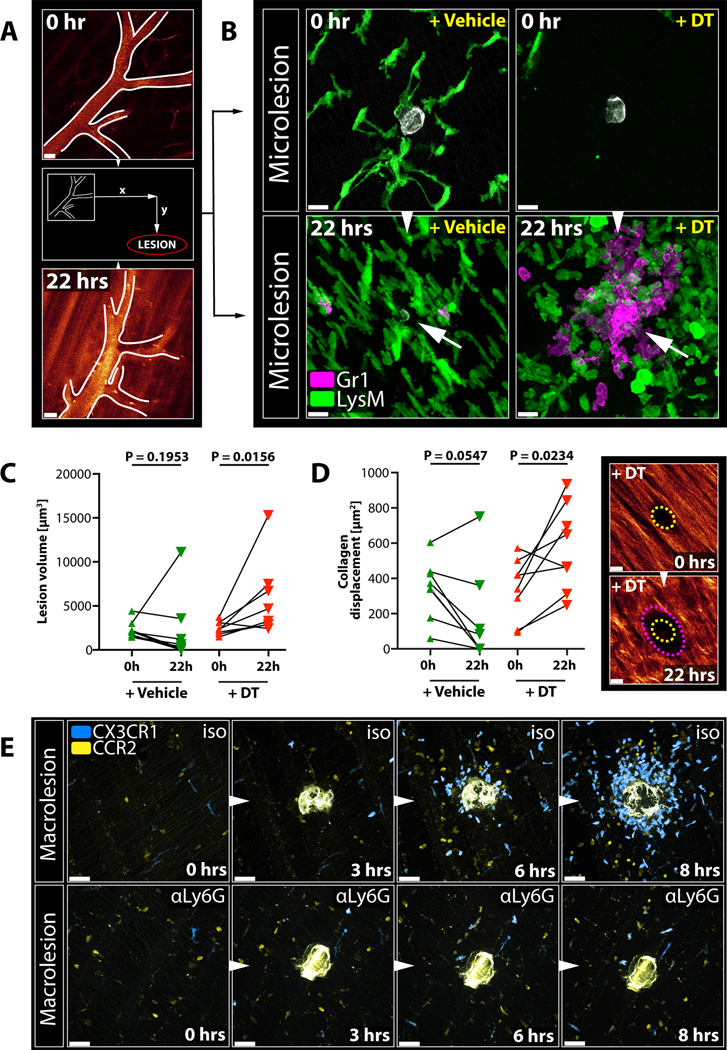
A) Vessel structure used as a reference point to map microlesions and re-image them 22 hours later. Scale bar, 30 μm.
B) RTM (green) and endogenous neutrophil responses (magenta) to microlesions (grey) right after damage induction and 22 hours later in CD169-DTR mice treated with vehicle (left) or DT (right). Arrows show late microlesions. Representative of 2 experiments. Scale bar, 20 μm.
C) Size changes of individual microlesions over time in vehicle-(left) or DT-treated CD169-DTR mice over time. Wilcoxon test on matched samples (n = 5–7). Representative of 2 experiments.
D) Collagen displacement at microlesions over time in vehicle-(left) or DT-treated CD169-DTR mice over time. Wilcoxon test on matched samples (n = 5–7 individual lesions). Representative of two independent experiments. Images show representative lesion in a DT-treated CD169-DTR mouse right after damage induction (top; yellow outline) and 22 hours later (bottom; magenta outline). Scale bar, 10 μm.
E) Dynamic response of migratory CX3CR1+ (blue) or CCR2+ (yellow) monocytes to a macro-lesion in isotype-treated (“iso”; top) or neutrophil-depleted (“αLy6G”; bottom) Cx3cr1gfp/+Ccr2rfp/+ reporter mice. Scale bar, 30 μm. Representative of 3 experiments each. See Movie S5B.
Failure of Cloaking Requires Monocyte-Recruitment and Secondary Containment
Failure of cloaking to prevent neutrophil activation at macrolesions led to recruitment of CCR2+ and CX3CR1+ monocytes 2–4 hours later (Figure S4E). Monocytes present in the tissue under steady-state conditions were migratory (Jakubzick et al., 2013), yet not primarily attracted to the damage (Figure S4F; Movie S5A). Instead, in the presence of swarming neutrophils, tissue-patrolling and recruited monocytes formed a spherical structure around the expanding focus (Figure 5E top; Movie S5B) (Dal-Secco et al., 2015; Lammermann et al., 2013), which coincided temporally with the cessation of neutrophil recruitment (Figure S4E). Systemic depletion of neutrophils abrogated monocyte attraction (Figure 5E bottom; Movie S5B), indicating that monocytes were responding to the swarming neutrophils and not the tissue damage per se. These findings suggest that if cloaking fails to prevent swarming, recruited monocytes may not only play a role in the later resolution of a lesion containing tissue and neutrophil debris but may also limit unconstrained growth of the neutrophil swarm and further tissue damage.
RTM Cloak Partially Damaged Muscle Fibers
In situ immunostaining of various serosal and interstitial tissue compartments revealed RTM populations with phenotypes and highly organized distribution patterns, similar to what we observed in the peritoneum (Figure 6A and 6B; Figure S5A, S5B and S5C). Intravital imaging of tibialis anterior muscles further showed that endo-and perimysial RTM exhibited the same dynamic cloaking response to a local necrotic tissue damage (Figure 6C) as seen in the peritoneal model. Dynamic imaging of the deeper abdominal muscles allowed careful analysis of the cellular responses after partially damaging a myocyte without killing the entire myofiber (Figure S5D). Such a damage provoked a strong cloaking response in the surrounding RTM, which sent out long processes to fully cover the damaged area of the affected myofiber (Figure 6D–6E; Data File S3). While partially damaging the myocyte caused a local swelling of the fiber, a local loss of the specific striated pattern, and the emergence of a longitudinal striation, it did not result in complete myofiber death, with the fiber managing to retain its structural integrity (Figure S5E). Microlesions of myocytes in the presence of neutrophils, in turn, readily induced swarming and inflammation, causing further collateral damage and eventual rupture of the myofiber, highlighting the destructive power of a swarm (Figure 6F; Figure S5F) and suggesting that regulation of neutrophil-driven inflammation by RTM could be a broadly relevant mechanism of tissue protection across organs.
Figure 6. RTM Cloak Damaged Muscle Fibers.
A) Confocal images showing various RTM populations in naïve LysM-gfp mice. Representative of 2 experiments. Scale bar, 30 μm.
B) 3D reconstruction of RTM distribution in the tibialis anterior muscle. Object color = distance on y-axis. Scale bar, 30 μm.
C) Endomysial RTM (green) responding to a microlesion (grey) in the tibialis anterior muscle. Scale bar, 20 μm. Representative of 3 experiments.
D) Endo-and perimysial RTM (green) responding to a partially damaged myofiber (top = max intensity projection; bottom = 3D reconstruction). See Data File S3A. Scale bar, 20 μm.
E) Planar cross sections of 3D object in Figure 6D. See Data File S3B. Scale bar, 20 μm.
F) Pre-recruited neutrophils (magenta) swarming at a partially damaged myocyte (purple). Top = max intensity projection; bottom = single slice through plane of damage. Arrows show ruptured myofiber. Scale bar, 50 μm. Representative of 3 experiments.
RTM Prevent Excess Tissue Damage Under Physiologic and Diseased Conditions
To study the role of RTM in a neutrophil-driven disease model, we employed a genetic mouse model for muscle dystrophy (mdx), in which a dystrophin deficiency leads to cellular instability, consequent necrotic damage, and eventual cell death of muscle fibers. This causes a systemic, yet self-limiting inflammatory myopathy in the first weeks of life, predominantly affecting tissues subject to higher mechanical stress like the tibialis anterior muscles or the diaphragm (Sicinski et al., 1989; Tidball, 2005). While initially only isolated myocytes are affected in the mdx model, neutrophils have been shown to play a pivotal role in exacerbating the damage and promoting clinical disease (Hodgetts et al., 2006). We hypothesized that, early in disease, interstitial RTM would respond to the isolated necrotic damage and prevent local neutrophil activation. With progressing disease, however, more necrotic events would accumulate, eventually overwhelming the tissue-protective function of RTM, leading to neutrophil activation and inflammation.
Studying the diaphragms harvested from 14 days old mdx mice revealed the early appearance of cloaking formations in the absence of neutrophil clusters (Figure S5G), often converging around local swelling of muscle fibers similar to what we observed when analyzing laser-induced myocyte damage (Figure 7A; Fig S5E). More extensive and/or advanced foci, in turn, displayed already established neutrophil-rich inflammatory responses (Figure 7A). Consistent with our predictions, early depletion of RTM after birth (using αCsfr1 treatment or the CD169DTR mouse model; Figure S3E–S3F) resulted in premature onset of disease at ages when mdx control littermates were still mostly free of muscle damage (Figure 7B–7C). Histologically, RTM-depletion in both cases led to extensive necrotic areas (Figure 7D) marked by increased neutrophil infiltrates (Figure 7E; Figure S5H), detectable in diaphragms as early as 16 days of age in RTM-depleted but not control animals (Figure S5I–S5J). Neutrophils were clearly driving this exacerbation as we were able to significantly reduce muscle necrosis in the diaphragm of mice lacking RTM by additional neutrophil depletion (Figure 7B; Figure S5K). RTM thus executed an early -yet limited -tissue-protective function in mdx mice.
Figure 7. RTM Cloak Damaged Muscle Fibers.
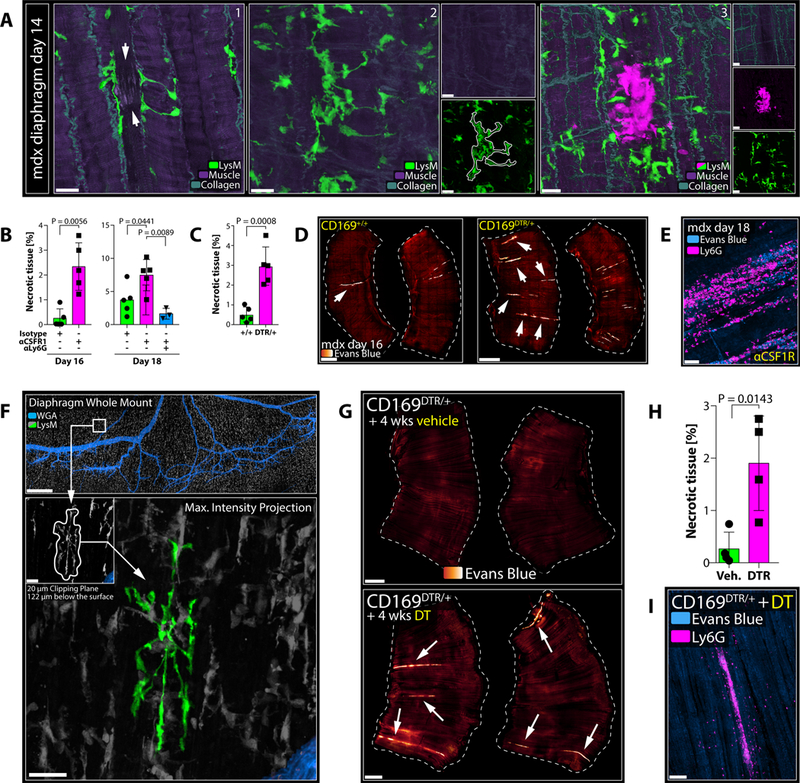
A) Diaphragms isolated from mdx mice at day 14 of age. White arrows show damaged muscle fibre with cloaking RTM processes. Representative of > 3 experiments. Scale bar, 20 μm.
B) Extent of necrosis in diaphragms of mdx mice on day 16 (left) or day 18 (right), treated with isotype (green), anti-CSFR1 (magenta) or anti-CSFR1/anti-Ly6G (blue). Unpaired t test (day 16); one-way ANOVA (day 18); n = 3–5 animals per group; means ± SEM. Representative of 2 experiments.
C) Extent of necrosis in diaphragms of CD169+/+ (green) or CD169DTR/+ (magenta) mdx mice on day 16, treated with DT. Unpaired t test; n = 5 animals per group; means ± SEM. Representative of 2 experiments.
D) Diaphragms from CD169+/+ or CD169DTR/+ mdx mice on day 16. Arrows show necrotic tissues (orange-to-white). Scale bar, 1000 μm.
E) Neutrophil infiltrates (magenta) in necrotic muscle (blue). Scale bar, 50 μm.
F) Representative confocal image of a Ce3D-cleared diaphragm; cloaking RTM highlighted in green. Scale bars, 500 μm (top) and 30 μm (bottom). See Movie S7A.
G) Diaphragms from adult CD169-DTR mice after long-term treatment with vehicle (left) or DT (right). Arrows show necrotic tissues (orange-to-white). Scale bar, 1000 μm.
H) Quantification of necrosis in diaphragms of CD169-DTR mice after long-term treatment with vehicle (green) or DT (right). Unpaired t test; n = 4 animals per group; means ± SEM. Representative of 2 experiments.
I) Neutrophil infiltrates (magenta) in necrotic muscle (blue) in CD169-DTR mice after long-term DT-treatment. Scale bar, 100 μm.
We speculated that tissues subject to ongoing mechanical stress would generally be at great risk for incidental cell damage and would hence rely on tissue-protection from RTM in otherwise healthy hosts. In support of this view, we could find cloaking-like RTM constellations in peritoneal tissues of naive animals (Figure S5L) as well as to an even greater extent in diaphragm whole mounts (Figure 7F; Movie S7A). While rare at any given time (~ 5 events per diaphragm or ~ 2 per peritoneum), spontaneous cloaking clearly resembled experimentally-induced cloaking, with pseudopods converging around a central focus, indicative of a damaged cell. In line with the notion that such ‘spontaneous’ cloaking was protecting tissues from neutrophil damage under steady-state conditions, long-term depletion of RTM in adult CD169-DTR mice led to the development of necrotic myofibers in the diaphragm associated with evidence of scattered spontaneous inflammatory damage (Figure 7G and 7H) dominated by inflammatory neutrophil infiltrates (Figure 7I; Figure S5M).
DISCUSSION
While inflammatory responses are critical to host defense, these responses can also cause extensive collateral tissue damage and hence require strict regulation to avoid disruption of organ function. While great progress has been achieved in deciphering anti-inflammatory pathways that curb propagation of ongoing responses or orchestrate active resolution of such processes (Fullerton and Gilroy, 2016), mechanisms that regulate and counter-balance the very earliest events involved in the initiation of inflammation are less well defined. This study was therefore designed to explore potential discriminatory thresholds for inflammatory responses to cell damage or death in vivo. Our findings provide strong evidence that tissues are not routinely subjected to damaging inflammatory responses by recruited effector cells, should parenchymal cells die due to local stresses, but rather that the initiation of neutrophil-driven inflammation is impeded through the local tissue-protective actions of sessile, tissue-resident macrophages.
Using our peritoneal imaging method, we observed rapid sensing of cell damage by RTM. This is similar to what has been observed following sterile laser damage in the brain for another population of RTM, the microglial cells (Davalos et al., 2005). As in the present report, this response depended on nucleotide stimulation of the microglial cells, while the activity of a limited nucleotide receptor set in the brain studies differed from our findings (Haynes et al., 2006), in which global inhibition of the P2X and P2Y families of receptors was necessary to impede the damage sensing mechanism. We also uncovered a key role for additional signaling events in generating the mature cloaking response of peritoneal RTM that involved the receptor RAGE, which can respond to a variety of damage-associated molecule patterns (DAMPS) such as HMGB1 or various proteins of the S100 family (Liliensiek et al., 2004). The secondary sensing by RAGE of material released from the damaged parencymal cell was necessary for nucleotide-activated RTM to fully extend processes towards and to surround the injured or dead cell. The well-recognized role of nucleotide receptors (Cekic and Linden, 2016) and RAGE (Huebener et al., 2015) in other myeloid cells, where they can play an activating role that promotes inflammatory processes, makes it impossible to study the long-term consequences of interference with the cloaking response of RTM until animals can be engineered to selectively lack the relevant receptors in only the RTM population.
Beyond defining the ligands and receptors involved in evoking the RTM cloaking response, our investigation goes further than earlier studies to provide direct functional evidence for the important role of this macrophage response in limiting inflammatory damage in tissues under steady-state conditions. Selective depletion of RTM in CD169-DTR animals enabled microlesions to induce neutrophil swarming responses that disrupted the local cellular and stromal tissue environment. Analysis of perfused fixed tissues revealed the presence of cloaking in naïve, unchallenged mice, suggesting a physiological role for this dynamic process. While a cloaking constellation persists only temporarily and thus is a rare event at any given time, the cumulative effects of this process over time are substantial, as prolonged RTM depletion in the CD169-DTR model led to the accumulation of necrotic myofibers in the diaphgram. This is consistent with the concept that RTM cloaking acts in the steady-state to prevent neutrophilic tissue damage in response to death of isolated cells due to mechanical and others stresses. Further evidence of the key role of the RTM cloaking process in limiting inflammatory tissue damage was obtained in a mouse model of muscle dystrophy. While monocyte-derived inflammatory macrophages have been implicated in later disease progression (Mojumdar et al., 2014), early depletion of RTM using two different approaches accelerated disease onset and severity in association with earlier than normal accumulation of extensive neutrophil infiltrates in neonatal muscles.
High resolution dynamic imaging revealed the emergence of large vesicles with centripetal movement in the pseudopods of cloaking RTM, indicative of increased endocytic activity and the removal of debris and DAMPs. Neutrophils still appeared around cloaked microlesions and showed migratory orientation towards the damage, suggesting the lesion was not “invisible”. As approaching neutrophils could be visualized directly probing the cloaking processes rather than turning away at a distance, the active secretion of chemorepulsive signals by cloaking RTM seems unlikely, though not entirely excluded. Furthermore, there was no evidence that cloaking interfered with swarm progression (after its initiation), e.g., through degradation of swarming mediators like LTB4, as the absence of RTM did not affect early swarm establishment.
The similarities of the cloaking process to descriptions of the microglial response to laser-induced (Davalos et al., 2005) or Alzheimer’s disease-related neuronal damage (Jung et al., 2015) raise the intriguing possibility that the sequestration of DAMPs as we describe here in preventing peripheral tissue neutrophil responses might have a related function in limiting spreading of inflammatory signals in the brain, albeit without neutrophil swarming inhibition as a primary or the sole protective mechanism. Moreover, one could speculate that the cloaking actions of RTM may limit recruitment of suppressive myeloid cells in cancers but the frequent death of transformed cells in growing tumors might easily overwhelm this mechanism, leading to the type of secondary cell recruitment noted here (Franklin et al., 2014).
Swarm initiation is associated with the activation-associated death of a leading neutrophil (Lammermann et al., 2013), and we failed to find swarms being initiated without a leading neutrophil making physical contact with the lesion. Given the spatial geometry around a microlesion (Data File S2–S3), the evidence that neutrophils come close to the region of damage whether or not cloaking is present (Data File S1) and the necessity for the inflammatory death of a neutrophil to initiate swarming, we conclude that a primary function of cloaking is acute blockade of physical access to the debris, which renders cloaking a strictly local event. Blocking access prevents contact-dependent activation and death of lead neutrophils and initiation of the feedforward molecular events that produce swarming and inflammation. In turn, the more extensive the damage, the less likely it is for RTM to prevent neutrophil contact with the damage, consistent with our experimental data. The role we reveal here for RTM in promoting tissue homeostasis and limiting cellular inflammation in response to tissue injury has likely been obscured in prior studies because RTM are easily overwhelmed in common animal models for systemic inflammatory diseases or sterile injuries by the large number of recruited cells or extent of primary damage, e.g. ischemia/infarction models, skin punch or macroscopic needle injuries. We overcame this restriction by limiting the inflammatory challenge to a single-cell damage, big enough to induce a response, but small enough to be contained by the local regulatory mechanisms.
In most tissues, RTM constitute a unique population of mostly prenatally-derived phagocytes. Early during organ development, interstitial macrophages and stromal cells establish a strong set of reciprocal interconnections that contributes to establishment of an organ-specific pattern of cell distribution and gene expression program in the local RTM population (Amit et al., 2016; Gosselin et al., 2014; Mass et al., 2016; Okabe and Medzhitov, 2014). Non-random RTM distribution patterns ensure optimal coverage and surveillance for local tissue injury, with defects in RTM population density or spatial distribution, compromising local cloaking capacity and giving attracted neutrophils a critical advantage. Perturbations of RTM population maintenance or differentiation, genetically inherited variations in RTM spatial distribution in tissues, as well as changes in body habitus due to processes such as obesity that alter the distribution pattern of these cells, may lead to a propensity for inflammatory tissue damage due to a failure of effective cloaking when cell death occurs in tissue sites with sparse local densities of RTM. In addition, there is likely gradual replacement of embryologically-derived RTM during aging with monocyte-derived cells in certain tissues (Ensan et al., 2016; Molawi et al., 2014). Further study of how the topography of RTM and the small but potentially meaningful differences in biology of fetal-vs. adult-derived RTM affects tissue homeostasis may prove informative in better understanding of the well-studied increases in measures of inflammation in the obese or elderly and of idiopathic cumulative tissue damage in certain individuals.
While RTM are deeply embedded into the stromal fabric of the tissue, migratory immune cells, such as monocytes and neutrophils, lack these intimate connections. The classical inflammatory cascade entails programs to restore -rather than preserve -tissue homeostasis (Serhan and Savill, 2005). Migratory monocytes populate peripheral tissues in meaningful numbers (10–15 % of CD11b+ phagocytes in the peritoneum) (Jakubzick et al., 2013). While these monocytes did not primarily respond to damage itself, they were readily attracted to ongoing swarming activity and together with additionally recruited monocytes, encircled the expanding focus as previously described. This secondary sequestering of the focus appeared to limit further neutrophil activation and recruitment and likely initiated resolving and reparative programs (Arnold et al., 2007; Dal-Secco et al., 2015). Therefore, while cooperatively tissue-protective, both RTM and monocytes play different roles in response to sterile tissue damage, namely primary prevention of inflammation and secondary resolution, respectively (Figure S5N; Movie S6).
In conclusion, our findings support a model in which RTM execute a tissue-protective role in response to acute, microscopic disruptions of stromal integrity, which can be further understood as part of the pro-homeostatic core functions of tissue macrophages, evolved to maintain tissue and organ functionality. We speculate that tissues with limited regenerative capacity critically depend on cloaking and that defects in RTM-intrinsic cloaking factors, population dynamics, or cell distribution patterns could provoke immune responses to normally subliminal homeostatic disruptions and thus contribute to the pathogenesis of chronic inflammatory states and organ dysfunction.
STAR Methods
CONTACT FOR REAGENT AND RESOURCE SHARING
Further information and requests for resources and reagents should be directed to and will be fulfilled by the Lead Contact, Stefan Uderhardt (uderhardts@nih.gov).
Material Transfer Agreements are in placed with RIKEN BRC, Japan (for CD169-DTR mice) and NYU School of Medicine, USA (for RAGE−/−mice).
EXPERIMENTAL MODEL AND SUBJECT DETAILS
Animals studies
The following mouse strains were used in this study:
Lyz2gfp/gfp (“LysM-gfp”; C57BL/6-Lysozymetm1M-GFP; “LysM-gfp”): NIAID repository, Taconic Farms, Cat#000342;
Lyz2gfp/+: NIAID repository, Taconic Farms; Cat#008504.
MaFIA (C57BL/6-Tg(Csf1r-EGFP-NGFR/FKBP1A/TNFRSF6)2Bck/J: The Jackson Laboratories; Cat#005070.
hCD68-gfp (C57BL/6-Tg(CD68-EGFP)1Drg/J): The Jackson Laboratories; Cat#026827.
- Lyz2Cre/+ Csf1rDTR/+:
- F1 crossbreed: Lyz2Cre/Cre (“LysM-cre”; B6.129P2-Lyz2tm1(cre)Ifo/J; The Jackson Laboratories; Cat#004781) & Csf1rDTR/DTR (C57BL/6-Tg(Csf1r-HBEGF/mCherry)1Mnz/J; The Jackson Laboratories; Cat#024046).
- Lyz2Cre/+ tdTomfl/+:
- F1 crossbreed: Lyz2Cre/Cre (B6.Cg-Gt(ROSA)26Sortm14(CAG-tdTomato)Hze/J; The Jackson Laboratories; Cat#007914) & tdTomfl/fl (B6N.129P2(B6)-Lyz2tm1(cre)Ifo/J; The Jackson Laboratories; Cat#018956)
Siglec1DTR/+ mice (B6;129-Siglec1<tm1(HBEGF)Mtka>; Cat#RBRC04395; Miyake et al., 2007) were kindly provided by Makoto Tanaka (Tokyo University, Japan) and distributed through Tracy McGaha (University of Toronto, Canada).
Siglec1DTR/+LysZCre/Cre tdTomfl/fl
- Cx3cr1gfp/+ Ccr2rfp/+:
- F1 crossbreed: Cx3cr1gfp/gfp (C57BL/6-CD45a-[KO]CX3CR1-[KI]EGFP; Taconic Farms; Cat#008455) x Ccr2rfp/rfp (B6.129(Cg)-Ccr2tm2.1Ifc/J; The Jackson Laboratories; Cat#017586).
Dmdmdx (C57BL/10ScSn-Dmdmdx/J): The Jackson Laboratories; Cat#001801.
DmdmdxLyz2Cre/+ tdTomfl/+ Siglec1DTR/+
Agertm1.1Arnd (RAGE knockout; RAGE−/−.eGFP) mice were kindly provided by Ann Marie Schmidt (NYU School of medicine, USA). In this mouse line, successful deletion of the RAGE gene results in transcription of eGFP (Constien et al., 2001).
All mice were maintained in specific-pathogen-free conditions at an American Association for Laboratory Animal Care–accredited animal facility at the NIAID (National Institute of Allergy and Infectious Diseases, NIH) and were used under a study protocol approved by NIAID Animal Care and Use Committee (National Institutes of Health, NIH). Mice from Taconic were obtained through a special NIAID contract.
If not otherwise stated, all imaging experiments were performed with 8–12 weeks old mice, and both male and females were used at equal ratios for the studies as they displayed similar immune cell dynamics in vivo.
METHODS DETAILS
Intravital imaging of the peritoneal serosa
See Figure S1A and Movie S1A. Intravital imaging was performed on a Zeiss 710 microscope equipped with a femtosecond-pulsed Chameleon laser (Coherent) and a 20x water immersion objective (NA 1.0, Zeiss). Animals were anesthetized with isoflurane (Baxter; FORANE; Cat#1001936040). To expose the parietal peritoneal serosa, a midline incision of the abdominal skin and peritoneal wall along the linea alba was performed. Using two small sutures (CP Medical; Monomid 5/0 Nylon; Cat#661B), the abdominal wall was carefully laid down and mounted on an 8 × 10 mm plastic base plate using Vetbond (3M; Cat#1469SB). At this point, 5–10 μl of sterile pre-warmed buffer (150 mM NaCl, 3.0 mM K, 1.4 mM Ca, 0.8 mM Mg, 1.0 P, 155 mM Cl; all chemicals were purchased from Sigma-Aldrich; pH 7.4; 34 °C) with inhibitors/vehicles or antibodies were applied topically, before installing a sterilized cover glass (Fisher Scientific; Cat# 12–545-80) flat on top of the exposed serosa. The animal was then transferred to the microscope and kept in a heated imaging chamber. The heater was adjusted so that the serosa was kept at a constant temperature of 36 °C. Animals with damage and/or bleeding due to the surgery were not studied further. Epifluorescence was used to confirm the absence of surgery-related microscopic trauma and to capture signs of premature inflammation such as vascular leakage or neutrophil rolling, in which case the animals were also not used for further experiments.
If inhibitors and/or antibodies were used, an incubation time of 25–30 minutes was added before imaging session was started. Without washing, basal macrophage dynamics were then recorded for 10 minutes prior to laser-induced damage to assess negative effects of treatments on resting activity. Experiments were only continued if macrophages exhibited regular sampling dynamics.
Data were acquired at a resolution of 512 × 512 (16 bit) in stacks of 12 frames each 3 μm apart at a frame rate of 968 ms using ZEN software (Zen 2012; Zeiss). For imaging, the laser was tuned to 930 nm with an output of ca. 80 mW and the following filter cubes were used: FITC/GFP (565DCXR, 525/50; Zeiss), tdTomato/RFP (565DCXR, 575–640; Zeiss), SHG (495DCLP, 447/60; Zeiss). Raw imaging data were processed and analyzed with Imaris (Bitplane). Three-dimensional tracking of cells or macrophage pseudopods was performed using Imaris to generate spatial coordinates of individual objects over time. These data were further used to calculate track displacements in Imaris or distance-time plots using a previously described open-source R script for graphic chemotaxis analysis (Lammermann et al., 2013).
Sterile laser damage
Sterile, necrotic tissue damage was induced using laser pulses to produce lesions ranging from macrolesions (5x zoom with 20x objective; brief (< 1 sec.) two photon laser pulse at ~1140 mW) to single-cell microlesions (35x zoom with 20x objective; brief (< 1 sec.) two photon laser pulse at ~380 mW). See Figure S2D.
Macrolesion: 5x zoom; damage diameter > 60 μm; multicellular damage.
Microlesion: 35x zoom; damage diameter < 20 μm; partial-to-unicellular damage.
RTM dynamics were recorded immediately after the laser pulse for 30 minutes (cloaking dynamics), up to 5 hours (endogenous neutrophil response) or up to 8 hours (endogenous monocyte recruitment). For inhibitor studies (Figure 4), 2–3 microlesions were set each at least 1000 μm apart. For DTR/swarming studies (Figure 3) and long-term imaging experiments (Figure 5), 5–7 microlesions were set each at least 1000 μm apart and the occurrence of swarming versus successful cloaking was recorded. The brief laser pulse coagulates the targeted tissue and causes an unmistakable, bright autofluorescence signal in virtually all imaging channels, which can be recorded over time and used to demark the lesion. Detection of a second harmonic signal was used to identify collagen structures and superficial vessels.
The IVM cloaking experiments presented in this study were performed using LysMgfp/gfp or LysMCre/+ tdTomfl/+ mice. Similar results were obtained using other fluorescent mouse strains such as LysMgfp/+, MaFIA, or hCD68-gfp mice (data not shown).
Intravital imaging of tibialis anterior muscles
A similar technical setup was used for intravital imaging of tibialis anterior muscles as for the peritoneal serosa. In brief, animals were anesthetized with isoflurane, the left leg was immobilized, and a careful incision of the skin and subcutaneous tissues was performed right above the tibialis anterior muscle compartment. The epimysial fascia was carefully removed, a sterilized cover glass was installed, and imaging was performed as described above.
Intravital imaging of deep abdominal muscle tissue
The same technical setup was used to image the muscular tissue of the abdominal wall as for the peritoneal serosa, except for the imaging depth, which was around 60 – 100 μm below the peritoneal lining. Second harmonics signals were used to visualize collagen and muscle fibers, which could readily be identified based on their characteristic striation.
In situ staining of neutrophils for IVM
Gr1-FITC (BioLegend; clone RB6–8C5; Cat#108405) was washed twice in buffer using 10 kDa centrifugal filters (Millipore; Amicon Ultracel-10K; Cat#UFC501024) to remove BSA and sodium azide from the antibody solution. To label neutrophils in situ, ca. 0.5 μg of cleaned antibody in reconstituted in buffer was applied topically. Comparison of both neutrophil (and macrophage) dynamic behavior in the presence or absence of cleaned Gr1-FITC showed no observable difference (Figure S1C). Staining of neutrophils with Ly6G-FITC (Biolegend; clone 1A8; Cat#127605) resulted in identical staining patterns (Figure S1D) but had substantially higher background fluorescence and seemed to interfere with immune cell dynamics.
Particle uptake studies
Mice were treated intravenously with 50 μg of each BSA-AF647 (ThermoFisher; Cat#A34785), 2000 kDa Dextran-Fluorescein (Invitrogen; Cat#D7137), 70 kDa Dextran-Tetramethylrhodamine (Invitrogen; Cat#D1818) and 10 kDa Dextran-Cascade Blue (Invitrogen; Cat# D1976) diluted in 200 μl PBS. All dextrans used were lysine-fixable. Tissues were harvested 14 hours after injection and processed for confocal microscopy as described below.
Inhibitor studies
Macrophages were topically pre-treated with following inhibitors at indicated concentrations:
Apyrase (Sigma-Aldrich; Cat#A6535): H20; 10 U
MRS2578 (Tocris; Cat#2146): DMSO; 10 μM
PSB0739 (Tocris; Cat#3983): H20; 10 μM
Suramin (Sigma-Aldrich; Cat#S2671): H20; 10 μM
5-BDBD (Tocris; Cat#3579): DMSO; 10 μM
PSB12062 (Sigma-Aldrich; Cat#SML0753): DMSO; 10 μM
A438079 (Sigma-Aldrich; Cat#A9736): DMSO; 100 μM
JNJ 47965567 (Tocris; Cat#5299): DMSO; 100 μM
isoPPADS (Tocris; Cat#0683): H20; 100 μM
oxATP (Sigma-Aldrich; Cat#A6779): H20; 50 μM
BzATP (Sigma-Aldrich; Cat#B6396): H20; 50 μM
FP-ZM1 (Tocris; Cat#6237): DMSO; 10 μM
RAGE antagonist peptide (Tocris; Cat#6259): H20; 10 μM
Pertussis toxin (Sigma-Aldrich; Cat#P7208): H20; 0.5 μg/ml
Animals were treated systemically (i.p.-injections) with following inhibitors:
Clopidogrel (Sigma-Aldrich; Cat#C0614): DMSO; 1 mg/kg; 3 consecutive days.
All inhibitors were reconstituted according to the supplier’s instructions and diluted in pre-warmed buffer (see above). Topical incubation volume was kept at a maximum of 10 μl as we found that artificially increasing the interstitial volume with buffer had negative effects on macrophage sampling and cloaking dynamics, likely due to dilution of local growth factors, electrolytes and released DAMPs, respectively. After 20 minutes of incubation, intravital imaging was performed. Macrophage sampling behavior was recorded for 10 minutes, and experiments were only continued if cells displayed normal resting behavior.
2–3 micro-lesions were then induced as described above at a distance of at least 1000 μm between each other. The dynamic response was recorded for 30 minutes after damage induction as most of the naïve or vehicle-treated cloaking dynamic was completed by that time. At least 3 animals were studied per group.
Survival surgery for long-term IVM
For long-term tracking of microlesions, vessel dyes (Dextran-Fluorescein 2000 kDa; Invitrogen; Cat#D7137) were used to identify prominent deep vessel patterns, which functioned as guiding points to map microlesions on a relative x/y-coordinate system. After damage-induction, the peritoneal cavity was closed using sutures and surgical clips, and the studied animals were allowed to wake up and recover. 22 hours later, the same animals were subjected to a second, final intravital imaging session, in which the deep vessels of the peritoneal wall were used to re-locate the lesions. At this time, Gr1-FITC was added to label infiltrating neutrophils in situ.
RTM depletion experiments with CD169-DTR mice
To deplete CD169-expressing RTM, CD169-DTR mice were intraperitoneally injected with vehicle or diphtheria toxin (DT; Sigma-Aldrich; Cat#D0564) every other day for five days in total (10 ng/g body weight; ~200 ng/d per mouse in 50 μl PBS).
Tissue macrophage replacement experiments
Please see Figure S3K for experimental outline. To deplete RTM, circulating monocytes and monocyte precursors, LysM-Cre/Csf1r-DTR mice were treated with DT intraperitoneally for three days (10 ng/g body weight; ~200 ng/day per mouse in 50 μl PBS). On the second day of treatment, 5 × 10⁶ unsorted bone marrow cells of indicated genotypes were adoptively transferred i.v. into macrophage/monocyte-depleted hosts. Eight weeks later, the reconstituted animals displayed a non-random chimerism of repopulating host-and transferred donor-derived macrophages in the tissue, which generated host-or donor-rich areas, suitable to study the cloaking response of different RTM populations within the same tissue (e.g., Figure 4H). This setup also permitted selective depletion of the repopulating host-derived RTM (DTR-positive) by re-treating the animals with DT for three days before intravital imaging. In this case, DTR-negative donor-derived RTM were not affected by the DT, thus creating RTM-rich and RTM-depleted areas within the same tissue (Figure 3F). Where indicated, mice received dextran (10 kDa Dextran-Cascade Blue; ThermoFisher; Cat#D1976) i.v. to label tissue macrophages and confirm depletion of host-RTM on the day prior to the experiment.
Muscle dystrophy model
Mdx mice carry a mutation of the dystrophin gene (x-linked), which results in a mild myopathy starting within the first weeks after birth, characterized by an accumulation of necrotic muscle fibers and inflammatory infiltrates that peak between day 21 and day 28 (Hodgetts et al., 2006). To evaluate the function of RTM prior to recruitment and infiltration of inflammatory cells, we thus focused on time points in which naïve mdx mice are still mostly free of disease (day 16) or start showing histological signs of disease onset (day 18).
To deplete macrophages, mdx mice were injected i.p. with vehicle or anti-CSFR1 antibodies (BioXCell; clone AFS98; Cat#BE0213) starting on day 11 (dose 0.5 mg) and repeated every other day (dose 0.25 mg) until harvest on day 16 or day 18. To specifically deplete CD169-expressing RTM in this model, mdx females were bred with CD169DTR/+LysMCre/CretdTomfl/fl males to generate DTR-positive and -negative LysM-tomato male mdx pups (x-linked). All pups were treated i.p. with DT every other day (10 ng/g body weight) starting at day 7 after birth until harvest on day 16. DTR-expression via PCR and sex was assessed post-mortem.
To deplete neutrophils, mice were additionally treated with anti-Ly6G antibodies (BioXCell; clone 1A8; Cat#BE0075–1) starting on day 15 (dose 0.25 mg) and continued every other day until the end of the experiment on day 18.
One day prior to organ harvest, mice received an i.p. injection of 0.5 % Evans blue solution (50 μl/g body weight; Tocris; Cat#0845). On the day of harvest, animals were euthanized using CO2, tissues were collected, vigorously washed with PBS, fixed in 1 % PFA (EMS; Cat#15710) overnight at 4 °C, and further processed for confocal microscopy. Necrotic areas were measured using Imaris (Bitplane). 3–5 animals were studied per group and the experiments were repeated twice.
Peritonitis model
Mice were treated with 10 mg zymosan A (Sigma-Aldrich; Cat#Z4250) i.p. and peritoneal tissues harvested 12 hours later. Tissues were fixed in 1% PFA overnight and then stained with anti-Ly6G (BioLegend; clone 1A8). Imaris spot function was used for automated cell counting.
Immunofluorescence microscopy
Animals were euthanized with CO2. Shortly thereafter, transcardial perfusion with pre-warmed 4% PFA (EMS; Cat#15710) was performed. Tissues were harvested and post-fixed with 12.5% BD Cytofix/Cytoperm (= 0.5 % formaldehyde; BD Bioscience; Cat#554714) for 1h at RT. Whole tissues were permeabilized with BD Perm/Wash (BD Bioscience; Cat#554723) and stained in BD Perm/Wash at RT overnight with following antibodies: CD34 PE (BioLegend; clone HM34) and CD169 A647 (BioLegend; clone 3D6.112).
Cell sorting and RNA-sequencing
One day prior to the experiment, Cx3cr1gfp/+Ccr2rfp/+ animals received an i.v. injection of 50 μg Dextran-Cascade Blue (Invitrogen; Cat#D1976) to label interstitial phagocytes. On the day of the experiment, mice received 1 μg anti-CD45 (BioLegend; clone 30-F11) intravenously 3 minutes prior to euthanasia in order to label intravascular leukocytes. The peritoneal wall was then carefully removed, spread out in a 6-well plate, and covered with 2.5 ml dissociation buffer: RPMI (Gibco; Cat#11875093); 1% FBS (Gemini; Lot#A20G001; Cat#100–106); 250 μg/ml Liberase TL (Sigma-Aldrich; Cat#5401020001); 100 μg/ml DNAse II (Sigma-Aldrich; Cat# D8764); 25 μM Z-VAD-FMK (Tocris; Cat#2163); 10 mM HEPES (Gibco; Cat#15630080). After 20 minutes of incubation at 37 °C, dissociation was stopped with ice-cold FACS-buffer: PBS (Gibco; Cat#10010–23; Lot#1943335); 2% FBS, 2 mM EDTA (Quality Biological; Cat#51–027-101). The most superficial tissue layers were gently scraped off the underlying abdominal wall using a plastic cell scraper and forced through a 70 μm cell strainer. Cells were resuspended in buffer containing 25 μM Z-VAD-FMK and stained with antibodies for CD11b (BioLegend; clone M1/70), I-A/I-E (BioLegend; clone M5/114.15.2) and Ly6G (BioLegend; clone 1A8). CD45−CD11b+Ly6G−cells were sorted into Dextran+MHCII−CCR2−CX3CR1−(majority of sessile RTM; 85–90 % of CD11b+Ly6G−cells), MHCII+CCR2+CX3CR1−(migratory tissue monocytes; 10–15 %) and MHCII+CCR2−CX3CR1+ (sessile RTM; 0.5 −1.5 %) populations, directly into 0.5 ml TRIZOL (Invitrogen; Cat#15596026) using a FACS-Aria cell sorter (BD Bioscience).
RNAseq libraries were prepared using the Nugen Ovation SoLo (NuGEN; Cat#0501–32) with ~1 ng total RNA input. Sequencing was performed using Illumina NextSeq V2 reagents (Illumina; Cat#FC-404–2005) using paired end 75 base pair reads. Samples were sequenced to a depth of ~20 million reads. Reads were mapped to the Mus musculus mm10 genome build (UCSC annotation) using Salmon. Salmon-estimated transcripts-per-million (TPM) values were summarized at the gene level using tximport version 1.4.0 and the org.Mm.eg.db database. Data shown in Figure 4B are pooled from three independent biological replicates.
Generation of Planar Sections or Interactive 3D Models (“Data File S1–S3“)
IVM still images were taken on a Zeiss LSM 710 microscope at the Nyquist sampling rate (“optimal” resolution setting in ZEN 2012), and Huygens Professional (18.04; Scientific Volume Imaging) was used for deconvolution at default parameters. 3D surface models were generated in IMARIS (Bitplane) using default parameters. Individual models were exported from IMARIS as wrl-files and imported into MeshLab (ISTI-CNR). To generate x/y/z slices of the 3D models, individual planar sections were computed in MeshLab and exported as wrl-meshes, pseudocolored and assembled as a 3D-model using Photoshop (Adobe), which was then exported as a u3d-file and implemented into a pdf-file using Adobe Acrobat Pro DC. To generate interactive multi-layer 3D models, individual surface models were first simplified in MeshLab for better handling using clustering decimation (at 0.5 %), and exported again as wrl-files. Individual mesh models were imported into Photoshop, assembled, pseudo-colored, exported as u3d-files and inserted into a .pdf-file using Adobe Acrobat Pro DC.
To view and interact with the multi-layer 3D model in the “Data File”, the .pdf-file needs to be opened with Adobe Acrobat Reader (https://get.adobe.com/reader/), as other pdf-viewers (e.g. Preview on macOS) don’t support this function. Once opened, click on the model to activate the animation. If prompted, click on “Trust this document”. If the 3D model is not visible, enable 3D content under “Preferences > 3D & Multimedia > Enable playing of 3D content”. See page 2 of Data File S1–S3 for visual instructions. For further help and troubleshooting, please visit https://helpx.adobe.com/acrobat/using/displaying-3d-models-pdfs.html.
To interact with the model, click next to it and hold to freely rotate (see movie on page 3 of Data File S2 for demonstration). On Mac hold the <option> and <command> keys and use the scroll function of your mouse to zoom in or out (Windows: hold the <Alt> key and scroll). The “Model tree” lists the individual parts of the model. Here you can hide different parts by clicking the box, or make parts transparent by clicking on the part and selecting “Transparent” from the “Options” menu above.
Tissue clearing and whole mount imaging
Mice were sacrificed and immediately perfused with 20 ml 4 % PFA over 15 minutes. Diaphragms were harvested and post-fixed with 0.5 % PFA overnight at 4° C. On next day, tissues were washed extensively with PBS, and subsequently stained with Wheat Germ Agglutinin AF488 (10 μg/ml; ThermoFisher; Cat#W11261) diluted in PBS overnight at room temperature. On next day, excess fluids were removed and tissues were transferred into freshly prepared Ce3D-clearing medium. Ce3D-clearing medium was prepared as previously described (Li et al., 2017). In brief, 4 g Histodenz (Sigma-Aldrich; Cat#D2158) were dissolved in 2.75 ml 40 % N-Methylacetamide (Sigma-Aldrich; Cat#M26305) and 5 μl Triton X-100 (Sigma-Aldrich; Cat#T8787) on a rotator for 2 hours at 37° C. Diaphragms were transferred into the clearing medium and incubated for 2 days on a tube rotator at room temperature. Next, tissues were mounted on glass slides and confocal imaging was performed on an inverted SP8 microscope (Leica Microsystems) using a 20× 0.75NA objective at a 512×512 resolution at 2.5x optical zoom, with voxel size of 0.45 μm in the lateral and 1.5 μm in the axial direction.
Assessment of spontaneous cloaking
Frequency of spontaneous cloaking in diaphragm tissues (= 4.94 per whole diaphragm) was calculated based on confocal imaging data obtained from cleared whole mount diaphragms of five naïve, perfusion-fixed Lyz2Cre/+ tdTomfl/+ mice (mixed sex; 12–16 weeks) with an average whole tissue volume of 105.7 mm3 and an average number of macrophages of 804,582 per diaphragm.
Frequency of spontaneous cloaking in peritoneal tissues (= 2.09 per whole peritoneum) was calculated based on multiphoton imaging data obtained from eight LysMgfp/gfp mice (mixed sex; 10–16 weeks), which, after perfusion-fixation, were prepared as for intravital imaging to avoid artificial damaging of the tissue. As only RTM in the narrow submesothelial space were imaged and counted, the number of cloaking findings was calculated per area of peritoneal tissue (with an average area of 1314 mm2 of the peritoneum lining the abdominal wall and an average of 748.352 submesothelial RTM per abdominal peritoneum), neglecting the deeper muscular tissues.
QUANTIFICATION AND STATISTICAL ANALYSIS
No statistical methods were used to predetermine sample sizes. Statistical analyses were performed with Prism 7 (GraphPad Software). Results are presented as means ± SEM and exact P values are depicted in the figures. Unpaired student’s t-test (two-tailed), or one-way or two-way ANOVA tests were performed to compare two or more groups after data were confirmed to be normally distributed. Where applicable, post-hoc multiple comparison tests were performed (Tukey for pairs, Bonferroni for multiple groups). Paired data from the long-term imaging experiments were analyzed using Wilcoxon matched-pairs signed rank tests.
Supplementary Material
A) Interactive 3D reconstruction of a representative IVM image, showing a leading neutrophil making physical contact with exposed stromal damage and beginning to undergo activation. A second neutrophil is shown scanning the damaged fibroblast without touching the debris and without undergoing activation. Open file with Adobe Acrobat Reader. See Figure S2E.
B) Interactive 3D reconstruction of a representative IVM image, showing a leading neutrophil making physical contact with exposed stromal damage and beginning to undergo activation. A second neutrophil is shown scanning the damaged fibroblast without touching the debris and without undergoing activation. Open file with Adobe Acrobat Reader. See Figure S2F.
C) Intravital visualization of neutrophil (magenta = LysM) swarming dynamics in response to bacteria (white = Salmonella). See Figure S1E.
A) Swarming dynamics of pre-recruited neutrophils (magenta = Gr1) at a macrolesion (grey). See Figure 1A.
B) Pre-recruited leading contact neutrophils (magenta = Gr1) undergo cell death upon contact with tissue debris (grey) and initiate subsequent swarming behavior. See Figure 1B.
C) Leading neutrophil (magenta = LysM) undergoes cell death upon interaction with individual bacterium (white = Salmonella) and initiates subsequent swarming behavior. See Figure S1I.
D) Intravital visualization of pre-recruited neutrophil (magenta = Gr1) swarming at a macrolesion, and the consequent changes in injury size (grey = autofluorescence) and collagen disruption/displacement (orange = second harmonics). See Figure 1D.
E) Visualization of the death of a pre-recruited contact neutrophil (magenta = Gr1) at a laser-induced microlesion (grey). See Figure S2G.
F) Swarming of pre-recruited neutrophils (magenta = LysM) at a macrolesion (grey; top) or a microlesion (grey; bottom). See Figure 1E.
G) Intravital visualization of pre-recruited neutrophil (magenta = Gr1) swarming at a microlesion, and the consequent changes in injury size (grey = autofluorescence) and collagen disruption/displacement (orange = second harmonics). See Figure 1F.
H) Swarming dynamics of endogenously recruited neutrophils (magenta = LysM) at a macrolesion (grey). See Figure 1G.
I) Comparison of representative IVM-derived tracking data of pre-recruited (left) and endogenously recruited (right) neutrophils at a microlesion, respectively. Video starts as soon as neutrophils enter the imaging field. See Figure 1H–1I.
A) Intravital imaging of the peritoneal serosa showing a population of non-migratory resident tissue macrophages (green = LysM), and few mobile cells, likely migratory monocytes. See Figure 2A.
B) Intravital visualization of the resting sampling activity of an individual RTM (green = LysM), and its dynamic response to a sterile tissue injury (bottom; not visible). See Figure 2B.
C) Cloaking dynamics of RTM (green = LysM) responding to a laser-induced microlesion (orange), as well as IVM-derived tracking data of individual pseudopods originating from macrophages in the larger sensing zone (cyan) and closer convergence zone (yellow). See Figure 2C.
A) Dynamics of neutrophils endogenously recruited to microlesions in the presence or absence of cloaking RTM (green = LysM) in CD169-DTR mice treated with vehicle (top) or DT (bottom). Sequences start as soon as neutrophils (magenta = Gr1) enter the imaging field. See Figure 3B.
B) Cloaking by RTM (green = LysM) and endogenous neutrophil response (magenta = LysM-high) at two sequential microlesions close to each other. Lesion 1 was induced 20 minutes before movie starts. See Figure 3E.
A) Dynamic behavior of migratory monocytes (yellow = CCR2) under resting conditions and in response to laser-induced tissue damage. See Figure S4F.
B) Intravital visualization of the dynamic response of migratory CX3CR1+ (blue) or CCR2+ (yellow) monocytes to a macro-lesion in monocyte reporter mice (Cx3cr1gfp/+Ccr2rfp/+) treated with isotype (left) or 1A8 (right) to deplete neutrophils. Breakdown of debris and expansion of the lesion indicate neutrophil swarming activity. See Figure 5E.
Movie S6. Schematic Depiction of the Proposed Mechanism, Related to Figure 5.
A) Representative confocal whole mount image of a Ce3D-cleared diaphragm (ca. ¼ of a whole diaphragm) isolated from naïve LysM-tomato mouse showing spontaneous cloaking under steady state conditions. See Figure 7F.
A) Interactive 3D reconstruction of a representative IVM image, showing an isolated RTM embedded in the stromal tissue network. Open file with Adobe Acrobat Reader.
B) Interactive 3D reconstruction of a representative IVM image, showing RTM cloaking a stromal microlesion. Open file with Adobe Acrobat Reader.
C) Interactive 3D reconstruction of a representative IVM image, showing how cloaking RTM together with various stromal components almost completely cover a microlesion. See video on page 3 for demonstration. Open file with Adobe Acrobat Reader. See Figure 2E.
D) Interactive 3D reconstruction of a representative IVM image, showing computed planar cross sections of the 3D reconstruction of Date File S2C, highlighting the near complete cover of the microlesion by cloaking RTM and stromal components. Open file with Adobe Acrobat Reader. See Figure 2F.
A) Interactive 3D reconstruction of a representative IVM image, showing response of endo-and perimysial RTM to a muscular microlesion. Open file with Adobe Acrobat Reader. See Figure 6D.
B) Interactive 3D reconstruction of a representative IVM image, showing computed planar cross sections of the 3D reconstruction of Data File S3A, showing near complete cover of the muscular microlesion by cloaking RTM and the intact muscular tissue. Open file with Adobe Acrobat Reader. See Figure 6D.
A) Schematic depiction of the experimental setup for imaging the peritoneal serosa. See Movie S1A.
B) 3D-reconstruction of IVM-still images displaying the anatomical structure of the abdominal wall. Grey = collagen (second harmonics); purple = abdominal muscle wall (second harmonics); red = blood vessels (70kDa dextran); yellow area indicates submesothelial space. Voxel size was increased x 2 in z dimension for better visualization. See Movie S1B. Scale bar, 50 μm.
C) Bar graphs showing data obtained from IVM experiments comparing dynamic behavior of LysM+ neutrophils and LysM+ neutrophils labelled in situ with Gr1-FITC. Unpaired t test; n = > 20 cells per condition; means ± SEM. Data representative of 3 independent experiments.
D) IVM-still images showing a representative cluster of pre-elicited neutrophils at a microlesion labelled with Ly6G-AF594 in a LysMgfp/+ mouse. Blue = RTM pre-labelled with dextran; Green = LysM. Data representative of 3 independent experiments. Scale bar, 50 μm.
E) IVM-sequence of RTM and neutrophils (magenta = LysM) responding to Salmonella bacteria (white) topically applied on the peritoneal serosa. Cyan outlines = Neutrophil swarms. Sequence representative of 3 independent experiments. Scale bar, 100 μm. See Movie S2A.
F) Representative (n > 5) IVM-sequence showing a leading neutrophil (magenta = Gr1) undergoing terminal activation upon contact with tissue debris (grey = autofluorescence). Terminal activation pattern indicated by characteristic vesicle expulsion (white arrows) and nuclear uptake of propidium iodide (red; white asterisk). Scale bar, 5 μm.
G) Schematic depicting the terminal activation pattern of a leading neutrophil upon contact with exposed tissue debris.
H) Distance-time plot showing examples of tracks of exploratory (left) vs. swarming dynamics (right) of extravascular neutrophils migrating towards tissue damage (bottom of the graph). Track color = chemotactic index.
I) IVM-sequence showing the death (cyan outline) of a leading neutrophil (magenta = LysM) upon contact with an individual bacterium (magenta; white arrow) and subsequent swarming dynamic of recruited neutrophils. Sequence representative of 3 independent experiments. Scale bar, 15 μm. See Movie S2D.
A) Representative 3D projection of a stromal microlesion in the submesothelial space of the peritoneal wall, highlighting the acellular anatomical structures. Scale bar, 5 μm.
B) IVM-sequence showing a laser-induced microlesion (red = autofluorescence) as corresponding to damage (white arrow) of one individual fibroblast (blue = CD34). White = LysM. Scale bar, 20 μm.
C) Representative (n = 5) IVM-sequence showing a partially laser-damaged stromal cell in higher magnification. Blue = isolated fibroblast (CD34); Orange = Cellular damage. Scale bar, 10 μm.
D) Schematic comparing features of macro-and microlesions.
E) Representative (n = 3) IVM-still images (top = max intensity projection; bottom = 3D surface reconstruction) showing a leading neutrophil (magenta = Gr1) making physical contact with exposed stromal debris (red arrow; orange = autofluorescence) and undergo death. Leading neutrophil in contact with the affected stromal cell (blue = CD34) but not with the exposed debris fails to undergo terminal activation (white arrow). See Data File S1A for interactive 3D model. Scale bar, 20 μm.
F) Representative (n = 3) IVM-still images (top = max intensity projection; bottom = 3D surface reconstruction) showing a leading neutrophil (magenta = Gr1) attempting to make physical contact with stromal debris (orange = autofluorescence) by squeezing a cellular process through a narrow stromal opening (blue = CD34). See Data File S1B for interactive 3D model. Scale bar, 20 μm.
G) Representative (n > 5) IVM-still image showing the death of a leading neutrophil (magenta = Gr1) upon contact with a microlesion (grey). Scale bar, 10 μm. See Movie S2F.
H) Individual cell tracks (top) or their respective displacements (bottom) of pre-recruited neutrophils swarming at a macro-(cyan) or a microlesion (red). Big panels show overlaid tracks or displacements. Yellow circles indicate injuries. Tracking data representative of 3 independent experiments.
I) Representative (n = 3) IVM-sequence (top = max intensity projection; bottom = 3D surface reconstruction) showing swarming of pre-recruited neutrophils (magenta = Gr1) at a stromal microlesion (grey/orange = autofluorescence) and collateral stromal damage indicated by loss of CD34+ fibroblasts (white outline). Scale bar, 10 μm.
J) Individual cell tracks (top) or their respective displacements (bottom) of pre-recruited (magenta) or endogenously recruited neutrophils (green) at a microlesion. Big panels show overlaid tracks or displacements. Yellow circles indicate injuries. Tracking data representative of 3 independent experiments.
A) Representative (n > 5) confocal overview image showing RTM (green = CD169) embedded in a stromal tissue network (blue = CD34). Scale bars, 100 μm (top) and 20 μm (bottom). See Data File S2A for interactive 3D model.
B) Confocal microscopy image showing an individual tissue-resident macrophage after iv-injection of differentially labelled particles. White = CD169; Purple = BSA; Green = 2000 kDa Dextran; Red = 70 kDa Dextran; Blue = 10 kDa dextran. Scale bar, 5 μm.
C) Representative confocal microscopy image of the peritoneum from a Cx3cr1gfp/+Ccr2rfp/−reporter mouse, showing RTM expressing CD169 (white) in contrast to migratory CCR2+ monocytes (red). CX3CR1+ cells account for ca. 1–2 % of all sessile RTM in the submesothelial peritoneum. Scale bar, 20 μm.
D) RTM (blue = LysM) in LysM-tomato CD169-DTR mice before (left) and after RTM-depletion (right). Scale bar, 100 μm. Images representative of > 5 different experiments.
E) Compilation of the different monocyte/macrophage depletion regimens used in this study (right) compared to their respective controls (left). Flow cytometry plots show neutrophil (green) and monocyte (red) populations pre-gated on Singlets+Live+CD45+CD11b+ cells. Microscopy images show CD169 staining of diaphragm and/or peritoneum tissues. Scale bar, 200 μm. Data representative of > 5 different experiments.
F) Bar graphs showing monocyte percentages in peripheral blood upon different depletion regimens. n = 5; means ± SEM.
G) Representative (n = 5) confocal images (top = max intensity projection; bottom = individual spot visualization) showing neutrophils (magenta = Ly6G) recruited into the peritoneal tissues 12 hours after challenge of CD169-DTR mice pre-treated with vehicle (left; green) or DT (right; magenta) with 10 mg zymosan i.p.. Scale bar, 500 μm. Data representative of 2 independent experiments; means ± SEM.
H) Individual cell tracks (top) or their respective displacements (bottom) of endogenously recruited neutrophils at a microlesion in CD169-DTR mice treated with vehicle (green) or DT (magenta). Big panels show overlaid tracks or displacements. Tracking data representative of 5 independent experiments. See Figure 3B.
I) Representative IVM-still image and histogram of GFP intensity (mean fluorescence intensity, MFI) showing how to distinguish LysM-expressing RTM and neutrophils, based on GFP intensity, dextran uptake and in situ anti-Gr1 labelling. Scale bar, 10 μm.
J) Individual track displacements of endogenously recruited neutrophils migrating towards a cloaked (left lesion 1) or an un-cloaked (right lesion 2) microlesion. Tracking data representative of 3 independent experiments. See Movie S4B.
K) Schematic depicting the experimental setup of partially replacing host RTM by adoptively transferring donor bone marrow into a LysMCre/+Csfr1LsL-DTR/+ host after depleting monocytes and macrophages. Successful transfer generates donor/host-chimerism of monocyte-derived RTM in the peripheral tissues.
L) Simplified schematic of the experimental setup for partially replacing host RTM (red) with adoptively transferred bone marrow isolated from LysM-tomato (cyan) or LysM-gfp (yellow) mice.
M) Left: Representative (n = 3) confocal microscopy image showing recovered/replaced RTM populations of host-(red) or donor-derived origin (yellow & cyan) after RTM-depletion and adoptive monocyte/precursor transfer as described in (B). Scale bar, 300 μm. Right: IVM-still image of donor-derived RTM cloaking a microlesion after adoptive transfer. Scale bar, 20 μm.
N) Schematic of the experimental setup for partially replacing host RTM with adoptively transferred bone marrow isolated from LysM-tomato animals to create chimerism of DTR-positive (host) and DTR-negative (donor) RTM. Subsequent DT-retreatment then generates RTM-rich and -depleted areas within the same tissue. See Figure 3F.
O) IVM-still images after DT-retreatment on day 56 after adoptive monocyte transfer as described in (D). Red color indicates dextran-uptake by remaining donor-derived RTM (green = LysM) after DT-retreatment. Scale bar, 30 μm. Data representative of 3 independent experiments. See Figure 3F.
P) Schematic depicting the relationship between macrophage density, size and lesion count, and the likelihood of neutrophil swarming versus successful cloaking.
A) Schematic mean square displacement plots illustrating the different modes of movement (blue = targeted; magenta = confined) depicted in Figure 4A and 4F.
B) Schematic depicting the biphasic dynamic cloaking response: an initial “sensing” phase comprises the activation on macrophages within 200 – 250 μm of a lesion, which is subsequently followed by “convergence” of pseudopods around the damage. See Movie S3C and compare with Figure 2C.
C) Representative (n = 3 with 2–3 microlesions per experiment) IVM-still images showing peritoneal tissue 30 minutes after damage induction in RAGE−/−.eGFP mice. Successful RAGE-deletion results in strong eGFP expression in all RAGE-expressing immune and non-immune cells. eGFP-signal in RTM was isolated by staining for CD88 on macrophages in situ. Scale bar, 20 μm. White circle mark un-cloaked parts of the damage.
D) Schematic of the experimental setup for partially replacing host RTM with adoptively transferred bone marrow isolated from wild-type LysM-reporter (RAGE+/+) or RAGE-deficient (RAGE−/−.eGFP) mice to create chimerism of RAGE+/+ and RAGE −/−RTM within the same tissue. See Figure 4H–4I.
E) Relative recruitment dynamics of endogenous neutrophils (magenta) and monocytes (blue) to macrolesions. Data pooled from 3 independent experiments.
F) IVM-sequence of the dynamic behavior of CCR2+ migratory monocytes (yellow; white tracking lines) under resting conditions (1) and in response to a microlesion (2; yellow outline). Data representative of 3 independent experiments. Scale bar, 20 μm. See Movie S5A.
A) Representative (n = 3 for each tissue) confocal images showing RTM (green = LysM) in the liver capsule, pericardium and diaphragm tissue. Scale bar, 100 μm. Sagittal section of a mouse brain with focus on microglia (green = CX3CR1-gfp) in the cortical region. Scale bars, 1000 μm (whole brain) and 500 μm (top).
B) Bar graphs showing representative (n = 3 for each tissue) cell-cell-distance between RTM or migratory monocytes or peritoneal stroma cells. Two-way ANOVA; means ± SEM.
C) Bar graphs showing representative (n = 3 for each tissue) Nearest-Neighbor-Index NNI for the different RTM populations in various tissues or migratory monocytes or peritoneal stroma cells. An NNI > 1 indicates uniform distribution; NNI < 1 indicates clustered distribution; NNI = 1 indicates random distribution. Two-way ANOVA; means ± SEM.
D) Representative IVM-sequence (top = max intensity projection; bottom = 3D surface reconstruction) showing laser-induced partial damage (orange = autofluorescence) of a myocyte (purple = second harmonics). Scale bar, 10 μm.
E) Representative IVM-sequence (top = max intensity projection; bottom = single slice through plane of damage) showing characteristic morphological changes after partial laser-induced damage (orange = autofluorescence) of a myocyte (eCFP) in neutrophil-depleted (1A8) CAG-eCFP-reporter mice. Red arrow indicates lesion with local loss of striation and CFP signal. Yellow arrows indicate local swelling. White arrows show local emergence of longitudinal striation in damaged area. Scale bars, 50 μm (top) and 20 μm (bottom and right).
F) Representative IVM-sequence (top = max intensity projection; bottom = 3D surface reconstruction) showing pre-recruited neutrophils (magenta = Gr1) swarming at a partially damaged myocyte (purple = second harmonics) microlesion (orange = autofluorescence). Red arrows and white outline show ruptured muscle fibre. Scale bar, 20 μm. Data representative of 3 independent experiments.
G) Schematic explaining the measurement of the distance between the centre of the nucleus and the tip of the furthest pseudopod of cloaking (left) versus resting macrophages (right). Scale bars, 20 μm. Left graph shows nucleus-pseudopod distances of resting RTM versus RTM cloaking a stromal or muscular lesion or in young mdx mice (day 14). Unpaired t test; means ± SEM. Middle graph shows paired average nucleus-pseudopod distances from 3 independent experiments for each condition. Paired t test; means ± SEM. Right graph shows average nucleus-pseudopod (N\P) distance ratios of cloaking (green) versus non-cloaking (white) macrophages.
H) Representative confocal microscopy image showing close association of infiltrating neutrophils (magenta = Ly6G) with necrotic muscle fibers (blue = Evans blue staining of necrotic tissue) in mdx mice at day 18 after birth. Scale bar, 10 μm.
I) Representative images of diaphragm whole mounts from mdx mice on day 16 after birth, treated with isotype (left) or αCSF1R (right). Arrows indicate necrotic tissues (orange-to-white = Evans blue staining of necrotic tissue). Scale bar, 1000 μm. N = 5 mice per group. See Figure 7B.
J) Representative images of diaphragm whole mounts from mdx mice on day 18 after birth, treated with isotype (left) or αCSF1R (right). Arrows indicate necrotic tissues (orange-to-white = Evans blue staining of necrotic tissue). Scale bar, 1000 μm. N = 5 mice per group. See Figure 7B.
K) Representative image of diaphragm whole mount from mdx mice on day 18 after birth treated with αLy6G and αCSF1R. Arrows indicate necrotic tissues (orange-to-white = Evans blue staining of necrotic tissue). Scale bar, 1000 μm. N = 3 mice per group. See Figure 7B.
L) IVM-still image after perfusion fixation showing spontaneously cloaking RTM (green = LysM) in naïve, unchallenged mice. Scale bar, 30 μm.
M) Representative images (n = 3) of peritoneal tissues from adult CD169-DTR mice after long-term treatment with DT. Orange-to-white = Evans blue staining of necrotic tissue). Scale bar, 500 μm.
N) Schematic depiction of the proposed mechanism. Left: Sufficient cloaking of microlesions prevents the contact activation of leading neutrophils by blocking physical access to the lesion and removal of pro-inflammatory debris, thereby preventing the initiation of swarming and inflammation. Right: Insufficient cloaking allows the leading neutrophil to make physical contact with the debris, undergo terminal activation and inflammatory cell death, which subsequently recruits and activates more neutrophils, and initiates neutrophil swarming. See also Movie S6.
A) Schematic depiction of the experimental setup for imaging the peritoneal serosa. See Figure S1A.
B) 3D surface reconstruction of anatomical structures of the visceral abdominal wall. See Figure S1B.
KEY RESOURCE TABLE
| REAGENT or RESOURCE | SOURCE | IDENTIFIER |
|---|---|---|
| Antibodies | ||
| Rat anti-mouse I-A/I-E Alexa Fluor 647; clone M5/114.15.2 | BioLegend | Cat#107617 |
| Rat anti-mouse/human CD11b Brilliant Violet 510; clone M1/70 | BioLegend | Cat#101245 |
| Rat anti-mouse CD45 Alexa Fluor 700; clone 30-F11 | BioLegend | Cat#103127 |
| Rat anti-mouse CD169 Alexa Fluor 647; clone 3D6.112 | BioLegend | Cat#142407 |
| Rat anti-mouse CD34 PE; clone HM34 | BioLegend | Cat#128609 |
| Rat anti-mouse Ly6G; clone 1A8 | BioXCell | Cat#BE0075–1 |
| Rat anti-mouse CSFR1; clone AFS98 | BioXCell | Cat#BE0213 |
| Rat anti-mouse Ly-6G FITC; clone 1A8 | BioLegend | Cat#127605 |
| Rat anti-mouse Ly-6G Alexa Fluor 647; clone 1A8 | BioLegend | Cat#127621 |
| Rat anti-mouse Ly-6G/Ly-6C (Gr-1) FITC; clone RB6–8C5 | BioLegend | Cat#108405 |
| Chemicals, Peptides, and Recombinant Proteins | ||
| N-Methylacetamide | Sigma-Aldrich | Cat#M26305 |
| Triton X-100 | Sigma-Aldrich | Cat#T8787 |
| Histodenz | Sigma-Aldrich | Cat#D2158 |
| 16% Paraformaldehyde (formaldehyde) aqueous solution | EMS | Cat#15710 |
| TRIzol Reagent | Invitrogen | Cat#15596026 |
| EDTA (0.5M), pH 8.0 | Quality Biological | Cat#351–027-101 |
| FBS: GemCell™ fetal bovine serum | Gemini | Cat#100–106 Lot# A20G001 |
| Z-VAD-FMK | Tocris | Cat#2163 |
| PBS, pH 7.4 | Gibco | Cat#10010–23 |
| HEPES (1M) | Gibco | Cat#15630080 |
| DNAse II: Deoxyribonuclease II from bovine spleen Type V | Sigma-Aldrich | Cat#D8764 |
| Liberase TL Research Grade low Thermolysin | Sigma-Aldrich | Cat#5401020001 |
| RPMI 1640 Medium | Gibco | Cat#11875093 |
| Dextran-Cascade Blue; 10 kDa | Invitrogen | Cat#D1976 |
| Dextran-Fluorescein; 2000 kDa | Invitrogen | Cat#D7137 |
| Dextran-Tetramethylrhodamine; 70 kDa | Invitrogen | Cat#D1818 |
| BSA: Albumin from Bovine Serum (BSA), Alexa Fluor 647 | ThermoFisher | Cat#A34785 |
| BD Perm/Wash Buffer | BD Bioscience | Cat#554723 |
| BD Cytofix/Cytoperm Fixation/Permeabilization Solution Kit | BD Bioscience | Cat#554714 |
| Zymosan: Zymosan A from Saccharomyces cerevisiae | Sigma-Aldrich | Cat#Z4250 |
| Evans Blue: Evans Blue tetrasodium salt | Tocris | Cat#0845 |
| DT: Diphtheria Toxin from Corynebacterium diphtheriae | Sigma-Aldrich | Cat#D0564 |
| Clopidogrel: (±) Clopidogrel hydrogensulfate | Sigma-Aldrich | Cat#C0614 |
| PT: Pertussis toxin from Bordetella pertussis | Sigma-Aldrich | Cat#P7208 |
| RAP: RAGE antagonist peptide | Tocris | Cat#6259 |
| FPS-ZM1 | Tocris | Cat#6237 |
| BzATP: 2’(3’)-O-(4-Benzoylbenzoyl)adenosine 5’-triphosphate triethylammonium salt | Sigma-Aldrich | Cat#B6396 |
| oxATP: Adenosine 5′-triphosphate, periodate oxidized sodium salt | Sigma-Aldrich | Cat#A6779 |
| isoPPADS: iso-PPADS tetrasodium salt | Tocris | Cat#0683 |
| JNJ 47965567 | Tocris | Cat#5299 |
| A438079 hydrochloride hydrate | Sigma-Aldrich | Cat#A9736 |
| PSB12062 | Sigma-Aldrich | Cat#SML0753 |
| 5-BDBD | Tocris | Cat#3579 |
| Suramin: Suramin sodium salt | Sigma-Aldrich | Cat#S2671 |
| PSB0739 | Tocris | Cat#3983 |
| MRS2578 | Tocris | Cat#2146 |
| Apyrase: Apyrase from potatoes | Sigma-Aldrich | Cat#A6535 |
| Forane (isoflurane, USP) | Baxter | Cat#1001936040 |
| Wheat Germ Agglutinin Alexa Fluor 488 | ThermoFisher | Cat#W11261 |
| Sodium chloride | Sigma-Aldrich | S5886 |
| Potassium chloride | Sigma-Aldrich | P9333 |
| Calcium chloride | Sigma-Aldrich | C5670 |
| Magnesium Chloride | Sigma-Aldrich | M4880 |
| Critical Commercial Assays | ||
| Nugen Ovation SoLo RNA-Seq System | NuGEN | Cat#0501–32 |
| Illumina NextSeq 500 High Output v2 Kit | Illumina | Cat#FC-404–2005 |
| Amicon Ultracel-10K | Milipore | Cat#UFC501024 |
| Deposited Data | ||
| RNAseq data in this paper | NCBI GEO | CGSE119870 |
| Experimental Models: Organisms/Strains | ||
| LysM-gfp: C57BL/6-Lysozymetm1M-GFP; homozygous | Taconic Farms | Cat#000342 |
| LysM-gfp het: C57BL/6NTac-Lysozymetm1M-GFP; heterozygous | Taconic Farms | Cat#008504 |
| MaFIA: C57BL/6-Tg(Csf1r-EGFP-NGFR/FKBP1A/TNFRSF6 | The Jackson Laboratories | Cat#005070 |
| CD68-gfp: C57BL/6-Tg(CD68-EGFP)1Drg/J | The Jackson Laboratories | Cat#026827 |
| LysMcre: B6.129P2-Lyz2tm1(cre)Ifo/J | The Jackson Laboratories | Cat#004781 |
| Csf1r-DTR: C57BL/6-Tg(Csf1r-HBEGF/mCherry)1Mnz/J | The Jackson Laboratories | Cat#024046 |
| tdTom: B6.Cg-Gt(ROSA)26Sortm14(CAG-tdTomato)Hze/J | The Jackson Laboratories | Cat#007914 |
| LysMcre: B6N.129P2(B6)-Lyz2tm1(cre)Ifo/J | The Jackson Laboratories | Cat#018956 |
| CD169-DTR: B6;129-Siglec1<tm1(HBEGF)Mtka | Developed by Makoto Tanaka (Miyake et al., 2007; Tokyo University, Tokyo, Japan); distributed through RIKEN BRC (Tokyo, Japan); provided by Tracy McGaha (University of Toronto, Toronto, Canada); MTA with RIKEN in place. | Cat#RBRC04395 |
| CX3CR1-gfp: C57BL/6-CD45a-[KO]CX3CR1-[KI]EGFP | Taconic Farms | Cat#008455 |
| CCR2-rfp: B6.129(Cg)-Ccr2tm2.1Ifc/J | The Jackson Laboratories | Cat#017586 |
| Mdx: C57BL/10ScSn-Dmdmdx/J | The Jackson Laboratories | Cat#001801 |
| RAGE−/− or RAGE−/−.eGFP: Agertm1.1Arnd | Developed by Bernd Arnold (Constien et al., 2001; German Cancer Research Center, Heidelberg, Germany); provided by Ann Marie Schmidt (NYU School of medicine, New York, USA); MTA with NYU in place. | RRID:MGI:3694549 |
| Software and Algorithms | ||
| Leica Application Suite X (LAS X) | Leica Microsystems | RRID:SCR_013673 |
| ZEN Digital Imaging for Light Microscopy, ZEN 2012 | Zeiss | RRID:SCR_013672 |
| Huygens Professional, version 18.04 | Scientific Volume Imaging | RRID:SCR_014237 |
| Imaris, versions 8.6–9.3 | Bitplane | RRID:SCR_007370 |
| GraphPad Prism, version 7 | GraphPad Software | RRID:SCR_002798 |
| R Project for Statistical Computing, version 3.5.1 | https://cran.r-project.org/ | RRID:SCR_001905 |
| MeshLab, version 2016.12 | ISTI-CNR; http://www.meshlab.net/ | N/A |
| Adobe Photoshop CC 2018–2019 | Adobe | RRID:SCR_014199 |
| Adobe Illustrator CC 2018–2019 | Adobe | RRID:SCR_010279) |
| Adobe Premiere Pro CC 2018–2019 | Adobe | N/A |
| Adobe After Effects CC 2018–2019 | Adobe | N/A |
| Adobe Media Encoder CC 2018–2019 | Adobe | N/A |
| Adobe Acrobat Pro DC | Adobe | N/A |
| Salmon, version 0.11.3 | Developed by Carl Kingsford (Carnegie Mellon University, Pittsburgh, USA); https://github.com/COMBINE-lab/salmon | N/A |
| Tximport, version 1.4.0 | Developed by Mark Robinson (University of Zurich, Switzerland); https://bioconductor.org/packages/release/bioc/html/tximport.html | RRID:SCR_016752 |
| org.Mm.eg.db database, version 3.4.1 | Developed by Marc Carlson (Fred Hutchinson Research Center, Seattle, USA); https://bioconductor.org/packages/release/data/annotation/html/org.Mm.eg.db.html | N/A |
| Other | ||
| Vetbond | 3M | Cat#1469SB |
| Monomid 5/0 Nylon | CP Medical | Cat#661B |
| Fisherbrand Cover Glasses: Circles | Fisher Scientific | Cat#12–545-80 |
ACKNOWLEDGEMENT
We are grateful to M. Tanaka and T. McGaha for providing CD169-DTR mice, and A.M. Schmidt for providing RAGE mice.
We thank the members of the R.N.G. laboratory and the Laboratory of Immune System Biology (LISB) for comments and discussions, and A. Rümenapf for proofreading. This work was supported by the Intramural Research Program of National Institute of Allergy and Infectious Diseases, NIH. S.U. received a stipend from the Deutsche Forschungsgemeinschaft DFG (UD 84/1–1).
Footnotes
REFERENCES
- Afonso PV, Janka-Junttila M, Lee YJ, McCann CP, Oliver CM, Aamer KA, Losert W, Cicerone MT, and Parent CA (2012). LTB4 is a signal-relay molecule during neutrophil chemotaxis. Dev Cell 22, 1079–1091. [DOI] [PMC free article] [PubMed] [Google Scholar]
- Amit I, Winter DR, and Jung S (2016). The role of the local environment and epigenetics in shaping macrophage identity and their effect on tissue homeostasis. Nat Immunol 17, 18–25. [DOI] [PubMed] [Google Scholar]
- Arnold L, Henry A, Poron F, Baba-Amer Y, van Rooijen N, Plonquet A, Gherardi RK, and Chazaud B (2007). Inflammatory monocytes recruited after skeletal muscle injury switch into antiinflammatory macrophages to support myogenesis. J Exp Med 204, 1057–1069. [DOI] [PMC free article] [PubMed] [Google Scholar]
- Brandes M, Klauschen F, Kuchen S, and Germain RN (2013). A systems analysis identifies a feedforward inflammatory circuit leading to lethal influenza infection. Cell 154, 197–212. [DOI] [PMC free article] [PubMed] [Google Scholar]
- Cekic C, and Linden J (2016). Purinergic regulation of the immune system. Nat Rev Immunol 16, 177–192. [DOI] [PubMed] [Google Scholar]
- Constien R, Forde A, Liliensiek B, Grone HJ, Nawroth P, Hammerling G, and Arnold B (2001). Characterization of a novel EGFP reporter mouse to monitor Cre recombination as demonstrated by a Tie2 Cre mouse line. Genesis 30, 36–44. [DOI] [PubMed] [Google Scholar]
- Dal-Secco D, Wang J, Zeng Z, Kolaczkowska E, Wong CH, Petri B, Ransohoff RM, Charo IF, Jenne CN, and Kubes P (2015). A dynamic spectrum of monocytes arising from the in situ reprogramming of CCR2+ monocytes at a site of sterile injury. J Exp Med 212, 447–456. [DOI] [PMC free article] [PubMed] [Google Scholar]
- Davalos D, Grutzendler J, Yang G, Kim JV, Zuo Y, Jung S, Littman DR, Dustin ML, and Gan WB (2005). ATP mediates rapid microglial response to local brain injury in vivo. Nat Neurosci 8, 752–758. [DOI] [PubMed] [Google Scholar]
- Degryse B, Bonaldi T, Scaffidi P, Muller S, Resnati M, Sanvito F, Arrigoni G, and Bianchi ME (2001). The high mobility group (HMG) boxes of the nuclear protein HMG1 induce chemotaxis and cytoskeleton reorganization in rat smooth muscle cells. J Cell Biol 152, 1197–1206. [DOI] [PMC free article] [PubMed] [Google Scholar]
- Ensan S, Li A, Besla R, Degousee N, Cosme J, Roufaiel M, Shikatani EA, El-Maklizi M, Williams JW, Robins L, et al. (2016). Self-renewing resident arterial macrophages arise from embryonic CX3CR1(+) precursors and circulating monocytes immediately after birth. Nat Immunol 17, 159–168. [DOI] [PubMed] [Google Scholar]
- Franklin RA, Liao W, Sarkar A, Kim MV, Bivona MR, Liu K, Pamer EG, and Li MO (2014). The cellular and molecular origin of tumor-associated macrophages. Science 344, 921–925. [DOI] [PMC free article] [PubMed] [Google Scholar]
- Fullerton JN, and Gilroy DW (2016). Resolution of inflammation: a new therapeutic frontier. Nat Rev Drug Discov 15, 551–567. [DOI] [PubMed] [Google Scholar]
- Geissmann F, Manz MG, Jung S, Sieweke MH, Merad M, and Ley K (2010). Development of monocytes, macrophages, and dendritic cells. Science 327, 656–661. [DOI] [PMC free article] [PubMed] [Google Scholar]
- Ginhoux F, and Guilliams M (2016). Tissue-Resident Macrophage Ontogeny and Homeostasis. Immunity 44, 439–449. [DOI] [PubMed] [Google Scholar]
- Gordon S, and Martinez-Pomares L (2017). Physiological roles of macrophages. Pflugers Arch 469, 365–374. [DOI] [PMC free article] [PubMed] [Google Scholar]
- Gosselin D, Link VM, Romanoski CE, Fonseca GJ, Eichenfield DZ, Spann NJ, Stender JD, Chun HB, Garner H, Geissmann F, et al. (2014). Environment drives selection and function of enhancers controlling tissue-specific macrophage identities. Cell 159, 1327–1340. [DOI] [PMC free article] [PubMed] [Google Scholar]
- Haynes SE, Hollopeter G, Yang G, Kurpius D, Dailey ME, Gan WB, and Julius D (2006). The P2Y12 receptor regulates microglial activation by extracellular nucleotides. Nat Neurosci 9, 1512–1519. [DOI] [PubMed] [Google Scholar]
- Hodgetts S, Radley H, Davies M, and Grounds MD (2006). Reduced necrosis of dystrophic muscle by depletion of host neutrophils, or blocking TNFalpha function with Etanercept in mdx mice. Neuromuscul Disord 16, 591–602. [DOI] [PubMed] [Google Scholar]
- Huebener P, Pradere JP, Hernandez C, Gwak GY, Caviglia JM, Mu X, Loike JD, Jenkins RE, Antoine DJ, and Schwabe RF (2015). The HMGB1/RAGE axis triggers neutrophil-mediated injury amplification following necrosis. J Clin Invest 125, 539–550. [DOI] [PMC free article] [PubMed] [Google Scholar]
- Jakubzick C, Gautier EL, Gibbings SL, Sojka DK, Schlitzer A, Johnson TE, Ivanov S, Duan Q, Bala S, Condon T, et al. (2013). Minimal differentiation of classical monocytes as they survey steady-state tissues and transport antigen to lymph nodes. Immunity 39, 599–610. [DOI] [PMC free article] [PubMed] [Google Scholar]
- Jung CK, Keppler K, Steinbach S, Blazquez-Llorca L, and Herms J (2015). Fibrillar amyloid plaque formation precedes microglial activation. PLoS One 10, e0119768. [DOI] [PMC free article] [PubMed] [Google Scholar]
- Lammermann T, Afonso PV, Angermann BR, Wang JM, Kastenmuller W, Parent CA, and Germain RN (2013). Neutrophil swarms require LTB4 and integrins at sites of cell death in vivo. Nature 498, 371–375. [DOI] [PMC free article] [PubMed] [Google Scholar]
- Li W, Germain RN, and Gerner MY (2017). Multiplex, quantitative cellular analysis in large tissue volumes with clearing-enhanced 3D microscopy (Ce3D). Proc Natl Acad Sci U S A 114, E7321–E7330. [DOI] [PMC free article] [PubMed] [Google Scholar]
- Liliensiek B, Weigand MA, Bierhaus A, Nicklas W, Kasper M, Hofer S, Plachky J, Grone HJ, Kurschus FC, Schmidt AM, et al. (2004). Receptor for advanced glycation end products (RAGE) regulates sepsis but not the adaptive immune response. J Clin Invest 113, 1641–1650. [DOI] [PMC free article] [PubMed] [Google Scholar]
- Mass E, Ballesteros I, Farlik M, Halbritter F, Gunther P, Crozet L, Jacome-Galarza CE, Handler K, Klughammer J, Kobayashi Y, et al. (2016). Specification of tissue-resident macrophages during organogenesis. Science 353. [DOI] [PMC free article] [PubMed] [Google Scholar]
- Medzhitov R (2008). Origin and physiological roles of inflammation. Nature 454, 428–435. [DOI] [PubMed] [Google Scholar]
- Miyake Y, Asano K, Kaise H, Uemura M, Nakayama M, and Tanaka M (2007). Critical role of macrophages in the marginal zone in the suppression of immune responses to apoptotic cell-associated antigens. J Clin Invest 117, 2268–2278. [DOI] [PMC free article] [PubMed] [Google Scholar]
- Mojumdar K, Liang F, Giordano C, Lemaire C, Danialou G, Okazaki T, Bourdon J, Rafei M, Galipeau J, Divangahi M, et al. (2014). Inflammatory monocytes promote progression of Duchenne muscular dystrophy and can be therapeutically targeted via CCR2. EMBO Mol Med 6, 1476–1492. [DOI] [PMC free article] [PubMed] [Google Scholar]
- Molawi K, Wolf Y, Kandalla PK, Favret J, Hagemeyer N, Frenzel K, Pinto AR, Klapproth K, Henri S, Malissen B, et al. (2014). Progressive replacement of embryo-derived cardiac macrophages with age. J Exp Med 211, 2151–2158. [DOI] [PMC free article] [PubMed] [Google Scholar]
- Murray PJ (2017). Macrophage Polarization. Annu Rev Physiol 79, 541–566. [DOI] [PubMed] [Google Scholar]
- Murray PJ (2018). Immune regulation by monocytes. Semin Immunol 35, 12–18. [DOI] [PubMed] [Google Scholar]
- Ng LG, Qin JS, Roediger B, Wang Y, Jain R, Cavanagh LL, Smith AL, Jones CA, de Veer M, Grimbaldeston MA, et al. (2011). Visualizing the neutrophil response to sterile tissue injury in mouse dermis reveals a three-phase cascade of events. J Invest Dermatol 131, 2058–2068. [DOI] [PubMed] [Google Scholar]
- Nicolas-Avila JA, Adrover JM, and Hidalgo A (2017). Neutrophils in Homeostasis, Immunity, and Cancer. Immunity 46, 15–28. [DOI] [PubMed] [Google Scholar]
- Okabe Y, and Medzhitov R (2014). Tissue-specific signals control reversible program of localization and functional polarization of macrophages. Cell 157, 832–844. [DOI] [PMC free article] [PubMed] [Google Scholar]
- Okabe Y, and Medzhitov R (2016). Tissue biology perspective on macrophages. Nat Immunol 17, 9–17. [DOI] [PubMed] [Google Scholar]
- Rock KL, Latz E, Ontiveros F, and Kono H (2010). The sterile inflammatory response. Annu Rev Immunol 28, 321–342. [DOI] [PMC free article] [PubMed] [Google Scholar]
- Schreiber HA, Loschko J, Karssemeijer RA, Escolano A, Meredith MM, Mucida D, Guermonprez P, and Nussenzweig MC (2013). Intestinal monocytes and macrophages are required for T cell polarization in response to Citrobacter rodentium. J Exp Med 210, 2025–2039. [DOI] [PMC free article] [PubMed] [Google Scholar]
- Serhan CN, and Savill J (2005). Resolution of inflammation: the beginning programs the end. Nat Immunol 6, 1191–1197. [DOI] [PubMed] [Google Scholar]
- Sicinski P, Geng Y, Ryder-Cook AS, Barnard EA, Darlison MG, and Barnard PJ (1989). The molecular basis of muscular dystrophy in the mdx mouse: a point mutation. Science 244, 1578–1580. [DOI] [PubMed] [Google Scholar]
- Tidball JG (2005). Inflammatory processes in muscle injury and repair. Am J Physiol Regul Integr Comp Physiol 288, R345–353. [DOI] [PubMed] [Google Scholar]
- Uderhardt S, Herrmann M, Oskolkova OV, Aschermann S, Bicker W, Ipseiz N, Sarter K, Frey B, Rothe T, Voll R, et al. (2012). 12/15-lipoxygenase orchestrates the clearance of apoptotic cells and maintains immunologic tolerance. Immunity 36, 834–846. [DOI] [PubMed] [Google Scholar]
- Venereau E, Ceriotti C, and Bianchi ME (2015). DAMPs from Cell Death to New Life. Front Immunol 6, 422. [DOI] [PMC free article] [PubMed] [Google Scholar]
- Weiss SJ (1989). Tissue destruction by neutrophils. N Engl J Med 320, 365–376. [DOI] [PubMed] [Google Scholar]
- Wynn TA, Chawla A, and Pollard JW (2013). Macrophage biology in development, homeostasis and disease. Nature 496, 445–455. [DOI] [PMC free article] [PubMed] [Google Scholar]
Associated Data
This section collects any data citations, data availability statements, or supplementary materials included in this article.
Supplementary Materials
A) Interactive 3D reconstruction of a representative IVM image, showing a leading neutrophil making physical contact with exposed stromal damage and beginning to undergo activation. A second neutrophil is shown scanning the damaged fibroblast without touching the debris and without undergoing activation. Open file with Adobe Acrobat Reader. See Figure S2E.
B) Interactive 3D reconstruction of a representative IVM image, showing a leading neutrophil making physical contact with exposed stromal damage and beginning to undergo activation. A second neutrophil is shown scanning the damaged fibroblast without touching the debris and without undergoing activation. Open file with Adobe Acrobat Reader. See Figure S2F.
C) Intravital visualization of neutrophil (magenta = LysM) swarming dynamics in response to bacteria (white = Salmonella). See Figure S1E.
A) Swarming dynamics of pre-recruited neutrophils (magenta = Gr1) at a macrolesion (grey). See Figure 1A.
B) Pre-recruited leading contact neutrophils (magenta = Gr1) undergo cell death upon contact with tissue debris (grey) and initiate subsequent swarming behavior. See Figure 1B.
C) Leading neutrophil (magenta = LysM) undergoes cell death upon interaction with individual bacterium (white = Salmonella) and initiates subsequent swarming behavior. See Figure S1I.
D) Intravital visualization of pre-recruited neutrophil (magenta = Gr1) swarming at a macrolesion, and the consequent changes in injury size (grey = autofluorescence) and collagen disruption/displacement (orange = second harmonics). See Figure 1D.
E) Visualization of the death of a pre-recruited contact neutrophil (magenta = Gr1) at a laser-induced microlesion (grey). See Figure S2G.
F) Swarming of pre-recruited neutrophils (magenta = LysM) at a macrolesion (grey; top) or a microlesion (grey; bottom). See Figure 1E.
G) Intravital visualization of pre-recruited neutrophil (magenta = Gr1) swarming at a microlesion, and the consequent changes in injury size (grey = autofluorescence) and collagen disruption/displacement (orange = second harmonics). See Figure 1F.
H) Swarming dynamics of endogenously recruited neutrophils (magenta = LysM) at a macrolesion (grey). See Figure 1G.
I) Comparison of representative IVM-derived tracking data of pre-recruited (left) and endogenously recruited (right) neutrophils at a microlesion, respectively. Video starts as soon as neutrophils enter the imaging field. See Figure 1H–1I.
A) Intravital imaging of the peritoneal serosa showing a population of non-migratory resident tissue macrophages (green = LysM), and few mobile cells, likely migratory monocytes. See Figure 2A.
B) Intravital visualization of the resting sampling activity of an individual RTM (green = LysM), and its dynamic response to a sterile tissue injury (bottom; not visible). See Figure 2B.
C) Cloaking dynamics of RTM (green = LysM) responding to a laser-induced microlesion (orange), as well as IVM-derived tracking data of individual pseudopods originating from macrophages in the larger sensing zone (cyan) and closer convergence zone (yellow). See Figure 2C.
A) Dynamics of neutrophils endogenously recruited to microlesions in the presence or absence of cloaking RTM (green = LysM) in CD169-DTR mice treated with vehicle (top) or DT (bottom). Sequences start as soon as neutrophils (magenta = Gr1) enter the imaging field. See Figure 3B.
B) Cloaking by RTM (green = LysM) and endogenous neutrophil response (magenta = LysM-high) at two sequential microlesions close to each other. Lesion 1 was induced 20 minutes before movie starts. See Figure 3E.
A) Dynamic behavior of migratory monocytes (yellow = CCR2) under resting conditions and in response to laser-induced tissue damage. See Figure S4F.
B) Intravital visualization of the dynamic response of migratory CX3CR1+ (blue) or CCR2+ (yellow) monocytes to a macro-lesion in monocyte reporter mice (Cx3cr1gfp/+Ccr2rfp/+) treated with isotype (left) or 1A8 (right) to deplete neutrophils. Breakdown of debris and expansion of the lesion indicate neutrophil swarming activity. See Figure 5E.
Movie S6. Schematic Depiction of the Proposed Mechanism, Related to Figure 5.
A) Representative confocal whole mount image of a Ce3D-cleared diaphragm (ca. ¼ of a whole diaphragm) isolated from naïve LysM-tomato mouse showing spontaneous cloaking under steady state conditions. See Figure 7F.
A) Interactive 3D reconstruction of a representative IVM image, showing an isolated RTM embedded in the stromal tissue network. Open file with Adobe Acrobat Reader.
B) Interactive 3D reconstruction of a representative IVM image, showing RTM cloaking a stromal microlesion. Open file with Adobe Acrobat Reader.
C) Interactive 3D reconstruction of a representative IVM image, showing how cloaking RTM together with various stromal components almost completely cover a microlesion. See video on page 3 for demonstration. Open file with Adobe Acrobat Reader. See Figure 2E.
D) Interactive 3D reconstruction of a representative IVM image, showing computed planar cross sections of the 3D reconstruction of Date File S2C, highlighting the near complete cover of the microlesion by cloaking RTM and stromal components. Open file with Adobe Acrobat Reader. See Figure 2F.
A) Interactive 3D reconstruction of a representative IVM image, showing response of endo-and perimysial RTM to a muscular microlesion. Open file with Adobe Acrobat Reader. See Figure 6D.
B) Interactive 3D reconstruction of a representative IVM image, showing computed planar cross sections of the 3D reconstruction of Data File S3A, showing near complete cover of the muscular microlesion by cloaking RTM and the intact muscular tissue. Open file with Adobe Acrobat Reader. See Figure 6D.
A) Schematic depiction of the experimental setup for imaging the peritoneal serosa. See Movie S1A.
B) 3D-reconstruction of IVM-still images displaying the anatomical structure of the abdominal wall. Grey = collagen (second harmonics); purple = abdominal muscle wall (second harmonics); red = blood vessels (70kDa dextran); yellow area indicates submesothelial space. Voxel size was increased x 2 in z dimension for better visualization. See Movie S1B. Scale bar, 50 μm.
C) Bar graphs showing data obtained from IVM experiments comparing dynamic behavior of LysM+ neutrophils and LysM+ neutrophils labelled in situ with Gr1-FITC. Unpaired t test; n = > 20 cells per condition; means ± SEM. Data representative of 3 independent experiments.
D) IVM-still images showing a representative cluster of pre-elicited neutrophils at a microlesion labelled with Ly6G-AF594 in a LysMgfp/+ mouse. Blue = RTM pre-labelled with dextran; Green = LysM. Data representative of 3 independent experiments. Scale bar, 50 μm.
E) IVM-sequence of RTM and neutrophils (magenta = LysM) responding to Salmonella bacteria (white) topically applied on the peritoneal serosa. Cyan outlines = Neutrophil swarms. Sequence representative of 3 independent experiments. Scale bar, 100 μm. See Movie S2A.
F) Representative (n > 5) IVM-sequence showing a leading neutrophil (magenta = Gr1) undergoing terminal activation upon contact with tissue debris (grey = autofluorescence). Terminal activation pattern indicated by characteristic vesicle expulsion (white arrows) and nuclear uptake of propidium iodide (red; white asterisk). Scale bar, 5 μm.
G) Schematic depicting the terminal activation pattern of a leading neutrophil upon contact with exposed tissue debris.
H) Distance-time plot showing examples of tracks of exploratory (left) vs. swarming dynamics (right) of extravascular neutrophils migrating towards tissue damage (bottom of the graph). Track color = chemotactic index.
I) IVM-sequence showing the death (cyan outline) of a leading neutrophil (magenta = LysM) upon contact with an individual bacterium (magenta; white arrow) and subsequent swarming dynamic of recruited neutrophils. Sequence representative of 3 independent experiments. Scale bar, 15 μm. See Movie S2D.
A) Representative 3D projection of a stromal microlesion in the submesothelial space of the peritoneal wall, highlighting the acellular anatomical structures. Scale bar, 5 μm.
B) IVM-sequence showing a laser-induced microlesion (red = autofluorescence) as corresponding to damage (white arrow) of one individual fibroblast (blue = CD34). White = LysM. Scale bar, 20 μm.
C) Representative (n = 5) IVM-sequence showing a partially laser-damaged stromal cell in higher magnification. Blue = isolated fibroblast (CD34); Orange = Cellular damage. Scale bar, 10 μm.
D) Schematic comparing features of macro-and microlesions.
E) Representative (n = 3) IVM-still images (top = max intensity projection; bottom = 3D surface reconstruction) showing a leading neutrophil (magenta = Gr1) making physical contact with exposed stromal debris (red arrow; orange = autofluorescence) and undergo death. Leading neutrophil in contact with the affected stromal cell (blue = CD34) but not with the exposed debris fails to undergo terminal activation (white arrow). See Data File S1A for interactive 3D model. Scale bar, 20 μm.
F) Representative (n = 3) IVM-still images (top = max intensity projection; bottom = 3D surface reconstruction) showing a leading neutrophil (magenta = Gr1) attempting to make physical contact with stromal debris (orange = autofluorescence) by squeezing a cellular process through a narrow stromal opening (blue = CD34). See Data File S1B for interactive 3D model. Scale bar, 20 μm.
G) Representative (n > 5) IVM-still image showing the death of a leading neutrophil (magenta = Gr1) upon contact with a microlesion (grey). Scale bar, 10 μm. See Movie S2F.
H) Individual cell tracks (top) or their respective displacements (bottom) of pre-recruited neutrophils swarming at a macro-(cyan) or a microlesion (red). Big panels show overlaid tracks or displacements. Yellow circles indicate injuries. Tracking data representative of 3 independent experiments.
I) Representative (n = 3) IVM-sequence (top = max intensity projection; bottom = 3D surface reconstruction) showing swarming of pre-recruited neutrophils (magenta = Gr1) at a stromal microlesion (grey/orange = autofluorescence) and collateral stromal damage indicated by loss of CD34+ fibroblasts (white outline). Scale bar, 10 μm.
J) Individual cell tracks (top) or their respective displacements (bottom) of pre-recruited (magenta) or endogenously recruited neutrophils (green) at a microlesion. Big panels show overlaid tracks or displacements. Yellow circles indicate injuries. Tracking data representative of 3 independent experiments.
A) Representative (n > 5) confocal overview image showing RTM (green = CD169) embedded in a stromal tissue network (blue = CD34). Scale bars, 100 μm (top) and 20 μm (bottom). See Data File S2A for interactive 3D model.
B) Confocal microscopy image showing an individual tissue-resident macrophage after iv-injection of differentially labelled particles. White = CD169; Purple = BSA; Green = 2000 kDa Dextran; Red = 70 kDa Dextran; Blue = 10 kDa dextran. Scale bar, 5 μm.
C) Representative confocal microscopy image of the peritoneum from a Cx3cr1gfp/+Ccr2rfp/−reporter mouse, showing RTM expressing CD169 (white) in contrast to migratory CCR2+ monocytes (red). CX3CR1+ cells account for ca. 1–2 % of all sessile RTM in the submesothelial peritoneum. Scale bar, 20 μm.
D) RTM (blue = LysM) in LysM-tomato CD169-DTR mice before (left) and after RTM-depletion (right). Scale bar, 100 μm. Images representative of > 5 different experiments.
E) Compilation of the different monocyte/macrophage depletion regimens used in this study (right) compared to their respective controls (left). Flow cytometry plots show neutrophil (green) and monocyte (red) populations pre-gated on Singlets+Live+CD45+CD11b+ cells. Microscopy images show CD169 staining of diaphragm and/or peritoneum tissues. Scale bar, 200 μm. Data representative of > 5 different experiments.
F) Bar graphs showing monocyte percentages in peripheral blood upon different depletion regimens. n = 5; means ± SEM.
G) Representative (n = 5) confocal images (top = max intensity projection; bottom = individual spot visualization) showing neutrophils (magenta = Ly6G) recruited into the peritoneal tissues 12 hours after challenge of CD169-DTR mice pre-treated with vehicle (left; green) or DT (right; magenta) with 10 mg zymosan i.p.. Scale bar, 500 μm. Data representative of 2 independent experiments; means ± SEM.
H) Individual cell tracks (top) or their respective displacements (bottom) of endogenously recruited neutrophils at a microlesion in CD169-DTR mice treated with vehicle (green) or DT (magenta). Big panels show overlaid tracks or displacements. Tracking data representative of 5 independent experiments. See Figure 3B.
I) Representative IVM-still image and histogram of GFP intensity (mean fluorescence intensity, MFI) showing how to distinguish LysM-expressing RTM and neutrophils, based on GFP intensity, dextran uptake and in situ anti-Gr1 labelling. Scale bar, 10 μm.
J) Individual track displacements of endogenously recruited neutrophils migrating towards a cloaked (left lesion 1) or an un-cloaked (right lesion 2) microlesion. Tracking data representative of 3 independent experiments. See Movie S4B.
K) Schematic depicting the experimental setup of partially replacing host RTM by adoptively transferring donor bone marrow into a LysMCre/+Csfr1LsL-DTR/+ host after depleting monocytes and macrophages. Successful transfer generates donor/host-chimerism of monocyte-derived RTM in the peripheral tissues.
L) Simplified schematic of the experimental setup for partially replacing host RTM (red) with adoptively transferred bone marrow isolated from LysM-tomato (cyan) or LysM-gfp (yellow) mice.
M) Left: Representative (n = 3) confocal microscopy image showing recovered/replaced RTM populations of host-(red) or donor-derived origin (yellow & cyan) after RTM-depletion and adoptive monocyte/precursor transfer as described in (B). Scale bar, 300 μm. Right: IVM-still image of donor-derived RTM cloaking a microlesion after adoptive transfer. Scale bar, 20 μm.
N) Schematic of the experimental setup for partially replacing host RTM with adoptively transferred bone marrow isolated from LysM-tomato animals to create chimerism of DTR-positive (host) and DTR-negative (donor) RTM. Subsequent DT-retreatment then generates RTM-rich and -depleted areas within the same tissue. See Figure 3F.
O) IVM-still images after DT-retreatment on day 56 after adoptive monocyte transfer as described in (D). Red color indicates dextran-uptake by remaining donor-derived RTM (green = LysM) after DT-retreatment. Scale bar, 30 μm. Data representative of 3 independent experiments. See Figure 3F.
P) Schematic depicting the relationship between macrophage density, size and lesion count, and the likelihood of neutrophil swarming versus successful cloaking.
A) Schematic mean square displacement plots illustrating the different modes of movement (blue = targeted; magenta = confined) depicted in Figure 4A and 4F.
B) Schematic depicting the biphasic dynamic cloaking response: an initial “sensing” phase comprises the activation on macrophages within 200 – 250 μm of a lesion, which is subsequently followed by “convergence” of pseudopods around the damage. See Movie S3C and compare with Figure 2C.
C) Representative (n = 3 with 2–3 microlesions per experiment) IVM-still images showing peritoneal tissue 30 minutes after damage induction in RAGE−/−.eGFP mice. Successful RAGE-deletion results in strong eGFP expression in all RAGE-expressing immune and non-immune cells. eGFP-signal in RTM was isolated by staining for CD88 on macrophages in situ. Scale bar, 20 μm. White circle mark un-cloaked parts of the damage.
D) Schematic of the experimental setup for partially replacing host RTM with adoptively transferred bone marrow isolated from wild-type LysM-reporter (RAGE+/+) or RAGE-deficient (RAGE−/−.eGFP) mice to create chimerism of RAGE+/+ and RAGE −/−RTM within the same tissue. See Figure 4H–4I.
E) Relative recruitment dynamics of endogenous neutrophils (magenta) and monocytes (blue) to macrolesions. Data pooled from 3 independent experiments.
F) IVM-sequence of the dynamic behavior of CCR2+ migratory monocytes (yellow; white tracking lines) under resting conditions (1) and in response to a microlesion (2; yellow outline). Data representative of 3 independent experiments. Scale bar, 20 μm. See Movie S5A.
A) Representative (n = 3 for each tissue) confocal images showing RTM (green = LysM) in the liver capsule, pericardium and diaphragm tissue. Scale bar, 100 μm. Sagittal section of a mouse brain with focus on microglia (green = CX3CR1-gfp) in the cortical region. Scale bars, 1000 μm (whole brain) and 500 μm (top).
B) Bar graphs showing representative (n = 3 for each tissue) cell-cell-distance between RTM or migratory monocytes or peritoneal stroma cells. Two-way ANOVA; means ± SEM.
C) Bar graphs showing representative (n = 3 for each tissue) Nearest-Neighbor-Index NNI for the different RTM populations in various tissues or migratory monocytes or peritoneal stroma cells. An NNI > 1 indicates uniform distribution; NNI < 1 indicates clustered distribution; NNI = 1 indicates random distribution. Two-way ANOVA; means ± SEM.
D) Representative IVM-sequence (top = max intensity projection; bottom = 3D surface reconstruction) showing laser-induced partial damage (orange = autofluorescence) of a myocyte (purple = second harmonics). Scale bar, 10 μm.
E) Representative IVM-sequence (top = max intensity projection; bottom = single slice through plane of damage) showing characteristic morphological changes after partial laser-induced damage (orange = autofluorescence) of a myocyte (eCFP) in neutrophil-depleted (1A8) CAG-eCFP-reporter mice. Red arrow indicates lesion with local loss of striation and CFP signal. Yellow arrows indicate local swelling. White arrows show local emergence of longitudinal striation in damaged area. Scale bars, 50 μm (top) and 20 μm (bottom and right).
F) Representative IVM-sequence (top = max intensity projection; bottom = 3D surface reconstruction) showing pre-recruited neutrophils (magenta = Gr1) swarming at a partially damaged myocyte (purple = second harmonics) microlesion (orange = autofluorescence). Red arrows and white outline show ruptured muscle fibre. Scale bar, 20 μm. Data representative of 3 independent experiments.
G) Schematic explaining the measurement of the distance between the centre of the nucleus and the tip of the furthest pseudopod of cloaking (left) versus resting macrophages (right). Scale bars, 20 μm. Left graph shows nucleus-pseudopod distances of resting RTM versus RTM cloaking a stromal or muscular lesion or in young mdx mice (day 14). Unpaired t test; means ± SEM. Middle graph shows paired average nucleus-pseudopod distances from 3 independent experiments for each condition. Paired t test; means ± SEM. Right graph shows average nucleus-pseudopod (N\P) distance ratios of cloaking (green) versus non-cloaking (white) macrophages.
H) Representative confocal microscopy image showing close association of infiltrating neutrophils (magenta = Ly6G) with necrotic muscle fibers (blue = Evans blue staining of necrotic tissue) in mdx mice at day 18 after birth. Scale bar, 10 μm.
I) Representative images of diaphragm whole mounts from mdx mice on day 16 after birth, treated with isotype (left) or αCSF1R (right). Arrows indicate necrotic tissues (orange-to-white = Evans blue staining of necrotic tissue). Scale bar, 1000 μm. N = 5 mice per group. See Figure 7B.
J) Representative images of diaphragm whole mounts from mdx mice on day 18 after birth, treated with isotype (left) or αCSF1R (right). Arrows indicate necrotic tissues (orange-to-white = Evans blue staining of necrotic tissue). Scale bar, 1000 μm. N = 5 mice per group. See Figure 7B.
K) Representative image of diaphragm whole mount from mdx mice on day 18 after birth treated with αLy6G and αCSF1R. Arrows indicate necrotic tissues (orange-to-white = Evans blue staining of necrotic tissue). Scale bar, 1000 μm. N = 3 mice per group. See Figure 7B.
L) IVM-still image after perfusion fixation showing spontaneously cloaking RTM (green = LysM) in naïve, unchallenged mice. Scale bar, 30 μm.
M) Representative images (n = 3) of peritoneal tissues from adult CD169-DTR mice after long-term treatment with DT. Orange-to-white = Evans blue staining of necrotic tissue). Scale bar, 500 μm.
N) Schematic depiction of the proposed mechanism. Left: Sufficient cloaking of microlesions prevents the contact activation of leading neutrophils by blocking physical access to the lesion and removal of pro-inflammatory debris, thereby preventing the initiation of swarming and inflammation. Right: Insufficient cloaking allows the leading neutrophil to make physical contact with the debris, undergo terminal activation and inflammatory cell death, which subsequently recruits and activates more neutrophils, and initiates neutrophil swarming. See also Movie S6.
A) Schematic depiction of the experimental setup for imaging the peritoneal serosa. See Figure S1A.
B) 3D surface reconstruction of anatomical structures of the visceral abdominal wall. See Figure S1B.