

SUMMARY
Pathogenic mutations in leucine-rich repeat kinase 2 (LRRK2) induce an age-dependent loss of dopaminergic (DA) neurons. We have identified Furin 1, a pro-protein convertase, as a translational target of LRRK2 in DA neurons. Transgenic knockdown of Furin1 or its substrate the bone morphogenic protein (BMP) ligand glass bottom boat (Gbb) protects against LRRK2-induced loss of DA neurons. LRRK2 enhances the accumulation of phosphorylated Mad (pMad) in the nuclei of glial cells in the vicinity of DA neurons but not in DA neurons. Consistently, exposure to paraquat enhances Furin 1 levels in DA neurons and induces BMP signaling in glia. In support of a neuron-glial signaling model, knocking down BMP pathway members only in glia, but not in neurons, can protect against paraquat toxicity. We propose that a neuron-glial BMP-signaling cascade is critical for mediating age-dependent neurodegeneration in two models of Parkinson’s disease, thus opening avenues for future therapeutic interventions.
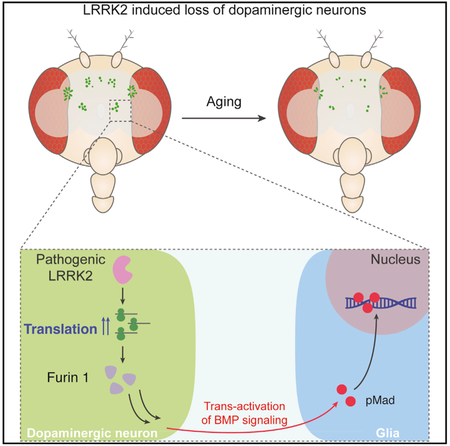
Graphical Abstract
In Brief
Mutations in the Parkinson’s-related gene LRRK2 lead to an age-dependent loss of dopaminergic neurons. Maksoud et al. show that this loss is mediated by Furin 1, a translational target of LRRK2. A critical step mediating this neurotoxic effect is a neuron-glia BMP-signaling cascade that is induced by Furin 1.
INTRODUCTION
Mutations in leucine-rich repeat kinase 2 (LRRK2) have been linked to autosomal dominant forms of familial Parkinson’s disease (Cookson, 2010; Paisán-Ruíz et al., 2004; Zimprich et al., 2004). LRRK2 encodes a 286-kDa protein with multiple functional domains; among the various mutations in LRRK2, pathogenic mutations are primarily concentrated in the Ras of complex proteins (ROC) and the C-terminal of ROC (COR) domains, as well as in the kinase domain (G2019S and I2020T) (Cookson, 2010). Since the discovery of the association between LRRK2 mutations and Parkinson’s disease, LRRK2 has been implicated in a variety of cellular functions, indicating that it is a multifunctional protein (Drolet et al., 2011; Martin et al., 2014a; Mata et al., 2006; Price et al., 2018; Wallings et al., 2015). In particular, LRRK2 has been implicated in the regulation of protein synthesis in Drosophila and in induced pluripotent stem cell (iPSC)-derived human neurons (Imai et al., 2008; Martin et al., 2014b, 2014c; Taymans et al., 2015); however, no specific disease-related translational target has yet been identified.
While the details of how LRRK2 enhances translation are not yet fully understood, there is strong consensus that LRRK2 gain-of-function enhances translation (Imai et al., 2008; Martin et al., 2014b; Penney et al., 2016; Tain et al., 2009). LRRK2 promotes cap-dependent translation and shows strong genetic interaction with core members and regulators of the cap-binding protein complex (Imai et al., 2008; Penney et al., 2016; Tain et al., 2009). A major regulatory step in translation initiation is provided by the action of the target of rapamycin (TOR). TOR activity promotes cap-dependent translation primarily through phosphorylation of 4E-BP (eukaryotic initiation factor 4E [eIF4E] binding protein) and S6K (S6 ribosomal protein kinase) (Hay and Sonenberg, 2004; Ma and Blenis, 2009). LRRK2 shows strong genetic interaction with all aforementioned translation factors, and pharmacological inhibition of cap-dependent translation with rapamycin suppresses LRRK2 gain-of-function phenotypes (Imai et al., 2008; Martin et al., 2014b; Penney et al., 2016; Tain et al., 2009). In addition to the regulation of cap-dependent translation, LRRK2 has been suggested to promote cap-independent translation through direct phosphorylation of the ribosomal protein s15; introduction of a phospho-deficient s15 protects against LRRK2-induced toxicity both in Drosophila and in iPSC-derived human neurons in culture (Martin et al., 2014b, 2014c). Finally, in vitro reporter assays as well as 35S-methionine and 35S-cysteine labeling experiments in mammalian cells have demonstrated the ability of LRRK2 to enhance protein synthesis (Martin et al., 2014c; Penney et al., 2016). These findings together build a strong case for a critical role of LRRK2 in the regulation of translation and underscore the need for the identification of endogenous translational target(s) of LRRK2 as a means for gaining insight into the mechanism of LRRK2-induced neurodegeneration.
We have previously identified Furin 1 (Fur1), a pro-protein convertase, as a translational target of LRRK2 and a mediator of LRRK2’s ability to regulate synaptic transmission at the Drosophila larval neuromuscular junction (Penney et al., 2016). We set out to test whether Fur1 also responds translationally to LRRK2 in the adult fly brain and whether it is involved in mediating the toxic effect of LRRK2 in DA neurons. The Drosophila dopaminergic system has been a powerful model to study age-dependent neurodegeneration as a consequence of overexpression of LRRK2 mutations in DA neurons (Liu et al., 2008; Venderova et al., 2009) and has allowed for genetic interaction experiments that have linked LRRK2 to other Parkinson’s-related genes, including Parkin, DJ-1, and PINK-1 (Ng et al., 2009; Tain et al., 2009; Venderova et al., 2009). Our assessment of fly brains indicates that Fur1 is highly concentrated in DA neurons and is indeed translationally regulated by LRRK2. Most importantly, we find that genetic knockdown of Fur1 specifically in DA neurons is sufficient to protect DA neurons against the toxic effect of LRRK2. Our findings indicate that limiting the bone morphogenic protein (BMP) ligand glass bottom boat (Gbb), a known substrate for Fur1 in DA neurons, can ameliorate the toxic effect of LRRK2. Moreover, by using the paraquat-induced model of Parkinson’s disease, we find a strong enhancement of Fur1 in DA neurons and show that limiting Fur1 or Gbb in DA neurons protects flies against paraquat toxicity. Finally, our genetic and immunohistochemical experiments indicate that this toxicity is mediated, in large part, by DA neuron-initiated activation of BMP signaling in glia. Neuron-glial transforming growth factor β (TGF-β) and BMP signaling has a conserved role in mediating neuronal survival, inflammation, and degeneration in both flies and vertebrates (Brionne et al., 2003; Hegarty et al., 2014; Kohta et al., 2009; Nahm et al., 2013; Tesseur and Wyss-Coray, 2006; Tesseur et al., 2006, 2017; Wyss-Coray et al., 1997). Therefore, our discoveries provide an important conceptual advance in our understanding of LRRK2 biology and its role in Parkinson’s disease-related neurodegeneration.
RESULTS
Furin 1 Is a Translational Target of LRRK2 in DA Neurons
In order to test whether Fur1 plays any role in mediating LRRK2-induced toxicity in dopaminergic (DA) neurons, we stained dissected adult Drosophila brains with a previously characterized anti-Fur1 antibody (Roebroek et al., 1993). Fur1 antibody produced a broad staining pattern in the brain (Figure 1A); however, we found significantly higher Fur1 staining in tyrosine hydroxylase (TH)-positive DA neurons (Figures 1B–1D). Transgenic knock down of Fur1 with RNAi by using the DA neuron-specific driver Ddc-Gal4 (Li et al., 2000) diminished the signal, confirming that the signal produced by the Fur1 antibody is specific to Fur1 (Figures S1A–S1D). DA neurons are organized in distinct clusters (Mao and Davis, 2009) from which we focused on four clusters, namely, PPL1 that belongs to the family of protocerebral posterior lateral (PPL) clusters and PPM1–3 that belong to the protocerebral posterior medial (PPM) clusters (Figure S1E). To test whether LRRK2 can translationally regulate Fur1 in DA neurons, we first overexpressed a pathogenic mutantform of LRRK2, LRRK2I2020T (referred to as LRRK2IT) (Venderova et al., 2009), in DA neurons by using the Ddc-Gal4 driver. Our findings indicated that Fur1 protein expression level (Figures 1E, 1F, and 1H) but not transcript level (Figure S1F) was increased. In addition, we detected a similar increase in Fur1 immunoreactivity in response to transgenic overexpression of a constitutively active S6K (S6KSTDE) (Barcelo and Stewart, 2002) in DA neurons (Figures 1G, 1H, and S1F). These results suggest that the increase in Fur1 immunoreactivity is likely a result of translational enhancement of Fur1. To provide more direct evidence for translational regulation of Fur1 in DA neurons, we took advantage of a transgenic translational reporter that combines the 5′ UTR of the fur1 gene with the open reading frame of EGFP (referred to as Fur1 sensor) (Penney et al., 2012). When expressed in DA neurons, Fur1 sensor produces a detectible GFP signal (Figure 1I); this signal was enhanced by 82% (p < 0.001) or 44% (p < 0.01) on average in response to LRRK2IT or S6KSTDE, respectively (Figures 1J, 1K, and 1M). On the other hand, reporter activity was reduced by an average of 33% (p < 0.05) in response to DA-specific overexpression of a TOR-insensitive 4E-BP transgene, 4E-BPAA (Figures 1L and 1M) (Teleman et al., 2005). Transcription of this reporter was not affected in any of the above genetic manipulations (Figure S1G). These results together indicate that Fur1 is translationally regulated in DA neurons and establish Fur1 as a translational target of LRRK2 in these neurons.
Figure 1. LRRK2 Overexpression Enhances Fur1 Translation in DA Neurons.

(A) Dorsal view of a whole-mount 10-day-old female Drosophila brain (yw) stained with anti-Fur1 (green).
(B–D) Left: adult Drosophila brain stained with anti-TH (red) (B), anti-Fur1 (green) (C), and merged (D). Right: magnification of the PPL1 cluster in boxed region for (B)–(D).
(A-D) Imaging was performed at 63x magnification. Thirty-six images were captured and tiled following a rectangular grid mode using Zen software.
(E–G) PPL1 clusters double stained with anti-TH (red) and anti-Fur1 (green) in flies expressing (E) UAS-LacZ (Ddc-Gal4/UAS-LacZ), (F) UAS-LRRK2IT (Ddc-Gal4/+; UAS-LRRK2IT/+) and (G) UAS-S6KSTDE (Ddc-Gal4/+; UAS-S6KSTDE/+) in dopaminergic (DA) neurons.
(H) Quantification of Fur1 sensor fluorescence intensity relative to TH for genotypes in (E)–(G). Each data point represents fluorescence from a single neuron. n = 100 neurons from 10 PPL1 clusters for each genotype. Data are represented as mean ± SEM. One-way ANOVA with Bonferroni post-test.
(I–L) PPM1-2 clusters expressing Fur1 sensor (5′UTR of Fur1 upstream of EGFP) (green) and stained with anti-TH (red) in flies co-expressing (I) UAS-LacZ (UAS-Fur1-sensor/UAS-LacZ; Ddc-Gal4/+), (J) UAS-LRRK2IT (UAS-Fur1-sensor/+; Ddc-Gal4/UAS-LRRK2IT), (K) UAS-S6KSTDE (UAS-Fur1-sensor/+; Ddc-Gal4/UAS-S6KSTDE) and (L) UAS-4E-BPAA (UAS-Fur1-sensor/+; Ddc-Gal4/UAS-4E-BPAA) in DA neurons. GFP corresponding to Fur1 sensor (green) is directly imaged without antibody staining.
(M) Quantification of Fur1 sensor fluorescence intensity relative to TH for genotypes in (I)-–(L). Each data point represents fluorescence from a single neuron. n = 50 neurons from 10 PPM1-2 clusters for each genotype. Data are represented as mean ± SEM. One-way ANOVA with Bonferroni post-test.
*p < 0.05, **p < 0.01, ***p < 0.001.
Furin 1 Mediates LRRK2-Induced Toxicity in DA Neurons
The preferential expression of Fur1 in DA neurons together with the strong translational regulation of Fur1 by LRRK2 prompted us to test the relationship between Fur1 and LRRK2-induced age-dependent loss of DA neurons. Overexpression of pathogenic LRRK2 transgenes LRRK2IT, LRRK2R1441G (referred to as LRRK2RG), and LRRK2G2019S (referred to as LRRK2GS) using the DA neuron-specific driver Ddc-Gal4 can lead to an age-dependent loss of DA neurons (Gehrke et al., 2010; Venderova et al., 2009) (Figures 2A, 2C, 2E; Figures S1E, S2A–S2I, and S4F). We did not find widespread apoptosis or degeneration as a result of overexpression of these transgenes (Figures S2L–S2P).
Figure 2. Fur1 Heterozygosity Is Protective in LRRK2IT-Overexpressing Neurons.

(A–D) Representative images of DA neurons stained with anti-TH antibody (red) from PPL1 clusters in 60 day-old female flies of the following genotypes: (A) UAS-LacZ (Ddc-Gal4/UAS-LacZ), (B) fur1+/− (Ddc-Gal4/+; fur1rl205/+), (C) UAS-LRRK2IT (Ddc-Gal4/+; UAS-LRRK2IT/+), and (D) UAS-LRRK2IT, fur1+/− (Ddc-Gal4/+; UAS- LRRK2IT/fur1rl205).
(E) Quantification of the number of TH-positive DA neurons in PPL1, PPM1-2, and PPM3 clusters for genotypes in (A)–(D). n = 22 hemispheres for each genotype. Data are represented as mean ± SEM. One-way ANOVA with Bonferroni post-test.
(F) Representative lifespan curves for genotypes in (A)–(D). n = 100 females for each genotype (see also Table S1). Log-rank and Wilcoxon tests.
(G) Climbing activity for genotypes in (A)–(D). n = 60 flies for each genotype. Data are represented as mean ± SEM. Two-way ANOVA with Dunnett post-test.
(H–K) Representative images of DA neurons stained with anti-TH antibody (red) from PPL1 clusters in 60 day-old female flies of the following genotypes: (H) UAS-LacZ (Ddc-Gal4/UAS-LacZ), (I) fur1+/− (Ddc-Gal4/+; fur1rl205/+), (J) UAS-S6KSTDE (Ddc-Gal4/+; UAS-S6KSTDE/+), and (K) UAS- S6KSTDE, fur1+/− (Ddc-Gal4/+; UAS- S6KSTDE/fur1rl205).
(L) Quantification of the number of TH-positive DA neurons in the PPL1, PPM1-2, and PPM3 clusters for genotypes in (H)–(K). n = 22 hemispheres for each genotype. Data are represented as mean ± SEM. One-way ANOVA with Bonferroni post-test.
(M–P) Representative images of DA neurons stained with anti-TH antibody (red) from PPL1 clusters in 60 day-old female flies for the following genotypes: (M) UAS-LacZ (Ddc-Gal4/UAS-LacZ), (N) UAS-LRRK2IT (Ddc-Gal4/+; UAS-LRRK2IT/+), (O) UAS-LRRK2IT, Fur1RNAi (Ddc-Gal4/+; UAS- LRRK2IT/UAS-Fur1-RNAi), and (P) UAS-LRRK2IT, mCherryRNAi (Ddc-Gal4/+; UAS- LRRK2IT/UAS-mCherry-RNAi).
(Q) Quantification of the number of TH-positive DA neurons in the PPL1, PPM1-2, and PPM3 clusters for genotypes in (M)–(P). n = 22 hemispheres for each genotype. Data are represented as mean ± SEM. One-way ANOVA with Bonferroni post-test.
*p < 0.05, **p < 0.01 ***p < 0.001.
We found that genetic removal of one gene copy of fur1 (Penney et al., 2016) was sufficient to counteract the toxic effect of both LRRK2IT and LRRK2RG transgenes (Figures 2A–2E and S2F–S2I). In addition to DA neuron loss, LRRK2 pathogenic mutants cause climbing defects in adult flies and negatively influence their lifespan (Martin et al., 2014b, 2014c; Venderova et al., 2009); both these toxic effects of LRRK2IT and LRRK2RG were also ameliorated as a result of fur1 heterozygosity (Figures 2F, 2G, S2J, and S2K; Table S1).
Consistent with previous studies indicating that enhanced translation is detrimental to the survival of DA neurons (Imai et al., 2008; Tain et al., 2009), we found that enhancement of translation by overexpression of S6KSTDE led to a qualitatively similar loss of DA neurons (Figures 2H, 2J, and 2L). We found that fur1 heterozygosity had a similar beneficial effect in flies challenged by DA neuron-specific overexpression of S6KSTDE, counteracting the toxic effect of enhanced translation in these neurons (Figures 2H–2L).
Although this dominant suppression indicates a strong genetic interaction between LRRK2 gain-of-function and fur1, it does not conclusively show the spatial requirement of Fur1. To test whether Fur1 is required specifically in DA neurons, we simultaneously knocked down Fur1 with RNAi while overexpressing LRRK2IT in DA neurons. Our findings indicated that transgenic knock down of Fur1 in DA neurons alone was sufficient to block the toxic effect of LRRK2IT (Figures 2M–2Q). These findings together provide strong evidence for a critical role for Fur1 in mediating LRRK2-induced age-dependent toxicity and DA neurodegeneration and suggest that Fur1 upregulation might be a common step in inducing age-dependent toxicity by translational mechanisms in DA neurons.
Enhanced Levels of Furin 1 Are Neurotoxic
Our findings thus far indicate that Fur1 mediates the toxic effect of LRRK2, raising the possibility that increased Fur1 protein expression alone in DA neurons (independently of LRRK2 levels) might be sufficient to induce age-dependent toxicity. To test this idea, we overexpressed Fur1 transgenically in DA neurons and assessed DA neuron survival and flies’ lifespan. Our assessment indicated that both these indices were sensitive to Fur1 levels: overexpression of Fur1 specifically in DA neurons was sufficient to cause an age-dependent loss of DA neurons and shorten flies’ lifespan (Figures 3A–3D; Table S1). This prompted us to test whether Fur1 levels or activity was relevant to DA neurotoxicity in other models of Parkinson’s disease. For this, we tested the well-characterized paraquat model. Feeding paraquat (1,1’-dimethyl-4,4’-bipyridinium dichloride) to flies induces a rapid degeneration of DA neurons and severely affects the longevity of flies (Cassar et al., 2015) (Figures S3A–S3C). We first tested whether exposure to paraquat influenced Fur1 levels in DA neurons. Indeed, after 4 days of exposure to 2 mM paraquat, we detected a significant increase in Fur1-antibody immunoreactivity in DA neurons (Figures 3E–3G), without any detectable change in fur1 transcription (Figure S3D). Moreover, the Fur1 translational reporter (Fur1 sensor) showed a large increase in its activity as a result of exposure to paraquat (Figures 3H–3J) without any change on its transcription (Figure S3E). These results indicate that, in a similar manner to LRRK2-induced toxicity, paraquat-induced toxicity enhances Fur1 translation in DA neurons. If the relationship between Fur1 and paraquat exposure was relevant to paraquat-induced toxicity, then limiting the amount of Fur1 in DA neurons should reduce paraquat-induced toxicity. Our genetic experiments supported this idea: transgenic knockdown of Fur1 in DA neurons provided significant protection against paraquat toxicity and extended flies’ median survival by 45% (p < 0.001), while overexpression of Fur1 further exacerbated the toxic effect of paraquat (Figures 3K and 3L; Table S1). These results highlight a critical role for Fur1 in Parkinson’s-related DA neuron toxicity and support the idea that Fur1 activity might be initiating a cellular program that is central to the process of neurodegeneration.
Figure 3. Fur1 is Neurotoxic.

(A and B) Representative images of DA neurons stained with anti-TH antibody (red) from PPL1 clusters in 35 day-old female flies of the following genotypes: (A) UAS-eGFP (Ddc-Gal4/+; UAS-eGFP/+) and (B) UAS-Fur1 (Ddc-Gal4/UAS-eGFP::Fur1).
(C) Quantification of the number of TH-positive DA neurons in the PPL1, PPM1-2, and PPM3 clusters for genotypes in (A) and (B). n = 22 hemispheres for each genotype. Data are represented as mean ± SEM. One-way ANOVA with Bonferroni post-test.
(D) Representative lifespan curves for genotypes in (A) and (B). n = 100 female flies for each genotype (see also Table S1). Log-rank and Wilcoxon tests.
(E and F) PPL1 clusters double stained with anti-TH (red) and anti-Fur1 (green) in (yw) flies raised on (E) sucrose or (F) 2 mM paraquat-containing medium.
(G) Quantification of Fur1 fluorescence intensity relative to TH for conditions in (E) and (F). Each data point represents fluorescence from a single neuron. n = 70 neurons from 7 PPL1 clusters for each genotype. Data are represented as mean ± SEM. Student’s t test.
(H and I) PPM1-2 clusters stained with anti-TH (red) in Fur1 sensor (UAS-Fur1-sensor/+; Ddc-Gal4/+) flies raised on (H) sucrose or (I) 2 mM paraquat containing medium. GFP corresponding to Fur1 sensor (green) is directly imaged without antibody staining.
(J) Quantification of Fur1 sensor fluorescence intensity relative to TH for conditions in (H) and (I). Each data point represents fluorescence from a single neuron. n = 50 neurons from 10 PPM1-2 clusters for each genotype. Data are represented as mean ± SEM. Student’s t test.
(K) Representative survival curves for WT (wild-type) female flies (DDC-Gal4/+) and Fur1RNAi flies (Ddc-Gal4/+; UAS-Fur1-RNAi/+) raised on 2 mM paraquat-containing medium. Flies were transferred at 5 days to paraquat-containing medium. n = 100 female flies for each genotype (see also Table S1). Log-rank and Wilcoxon tests.
(L) Representative survival curves for female flies of the genotypes in (A) and (B) raised on 2 mM paraquat-containing medium. n = 100 female flies for each genotype (see also Table S1). Log-rank and Wilcoxon tests.
*p < 0.05, **p < 0.01 ***p < 0.001.
Limiting BMP Signaling Protects against LRRK2 Toxicity
Fur1 is a pro-protein convertase with a large number of predicted targets but few have been experimentally verified (De Bie et al., 1995; Molloy et al., 1992). Among these are two BMP ligands: decapentaplegic (Dpp) (Irish and Gelbart, 1987) and Gbb (Akiyama et al., 2012; Künnapuu et al., 2009; Yarfitz et al., 1991). TGF-β and BMP signaling has been implicated in neurodegeneration mechanisms in flies and has been linked to neuro-inflammatory signaling in models of Parkinson’s disease in mice (Andrews et al., 2006; Nahm et al., 2013; Sánchez-Capelo et al., 2003; Wyss-Coray et al., 1997). We, therefore, set out to test whether Gbb and/or Dpp would play any role in mediating LRRK2-induced toxicity in DA neurons. We took advantage of transgenic RNAi to knock down either Gbb or Dpp while overexpressing LRRK2IT in DA neurons. Overexpression of LRRK2IT or LRRK2IT together with mCherry RNAi (control) produced typical age-dependent degeneration in all DA clusters examined (Figures 4A-4C and 4F); however, knocking down Gbb countered the age-dependent loss of DA neurons and protected the neurons against LRRK2 toxicity (Figures 4E and 4F), without affecting the level of LRRK2IT expression (Figure S4C). On the other hand, knock down of Dpp did not have any detectible effect on LRRK2-induced neurodegeneration (Figures 4D and 4F); however, because the transgenic knock down of Dpp was less effective (Figures S4A and S4B), we cannot fully rule out a role for Dpp at this point. These findings provide strong evidence for an important role for Gbb in mediating the toxic effect of LRRK2 in DA neurons. Using a hemagglutinin (HA)-tagged genomic Gbb transgene, we examined the expression pattern of Gbb in adult fly brains. We found that Gbb was expressed broadly in neurons (Figure S4D); interestingly, however, TH-positive DA neurons showed an increased Gbb expression, reminiscent of Fur1 preferential expression in DA neurons (Figure 4G). To examine the role of Gbb in mediating age-dependent DA neurodegeneration, we asked whether transgenic overexpression of Gbb could have a toxic effect on DA neurons. Our findings supported this idea as transgenic expression of Gbb in DA neurons led to a strong age-dependent degeneration (Figures 4H–4J) reminiscent of that induced by Fur1 or LRRK2.
Figure 4. LRRK2 Toxicity Is Mediated by BMP Signaling.

(A–E) Representative images of DA neurons stained with anti-TH antibody (red) from PPL1 clusters in 60 day-old female flies of the following genotypes: (A) UAS-LacZ (Ddc-Gal4/UAS-LacZ), (B) UAS-LRRK2IT (Ddc-Gal4/+; UAS-LRRK2IT/+), (C) UAS-LRRK2IT, mCherryRNAi (Ddc-Gal4/+; UAS- LRRK2IT/UAS-mCherry-RNAi),
(D) UAS-LRRK2IT, DppRNAi (Ddc-Gal4/+; UAS- LRRK2IT/UAS-Dpp-RNAi), and (E) UAS-LRRK2IT, GbbRNAi (Ddc-Gal4/+; UAS- LRRK2IT/UAS-Gbb-RNAi).
(F) Quantification of the number of TH-positive DA neurons in the PPL1, PPM1-2, and PPM3 clusters for genotypes in (A)–(E). n = 22 hemispheres for each genotype. Data are represented as mean ± SEM. One-way ANOVA with Bonferroni post-test.
(G) Neurons from the PPL1 clusters in a 10-day-old female Drosophila brain (Gbb-HA) double stained with anti-TH (green) and anti-HA (red).
(H and I) Representative images of DA neurons stained with anti-TH antibody (red) from PPL1 clusters in 60-day-old female flies of the following genotypes: (H) UAS-LacZ (Ddc-Gal4/UAS-LacZ) and (I) UAS-Gbb (Ddc-Gal4/+; UAS-Gbb-GFP/+).
(J) Quantification of the number of TH-positive DA neurons in the PPL1, PPM1-2, and PPM3 clusters for genotypes in (H) and (I). n = 22 hemispheres for each genotype. Data are represented as mean ± SEM. One-way ANOVA with Bonferroni post-test.
(K–P) Representative images of DA neurons stained with anti-TH antibody (red) from PPL1 clusters in 60 day-old female flies of the following genotypes: (K) UAS-LacZ (Ddc-Gal4/UAS-LacZ), (L) UAS-LRRK2IT (Ddc-Gal4/+; UAS-LRRK2IT/+), (M) UAS- LRRK2IT, gbb+/− (Ddc-Gal4/gbb1 UAS- LRRK2IT/+), (N) UAS- LRRK2IT, tkv+/− (Ddc-Gal4/tkv7; UAS- LRRK2IT/+), (O) UAS- LRRK2IT, Mad+/− (Ddc-Gal4/Madk00237; UAS- LRRK2IT/+), and (P) UAS- LRRK2IT, Med+/− (Ddc-Gal4/+; UAS- LRRK2IT/MedC246).
(Q) Quantification of the number of TH-positive DA neurons in the PPL1, PPM1–2, and PPM3 clusters for genotypes in (K) to (P). n = 22 hemispheres for each genotype. Data are represented as mean ± SEM. One-way ANOVA with Bonferroni post-test.
(R–W) Representative images of DA neurons stained with anti-TH antibody (red) from PPL1 clusters in 60 day-old female flies of the following genotypes: (R) UAS-LacZ (UAS-LacZ/+; Ddc-Gal4/+), (S) UAS-Fur1 (UAS-eGFP::Fur1/+; Ddc-Gal4/+), (T) UAS- Fur1, gbb+/− (UAS-eGFP::Fur1/gbb1; Ddc-Gal4/+), (U) UAS- Fur1, tkv+/− (UAS-eGFP::Fur1/tkv7; Ddc-Gal4/+) (V) UAS- Fur1, Mad+/− (UAS-eGFP::Fur1/MadK00237; Ddc-Gal4/+), and (W) UAS- Fur1, Med+/− (UAS-eGFP::Fur1/+; Ddc-Gal4/ MedC246).
(X) Quantification of the number of TH-positive DA neurons in the PPL1, PPM1-2, and PPM3 clusters for genotypes in (R)–(W). n = 22 hemispheres for each genotype. Data are represented as mean ± SEM. One-way ANOVA with Bonferroni post-test.
***p < 0.001, #p < 0.05; ##p < 0.01, ###p < 0.001.
To add further strength to the relevance of BMP signaling in mediating the toxic effect of LRRK2, we asked whether we could detect a genetic interaction between LRRK2 or Fur1 gain-of-function and core genes involved in BMP signaling, the type I BMP receptor thick veins (tkv) (Reuter and Szidonya, 1983), BMP transcription factor Mad (Raftery et al., 1995), and transcriptional cofactor Medea (Raftery et al., 1995) in addition to gbb. Heterozygosity for gbb, tkv, Mad, or Medea significantly ameliorated the toxic effect of LRRK2IT and Fur1 overexpression and reduced DA neuron loss (Figures 4K–4X; Figure S4E). Similarly, heterozygosity for tkv and Mad reduced the toxicity caused by the overexpression of LRRK2GS (Figures S4F and S4G).
This dominant genetic interaction indicates that BMP signaling plays a key role in mediating LRRK2-induced age-dependent DA neurodegeneration.
Disruption of Neuron-Glial BMP Signaling Is Protective against LRRK2 Toxicity
BMP ligands interact with BMP receptor complexes comprised of BMP type I and type II receptors. Upon ligand binding, the type II receptor phosphorylates the type I receptor, rendering it an active kinase. The activated type I receptor can now phosphorylate receptor-activated transcription factors, known as receptor-regulated Smads (RSmads) (Massagué et al., 2005). In flies, BMP transcription factor Mad (homolog of Smad1 and Smad5 in mammals) is phosphorylated by the Tkv receptor; phosphorylated Mad (pMad) then binds to its co-factor Medea (Smad4 in mammals) and translocates to the nucleus to regulate gene transcription (Ball et al., 2010; Hamaratoglu et al., 2014; McCabe et al., 2003; Shi and Massagué, 2003; Wrana et al., 1994). We used a commercially available antibody that recognizes pMad (Smith et al., 2012) and examined the pattern of pMad accumulation in brains of adult flies. Our immunohistochemical analysis suggested that pMad is broadly localized in the brain and is expressed in both neurons and glial cells (Figures S5A–S5C). In order to further verify the ability of neurons or glia to respond to BMP activation, we used transgenic overexpression of a constitutively active BMP type I Tkv receptor (TkvACT) (Haerry et al., 1998) in either all neurons or all glia by using temporally controlled drivers (see STAR Methods). In both cases, we were able to see an enhancement of the pMad signal in respected tissues (Figures 5A–5D), suggesting that BMP activation could occur in both neurons and glia. In order to assess the tissue specificity of BMP signaling and simplify the genetic interpretations, we established protocols to test whether limiting BMP signaling in either neurons or glia could counteract paraquat-induced toxicity and early lethality. We took advantage of tools allowing tissue-specific knock down of BMP receptor Tkv or BMP transcription factor Mad in either all neurons or all glia in a temporally controlled manner (Figures 5E and 5F). Our analysis indicated that knocking down Tkv or Mad in in neurons (Figures S5D and S5E) for 5 days prior to exposure to paraquat had no protective effect and further exacerbated the toxicity (Figure 5E; Table S1). Conversely, knocking down Tkv or Mad in glia during the same period led to a significant protection against paraquat toxicity, increasing the average lifespan of flies by 30% (p < 0.001) (Figure 5F; Table S1) and partially restoring DA neuron loss (Figures 5G–5K). Our results are consistent with the well-established growth-promoting role of TGF-β and BMP signaling in neurons (Meyers and Kessler, 2017; Tesseur and Wyss-Coray, 2006; Tesseur etal., 2017), by showing that limiting BMP signaling in neurons could compromise the health of neurons and reduce their ability to withstand the cellular stress caused by paraquat toxicity. Indeed, under control conditions, transgenic knock down of Tkv in neurons in wild-type flies can lead to widespread degeneration (Figures S5F–S5H). Most importantly, by showing that genetic knock down of BMP signaling in glia is protective against paraquat toxicity, our results highlight the critical importance of an intercellular BMP signal from DA neurons to glia in mediating the paraquat-induced toxicity.
Figure 5. Neuron-Glial BMP Signaling Underlies Paraquat-Induced Toxicity.

(A and B) Representative images from the upper right quadrant of a 10-day-old adult female Drosophila brain double stained with anti-elav (green) and anti-pMad (red) of the following genotypes: (A) UAS-LacZ (elav-GS/UAS-LacZ) and (B) UAS-TkvACT (elav-GS/+; UAS-TkvACT/+). Mated female flies were transferred to RU486 containing medium at 5 days of age.
(C and D) Representative images from the upper right quadrant of a 10-day-old adult female Drosophila brain double stained with anti-repo (green) and anti-pMad (red) ofthe following genotypes: (C) UAS-LacZ (tub-Gal80ts/UAS-lacZ; repo-Gal4/+) and (D) UAS-TkvACT (tub-Gal80ts/+; repo-Gal4/UAS-TkvACT). Mated female flies were transferred to 29°C at 5 days of age.
(E) Top: Experimental design timeline: 5 day-old mated female flies were transferred to RU486 medium for 5 days and then transferred to paraquat-RU486 medium at 25°C to start the survival experiment. Bottom: Representative survival curves for female flies of the following genotypes: mCherryRNAi (elav-GS/+; UAS-mCherry-RNAi /+), tkvRNAi (elav-GS/+; UAS-tkv-RNAi/+) and MadRNAi (elav-GS/+; UAS-Mad-RNAi/+) raised on 2mM paraquat-RU486-containing medium. n = 100 female flies for each genotype (see also Table S1). Log-rank and Wilcoxon tests.
(F) Top: Experimental design timeline: 5 day-old mated female flies were transferred to 29°C for 5 days and then transferred to paraquat containing medium at 25°C to start the survival experiment. Bottom: Representative survival curves for female flies of the following genotypes: mCherryRNAi (tub-Gal80ts/+; repo-Gal4/ UAS-mCherry-RNAi), tkvRNAi (tub-Gal80ts/+; repo-Gal4/UAS-tkv-RNAi) and MadRNAi (tub-Gal80ts/+; repo-Gal4/UAS-Mad-RNAi) raised on 2 mM paraquat-containing medium. n = 100 female flies for each genotype (see also Table S1). Log-rank and Wilcoxon tests.
(G–J) Representative images of DA neurons stained with anti-TH antibody (red) from PPL1 clusters in 15-day-old mCherryRNAi (control) female flies raised on sucrose and age-matched female flies for genotypes in (F) raised on paraquat for 5 days.
(K) Quantification of the number of TH-positive DA neurons in the PPL1, PPM1-2, and PPM3 clusters for genotypes in (G)-(J). n = 22 hemispheres for each genotype. Data are represented as mean ± SEM. One-way ANOVA with Bonferroni post-test.
(L and M) Representative images of glial cells in the proximity of DA neurons in the PPM1-2 cluster double stained with anti-Repo (blue) and anti-pMad (red) for the following genotypes: (L) UAS-LacZ (UAS-Fur1-sensor/UAS-LacZ; Ddc-Gal4/+) and (M) UAS-LRRK2IT (UAS-Fur1-sensor/+; Ddc-Gal4/UAS-LRRK2IT). GFP corresponding to Fur1 sensor (green) is directly imaged without antibody staining.
(N) Quantification of pMad staining for genotypes in (L) and (M) normalized to the surface area of Repo. Each data point represents fluorescence from a single glial cell. n = 100 glial nuclei in the vicinity of PPM1-2 clusters from 10 brains for each genotype. Data are represented as mean ± SEM. Student’s t test.
(O–Q) Representative images of DA neurons stained with anti-TH antibody (red) from PPL1 clusters in 40-day-old female flies of the following genotypes: (O) UAS-LacZ (tub-Gal80ts/UAS-LacZ; repo-Gal4/+), (P) UAS-Mad (tub-Gal80ts/+; repo-Gal4/UAS-Mad), and (Q) UAS-TkvACT (tub-Gal80ts/+; repo-Gal4/UAS-TkvACT/+). Mated female flies were transferred to 29°C at 5 days of age.
(R) Quantification of the number of TH-positive DA neurons in the PPL1, PPM1-2, and PPM3 clusters for genotypes in (O) to (Q). n = 22 hemispheres for each genotype. Data are represented as mean ± SEM. One-way ANOVA with Bonferroni post-test.
*p < 0.05, **p < 0.01, ***p < 0.001, #p < 0.05, ###p < 0.001.
These findings together predict that overexpression of LRRK2 or exposure to paraquat, through translational enhancement of Fur1 and by Gbb in DA neurons, might enhance BMP signaling in glia. We tested this idea by assessing pMad immunoreactivity in the vicinity of DA clusters (PPM1-2) while overexpressing LRRK2IT in DA neurons. In support of our genetic results, we found that overexpression of LRRK2IT led to a significant enhancement of pMad accumulation in the nuclei of glia surrounding DA neurons but not in DA neurons themselves (Figures 5L–5N). Similarly, we found that pMad accumulation in glial cells showed a strong trend toward enhancement (15% increase in mean pMad fluorescence intensity; p = 0.069) as a result of exposure to paraquat.
Our results thus far provide strong evidence for a model in which BMP signaling in glia is critical for mediating the toxic effects of paraquat and LRRK2. It is, therefore, conceivable that the activation of BMP signaling in glia, in the absence of any toxic stimuli, is sufficient to produce age-dependent DA neurodegeneration. We tested this idea by overexpressing either TkvACT or Mad specifically in all glia in otherwise wild-type flies. Our findings showed that the activation of BMP signaling in glia alone led to a statistically significant loss of DA neurons after 40 days (Figures 5O–5R).
Our findings together make a strong case for the presence of neuron-glial activation of the BMP signaling cascade in response to LRRK2- or paraquat-induced toxicity and suggest that this neuron-glial signaling is a critical step in the process of age-dependent DA neurodegeneration in these Parkinson’s-related models (Figure 6).
Figure 6. Proposed Working Model.

Pathogenic LRRK2 or paraquat exposure can enhance translation of the proprotein convertase Fur1 in DA neurons. Increased Fur1 expression, most likely, promotes the processing of Pro-Gbb into its active form. Secreted from DA neurons, Gbb binds to its bone morphogenic protein (BMP) type I and type II (Tkv) receptors in glial cells and activates a BMP signaling cascade in glia. We hypothesize that this BMP-signaling cascade, in turn, contributes to age-dependent degeneration of DA neurons, possibly by activating inflammatory or stress signals.
DISCUSSION
Although the role of LRRK2 in the regulation of translation has been recognized for over a decade, its specific disease-related translational targets have not been identified. Using the power of Drosophila genetics, we have identified Fur1, a pro-protein convertase, as a translational target of LRRK2 in DA neurons. DA neuron-specific knock down of Fur1 or its substrate, the BMP ligand Gbb, protects against LRRK2- or paraquat-induced toxicity, while overexpression of either gene leads to age-dependent degeneration of DA neurons. Interestingly, we find that LRRK2-paraquat-induced toxicity is associated with an increase in pMad accumulation in the glial nuclei surrounding DA neurons but not in DA neurons. Supporting the critical importance of glia, our genetic manipulation of BMP receptor Tkv and BMP transcription factor Mad show that limiting BMP signaling in glia, but not in neurons, can ameliorate toxicity induced by paraquat. Based on these findings, we propose a model (Figure 6) in which DA neuron-specific overexpression of pathogenic LRRK2 transgenes or exposure to the toxin paraquat increases the translation of Fur1 in DA neurons, leading to trans-activation of a BMP-signaling cascade in glia; our model predicts that this transsignaling cascade mediates LRRK2 or paraquat-induced neuro-degeneration. These findings not only identify a disease-related translational target of LRRK2 in DA neurons but also reveal a detailed mechanistic link between a DA neuron-initiated cue and a glial signaling pathway that is crucial for the progression of neurodegeneration in two Parkinson’s disease models in Drosophila. Future work is required to investigate whether the role of Fur1 or its target(s) are conserved in mammalian or human neurons. Fur1 homologs in humans form a family of proprotein convertases with many predicted targets. As these enzymes have been targets for clinically approved drugs (Klein-Szanto and Bassi, 2017), future research could lead to the development of alternative therapies for Parkinson’s disease.
Our genetic experiments not only show that the BMP ligand Gbb is required in DA neurons for the full extent of LRRK2-paraquat toxicity but also demonstrate that mere overexpression of Gbb is sufficient to induce DA degeneration in a manner that is qualitatively identical to the LRRK2 pathogenic effect, highlighting the critical importance of the activation of BMP signaling in glia in mediating neurodegeneration. TGF-β, activin, and BMP signaling is a major intercellular signaling that has been implicated in a variety of neuronal processes from neuronal growth and survival to synaptic plasticity and neurodegeneration (Brionne et al., 2003; Hegarty et al., 2014; Kohta et al., 2009; Nahm et al., 2013; Tesseur and Wyss-Coray, 2006; Tesseur et al., 2006, 2017; Wyss-Coray et al., 1997, 2001). Consistent with findings in vertebrate systems, our results show that limiting BMP signaling in neurons in aging fly brain compromises neuronal survival. However, at the same time, our results indicate that limiting BMP signaling in glia could protect neurons against Parkinson’s disease-related toxicity. A more granulated picture of the role of BMP signaling in neurodegeneration, therefore, will require the identification of specific genes under the transcriptional control of BMP signaling in specific populations of neurons or glia under different disease-related conditions.
The role of stress pathways and inflammatory signals in the progression of neurodegenerative diseases, such as Alzheimer’s and Parkinson’s diseases, has been long recognized (Amor et al., 2010). It is likely that DA neuron-induced BMP signaling in glia leads to the activation of stress and inflammatory pathways that are akin to microglial activation. Accumulating evidence suggests that while both systemic and brain-specific stress and inflammatory signals contribute to neuroinflammation, a cross talk between neurons and microglia is key for the activation of microglia and the progression of neurodegeneration (Joers et al., 2017; Kierdorf and Prinz, 2013; Lan et al., 2017; Liddelow et al., 2017; Subramaniam and Federoff, 2017); however, in spite of its importance, the nature of neuron-glia signaling in Parkinson’s disease is not fully understood in vivo. Our findings contribute to this area of knowledge by providing insight into the molecular events that link pathogenic LRRK2 gain-of-function in DA neurons to the activation of BMP signaling in glial cells in the aging fly brain. Our findings point to a role for LRRK2 in activating translational mechanisms in DA neurons and thereby activating neuronal-derived signals that ultimately determine the glial response during the progression of Parkinson’s disease. As such, our findings present a framework for studying Parkinson’s-related neurodegeneration, opening avenues for therapeutic discoveries.
STAR★METHODS
Detailed methods are provided in the online version of this paper and include the following:
CONTACT FOR REAGENT AND RESOURCE SHARING
Further information and requests for resources and reagents should be directed to and will be fulfilled by the Lead Contact, Pejmun Haghighi (phaghighi@buckinstitute.org).
EXPERIMENTAL MODEL AND SUBJECT DETAILS
All experiments were performed in female Drosophila melanogaster flies according to standard procedures.
METHOD DETAILS
Fly Genetics
Flies were incubated at 25°C on a 12-hour day/night cycle on standard yeast-molasses based medium (see method details for recipe). For Gal80ts experiments, 5-day-old female flies were shifted to 29°C. For paraquat experiments, 5 day-old-female flies were shifted to 2 mM paraquat in a sucrose- (5%) and agar-containing (1.3%) medium (Shukla et al., 2014). For Gene-Switch experiments, 5-day-old flies were transferred to standard or paraquat media and were supplemented with 200 μM RU486. Refer to Key Resources Table for fly lines used in this study.
Standard molasses-yeast fly food recipe
Flies were maintained on standard molasses/yeast food. Recipe as follows: 1 l distilled water, 13.8 g agar, 22 g molasses, 80 g malt extract, 18 g Brewer’s yeast, 80 g corn flour, 10 g soy flour, 6.25 mL propionic acid, 2 g methyl-p-benzoate, 7.2 mL of Nipagin (20% in EtOH).
Immunohistochemistry
Whole fly brains were dissected in ice-cold PBS (Phosphate Buffered Saline) and fixed in 4% paraformaldehyde in PBST at room temperature for 30 min. Fixed brains were washed 3 times in PBST for 20 min. They were then incubated in blocking buffer (PBST with 5% normal goat serum) for 30 min and for 48 h at 4°C with primary antibody in blocking buffer. Stained brains were washed 3 times in PBST for 20 min and then incubated with secondary antibody in blocking buffer for 2 h at room temperature. Later, they were washed 3 times in PBST for 20 min and mounted in VECTASHIELD anti-fade mounting media (Vector). Brain samples were imaged on confocal microscope (LSM-700 and LSM-780, Zeiss). Image analysis was performed using FIJI software (Schindelin et al., 2012) or Imaris image analysis software (Bitplane).
For pMad quantification, 5 μm confocal stacks were processed in FIJI software. The pMad mean fluorescence intensity of Repo positive cells surrounding PPM1-2 DA neurons clusters was normalized by the cell surface area. Statistical analysis was performed using GraphPad Prism software. Refer to Key Resources Table for antibodies used in this study.
Assessment of DA neuron loss
Whole mount adult brains from at least 22 female flies per genotype were labeled with anti-TH antibody and imaged under an epifluorescence microscope. The number of TH positive neurons in clusters PPL1, PPM1-2 and PPM3 was scored manually. The mean number of cells per cluster was calculated for 22 hemispheres from each brain for each genotype.
Lifespan analysis
For lifespan and survival analysis, male and female flies were co-housed for 5 days immediately after eclosion; following which 10 female flies were collected in individual vials for further analysis. For lifespan, the flies were transferred to fresh food every 2 days and death events were recorded. For survival on paraquat, the flies were transferred to fresh food every day and death events were recorded every 12 h. Lifespan or survival was scored for a total of 100 female flies (n = 10 × 10). Each experiment has been repeated three times from independent genetic crosses (3 × 100). Also see Table S1.
Climbing activity
For climbing activity, male and female flies were co-housed for 5 days immediately after eclosion; following which 10 female flies were collected and maintained in individual vials. Every 5 days, flies were tested for standard negative geotaxis test. In brief, they were placed in an empty plastic vial and gently tapped 3 times to the bottom. The number of flies that crossed a line situated at 5 cm from the bottom within 15 s was recorded. Six independent replicates were averaged per genotype. For each cohort the test was repeated 5 times at each time point. The percentage of climbing activity was determined by dividing the average number of flies that reached the designated height during 5 tests by the total number of flies in a tube at the starting day
Quantitative PCR
Total RNA was extracted from 20 female heads using TRI reagent RT (Molecular Research Center) method according to the manufacturer’s instructions. cDNA was prepared from 300 ng total RNA with iScript cDNA synthesis kit (Bio-Rad). mRNA expression was measured by quantitative real-time PCR (qPCR) with iTaq™ universal sybrR green supermix (Bio-Rad) on a Bio-Rad CFX96 thermocycler.
For all experiments flies were 10 days old at the time of RNA extraction. When transfer to paraquat or RU486 media was required, the flies were transferred to their special food at 5 days of age. Refer to Table S2 for primers.
Histology and TUNEL assay
Fly heads without proboscis and antennas were fixed in fresh Carnoy’s fixative (ethanol: Chloroform: acetic acid at 6:3:1) overnight at 4°C. Heads were then consecutively washed at RT with 40, 40, 70 and 100% EtOH for 10 min each; following which they were incubated in methyl benzoate for 30 min at RT and in methyl benzoate: paraffin at 1:1 ratio for 1 h at 65°C. Heads were then infiltrated with paraffin twice for 1 h at 65°C and embedded in paraffin blocks. The blocks were sectioned at a thickness of 5 μm, subjected to hematoxylin and eosin staining, and examined by brightfield microscopy (Axioskop 2 Plus, Zeiss). For each genotype, vacuoles were counted from one slice around mid-brain from 20 single flies. For TUNEL assay, 5 mm paraffin sections of 40-day-old fly heads were stained using the FragEL™ DNA fragmentation detection kit, fluorescent– TdT Enzyme (Millipore, Sigma) according to the manufacturer’s instructions. Image analysis was performed using FIJI software (Schindelin et al., 2012) or Imaris image analysis software (Bitplane).
Cloning of pUAST-eGFP
eGFP fragment from pTGW was cloned into pBKSM as an XbaI/NotI fragment to make pBKSM+eGFP. eGFP was then cut from pBKSM+eGFP as an EcoRI/NotI fragment and then cloned into pUASt to make pUAST-eGFP. Enzymes were acquired from NEW ENGLAND BIOLABS. Refer to Key Resources Table for plasmids.
Cloning of pUAST-eGFP-Fur1
Fur1 was PCR amplified with OED461 and OED462 oligos (Table S2) with cDNA clone LD33976 (key resources table) as template. PCR fragment was then cloned into pUAST-eGFP as an AgeI/NotI fragment.
Transgenic Fly production
DNA plasmids were injected into embryos using standard protocols.
QUANTIFICATION AND STATISTICAL ANALYSIS
Survival curves of different genotypes were compared using Log-rank and Wilcoxon tests. DA neuron counts and climbing activity from tested genotypes were compared using one-way or two-way ANOVA with Bonferroni and Dunnett post tests respectively. mRNA levels from quantitative PCR experiments and relative fluorescence quantification were compared using one-way ANOVA with Bonferroni test or Student’s t test when comparing only two conditions. All statistical analyses were performed using GraphPad Prism software. Further statistical details for each experiment can be found in the corresponding figure legend.
SUPPLEMENTAL INFORMATION
Supplemental Information includes five figures and two tables and can be found with this article online athttps://doi.org/10.1016/j.celrep.2019.01.077.
Supplementary Material
KEY RESOURCES TABLE
| REAGENT or RESOURCE | SOURCE | IDENTIFIER |
|---|---|---|
| Antibodies | ||
| TH (1/250) | Novus biologicals | Cat# NB300-109; RRID:AB_10077691 Lot ajo125 g |
| TH (1/250) | Immunostar | Cat# 22941; RRID:AB_572268 Lot 1602001 |
| Furin1 (1/100) | Roebroek et al., 1993 | N/A |
| HA (1/100) | BioLegend | Cat# 901503; RRID:AB_2565005 Lot D14CF00556 |
| repo (1/250) | DSHB | Cat# 8D12 anti-Repo; RRID:AB_528448 |
| elav (1/250) | DSHB | Cat# ELAV 9F8A9; RRID:AB_231436 |
| elav (1/250) | DSHB | Cat# ELAV 7E8A10; RRID:AB_528218 |
| Smad3 (1/250) | Abcam | Cat# ab52903; RRID:AB_882596 Lot GR128879-73 |
| DAPI (1/1000) | Thermo Fisher Scientific | Cat# D1306 |
| Bacterial and Virus Strains | ||
| N/A | N/A | N/A |
| Biological Samples | ||
| N/A | N/A | N/A |
| Chemicals, Peptides, and Recombinant Proteins | ||
| Methyl viologen dichloride hydrate | Sigma Aldrich | Cat#856177-1G |
| Mifepristone | Cayman chemical company | Cat#10006317 |
| Critical Commercial Assays | ||
| TUNEL assay (FragEL™ DNA fragmentation detection kit, fluorescent – TdT Enzyme) | Millipore Sigma | Cat#QIA39-1EA |
| iTaqTM univesral sybrR green supermix | Bio-Rad | Cat#172-5121 |
| iScript cDNA synthesis kit | Bio-Rad | Cat#170-8891 |
| Deposited Data | ||
| N/A | N/A | N/A |
| Experimental Models: Cell Lines | ||
| N/A | N/A | N/A |
| Experimental Models: Organisms/Strains | ||
| UAS-hLRRK2I2020T | Venderova et al., 2009 | FBal0244982 |
| UAS-hLRRK2G2019S | Gehrke et al., 2010 | FBal0249350 |
| UAS-dLRRKR1441G | D. Park | FBal0322854 |
| UAS-Gbb.GFP | R. Ray | BDSC_63058 |
| UAS-eGFP::Fur1 | This paper | N/A |
| UAS-TkvACT (UAS-tkvQ199D) | Haerry et al., 1998 | FBal0051065 |
| UAS-eGFP | This paper | N/A |
| UAS-Mad | McCabe et al., 2004 | N/A |
| UAS-S6KSTDE | Barcelo and Stewart, 2002 | BDSC_6913 |
| UAS-LacZ | Exelixis, Inc. | BDSC_8529 |
| UAS- 4E-BPAA | Teleman et al., 2005 | N/A |
| UAS-mCherryRNAi | Perkins et al., 2015 | BDSC_35787 |
| UAS-Fur1RNAi | Dietzl et al., 2007 | VDRC 22853 |
| UAS-MadRNAi | Perkins et al., 2015 | BDSC_31316 |
| UAS-tkvRNAi | Perkins et al., 2015 | BDSC_35653 |
| UAS-DppRNAi | Perkins et al., 2015 | BDSC_25782 |
| UAS-GbbRNAi | Perkins et al., 2015 | BDSC_34898 |
| fur1rl205 | Penney et al., 2016 | BDSC_10341 |
| MadK00237 | Li et al., 2005 | BDSC_10474 |
| MedeaC246 | Aberle et al., 2002 | FBal0156263 |
| tkv7 | Nellen et al., 1994 | BDSC_3242 |
| gbb1 | M.B. O’Connor | FBal0092973 |
| dLRRKe03680 | Parks et al., 2004 | FBal0185431 |
| gbb.HA | M.B. O’Connor | N/A |
| Ddc-Gal4 | Li et al., 2000 | BDSC_7010 |
| Ddc-Gal4 | Li et al., 2000 | BDSC_7009 |
| repo-Gal4 | Sepp et al., 2001 | BDSC_7415 |
| elav-GS | Osterwalder et al., 2001 | N/A |
| y1 w67c23 | B. Gelbart | BDSC_6599 |
| Canton S | Kyoto stock center | BDSC_64349 |
| y1; ry506 | G. Karpen | BDSC_4405 |
| w1118 | R. Levis | BDSC_3605 |
| UAS-Fur1-sensor | Penney et al., 2012 | N/A |
| Oligonucleotides | ||
| qPCR and sequencing primers, Refer to Table S2 | Integrated DNA technologies | N/A |
| Recombinant DNA | ||
| cDNA clone: LD33976 | DGRC | Stock#5309 |
| Plasmid: pTGW | DGRC | Stock#1075 |
| Plasmid: pUASt | Brand and Perrimon, 1993 | N/A |
| Software and Algorithms | ||
| Illustrator (CS6) | Adobe | RRID:SCR_014198; https://www.adobe.com |
| Photoshop (CS6) | Adobe | RRID:SCR_014199; https://www.adobe.com/ |
| Zen | Zeiss | RRID:SCR_01367; https://www.zeiss.com/microscopy/int/products/microscope-software/zen.html |
| FIJI is just ImageJ (v. 2.0.0) | NIH | RRID: SCR_003070; https://fiji.sc |
| Prism (v. 7) | GraphPad Software | RRID: SCR_002798; https://www.graphpad.com |
| Imaris (v. 7.5.2) | Bitplane | RRID:SCR_007370; http://www.bitplane.com |
| Other | ||
| N/A | N/A | N/A |
Highlights.
Overexpression of LRRK2 and paraquat exposure enhance Fur1 translation in DA neurons
Knockdown of Fur1 in DA neurons protects against LRRK2-paraquat toxicity
LRRK2-Paraquat-Furin1 toxicity is associated with increased BMP signaling in glia
This neuron-glia trans signaling mediates neurotoxicity in the fly Parkinson’s model
ACKNOWLEDGMENTS
We thank M.B. O’Connor, H. Jasper, M.R. Freeman, D. Park, J. Creemers, A. DiAntonio, and B. Lu for providing us with reagents and fly stocks. We thank H. Cifuentes, M. R. Calderon, S. Nuguyen, J. Chen, as well as all the present and past members of the Haghighi lab. Images were collected at the Buck Institute Imaging and Morphology Core. We thank the Bloomington Center and Vienna Drosophila Resource Center for fly stocks and the University of Iowa Developmental Studies Hybridoma Bank for antibodies. This work was supported by an NIH grant (R01NS082793) to A.P.H. and by Buck Institute Funds to Haghighi lab.
Footnotes
DECLARATION OF INTERESTS
The authors declare no competing interests.
REFERENCES
- Aberle H, Haghighi AP, Fetter RD, McCabe BD, Magalhães TR, and Goodman CS (2002). wishful thinking encodes a BMP type II receptor that regulates synaptic growth in Drosophila. Neuron 33, 545–558. [DOI] [PubMed] [Google Scholar]
- Akiyama T, Marqués G, and Wharton KA (2012). A large bioactive BMP ligand with distinct signaling properties is produced by alternative proconvertase processing. Sci. Signal. 5, ra28. [DOI] [PMC free article] [PubMed] [Google Scholar]
- Amor S, Puentes F, Baker D, and van der Valk P (2010). Inflammation in neurodegenerative diseases. Immunology 129, 154–169. [DOI] [PMC free article] [PubMed] [Google Scholar]
- Andrews ZB, Zhao H, Frugier T, Meguro R, Grattan DR, Koishi K, and McLennan IS (2006). Transforming growth factor beta2 haploinsufficient mice develop age-related nigrostriatal dopamine deficits. Neurobiol. Dis. 21, 568–575. [DOI] [PubMed] [Google Scholar]
- Ball RW, Warren-Paquin M, Tsurudome K, Liao EH, Elazzouzi F, Cavanagh C, An B-S, Wang T-T, White JH, and Haghighi AP (2010). Retrograde BMP signaling controls synaptic growth at the NMJ by regulating trio expression in motor neurons. Neuron 66, 536–549. [DOI] [PubMed] [Google Scholar]
- Barcelo H, and Stewart MJ (2002). Altering Drosophila S6 kinase activity is consistent with a role for S6 kinase in growth. Genesis 34, 83–85. [DOI] [PubMed] [Google Scholar]
- Brand AH, and Perrimon N (1993). Targeted gene expression as a means of altering cell fates and generating dominant phenotypes. Development 118, 401–415. [DOI] [PubMed] [Google Scholar]
- Brionne TC, Tesseur I, Masliah E, and Wyss-Coray T (2003). Loss of TGF-β 1 leads to increased neuronal cell death and microgliosis in mouse brain. Neuron 40, 1133–1145. [DOI] [PubMed] [Google Scholar]
- Cassar M, Issa A-R, Riemensperger T, Petitgas C, Rival T, Coulom H, Iche-Torres M, Han K-A, and Birman S (2015). A dopamine receptor contributes to paraquat-induced neurotoxicity in Drosophila. Hum. Mol. Genet. 24, 197–212. [DOI] [PMC free article] [PubMed] [Google Scholar]
- Cookson MR (2010). The role of leucine-rich repeat kinase 2 (LRRK2) in Parkinson’s disease. Nat. Rev. Neurosci. 11, 791–797. [DOI] [PMC free article] [PubMed] [Google Scholar]
- De Bie I, Savaria D, Roebroek AJM, Day R, Lazure C, Van de Ven WJ, and Seidah NG (1995). Processing specificity and biosynthesis of the Drosophila melanogaster convertases dfurin1, dfurin1-CRR, dfurin1-X, and dfurin2. J. Biol. Chem. 270, 1020–1028. [DOI] [PubMed] [Google Scholar]
- Dietzl G, Chen D, Schnorrer F, Su K-C, Barinova Y, Fellner M, Gasser B, Kinsey K, Oppel S, Scheiblauer S, et al. (2007). A genome-wide transgenic RNAi library for conditional gene inactivation in Drosophila. Nature 448, 151–156. [DOI] [PubMed] [Google Scholar]
- Drolet RE, Sanders JM, and Kern JT (2011). Leucine-rich repeat kinase 2 (LRRK2) cellular biology: a review of recent advances in identifying physiological substrates and cellular functions. J. Neurogenet. 25, 140–151. [DOI] [PubMed] [Google Scholar]
- Gehrke S, Imai Y, Sokol N, and Lu B (2010). Pathogenic LRRK2 negatively regulates microRNA-mediated translational repression. Nature 466, 637–641. [DOI] [PMC free article] [PubMed] [Google Scholar]
- Haerry TE, Khalsa O, O’Connor MB, and Wharton KA (1998). Synergistic signaling by two BMP ligands through the SAX and TKV receptors controls wing growth and patterning in Drosophila. Development 125, 3977–3987. [DOI] [PubMed] [Google Scholar]
- Hamaratoglu F, Affolter M, and Pyrowolakis G (2014). Dpp/BMP signaling in flies: from molecules to biology. Semin. Cell Dev. Biol. 32, 128–136. [DOI] [PubMed] [Google Scholar]
- Hay N, and Sonenberg N (2004). Upstream and downstream of mTOR. Genes Dev. 18, 1926–1945. [DOI] [PubMed] [Google Scholar]
- Hegarty SV, Sullivan AM, and O’Keeffe GW (2014). Roles for the TGFb superfamily in the development and survival of midbrain dopaminergic neurons. Mol. Neurobiol. 50, 559–573. [DOI] [PubMed] [Google Scholar]
- Imai Y, Gehrke S, Wang H-Q, Takahashi R, Hasegawa K, Oota E, and Lu B (2008). Phosphorylation of 4E-BP by LRRK2 affects the maintenance of dopaminergic neurons in Drosophila. EMBO J. 27, 2432–2443. [DOI] [PMC free article] [PubMed] [Google Scholar]
- Irish VF, and Gelbart WM (1987). The decapentaplegic gene is required for dorsal-ventral patterning of the Drosophila embryo. Genes Dev. 1, 868–879. [DOI] [PubMed] [Google Scholar]
- Joers V, Tansey MG, Mulas G, and Carta AR (2017). Microglial phenotypes in Parkinson’s disease and animal models of the disease. Prog. Neurobiol. 155, 57–75. [DOI] [PMC free article] [PubMed] [Google Scholar]
- Kierdorf K, and Prinz M (2013). Factors regulating microglia activation. Front. Cell. Neurosci. 7, 44. [DOI] [PMC free article] [PubMed] [Google Scholar]
- Klein-Szanto AJ, and Bassi DE (2017). Proprotein convertase inhibition: Paralyzing the cell’s master switches. Biochem. Pharmacol. 140, 8–15. [DOI] [PMC free article] [PubMed] [Google Scholar]
- Kohta M, Kohmura E, and Yamashita T (2009). Inhibition of TGF-β1 promotes functional recovery after spinal cord injury. Neurosci. Res. 65,393–401. [DOI] [PubMed] [Google Scholar]
- Kunnapuu J, Björkgren I, and Shimmi O (2009). The Drosophila DPP signal is produced by cleavage of its proprotein at evolutionary diversified furinrecognition sites. Proc. Natl. Acad. Sci. USA 106, 8501–8506. [DOI] [PMC free article] [PubMed] [Google Scholar]
- Lan X, Han X, Li Q, Yang Q-W, and Wang J (2017). Modulators of microglial activation and polarization after intracerebral haemorrhage. Nat. Rev. Neurol. 13, 420–433. [DOI] [PMC free article] [PubMed] [Google Scholar]
- Li H, Chaney S, Roberts IJ, Forte M, and Hirsh J (2000). Ectopic G-protein expression in dopamine and serotonin neurons blocks cocaine sensitization in Drosophila melanogaster. Curr. Biol. 10, 211–214. [DOI] [PubMed] [Google Scholar]
- Li J, Li WX, and Gelbart WM (2005). A genetic screen for maternal-effect suppressors of decapentaplegic identifies the eukaryotic translation initiation factor 4A in Drosophila. Genetics 171, 1629–1641. [DOI] [PMC free article] [PubMed] [Google Scholar]
- Liddelow SA, Guttenplan KA, Clarke LE, Bennett FC, Bohlen CJ, Schirmer L, Bennett ML, Münch AE, Chung W-S, Peterson TC, et al. (2017). Neurotoxic reactive astrocytes are induced by activated microglia. Nature 541, 481–487. [DOI] [PMC free article] [PubMed] [Google Scholar]
- Liu Z, Wang X, Yu Y, Li X, Wang T, Jiang H, Ren Q, Jiao Y, Sawa A, Moran T, et al. (2008). A Drosophila model for LRRK2-linked parkinsonism. Proc. Natl. Acad. Sci. USA 105, 2693–2698. [DOI] [PMC free article] [PubMed] [Google Scholar]
- Ma XM, and Blenis J (2009). Molecular mechanisms of mTOR-mediated translational control. Nat. Rev. Mol. Cell Biol. 10, 307–318. [DOI] [PubMed] [Google Scholar]
- Mao Z, and Davis RL (2009). Eight different types of dopaminergic neurons innervate the Drosophila mushroom body neuropil: anatomical and physiological heterogeneity. Front. Neural Circuits 3, 5. [DOI] [PMC free article] [PubMed] [Google Scholar]
- Martin I, Kim JW, Dawson VL, and Dawson TM (2014a). LRRK2 pathobiology in Parkinson’s disease. J. Neurochem. 131, 554–565. [DOI] [PMC free article] [PubMed] [Google Scholar]
- Martin I, Abalde-Atristain L, Kim JW, Dawson TM, and Dawson VL (2014b). Abberant protein synthesis in G2019S LRRK2 Drosophila Parkinson disease-related phenotypes. Fly (Austin) 8, 165–169. [DOI] [PMC free article] [PubMed] [Google Scholar]
- Martin I, Kim JW, Lee BD, Kang HC, Xu J-C, Jia H, Stankowski J, Kim M-S, Zhong J, Kumar M, et al. (2014c). Ribosomal protein s15 phosphorylation mediates LRRK2 neurodegeneration in Parkinson’s disease. Cell 157, 472–485. [DOI] [PMC free article] [PubMed] [Google Scholar]
- Massagué J, Seoane J, and Wotton D (2005). Smad transcription factors. Genes Dev. 19, 2783–2810. [DOI] [PubMed] [Google Scholar]
- Mata IF, Wedemeyer WJ, Farrer MJ, Taylor JP, and Gallo KA (2006). LRRK2 in Parkinson’s disease: protein domains and functional insights. Trends Neurosci. 29, 286–293. [DOI] [PubMed] [Google Scholar]
- McCabe BD, Marqués G, Haghighi AP, Fetter RD, Crotty ML, Haerry TE, Goodman CS, and O’Connor MB (2003). The BMP homolog Gbb provides a retrograde signal that regulates synaptic growth at the Drosophila neuromuscular junction. Neuron 39, 241–254. [DOI] [PubMed] [Google Scholar]
- McCabe BD, Hom S, Aberle H, Fetter RD, Marques G, Haerry TE, Wan H, O’Connor MB, Goodman CS, and Haghighi AP (2004). Highwire regulates presynaptic BMP signaling essential for synaptic growth. Neuron 41, 891–905. [DOI] [PubMed] [Google Scholar]
- Meyers EA, and Kessler JA (2017). TGF-β family signaling in neural and neuronal differentiation, development, and function. Cold Spring Harb. Perspect. Biol. 9, a022244. [DOI] [PMC free article] [PubMed] [Google Scholar]
- Molloy SS, Bresnahan PA, Leppla SH, Klimpel KR, and Thomas G (1992). Human furin is a calcium-dependent serine endoprotease that recognizes the sequence Arg-X-X-Arg and efficiently cleaves anthrax toxin protective antigen. J. Biol. Chem. 267, 16396–16402. [PubMed] [Google Scholar]
- Nahm M, Lee M-J, Parkinson W, Lee M, Kim H, Kim Y-J, Kim S, Cho YS, Min B-M, Bae YC, et al. (2013). Spartin regulates synaptic growth and neuronal survival by inhibiting BMP-mediated microtubule stabilization. Neuron 77, 680–695. [DOI] [PMC free article] [PubMed] [Google Scholar]
- Nellen D, Affolter M, and Basler K (1994). Receptor serine/threonine kinases implicated in the control of Drosophila body pattern by decapentaplegic. Cell 78, 225–237. [DOI] [PubMed] [Google Scholar]
- Ng C-H, Mok SZS, Koh C, Ouyang X, Fivaz ML, Tan E-K, Dawson VL, Dawson TM, Yu F, and Lim K-L (2009). Parkin protects against LRRK2 G2019S mutant-induced dopaminergic neurodegeneration in Drosophila. J. Neurosci. 29, 11257–11262. [DOI] [PMC free article] [PubMed] [Google Scholar]
- Osterwalder T, Yoon KS, White BH, and Keshishian H (2001). A conditional tissue-specific transgene expression system using inducible GAL4. Proc. Natl. Acad. Sci. USA 98, 12596–12601. [DOI] [PMC free article] [PubMed] [Google Scholar]
- Paisán-Ruíz C, Jain S, Evans EW, Gilks WP, Simeón J, van der Brug M, López de Munain A, Aparicio S, Gil AM, Khan N, et al. (2004). Cloning of the gene containing mutations that cause PARK8-linked Parkinson’s disease. Neuron 44, 595–600. [DOI] [PubMed] [Google Scholar]
- Parks AL, Cook KR, Belvin M, Dompe NA, Fawcett R, Huppert K, Tan LR, Winter CG, Bogart KP, Deal JE, et al. (2004). Systematic generation of high-resolution deletion coverage of the Drosophila melanogaster genome. Nat. Genet. 36, 288–292. [DOI] [PubMed] [Google Scholar]
- Penney J, Tsurudome K, Liao EH, Elazzouzi F, Livingstone M, Gonzalez M, Sonenberg N, and Haghighi AP (2012). TOR is required for the retrograde regulation of synaptic homeostasis at the Drosophila neuromuscular junction. Neuron 74, 166–178. [DOI] [PubMed] [Google Scholar]
- Penney J, Tsurudome K, Liao EH, Kauwe G, Gray L, Yanagiya A, R Calderon M, Sonenberg N, and Haghighi AP (2016). LRRK2 regulates retrograde synaptic compensation at the Drosophila neuromuscular junction. Nat. Commun. 7, 12188. [DOI] [PMC free article] [PubMed] [Google Scholar]
- Perkins LA, Holderbaum L, Tao R, Hu Y, Sopko R, McCall K, Yang-Zhou D, Flockhart I, Binari R, Shim H-S, et al. (2015). The transgenic RNAi project at Harvard Medical School: resources and validation. Genetics 201,843–852. [DOI] [PMC free article] [PubMed] [Google Scholar]
- Price A, Manzoni C, Cookson MR, and Lewis PA (2018). The LRRK2 signalling system. Cell Tissue Res. 373, 39–50. [DOI] [PMC free article] [PubMed] [Google Scholar]
- Raftery LA, Twombly V, Wharton K, and Gelbart WM (1995). Genetic screens to identify elements of the decapentaplegic signaling pathway in Drosophila. Genetics 139, 241–254. [DOI] [PMC free article] [PubMed] [Google Scholar]
- Reuter G, and Szidonya J (1983). Cytogenetic analysis of variegation suppressors and a dominant temperature-sensitive lethal in region 23-26 of chromosome 2L in Drosophila melanogaster. Chromosoma 88, 277–285. [DOI] [PubMed] [Google Scholar]
- Roebroek AJ, Creemers JW, Pauli IG, Bogaert T, and Van de Ven WJ (1993). Generation of structural and functional diversity in furin-like proteins in Drosophila melanogaster by alternative splicing of the Dfur1 gene. EMBO J. 12, 1853–1870. [DOI] [PMC free article] [PubMed] [Google Scholar]
- Sánchez-Capelo A, Colin P, Guibert B, Biguet NF, and Mallet J (2003). Transforming growth factor β1 overexpression in the nigrostriatal system increases the dopaminergic deficit of MPTP mice. Mol. Cell. Neurosci. 23, 614–625. [DOI] [PubMed] [Google Scholar]
- Schindelin J, Arganda-Carreras I, Frise E, Kaynig V, Longair M, Pietzsch T, Preibisch S, Rueden C, Saalfeld S, Schmid B, et al. (2012). Fiji: an open-source platform for biological-image analysis. Nat. Methods 9, 676–682. [DOI] [PMC free article] [PubMed] [Google Scholar]
- Sepp KJ, Schulte J, and Auld VJ (2001). Peripheral glia direct axon guidance across the CNS/PNS transition zone. Dev. Biol. 238, 47–63. [DOI] [PubMed] [Google Scholar]
- Shi Y, and Massagué J (2003). Mechanisms of TGF-β signaling from cell membrane to the nucleus. Cell 113, 685–700. [DOI] [PubMed] [Google Scholar]
- Shukla AK, Ratnasekhar C, Pragya P, Chaouhan HS, Patel DK, Chowdhuri DK, and Mudiam MKR (2014). Metabolomic analysis provides insights on paraquat-induced Parkinson-like symptoms in Drosophila melanogaster. Mol. Neurobiol. 53, 254–269. [DOI] [PubMed] [Google Scholar]
- Smith RB, Machamer JB, Kim NC, Hays TS, and Marqués G (2012). Relay of retrograde synaptogenic signals through axonal transport of BMP receptors. J. Cell Sci. 125, 3752–3764. [DOI] [PMC free article] [PubMed] [Google Scholar]
- Subramaniam SR, and Federoff HJ (2017). Targeting microglial activation states as a therapeutic avenue in Parkinson’s disease. Front. Aging Neurosci. 9, 176. [DOI] [PMC free article] [PubMed] [Google Scholar]
- Tain LS, Mortiboys H, Tao RN, Ziviani E, Bandmann O, and Whitworth AJ (2009). Rapamycin activation of 4E-BP prevents parkinsonian dopaminergic neuron loss. Nat. Neurosci. 12, 1129–1135. [DOI] [PMC free article] [PubMed] [Google Scholar]
- Taymans J-M, Nkiliza A, and Chartier-Harlin M-C (2015). Deregulation of protein translation control, a potential game-changing hypothesis for Parkinson’s disease pathogenesis. Trends Mol. Med. 21, 466–472. [DOI] [PubMed] [Google Scholar]
- Teleman AA, Chen Y-W, and Cohen SM (2005). 4E-BP functions as a metabolic brake used under stress conditions but not during normal growth. Genes Dev. 19, 1844–1848. [DOI] [PMC free article] [PubMed] [Google Scholar]
- Tesseur I, and Wyss-Coray T (2006). A role for TGF-beta signaling in neurodegeneration: evidence from genetically engineered models. Curr. Alzheimer Res. 3, 505–513. [DOI] [PubMed] [Google Scholar]
- Tesseur I, Zou K, Esposito L, Bard F, Berber E, Can JV, Lin AH, Crews L, Tremblay P, Mathews P, et al. (2006). Deficiency in neuronal TGF-beta signaling promotes neurodegeneration and Alzheimer’s pathology. J. Clin. Invest. 116, 3060–3069. [DOI] [PMC free article] [PubMed] [Google Scholar]
- Tesseur I, Nguyen A, Chang B, Li L, Woodling NS, Wyss-Coray T, and Luo J (2017). Deficiency in neuronal TGF-β signaling leads to nigrostriatal degeneration and activation of TGF-β signaling protects against MPTP neurotoxicity in mice. J. Neurosci. 37, 4584–4592. [DOI] [PMC free article] [PubMed] [Google Scholar]
- Venderova K, Kabbach G, Abdel-Messih E, Zhang Y, Parks RJ, Imai Y, Gehrke S, Ngsee J, Lavoie MJ, Slack RS, et al. (2009). Leucine-rich repeat kinase 2 interacts with Parkin, DJ-1 and PINK-1 in a Drosophila melanogaster model of Parkinson’s disease. Hum. Mol. Genet. 18, 4390–4404. [DOI] [PubMed] [Google Scholar]
- Wallings R, Manzoni C, and Bandopadhyay R (2015). Cellular processes associated with LRRK2 function and dysfunction. FEBS J. 282, 2806–2826. [DOI] [PMC free article] [PubMed] [Google Scholar]
- Wrana JL, Attisano L, Wieser R, Ventura F, and Massagué J (1994). Mechanism of activation of the TGF-β receptor. Nature 370, 341–347. [DOI] [PubMed] [Google Scholar]
- Wyss-Coray T, Borrow P, Brooker MJ, and Mucke L (1997). Astroglial overproduction of TGF-β 1 enhances inflammatory central nervous system disease in transgenic mice. J. Neuroimmunol. 77, 45–50. [DOI] [PubMed] [Google Scholar]
- Wyss-Coray T, Lin C, Yan F, Yu G-Q, Rohde M, McConlogue L, Mas- liah E, and Mucke L (2001). TGF-β1 promotes microglial amyloid-β clearance and reduces plaque burden in transgenic mice. Nat. Med. 7, 612–618. [DOI] [PubMed] [Google Scholar]
- Yarfitz S, Niemi GA, McConnell JL, Fitch CL, and Hurley JB (1991). A G beta protein in the Drosophila compound eye is different from that in the brain. Neuron 7, 429–438. [DOI] [PubMed] [Google Scholar]
- Zimprich A, Biskup S, Leitner P, Lichtner P, Farrer M, Lincoln S, Kachergus J, Hulihan M, Uitti RJ, Calne DB, et al. (2004). Mutations in LRRK2 cause autosomal-dominant parkinsonism with pleomorphic pathology. Neuron 44, 601–607. [DOI] [PubMed] [Google Scholar]
Associated Data
This section collects any data citations, data availability statements, or supplementary materials included in this article.