

Abstract
Background
Poor lower extremity physical performance is an independent predictor of unfavorable outcome in patients with peripheral artery disease (PAD); however, few studies have assessed muscle characteristics on imaging directly.
Method and Results
A novel 3‐dimensional semi‐automated protocol was developed to estimate leg muscle volume and density (mean attenuation) from computed tomography images. Patients with PAD who underwent a lower extremity computed tomography scan at a tertiary vascular surgery center were included, and were followed up using hospital records and linked data as part of a retrospective cohort study. The primary outcomes were lower limb events (major amputation or peripheral revascularization) and cardiovascular events (myocardial infarction, stroke, or cardiovascular death). Two hundred and twenty‐three patients with PAD were included (median age 69.0 years; 73% men) and followed for a median of 4.9 [2.6–7.0] years. During this time there were 99 index lower limb events and 97 cardiovascular events. Low leg muscle density was associated with increased risk of lower limb (rate ratio 1.41 [1.11–1.80] per SD reduction) and cardiovascular events (rate ratio 1.60 [1.29–1.99] per SD reduction). Low muscle density remained an independent predictor of cardiovascular (but not lower limb) events, after adjusting for age, sex, traditional cardiovascular risk factors, and angiographic PAD severity (rate ratio 1.39 [1.09–1.77] per lower SD). In contrast, leg muscle volume was not associated with outcomes after adjusting for risk factors and PAD severity.
Conclusions
Low leg muscle density, but not volume, is a strong, independent predictor of major cardiovascular events among people with PAD. Further research is needed to understand the mechanisms underlying these associations.
Keywords: lower limb skeletal muscle, peripheral artery disease, prognosis
Subject Categories: Peripheral Vascular Disease, Prognosis, Computerized Tomography (CT), Exercise Testing
Clinical Perspective
What Is New?
Poor lower extremity physical performance is an independent predictor of cardiovascular events in patients with peripheral artery disease; however, few studies have assessed leg muscle imaging characteristics directly.
In this study, a novel 3‐dimensional semi‐automated protocol was developed to measure leg muscle characteristics in patients with peripheral artery disease.
Low leg muscle density was a strong predictor of both adverse lower limb and cardiovascular events.
What Are the Clinical Implications?
Further research is needed to better understand the reasons for the association between low leg muscle density and cardiovascular events among patients with peripheral artery disease, and to identify interventions that uniquely improve leg muscle density.
Introduction
Peripheral artery disease (PAD) is an important cause of premature death and disability, affecting over 200 million people worldwide.1, 2 Patients with PAD have increased risk of leg amputation and cardiovascular events, such as myocardial infarction, stroke, and cardiovascular death.3, 4 Even with current effective medical therapy, the risk of cardiovascular events is ≈3 times higher in patients with PAD compared with age‐ and sex‐ matched controls.5, 6 More effective treatments are needed to reduce the high risk of lower limb and cardiovascular events in this population.
People with PAD experience debilitating lower limb symptoms, including intermittent claudication, rest pain, arterial ulcers and gangrene, which severely limit their physical activity.7 Randomized clinical trials demonstrate that supervised exercise therapy and home‐based exercise interventions improve walking performance in patients with PAD.8, 9, 10, 11 However, PAD exercise programs are not widely available in most countries, possibly because of limited evidence on the long‐term effects of exercise programs on lower limb and cardiovascular events.12 Several studies suggest that lower limb strength is a strong predictor of clinical outcome in patients with PAD, but there is limited evidence on the direct associations of leg muscle characteristics and PAD outcomes.13, 14, 15 Better understanding of the prognostic significance of particular leg muscle characteristics might help guide the development of effective treatments, such as particular exercise modes, to improve PAD outcomes.16 The aim of this study was to assess the association of computed tomography (CT)–measured leg muscle characteristics with adverse lower limb and cardiovascular events in patients with PAD.
Methods
Study Population
This was a retrospective study of individuals presenting to a vascular surgery department at a single tertiary hospital in Queensland, Australia, between May 2004 and September 2012. Inclusion criteria for the study were the following: (1) lower extremity CT angiogram conducted as part of routine clinical assessment; (2) evidence of PAD on the CT angiogram defined as ≥50% stenosis in at least 1 lower limb artery; and (3) at least 1 follow‐up assessment as an inpatient or outpatient. Patients were excluded if they had not received CT, had undergone a major lower‐limb amputation before CT, or had an angiogram that was of poor quality or included imaging artifact (for example, from prosthetic implants). The study, including a waiver of consent, was approved by the Townsville Hospital and Health Service Human Research Ethics Committee (HREC/12/QTHS/75; SA/12/QTHS/131) and James Cook University (H4947). Public Health Act approval was obtained, including approval to obtain data from the Queensland Health Admitted Patient Data Collection and the Queensland death register (RD004829; RD005150). The data that support the findings of this study are available from the corresponding author upon reasonable request by bona fide academic researchers.
Clinical characteristics collected included presenting symptoms, age, sex, diabetes mellitus, hypertension, smoking history, ischemic heart disease, stroke, and current medications. Definitions for each of these variables are included in the Supplementary Methods (Data S1). Intermittent claudication was defined as exertional lower‐extremity muscle pain that caused the participant to stop walking and resolved with rest. Critical limb ischemia was defined as rest pain, arterial ulcers or gangrene, attributable to objectively confirmed occlusive PAD in line with international guidelines.17 Patients who did not have classical symptoms of PAD (intermittent claudication, rest pain, tissue loss) were categorized into a group termed atypical symptoms. This group also included patients who had imaging evidence of PAD (stenosis ≥50% in 1 major lower limb artery) and underwent CT angiography for assessment of peripheral aneurysms.
Ankle–Brachial Pressure Index Measurement
Ankle–brachial pressure index (ABI) was assessed by qualified vascular sonographers in a subgroup of the total sample, using previously validated methods.18 Measurements were performed within 12 months of the date of the CT scan and before any revascularization procedure (further details in the Supplementary Methods).
CT Image Acquisition
Lower‐limb CT scans were requested as part of the clinical care of the patients when peripheral revascularization was being considered, or as part of investigation of concurrent abdominal aortic aneurysm or lower‐limb arterial aneurysm in patients with concurrent PAD. CT scans were performed using a 64‐slice multiscanner (Philips, North Ryde, New South Wales, Australia) with 3‐mm axial slice thickness under a set acquisition protocol.19 Images were transferred to a dedicated workstation with OsiriX 64‐bit software (version 5.8.1, Pixmeo, Geneva, Switzerland) for analysis.
Assessment of PAD Severity From CT Angiograms
PAD severity was assessed using the ANGIO Score as previously reported.19 In brief, the ANGIO Score represents a novel method to quantify PAD severity through analysis of CT angiogram images. A higher ANGIO Score indicates more severe PAD (see Supplementary Methods). Patients were also classified according to whether or not they had an occlusion of the aorta or iliac arteries (defined as occlusion of aorto‐iliac arteries), common femoral, superficial femoral, or popliteal arteries (defined as occlusion of the femoro‐popliteal arteries) or anterior tibial, posterior tibial, or peroneal arteries (defined as occlusion of the infragenicular arteries) in the study leg. For the purposes of statistical analysis, the study leg was chosen as the side with the highest severity of PAD as judged by the unilateral ANGIO Score. If both lower limbs had the same ANGIO Score values or ANGIO Score measurements were not undertaken because of artifact, then the study side was assigned to the right leg.
Leg Muscle Assessment From CT Images
A protocol was developed to measure leg muscle volume and radiological density (mean attenuation). Muscles imaged within axial CT slices between the tibial tuberosity and the ankle joint were included. For each of these slices, regions of interest (ROIs) were constructed around the outside of visible muscle tissue on the axial view. The ROI was defined as the area from the deep fascia superficially to (but not including) the periosteum of the relevant bones. The appropriate positioning of the ROI was checked, and if required adjusted, by examining multiple axial slices from the CT images. All tissue not included within the ROI was excluded. Finally, muscle within the ROI was isolated by applying a previously defined radiological threshold (window level, 50 Hounsfield units [HU]; window width, 100 HU) within the attenuation range for skeletal muscle.20, 21 The inbuilt “Calculate Volume” tool was applied to estimate the volume and average radiological density of the muscle within the 3‐dimensional reconstruction (Figure 1). Leg muscle volumes were standardized to the total volume of leg tissue between the tibial tuberosity and ankle joint to adjust for differences in body size, and reported as percentage muscle volume. Leg muscle density was reported in HU, which is a measure of radiological density. Formal reproducibility assessment of the CT leg muscle measurements was performed by researchers who were blinded to each other's measurements (see Supplementary Methods).22
Figure 1.
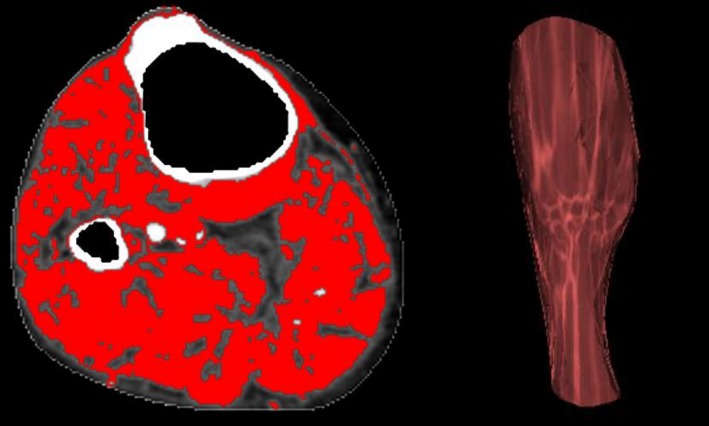
CT assessment of leg muscle characteristics. Example of the assessment of leg muscle characteristics from CT imaging. CT indicates computed tomography.
Follow‐Up and Outcomes
Patients were followed up through attendance at outpatient clinics and as an inpatient as part of their normal medical care as previously described.23, 24, 25 Charts and hospital electronic records of patients were reviewed by a vascular specialist. Data were also linked with hospital admission records obtained from the Queensland Health Admitted Patient Data Collection and the Queensland death register (Data S1).19, 26 The primary outcomes of the study were the following: (1) major lower limb events, defined as any major lower‐limb amputation (ie, above or below the knee), or a lower‐limb revascularization procedure, such as bypass or stenting; and (2) major cardiovascular events, defined as myocardial infarction, stroke, or cardiovascular death.
Statistical Analyses
Sample size estimates suggested that ≈200 patients would be sufficient to detect important associations between skeletal muscle characteristics and the primary outcomes (see Supplementary Methods).27 Continuous data were generally not normally distributed according to histograms and skewness and kurtosis tests. Therefore, they were presented as median and interquartile range, and were compared using Mann–Whitney or Kruskal–Wallis tests as appropriate. Categorical data were presented as absolute numbers and percentages, and were compared using Pearson's χ2 test.
The associations between leg muscle characteristics and ANGIO Score were assessed using the Kruskal–Wallis test by categorizing ANGIO Score into tertiles. The association between muscle characteristics and ABI was assessed using Spearman's rho for correlation, and Kruskal–Wallis test for association with clinically relevant ABI groups (ABI <0.5, ABI ≥0.5 and <0.9, ABI ≥0.9 and <1.4).
Kaplan–Meier curves and multivariate Cox regression were used to assess the associations of muscle characteristics with the primary composite outcomes. Follow‐up time was defined as the time between the date of the initial CT scan and occurrence of the first event, or last clinical review. Patients who did not have a primary event were censored at the time of death or at their last recorded follow‐up (up until May 5, 2017, after when data were cleaned and analyzed). Kaplan–Meier curves were used to illustrate the risk of lower limb and cardiovascular events across tertiles of leg muscle volume and density. Multivariate Cox proportional hazard analysis was then used to assess the association of muscle characteristics with primary outcome events, adjusting for relevant confounding variables. Muscle characteristics were grouped into tertiles according to equal numbers of outcome events, and rate ratios (RR) for these categories were plotted against the mean baseline values of each group. This allowed assessment of both strength and pattern of associations. When several groups were being compared with each other, the variance of the log risk in each group (including the reference group) was calculated from the variances and covariances of the log RR values. This yielded group‐specific confidence intervals (CIs) for each group (including the reference group) that described the effect of chance on the log risk in that 1 group. It also yielded comparisons across groups that were unaffected by the choice of reference group.28, 29 Analyses of continuous exposures were conducted and standardized to a 1 SD difference in muscle volume or density. Proportional hazards assumptions were confirmed by the Schoenfeld residuals test, with no violations identified. Additional sensitivity analyses assessed the robustness of the associations with major lower limb amputation outcomes, in a lower‐risk subgroup without critical limb ischemia, after excluding the first 6 months of follow‐up and limiting cardiovascular events to non‐perioperative events (by excluding follow‐up after lower‐limb revascularization or major amputation). Analyses were conducted using STATA version 15.1 (StataCorp, College Station, TX), and graphics were produced with the R statistical package, version 3.4.4 (http://www.r-project.org/). All statistical tests were 2‐sided and a P value of <0.05 was considered significant.
Results
Population Characteristics
Two hundred sixty patients with PAD were initially included; however, 37 were later excluded because of inadequate views (n=29), joint prosthesis (n=4), major amputation (n=3), or fracture (n=1), making accurate assessment of the CT images impossible. Ultimately 223 patients were included, of whom 124 (56%) presented with intermittent claudication, 48 (21%) had tissue loss, 35 (16%) had atypical presentations, 11 (5%) had rest pain, and 5 (2%) had acute limb ischemia. The median age of the population was 69.0 [60.8–74.2] years, and 73% of patients were male. Over 40% of patients were current smokers. Regarding medical therapy, 76% of patients were receiving antiplatelet therapy, 70% were taking blood pressure–lowering therapy, and 67% were prescribed a statin. Detailed baseline characteristics of the cohort are shown in Table 1.
Table 1.
Characteristics of Patients With PAD Included in This Study in Relation to CT‐Measured Leg Muscle Density Tertiles
| Characteristic | Leg Muscle Density Tertiles | P Value | ||
|---|---|---|---|---|
| Tertile 1 (n=59) | Tertile 2 (n=74) | Tertile 3 (n=90) | ||
| Age, ya | 71.6 [66.8–77.7] | 67.3 [60.3–74.5] | 64.7 [58.0–72.5] | <0.001 |
| Sex (% males) | 49 (83) | 55 (74) | 59 (66) | 0.060 |
| Diabetes mellitus | 26 (44) | 25 (34) | 31 (34) | 0.398 |
| Current smokers | 21 (36) | 36 (49) | 39 (43) | 0.318 |
| Hypertension | 28 (47) | 24 (32) | 40 (44) | 0.606 |
| IHD | 33 (56) | 40 (54) | 42 (47) | 0.473 |
| Stroke | 6 (11) | 9 (12) | 11 (12) | 0.935 |
| Medications | ||||
| Aspirin | 39 (67) | 49 (66) | 70 (78) | 0.198 |
| Other antiplatelet | 10 (17) | 8 (11) | 13 (14) | 0.563 |
| Warfarin | 12 (21) | 13 (18) | 6 (7) | 0.031 |
| Statin | 36 (62) | 54 (73) | 58 (64) | 0.354 |
| ACEI or ARB | 37 (64) | 41 (55) | 51 (57) | 0.586 |
| β‐Blocker | 24 (41) | 21 (28) | 26 (29) | 0.203 |
| CCB | 9 (16) | 22 (30) | 31 (34) | 0.040 |
| Metformin | 9 (16) | 15 (20) | 16 (18) | 0.778 |
| Insulin | 6 (10) | 12 (16) | 5 (6) | 0.083 |
Values are frequency and percentage unless otherwise specified. Tertiles of leg muscle density grouped according to equal numbers of major cardiovascular events. Medication history missing for 1 patient; stroke history missing in 2 patients. ACEI indicates angiotensin‐converting enzyme inhibitor; ARB, angiotensin receptor blocker; CCB, calcium channel blocker; CT, computed tomography; IHD, ischemic heart disease; PAD, peripheral artery disease.
Reported as median and interquartile range.
Reproducibility of the CT Muscle Measurements
Leg muscle volume and density measurements were highly reproducible. The concordance correlation coefficients were >99% for both intraobserver and interobserver measurements, with mean differences of <1% and 0.1 HU for leg muscle volume and density, respectively (Table S1). Intra‐ and interobserver repeatability were consistent across the range of muscle measurements assessed (Figures S1 through S3).
Association of Presenting Symptoms and PAD Severity With CT Muscle Characteristics
Figure 2 shows muscle characteristics for common PAD presentations. Patients with tissue loss had significantly lower leg muscle volume and density than those with intermittent claudication (P<0.001 for both). People with atypical symptoms had lower calf muscle volume (P=0.017), but similar muscle density (P=0.115) to people with intermittent claudication. Interestingly, those with rest pain had similar muscle characteristics to patients with intermittent claudication. More severe peripheral athero‐occlusive disease, measured using the ANGIO Score, was associated with significantly lower leg muscle density, but not muscle volume (Table 2). Many patients (44%) had arterial occlusions at multiple levels. Those with occlusions of the infragenicular arteries had significantly lower leg muscle volume (P<0.001) and density (P=0.002) than those without occluded infragenicular arteries. Interestingly, there was no association between aorto‐iliac or femoropopliteal occlusions and leg muscle volume or density (Table 3). ABI measurements were performed in some of the patients (n=41) near the time of CT imaging (median of 1 day [0–25 days]). ABI was not associated with leg muscle characteristics (Tables S2 and S3).
Figure 2.
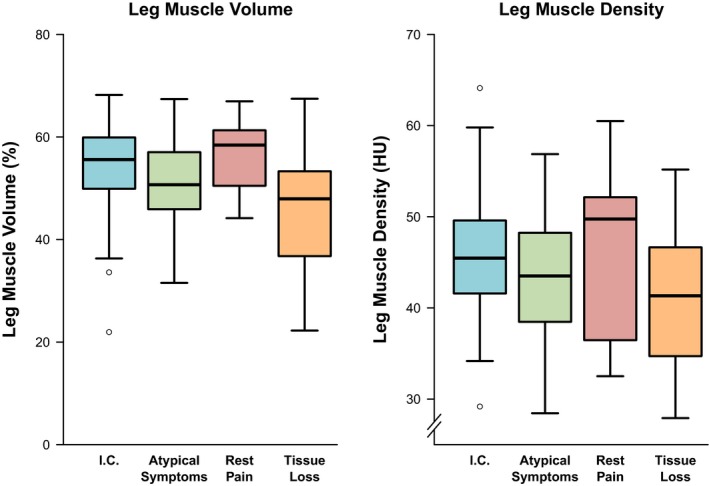
Association between PAD presentation and CT leg muscle characteristics. Box plots are shown illustrating lower limb muscle characteristics according to PAD presentation. The thick band illustrates the median, the box shows the interquartile range, and the whiskers demonstrate the farthest data points that are not outliers. Acute limb ischemia was not included because of insufficient numbers (n=5). CT indicates computed tomography; HU, Hounsfield units; I.C., intermittent claudication; PAD, peripheral artery disease.
Table 2.
Association of ANGIO Score Categories With Leg CT Muscle Characteristics
| Leg CT Muscle Characteristic | Tertile 1 (n=57) | Tertile 2 (n=70) | Tertile 3 (n=74) | P Valuea |
|---|---|---|---|---|
| Leg muscle volume, % | 54.8 [48.7–61.5] | 52.4 [45.9–58.8] | 51.8 [45.3–58.3] | 0.214 |
| Leg muscle density (HU) | 45.6 [41.9–50.7] | 45.2 [39.8–49.4] | 41.6 [35.7–46.3] | 0.003 |
Values are median [interquartile range]. Analysis includes 201 patients who had both leg muscle measurements and ANGIO Score assessment on CT. Tertiles of leg muscle characteristics are grouped according to equal numbers of major cardiovascular events. CT indicates computed tomography; HU, Hounsfield units.
Kruskal–Wallis test.
Table 3.
Lower Limb Skeletal Muscle Characteristics in Relation to Location of Peripheral Artery Occlusions
| Occlusion | No Occlusion | P Value | |||
|---|---|---|---|---|---|
| N | Median [IQR] | N | Median [IQR] | ||
| Leg muscle volume, % | |||||
| Aorto‐iliac arteries | 56 | 54.5 [43.5–60.6] | 145 | 52.1 [46.1–58.6] | 0.391 |
| Femoro‐popliteal arteries | 85 | 54.2 [49.0–59.4] | 116 | 51.7 [44.0–59.2] | 0.140 |
| Infragenicular arteries | 125 | 50.3 [44.1–57.5] | 76 | 57.7 [50.6–61.7] | <0.001 |
| Leg muscle density (HU) | |||||
| Aorto‐iliac arteries | 56 | 44.5 [41.3–50.4] | 145 | 43.5 [37.7–48.7] | 0.149 |
| Femoro‐popliteal arteries | 85 | 44.4 [38.3–49.8] | 116 | 43.4 [38.7–48.1] | 0.279 |
| Infragenicular arteries | 125 | 42.3 [36.1–48.1] | 76 | 46.1 [41.6–50.2] | 0.002 |
Analysis of 201 patients who had both leg muscle measurements and ANGIO Score assessment on CT. Skeletal muscle characteristics were compared with arterial occlusions in the same leg. CT indicates computed tomography; HU, Hounsfield units; IQR, interquartile range.
CT Leg Muscle Characteristics and Risk of Lower Limb Events
Patients were followed up for a median of 4.9 [2.6–7.0] years after CT imaging. During this time 92 patients (41%) had at least 1 lower limb arterial revascularization procedure, including 70 endovascular interventions and 46 open operations (some patients had multiple revascularizations). Seventeen patients required a major lower limb amputation, of which 10 were below‐knee amputations and 7 were above‐knee amputations. Overall 99 (44%) patients had at least 1 lower limb event. There was a strong association between leg muscle density and lower limb events (Figure 3). Patients in the lowest tertile of muscle density had a 3‐fold higher risk of revascularization or major amputation (RR 2.87; 95% CI, 1.89–4.34) than those in the highest tertile. Each SD decrease in leg muscle density (7.3 HU) was associated with a 40% higher risk of lower limb events (RR 1.41; CI, 1.11–1.80). The association was lost after adjustment for cardiovascular risk factors and ANGIO Score. In contrast, there was no association between leg muscle volume and lower limb events (Figure S4).
Figure 3.
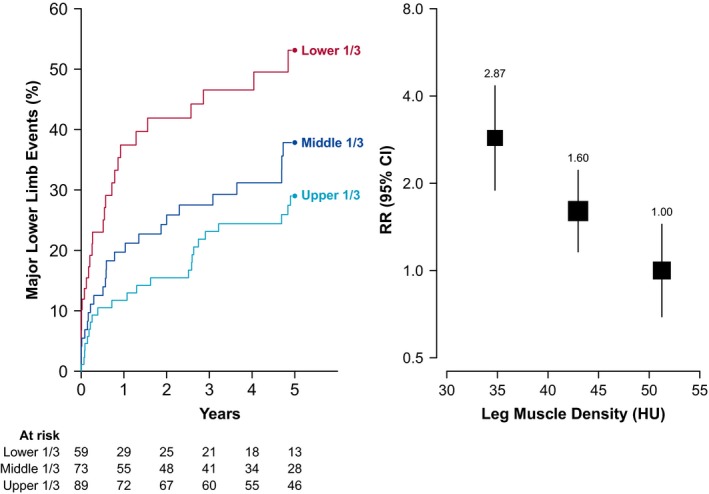
Association between leg muscle density and lower limb events among people with PAD. Left panel shows the risk of lower‐limb events over time according to leg muscle density tertile. Right panel shows the relative risk of lower‐limb events by density tertile, adjusted for age and sex. The size of the box and vertical lines represent the 95% confidence intervals calculated from the variance of the log risk. CI indicates confidence interval; HU, Hounsfield units; PAD, peripheral artery disease; RR, rate ratio.
Leg Muscle Characteristics and Risk of Cardiovascular Events
Ninety‐seven patients (43%) had at least 1 cardiovascular event during follow‐up, comprising 33 myocardial infarctions, 24 strokes, and 40 cardiovascular deaths. Leg muscle density was significantly associated with risk of cardiovascular events (Figure 4). People in the lowest tertile of density had 3 times the risk of cardiovascular events of those in the highest tertile (RR, 3.03; CI, 2.09–4.39). Each SD reduction in leg muscle density (7.3 HU) was associated with a 60% higher risk of cardiovascular events (RR, 1.60; CI, 1.29–1.99), and remained a strong predictor of cardiovascular events after adjusting for cardiovascular risk factors and angiographic PAD severity (Figure 5). In contrast, the association of leg muscle volume with cardiovascular events was only half as strong (RR 1.31, CI, 1.05–1.63; per 1 SD lower muscle volume), and disappeared after adjusting for additional confounders (Figure 5, Figure S5).
Figure 4.
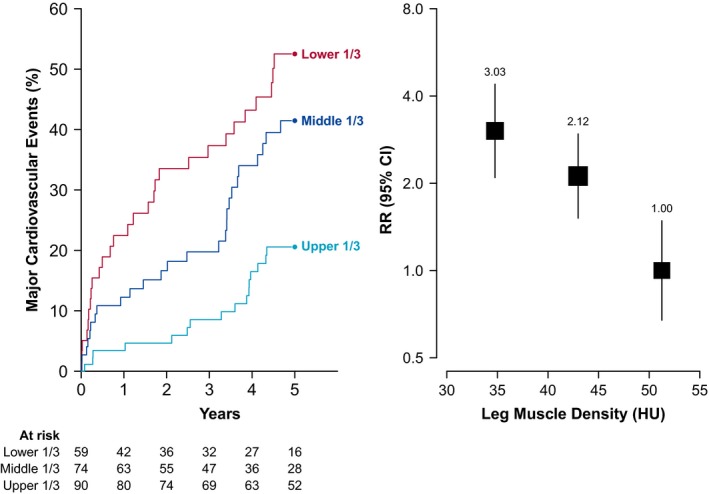
Association between leg muscle density and cardiovascular events among people with PAD. Left panel shows the risk of cardiovascular events over time according to leg muscle density tertile. Right panel shows the relative risk of cardiovascular events by density tertile, adjusted for age and sex. The size of the box and vertical lines represent the 95% confidence intervals calculated from the variance of the log risk. CI indicates confidence interval; HU, Hounsfield units; PAD, peripheral artery disease; RR, rate ratio.
Figure 5.
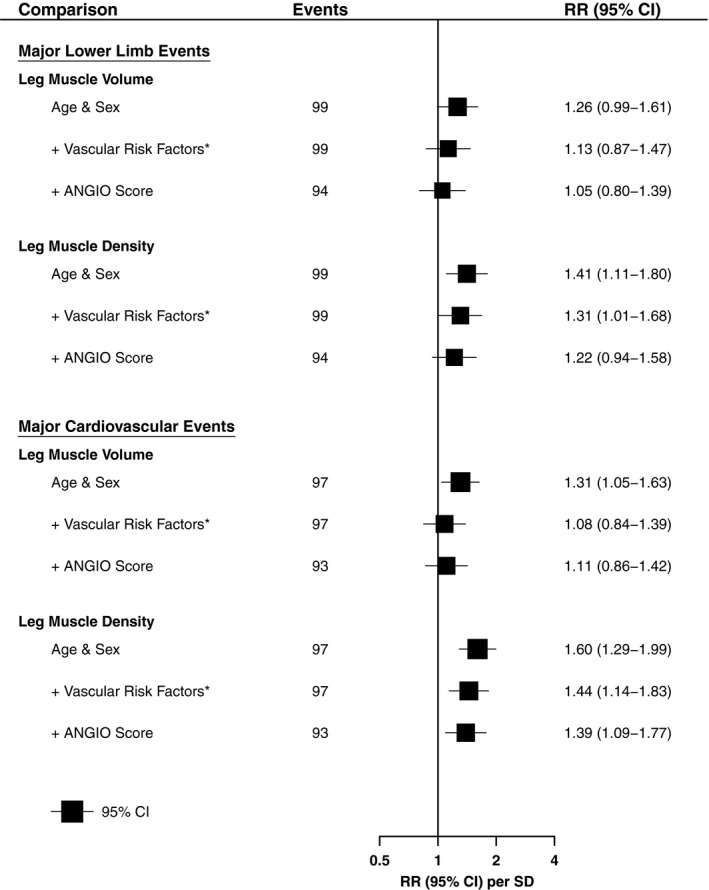
Association of leg muscle characteristics and major adverse events, adjusted for different risk factors. Shown are RRs and 95% CIs per SD difference (lower) in muscle characteristics with different statistical adjustments. Lower‐limb event defined as any major lower‐limb amputation (above‐ or below‐knee), or peripheral revascularization. Cardiovascular event defined as any non‐fatal myocardial infarction, non‐fatal stroke, or cardiovascular death. *Additional adjustment for clinical presentation, smoking history, diabetes mellitus, ischemic heart disease, prior stroke, and statin use. CI indicates confidence interval; SD, standard deviation; RR, rate ratio.
Sensitivity Analyses
Sensitivity analyses demonstrated that leg muscle density was also significantly associated with major lower limb amputations after adjusting for age and sex (density: RR 1.76, CI, 1.02–3.06, per lower SD; Figure S6). The association between leg muscle density and cardiovascular events remained after restricting the comparison to patients without critical limb ischemia (intermittent claudication or atypical leg symptoms only; Figure S7). In contrast, leg muscle density was no longer associated with major lower limb events after excluding people with critical limb ischemia (Figure S8). The associations between low leg muscle density and outcome remained after excluding the first 6 months of follow‐up (Figures S9 and S10), and when considering only non‐perioperative cardiovascular events (Figure S11).
Discussion
This study showed strong associations between low leg muscle density and important clinical events in a high‐risk PAD population. Patients in the lowest tertile of muscle density had 3 times the risk of lower‐limb events and cardiovascular events of those in the highest tertile of muscle density. The association of muscle density with cardiovascular (but not lower limb) events remained after adjusting for cardiovascular risk factors and angiographic PAD severity, suggesting that low leg muscle density is an independent predictor of worse cardiovascular outcome in this population.
This is the first study to report a highly reproducible method of assessing 3‐dimensional CT leg muscle characteristics in patients with PAD. Lower extremity muscle characteristics have previously been assessed on a single slice on cross‐sectional imaging,14 which might not be representative of the entire leg musculature. In the prospective WALCS II (Walking and Leg Circulation Study), lower‐leg muscle cross‐sectional density, but not area was associated with a significantly higher risk of cardiovascular mortality.14 People in the lowest tertile of cross‐sectional muscle density had triple the cardiovascular death risk of those in the highest tertile, consistent with the present study. Interestingly, leg muscle size was not associated with cardiovascular death in WALCS II, but was moderately associated with cardiovascular events in the present study after adjusting for age and sex. This could be because of the larger number of cardiovascular outcome events in the current study. Leg CT muscle characteristics do not appear to be associated with cardiovascular events in the general population. The InChianti study of 934 community‐dwelling people found no association between cross‐sectional calf muscle density or size with mortality after adjusting for age and sex,30 suggesting that the prognostic value of leg muscle density may be unique to patients with PAD.
Interestingly, low leg muscle density, but not volume, was independently associated with risk of major cardiovascular events. Previous studies demonstrate that decline in muscle strength in older adults is much more rapid than concomitant loss of muscle mass.31 This could explain why low muscle density, but not volume, was independently associated with risk of major cardiovascular events. Another possible explanation is that low muscle density may result from myocyte fat infiltration, which could influence cardiometabolic risk through pro‐inflammatory adipokines.32 Factors contributing to muscle density on CT imaging are not well established. Biopsy studies suggest that patients with PAD have a lower proportion of type I muscle fibers, reduced capillary density, increased muscle apoptosis, and mitochondrial dysfunction.33, 34, 35, 36 Moreover, the average type I muscle fiber size and mitochondrial activity correlate strongly with 6‐minute walking distance.37 The lower muscle density in patients with more severe PAD, as assessed from CT angiography, likely reflects these muscle phenotype characteristics of patients with PAD. Currently no research has been performed to assess the effect of established PAD treatments, such as exercise, or novel approaches, such as mitochondrial‐modifying drugs, on leg muscle phenotype in patients with PAD, making this an important area for future PAD research.16, 38
A number of possible explanations exist for the association between low leg muscle density and cardiovascular events. It is possible that this association simply reflects a negative correlation between leg muscle density and severity of coronary and cerebrovascular atherosclerosis, as was the case for peripheral atherosclerosis. The association of low muscle density with cardiovascular events remained after adjusting for established cardiovascular risk factors and the severity of PAD, as estimated by the ANGIO Score. This suggests that either a factor we did not adjust for, such as physical activity, or an intrinsic effect of the leg muscle phenotype that occurs in patients with PAD, is responsible for this association. There is some preliminary evidence suggesting that skeletal muscle itself has functional roles that may act to reduce cardiovascular risk.39 For example, preclinical studies demonstrate that healthy muscle secretes an array of anti‐inflammatory and cardioprotective cytokines.40, 41 It is possible, although unproven, that the observed association may be explained in part by a reduction in cardiovascular protective muscle cytokines.39 Further research is needed to investigate this concept.
The rates of major clinical events in this study were high, emphasizing the need for better management of patients with PAD. There was imperfect uptake of effective cardiovascular medical therapies in the population. Combined use of effective triple medical therapy, including an antiplatelet agent, blood pressure–lowering, and a statin, can reduce the risk of cardiovascular events by as much as 50%.42, 43, 44 However, even with effective cardiovascular medications, the residual risk of major adverse events in patients with PAD is still high. Novel interventions in addition to medications are needed. This study tentatively suggests that interventions that improve lower limb muscle density may reduce the risk of cardiovascular events in PAD patients. Further research is needed to better understand the reasons responsible for the association between low muscle density and cardiovascular events, and to identify and test interventions that uniquely improve leg muscle density in PAD patients.
This study has a number of strengths and limitations. The strengths include long‐term follow‐up and a highly reproducible method of assessing 3‐dimensional leg muscle tissue from CT scans. The limitations include retrospective data collection, the select PAD population recruited, and the small sample sizes, particularly for data on ABI. Because data were collected retrospectively, there was incomplete data on biochemical measurements and body‐mass index and routinely collected clinical data may not have been assessed uniformly. The effect of reverse causation and unmeasured confounders should be considered, given the retrospective cohort design. The study included patients with PAD who were referred to a tertiary vascular surgery clinic and who underwent CT imaging as part of their clinical care. The findings may not be generalizable to patients with PAD in the community with milder symptoms. ABI measurements were only available in a small subset of patients, so more moderate associations between muscle characteristics and ABI may not have been detected. Physical activity was not assessed as part of this study, so we were not able to adjust for this in the prognostic models. Greater physical activity has previously been shown to be associated with increased calf muscle density.45 Finally, there were too few major lower‐limb amputations to robustly assess the associations between CT leg muscle characteristics and major amputation alone.
In conclusion, this study showed a strong association between low leg muscle density and clinical events in patients with PAD. Further research is needed to better understand the reasons for this association.
Sources of Funding
This work was supported by funding from the National Health and Medical Research Council (1063476 and 1000967) and the Queensland Government, Australia. Morris holds a General Sir John Monash Scholarship and an Avant Doctor in Training Research Scholarship, Australia. Singh holds a Junior Doctor Research Fellowship from the Queensland Government. Moxon holds an Advance Queensland Fellowship from the Queensland Government, Australia. Golledge holds a Practitioner Fellowship from the National Health and Medical Research Council (1117061) and a Senior Clinical Research Fellowship from the Queensland Government, Australia.
Disclosures
None.
Supporting information
Data S1. Supplemental methods.
Table S1. Reproducibility of Lower‐Limb Muscle Characteristics Assessed on Computed Tomography
Table S2. Correlation of Ankle–Brachial Pressure Index With Lower Extremity CT Muscle Characteristics
Table S3. Association of Ankle–Brachial Pressure Index Categories With Lower Extremity CT Muscle Characteristics
Figure S1. Intraobserver differences (observer 1) for CT leg muscle volume (A) and density (B). The thick horizontal line represents the mean difference, and the dotted horizontal lines represent the 95% limits of agreement. HU indicates Hounsfield Units; SD, standard deviation.
Figure S2. Intraobserver differences (observer 2) for CT leg muscle volume (A) and density (B). The thick horizontal line represents the mean difference, and the dotted horizontal lines represent the 95% limits of agreement. HU indicates Hounsfield Units; SD, standard deviation.
Figure S3. Interobserver differences for CT leg muscle volume (A) and density (B). The thick horizontal line represents the mean difference, and the dotted horizontal lines represent the 95% limits of agreement. HU indicates Hounsfield Units; SD, standard deviation.
Figure S4. Association between leg muscle volume and major lower‐limb events among people with PAD. Left panel shows the risk of major lower‐limb events over time according to leg muscle volume tertile. Right panel shows the relative risk of major lower‐limb events by leg muscle volume tertile, adjusted for age and sex. The size of the box and vertical lines represent the 95% confidence intervals calculated from the variance of the log risk. CI indicates confidence interval; RR, rate ratio.
Figure S5. Association between leg muscle volume and major cardiovascular events among people with PAD. Left panel shows the risk of major cardiovascular events over time according to leg muscle volume tertile. Right panel shows the relative risk of major cardiovascular events by leg muscle volume tertile, adjusted for age and sex. The size of the box and vertical lines represent the 95% confidence intervals calculated from the variance of the log risk. CI indicates confidence interval; RR, rate ratio.
Figure S6. Association between leg muscle density and major lower‐limb amputations among people with PAD. Left panel shows the risk of major amputations over time according to leg muscle density tertile. Right panel shows the relative risk of major amputations by leg muscle density tertile, adjusted for age and sex. The size of the box and vertical lines represent the 95% confidence intervals calculated from the variance of the log risk. CI indicates confidence interval; RR, rate ratio.
Figure S7. Association between leg muscle density and cardiovascular events among people with IC or atypical symptoms. Left panel shows the risk of major cardiovascular events over time according to leg muscle density tertile. Right panel shows the relative risk of major cardiovascular events by leg muscle density tertile, adjusted for age and sex. The size of the box and vertical lines represent the 95% confidence intervals calculated from the variance of the log risk. CI indicates confidence interval; IC, intermittent claudication; RR, rate ratio.
Figure S8. Association between leg muscle density and lower limb events among people with IC or atypical symptoms. Left panel shows the risk of major lower limb events over time according to leg muscle density tertile. Right panel shows the relative risk of major lower limb events by leg muscle density tertile, adjusted for age and sex. The size of the box and vertical lines represent the 95% confidence intervals calculated from the variance of the log risk. CI indicates confidence interval; IC, intermittent claudication; RR, rate ratio.
Figure S9. Association between leg muscle density and lower‐limb events after 6 months. Left panel shows the risk of major lower‐limb events over time according to leg muscle density tertile. Right panel shows the relative risk of major lower‐limb events by leg muscle density tertile, adjusted for age and sex. The size of the box and vertical lines represent the 95% confidence intervals calculated from the variance of the log risk. CI indicates confidence interval; IC, intermittent claudication; RR, rate ratio.
Figure S10. Association between leg muscle density and cardiovascular events after 6 months. Left panel shows the risk of major cardiovascular events over time according to leg muscle density tertile. Right panel shows the relative risk of major cardiovascular events by leg muscle density tertile, adjusted for age and sex. The size of the box and vertical lines represent the 95% confidence intervals calculated from the variance of the log risk. CI indicates confidence interval; IC, intermittent claudication; RR, rate ratio.
Figure S11. Association between leg muscle density and non‐perioperative cardiovascular events. Left panel shows the risk of major cardiovascular events over time according to leg muscle density tertile. Right panel shows the relative risk of major cardiovascular events by leg muscle density tertile, adjusted for age and sex. Follow‐up excludes time after any lower limb revascularization or major amputation. The size of the box and vertical lines represent the 95% confidence intervals calculated from the variance of the log risk. CI indicates confidence interval; IC, intermittent claudication; RR, rate ratio.
(J Am Heart Assoc. 2018;7:e009943 DOI: 10.1161/JAHA.118.009943.)
References
- 1. Hirsch AT, Duval S. The global pandemic of peripheral artery disease. Lancet. 2013;382:1312–1314. [DOI] [PubMed] [Google Scholar]
- 2. Fowkes FG, Rudan D, Rudan I, Aboyans V, Denenberg JO, McDermott MM, Norman PE, Sampson UK, Williams LJ, Mensah GA, Criqui MH. Comparison of global estimates of prevalence and risk factors for peripheral artery disease in 2000 and 2010: a systematic review and analysis. Lancet. 2013;382:1329–1340. [DOI] [PubMed] [Google Scholar]
- 3. Criqui MH, Langer RD, Fronek A, Feigelson HS, Klauber MR, McCann TJ, Browner D. Mortality over a period of 10 years in patients with peripheral arterial disease. N Engl J Med. 1992;326:381–386. [DOI] [PubMed] [Google Scholar]
- 4. Criqui MH, McClelland RL, McDermott MM, Allison MA, Blumenthal RS, Aboyans V, Ix JH, Burke GL, Liu K, Shea S. The ankle‐brachial index and incident cardiovascular events in the Multi‐Ethnic Study of Atherosclerosis (MESA). J Am Coll Cardiol. 2010;56:1506–1512. [DOI] [PMC free article] [PubMed] [Google Scholar]
- 5. Fowkes FG, Murray GD, Butcher I, Heald CL, Lee RJ, Chambless LE, Folsom AR, Hirsch AT, Dramaix M, deBacker G, Wautrecht JC, Kornitzer M, Newman AB, Cushman M, Sutton‐Tyrrell K, Fowkes FG, Lee AJ, Price JF, d'Agostino RB, Murabito JM, Norman PE, Jamrozik K, Curb JD, Masaki KH, Rodriguez BL, Dekker JM, Bouter LM, Heine RJ, Nijpels G, Stehouwer CD, Ferrucci L, McDermott MM, Stoffers HE, Hooi JD, Knottnerus JA, Ogren M, Hedblad B, Witteman JC, Breteler MM, Hunink MG, Hofman A, Criqui MH, Langer RD, Fronek A, Hiatt WR, Hamman R, Resnick HE, Guralnik J, McDermott MM. Ankle brachial index combined with Framingham Risk Score to predict cardiovascular events and mortality: a meta‐analysis. JAMA. 2008;300:197–208. [DOI] [PMC free article] [PubMed] [Google Scholar]
- 6. Steg PG, Bhatt DL, Wilson PW, D'Agostino R, Ohman EM, Rother J, Liau CS, Hirsch AT, Mas JL, Ikeda Y, Pencina MJ, Goto S. One‐year cardiovascular event rates in outpatients with atherothrombosis. JAMA. 2007;297:1197–1206. [DOI] [PubMed] [Google Scholar]
- 7. Golledge J. Lower‐limb arterial disease. Lancet. 1997;350:1459–1465. [DOI] [PubMed] [Google Scholar]
- 8. McDermott MM, Ades P, Guralnik JM, Dyer A, Ferrucci L, Liu K, Nelson M, Lloyd‐Jones D, Van Horn L, Garside D, Kibbe M, Domanchuk K, Stein JH, Liao Y, Tao H, Green D, Pearce WH, Schneider JR, McPherson D, Laing ST, McCarthy WJ, Shroff A, Criqui MH. Treadmill exercise and resistance training in patients with peripheral arterial disease with and without intermittent claudication: a randomized controlled trial. JAMA. 2009;301:165–174. [DOI] [PMC free article] [PubMed] [Google Scholar]
- 9. Fakhry F, van de Luijtgaarden KM, Bax L, den Hoed PT, Hunink MG, Rouwet EV, Spronk S. Supervised walking therapy in patients with intermittent claudication. J Vasc Surg. 2012;56:1132–1142. [DOI] [PubMed] [Google Scholar]
- 10. McDermott MM, Liu K, Guralnik JM, Criqui MH, Spring B, Tian L, Domanchuk K, Ferrucci L, Lloyd‐Jones D, Kibbe M, Tao H, Zhao L, Liao Y, Rejeski WJ. Home‐based walking exercise intervention in peripheral artery disease: a randomized clinical trial. JAMA. 2013;310:57–65. [DOI] [PMC free article] [PubMed] [Google Scholar]
- 11. McDermott MM, Guralnik JM, Criqui MH, Ferrucci L, Zhao L, Liu K, Domanchuk K, Spring B, Tian L, Kibbe M, Liao Y, Lloyd Jones D, Rejeski WJ. Home‐based walking exercise in peripheral artery disease: 12‐month follow‐up of the GOALS randomized trial. J Am Heart Assoc. 2014;3:e000711 DOI: 10.1161/JAHA.113.000711. [DOI] [PMC free article] [PubMed] [Google Scholar]
- 12. Regensteiner JG. Exercise rehabilitation for the patient with intermittent claudication: a highly effective yet underutilized treatment. Curr Drug Targets Cardiovasc Haematol Disord. 2004;4:233–239. [DOI] [PubMed] [Google Scholar]
- 13. Singh N, Liu K, Tian L, Criqui MH, Guralnik JM, Ferrucci L, Liao Y, McDermott MM. Leg strength predicts mortality in men but not in women with peripheral arterial disease. J Vasc Surg. 2010;52:624–631. [DOI] [PMC free article] [PubMed] [Google Scholar]
- 14. McDermott MM, Liu K, Tian L, Guralnik JM, Criqui MH, Liao Y, Ferrucci L. Calf muscle characteristics, strength measures, and mortality in peripheral arterial disease: a longitudinal study. J Am Coll Cardiol. 2012;59:1159–1167. [DOI] [PMC free article] [PubMed] [Google Scholar]
- 15. Morris DR, Rodriguez AJ, Moxon JV, Cunningham MA, McDermott MM, Myers J, Leeper NJ, Jones RE, Golledge J. Association of lower extremity performance with cardiovascular and all‐cause mortality in patients with peripheral artery disease: a systematic review and meta‐analysis. J Am Heart Assoc. 2014;3:e001105 DOI: 10.1161/JAHA.114.001105. [DOI] [PMC free article] [PubMed] [Google Scholar]
- 16. Harwood AE, King S, Totty J, Smith GE, Vanicek N, Chetter IC. A systematic review of muscle morphology and function in intermittent claudication. J Vasc Surg. 2017;66:1241–1257. [DOI] [PubMed] [Google Scholar]
- 17. Gerhard‐Herman MD, Gornik HL, Barrett C, Barshes NR, Corriere MA, Drachman DE, Fleisher LA, Fowkes FG, Hamburg NM, Kinlay S, Lookstein R, Misra S, Mureebe L, Olin JW, Patel RA, Regensteiner JG, Schanzer A, Shishehbor MH, Stewart KJ, Treat‐Jacobson D, Walsh ME. 2016 AHA/ACC guideline on the management of patients with lower extremity peripheral artery disease: a report of the American College of Cardiology/American Heart Association task force on clinical practice guidelines. Circulation. 2017;135:e726–e779. [DOI] [PMC free article] [PubMed] [Google Scholar]
- 18. Golledge J, Leicht A, Crowther RG, Clancy P, Spinks WL, Quigley F. Association of obesity and metabolic syndrome with the severity and outcome of intermittent claudication. J Vasc Surg. 2007;45:40–46. [DOI] [PubMed] [Google Scholar]
- 19. Morris DR, Singh TP, Moxon JV, Smith A, Stewart F, Jones RE, Golledge J. Assessment and validation of a novel angiographic scoring system for peripheral artery disease. Br J Surg. 2017;104:544–554. [DOI] [PubMed] [Google Scholar]
- 20. Strandberg S, Wretling ML, Wredmark T, Shalabi A. Reliability of computed tomography measurements in assessment of thigh muscle cross‐sectional area and attenuation. BMC Med Imaging. 2010;10:18. [DOI] [PMC free article] [PubMed] [Google Scholar]
- 21. Ochi M, Kohara K, Tabara Y, Kido T, Uetani E, Ochi N, Igase M, Miki T. Arterial stiffness is associated with low thigh muscle mass in middle‐aged to elderly men. Atherosclerosis. 2010;212:327–332. [DOI] [PubMed] [Google Scholar]
- 22. Cronin O, Bradshaw B, Iyer V, Cunningham M, Buttner P, Walker PJ, Golledge J. The association of visceral adiposity with cardiovascular events in patients with peripheral artery disease. PLoS One. 2013;8:e82350. [DOI] [PMC free article] [PubMed] [Google Scholar]
- 23. Golledge J, Cronin O, Iyer V, Bradshaw B, Moxon JV, Cunningham MA. Body mass index is inversely associated with mortality in patients with peripheral vascular disease. Atherosclerosis. 2013;229:549–555. [DOI] [PubMed] [Google Scholar]
- 24. Golledge J, Ewels C, Muller R, Walker PJ. Association of chronic kidney disease categories defined with different formulae with major adverse events in patients with peripheral vascular disease. Atherosclerosis. 2014;232:289–297. [DOI] [PubMed] [Google Scholar]
- 25. Golledge J, Quigley F, Velu R, Walker PJ, Moxon JV. Association of impaired fasting glucose, diabetes and their management with the presentation and outcome of peripheral artery disease: a cohort study. Cardiovasc Diabetol. 2014;13:147. [DOI] [PMC free article] [PubMed] [Google Scholar]
- 26. Moxon JV, Jones RE, Wong G, Weir JM, Mellett NA, Kingwell BA, Meikle PJ, Golledge J. Baseline serum phosphatidylcholine plasmalogen concentrations are inversely associated with incident myocardial infarction in patients with mixed peripheral artery disease presentations. Atherosclerosis. 2017;263:301–308. [DOI] [PubMed] [Google Scholar]
- 27. Vittinghoff E, McCulloch CE. Relaxing the rule of ten events per variable in logistic and Cox regression. Am J Epidemiol. 2007;165:710–718. [DOI] [PubMed] [Google Scholar]
- 28. Easton DF, Peto J, Babiker AG. Floating absolute risk: an alternative to relative risk in survival and case‐control analysis avoiding an arbitrary reference group. Stat Med. 1991;10:1025–1035. [DOI] [PubMed] [Google Scholar]
- 29. Plummer M. Improved estimates of floating absolute risk. Stat Med. 2004;23:93–104. [DOI] [PubMed] [Google Scholar]
- 30. Cesari M, Pahor M, Lauretani F, Zamboni V, Bandinelli S, Bernabei R, Guralnik JM, Ferrucci L. Skeletal muscle and mortality results from the InCHIANTI Study. J Gerontol A Biol Sci Med Sci. 2009;64:377–384. [DOI] [PMC free article] [PubMed] [Google Scholar]
- 31. Goodpaster BH, Park SW, Harris TB, Kritchevsky SB, Nevitt M, Schwartz AV, Simonsick EM, Tylavsky FA, Visser M, Newman AB. The loss of skeletal muscle strength, mass, and quality in older adults: the Health, Aging and Body Composition Study. J Gerontol A Biol Sci Med Sci. 2006;61:1059–1064. [DOI] [PubMed] [Google Scholar]
- 32. Miljkovic I, Kuipers AL, Cauley JA, Prasad T, Lee CG, Ensrud KE, Cawthon PM, Hoffman AR, Dam T‐T, Gordon CL, Zmuda JM; the Osteoporotic Fractures in Men Study Group . Greater skeletal muscle fat infiltration is associated with higher all‐cause and cardiovascular mortality in older men. J Gerontol A Biol Sci Med Sci. 2015;70:1133–1140. [DOI] [PMC free article] [PubMed] [Google Scholar]
- 33. McGuigan MR, Bronks R, Newton RU, Sharman MJ, Graham JC, Cody DV, Kraemer WJ. Muscle fiber characteristics in patients with peripheral arterial disease. Med Sci Sports Exerc. 2001;33:2016–2021. [DOI] [PubMed] [Google Scholar]
- 34. Askew CD, Green S, Walker PJ, Kerr GK, Green AA, Williams AD, Febbraio MA. Skeletal muscle phenotype is associated with exercise tolerance in patients with peripheral arterial disease. J Vasc Surg. 2005;41:802–807. [DOI] [PubMed] [Google Scholar]
- 35. Mitchell RG, Duscha BD, Robbins JL, Redfern SI, Chung J, Bensimhon DR, Kraus WE, Hiatt WR, Regensteiner JG, Annex BH. Increased levels of apoptosis in gastrocnemius skeletal muscle in patients with peripheral arterial disease. Vasc Med. 2007;12:285–290. [DOI] [PubMed] [Google Scholar]
- 36. Pipinos II, Sharov VG, Shepard AD, Anagnostopoulos PV, Katsamouris A, Todor A , Filis KA, Sabbah HN. Abnormal mitochondrial respiration in skeletal muscle in patients with peripheral arterial disease. J Vasc Surg. 2003;38:827–832. [DOI] [PubMed] [Google Scholar]
- 37. White SH, McDermott MM, Sufit RL, Kosmac K, Bugg AW, Gonzalez‐Freire M, Ferrucci L, Tian L, Zhao L, Gao Y, Kibbe MR, Criqui MH, Leeuwenburgh C, Peterson CA. Walking performance is positively correlated to calf muscle fiber size in peripheral artery disease subjects, but fibers show aberrant mitophagy: an observational study. J Transl Med. 2016;14:284. [DOI] [PMC free article] [PubMed] [Google Scholar]
- 38. Hiatt WR, Armstrong EJ, Larson CJ, Brass EP. Pathogenesis of the limb manifestations and exercise limitations in peripheral artery disease. Circ Res. 2015;116:1527–1539. [DOI] [PubMed] [Google Scholar]
- 39. Pedersen BK, Febbraio MA. Muscles, exercise and obesity: skeletal muscle as a secretory organ. Nat Rev Endocrinol. 2012;8:457–465. [DOI] [PubMed] [Google Scholar]
- 40. Raschke S, Eckardt K, Bjorklund Holven K, Jensen J, Eckel J. Identification and validation of novel contraction‐regulated myokines released from primary human skeletal muscle cells. PLoS One. 2013;8:e62008. [DOI] [PMC free article] [PubMed] [Google Scholar]
- 41. Bostrom P, Wu J, Jedrychowski MP, Korde A, Ye L, Lo JC, Rasbach KA, Bostrom EA, Choi JH, Long JZ, Kajimura S, Zingaretti MC, Vind BF, Tu H, Cinti S, Hojlund K, Gygi SP, Spiegelman BM. A PGC1‐alpha‐dependent myokine that drives brown‐fat‐like development of white fat and thermogenesis. Nature. 2012;481:463–468. [DOI] [PMC free article] [PubMed] [Google Scholar]
- 42. Blood Pressure Lowering Treatment Trialists Collaboration , Sundstrom J, Arima H, Woodward M, Jackson R, Karmali K, Lloyd‐Jones D, Baigent C, Emberson J, Rahimi K, MacMahon S, Patel A, Perkovic V, Turnbull F, Neal B. Blood pressure‐lowering treatment based on cardiovascular risk: a meta‐analysis of individual patient data. Lancet. 2014;384:591–598. [DOI] [PubMed] [Google Scholar]
- 43. Baigent C, Keech A, Kearney PM, Blackwell L, Buck G, Pollicino C, Kirby A, Sourjina T, Peto R, Collins R, Simes R; Cholesterol Treatment Trialists Collaborators . Efficacy and safety of cholesterol‐lowering treatment: prospective meta‐analysis of data from 90,056 participants in 14 randomised trials of statins. Lancet. 2005;366:1267–1278. [DOI] [PubMed] [Google Scholar]
- 44. Antithrombotic Trialists Collaboration , Baigent C, Blackwell L, Collins R, Emberson J, Godwin J, Peto R, Buring J, Hennekens C, Kearney P, Meade T, Patrono C, Roncaglioni MC, Zanchetti A. Aspirin in the primary and secondary prevention of vascular disease: collaborative meta‐analysis of individual participant data from randomised trials. Lancet. 2009;373:1849–1860. [DOI] [PMC free article] [PubMed] [Google Scholar]
- 45. McDermott MM, Guralnik JM, Ferrucci L, Tian L, Pearce WH, Hoff F, Liu K, Liao Y, Criqui MH. Physical activity, walking exercise, and calf skeletal muscle characteristics in patients with peripheral arterial disease. J Vasc Surg. 2007;46:87–93. [DOI] [PMC free article] [PubMed] [Google Scholar]
Associated Data
This section collects any data citations, data availability statements, or supplementary materials included in this article.
Supplementary Materials
Data S1. Supplemental methods.
Table S1. Reproducibility of Lower‐Limb Muscle Characteristics Assessed on Computed Tomography
Table S2. Correlation of Ankle–Brachial Pressure Index With Lower Extremity CT Muscle Characteristics
Table S3. Association of Ankle–Brachial Pressure Index Categories With Lower Extremity CT Muscle Characteristics
Figure S1. Intraobserver differences (observer 1) for CT leg muscle volume (A) and density (B). The thick horizontal line represents the mean difference, and the dotted horizontal lines represent the 95% limits of agreement. HU indicates Hounsfield Units; SD, standard deviation.
Figure S2. Intraobserver differences (observer 2) for CT leg muscle volume (A) and density (B). The thick horizontal line represents the mean difference, and the dotted horizontal lines represent the 95% limits of agreement. HU indicates Hounsfield Units; SD, standard deviation.
Figure S3. Interobserver differences for CT leg muscle volume (A) and density (B). The thick horizontal line represents the mean difference, and the dotted horizontal lines represent the 95% limits of agreement. HU indicates Hounsfield Units; SD, standard deviation.
Figure S4. Association between leg muscle volume and major lower‐limb events among people with PAD. Left panel shows the risk of major lower‐limb events over time according to leg muscle volume tertile. Right panel shows the relative risk of major lower‐limb events by leg muscle volume tertile, adjusted for age and sex. The size of the box and vertical lines represent the 95% confidence intervals calculated from the variance of the log risk. CI indicates confidence interval; RR, rate ratio.
Figure S5. Association between leg muscle volume and major cardiovascular events among people with PAD. Left panel shows the risk of major cardiovascular events over time according to leg muscle volume tertile. Right panel shows the relative risk of major cardiovascular events by leg muscle volume tertile, adjusted for age and sex. The size of the box and vertical lines represent the 95% confidence intervals calculated from the variance of the log risk. CI indicates confidence interval; RR, rate ratio.
Figure S6. Association between leg muscle density and major lower‐limb amputations among people with PAD. Left panel shows the risk of major amputations over time according to leg muscle density tertile. Right panel shows the relative risk of major amputations by leg muscle density tertile, adjusted for age and sex. The size of the box and vertical lines represent the 95% confidence intervals calculated from the variance of the log risk. CI indicates confidence interval; RR, rate ratio.
Figure S7. Association between leg muscle density and cardiovascular events among people with IC or atypical symptoms. Left panel shows the risk of major cardiovascular events over time according to leg muscle density tertile. Right panel shows the relative risk of major cardiovascular events by leg muscle density tertile, adjusted for age and sex. The size of the box and vertical lines represent the 95% confidence intervals calculated from the variance of the log risk. CI indicates confidence interval; IC, intermittent claudication; RR, rate ratio.
Figure S8. Association between leg muscle density and lower limb events among people with IC or atypical symptoms. Left panel shows the risk of major lower limb events over time according to leg muscle density tertile. Right panel shows the relative risk of major lower limb events by leg muscle density tertile, adjusted for age and sex. The size of the box and vertical lines represent the 95% confidence intervals calculated from the variance of the log risk. CI indicates confidence interval; IC, intermittent claudication; RR, rate ratio.
Figure S9. Association between leg muscle density and lower‐limb events after 6 months. Left panel shows the risk of major lower‐limb events over time according to leg muscle density tertile. Right panel shows the relative risk of major lower‐limb events by leg muscle density tertile, adjusted for age and sex. The size of the box and vertical lines represent the 95% confidence intervals calculated from the variance of the log risk. CI indicates confidence interval; IC, intermittent claudication; RR, rate ratio.
Figure S10. Association between leg muscle density and cardiovascular events after 6 months. Left panel shows the risk of major cardiovascular events over time according to leg muscle density tertile. Right panel shows the relative risk of major cardiovascular events by leg muscle density tertile, adjusted for age and sex. The size of the box and vertical lines represent the 95% confidence intervals calculated from the variance of the log risk. CI indicates confidence interval; IC, intermittent claudication; RR, rate ratio.
Figure S11. Association between leg muscle density and non‐perioperative cardiovascular events. Left panel shows the risk of major cardiovascular events over time according to leg muscle density tertile. Right panel shows the relative risk of major cardiovascular events by leg muscle density tertile, adjusted for age and sex. Follow‐up excludes time after any lower limb revascularization or major amputation. The size of the box and vertical lines represent the 95% confidence intervals calculated from the variance of the log risk. CI indicates confidence interval; IC, intermittent claudication; RR, rate ratio.