

Abstract
Background
Biomarkers were advocated as prognostic factors in patients undergoing transcatheter aortic valve intervention, with contradictory results concerning prognostic impact of troponin. Our aim was to assess the prognostic impact of preprocedural and postprocedural troponin in transcatheter aortic valve intervention.
Methods and Results
Preprocedural and postprocedural high‐sensitivity troponin levels were measured in all patients undergoing transcatheter aortic valve intervention. Primary end point was 1‐year mortality. This study included 1390 patients, with a mean age of 83.4±6.8 years. Patients were divided into 3 tertiles according to preprocedural troponin values: tertile 1: 0.001 to 0.023 μg/L; tertile 2: 0.024 to 1.80 μg/L; and T3: 1.81 to 12.1 μg/L. One‐year mortality was higher in patients in tertile 2 (hazard ratio, 2.1; P=0.001) and T3 (hazard ratio, 1.8; P=0.009) compared with those in tertile 1. Myocardial injury was predictive of 1‐year mortality (hazard ratio, 1.7; P=0.01). This effect may be stronger in the tertile 1 subgroup (hazard ratio, 5.1; P=0.03 [P value for interaction: 0.18]).
Conclusions
Elevated preprocedural troponin and myocardial injury are associated with 1‐year mortality after transcatheter aortic valve intervention.
Keywords: transcatheter aortic valve implantation, troponin, aortic stenosis
Subject Categories: Aortic Valve Replacement/Transcather Aortic Valve Implantation
Short abstract
See Editorial by Charitakis and Nguyen
Clinical Perspective
What Is New?
Preprocedural troponin is an independent predictor of long‐term mortality, as well as myocardial injury in patients with normal or near‐normal preprocedural troponin levels.
What Are the Clinical Implications?
Systematic troponin assessment is routinely feasible and may allow better risk stratification in patients undergoing transcatheter aortic valve intervention.
Introduction
Transcatheter aortic valve intervention (TAVI) is an alternative to surgery in patients with severe aortic stenosis who are at high surgical risk or in patients for whom conventional aortic valve replacement is contraindicated. Indications were recently extended to patients at moderate surgical risk with Food and Drug Administration approval when the transfemoral approach is considered feasible after Heart Team discussion.1 Patient selection and risk stratification are key elements for procedural success, but identifying which individuals benefit the most from the procedure remains challenging.2, 3 In this context, several clinical, echocardiographic, and biological prognostic factors have been suggested to predict outcomes.
Among these, biomarkers were identified as potential prognostic factors. New generation high‐sensitivity troponin T allows the detection of small increases in troponin levels and was proven to be an independent prognostic factor in patients with aortic stenosis.4 In addition, preprocedural and postprocedural troponin levels are independent predictors of outcomes in patients undergoing surgical aortic valve replacement.5, 6
With respect to the TAVI procedure, data from small series suggest that preprocedural high‐sensitivity troponin T may be an independent prognostic factor of 1‐month and 1‐year mortality.7, 8
Furthermore, myocardial injury after TAVI is frequent8, 9, 10 and may be related to different factors such as valve positioning, rapid pacing, or calcium embolism.9 The prognostic impact of postprocedural troponin (ie, myocardial injury) remains unclear, with contradictory data in small series.8, 9, 10 More recently, a study determined that myocardial injury after TAVI depended on the type of device used but was not predictive of mortality.11
Taking all of these considerations together, assessing the prognostic value of preprocedural and postprocedural troponin in a large prospective cohort of patients may clarify the prognostic value of these parameters, improve risk stratification in patients undergoing TAVI, and ultimately improve periprocedural management.
The aim of this study was to assess the prognostic impact of preprocedural and postprocedural troponin in a large cohort of patients undergoing TAVI.
Methods
The data that support the findings of this study are available from the corresponding author upon reasonable request.
Patient Population and Procedure
Preprocedural and postprocedural troponin measurements were prospectively collected in all patients undergoing TAVI in our center. We separated the total population in 3 roughly equal tertiles according to preprocedural troponin to compare clinical outcomes. We also assessed the impact of troponin rise (ie, the occurrence of myocardial injury) according to VARC‐2 (Valve Academic Research Consortium) criteria. This is defined as troponin T elevations >15 times the upper reference limit of the center's troponin assay (in our center, 0.014 μg/L×15=0.21 μg/L) and at least a 50% increase compared with preprocedural values.12
A multidisciplinary heart team involving at least 1 interventional cardiologist and 1 cardiac surgeon discussed all cases, and consensus was achieved regarding therapeutic strategy. Patients underwent TAVI via the transfemoral, transaortic, transapical, subclavian, or carotid approach according to previously described techniques.13, 14 All patients provided informed written consent for the procedure and data collection, and the local ethics committee approved the study.
Data Collection and Study End Points
High‐sensitivity troponin T measurement was performed on the Cobas 8000/e602 analyzer (Roche Diagnostics) the day before and the day after the procedure in all included patients. The 99% upper reference limit for this kit is 0.014 μg/L. The total imprecision at the 99th percentile is <6.5%. The limit of detection of this assay is 0.005 μg/L. For patients requiring revascularization before TAVI, percutaneous coronary intervention (PCI) was performed at least 10 days before the valve intervention. Clinical and echocardiographic data at baseline and follow‐up were prospectively collected by dedicated personnel and entered in a local database and national registries.15, 16
The primary end point of this study was 1‐year mortality. Secondary end points consisted of 30‐day mortality, 3‐year mortality, stroke, myocardial injury, new pacemaker implantation, major vascular complication, paravalvular regurgitation greater than mild, and acute kidney injury. End points were defined according to the VARC‐2 criteria.12
Statistical Analysis
Patients were separated into 3 groups based on preprocedural troponin value. Preprocedural troponin ranged from 0.001 to 12.1 μg/L. Using the 33rd and 66th percentiles of preprocedural troponin, tertiles had the following ranges: tertile 1 (T1): 0.001 to 0.023 μg/L; tertile 2 (T2): 0.024 to 1.80 μg/L; and tertile 3 (T3): 1.80 to 12.1 μg/L.
One‐year survival data were fitted in a Cox proportional hazards model and compared in a pairwise fashion for preprocedural troponin tertiles (ie, T1 versus T2, T1 versus T3, and T2 versus T3). Crude and adjusted hazard ratios (HRs) (with 95% CIs) are reported. HRs were adjusted (forward stepwise likelihood ratio) for procedure date (to account for a potential learning effect of time) and for baseline characteristics with a univariate P<0.10 for the outcome of 1‐year mortality. The covariates that met this criterion and were included in the multivariate model are reported in Table 1. The 1‐year model was then extended to 3‐year data as an exploratory analysis.
Table 1.
Univariate and Multivariate Predictors of 1‐Year Mortality
| Parameter | Univariate Analysis | Multivariate Analysis | |||
|---|---|---|---|---|---|
| HR | P Value (Crude) | HR | 95% CI | P Value (Adjusted) | |
| Preprocedural troponin tertile | |||||
| T2 vs T1 | 2.39 | <0.001 | 2.07 | 1.38–3.12 | 0.001 |
| T3 vs T1 | 2.32 | <0.001 | 1.76 | 1.15–2.68 | 0.009 |
| T3 vs T2 | 0.97 | 0.52 | 0.89 | 0.64–1.21 | 0.43 |
| Age (per 1‐y increment) | 1.18 | 0.006 | 1.028 | 1.003–1.053 | 0.03 |
| Coronary artery disease | 1.40 | 0.03 | ··· | ··· | ··· |
| Peripheral vascular disease | 1.47 | 0.01 | 1.45 | 1.07–1.98 | 0.02 |
| LVEF (per 5% increment) | 0.92 | <0.001 | 0.94 | 0.89–0.98 | 0.009 |
| Mean aortic gradient (per 5‐mm Hg increment) | 0.95 | 0.03 | ··· | ··· | ··· |
| Pulmonary artery systolic pressure (per 5‐mm Hg increment) | 1.05 | 0.08 | ··· | ··· | ··· |
| eGFR (per 5‐mL/min increment) | 0.94 | <0.001 | 0.96 | 0.93–0.995 | 0.03 |
| Preprocedural NT‐proBNP tertile | |||||
| T2 vs T1 | 1.64 | 0.04 | ··· | ··· | ··· |
| T3 vs T1 | 2.60 | <0.001 | |||
| T3 vs T2 | 1.59 | 0.01 | |||
Values are expressed as mean±SD or number (percentage) unless otherwise indicated. For pairwise comparisons, the reference category is stated last (ie, for tertile 2 [T2] vs tertile 1 [T1], the reference category is T1). eGFR indicates estimated glomerular filtration rate estimated by the Modification of Diet in Renal Disease formula; HR, hazard ratio; LVEF, left ventricular ejection fraction; NT‐proBNP, N‐terminal pro‐B‐type natriuretic peptide; T3, tertile 3.
The effect of myocardial injury was assessed as follows: first, we added the myocardial injury variable to the above‐mentioned survival model to appreciate its effect. Next, we assessed for interaction of myocardial injury by preprocedural troponin tertile. Finally, as an exploratory analysis, we looked at the HR of myocardial injury in each tertile. Patients who underwent TAVI via the transapical access were excluded from these analyses, as the troponin rise might be less meaningful in that context. Finally, independent predictors of an elevated preprocedural troponin value were assessed by means of a multivariate linear regression model.
Continuous data are reported as mean±SD or median (interquartile range), and categorical variables are reported as number of patients and percentages. Categorical data were compared using chi‐square test, and continuous data using 1‐way ANOVA or the Kruskal–Wallis test, as appropriate. A P<0.05 was considered significant for adjusted models. Statistical analyses were performed with SPSS version 23 (IBM Corp).
Results
Between March 2011 and September 2016, 1390 patients underwent TAVI in our center. The mean patient age was 83.4±6.8 years, 52% were men, and mean Society of Thoracic Surgeons (STS) and logistic European System for Cardiac Operative Risk Evaluation (EuroScore) were 5.8±4.0% and 17.3±11.0%, respectively. Several baseline characteristics differed significantly between preprocedural troponin tertiles (Table 2). Patients in T1 (normal or near‐normal troponin) were younger, more likely to be female, had less conduction disturbances such as atrial fibrillation or previous pacemaker, were less likely to have undergone previous PCI, and had less peripheral vascular disease (all P<0.05). With respect to paraclinical characteristics, patients in T1 had higher left ventricular ejection fraction and lower pulmonary artery pressure, better renal function, and lower NT‐proBNP (N‐terminal pro‐B‐type natriuretic peptide) levels (all P<0.05). Consequently, patients in T1 also had lower STS and logistic EuroScore (both P<0.001).
Table 2.
Baseline Characteristics
| Variable | All Patients (N=1390) | T1 (n=463) | T2 (n=481) | T3 (n=446) | P Value |
|---|---|---|---|---|---|
| Age | 83.4±6.8 | 82.2±7.4 | 83.9±6.2 | 84.2±6.7 | <0.001 |
| Male sex | 727 (52.3) | 195 (42.1) | 262 (54.5) | 270 (60.5) | <0.001 |
| STS‐PROM, % | 5.8±4.0 | 5.0±3.4 | 6.2±3.9 | 6.4±4.6 | <0.001 |
| Logistic EuroSCORE, % | 17.3±11.0 | 14.5±8.9 | 18.7±11.4 | 18.7±11.9 | <0.001 |
| NYHA class 3 or 4 | 890 (65.3) | 287 (62.9) | 325 (68.9) | 278 (63.9) | 0.13 |
| History of syncope | 16 (1.5) | 4 (1.1) | 7 (2.0) | 5 (1.5) | 0.68 |
| Atrial arrhythmia (flutter or fibrillation) | 371 (28.0) | 96 (21.4) | 139 (30.5) | 136 (32.2) | 0.001 |
| Diabetes mellitus | 380 (27.4) | 115 (24.8) | 132 (27.5) | 133 (29.9) | 0.23 |
| Hypertension | 751 (68.8) | 252 (68.7) | 266 (69.8) | 233 (67.7) | 0.83 |
| Dyslipidemia | 539 (49.4) | 177 (48.2) | 197 (51.7) | 165 (48.0) | 0.52 |
| Active smoker | 30 (2.5) | 14 (3.5) | 5 (1.2) | 11 (3.0) | 0.09 |
| Previous PPM | 208 (15.1) | 46 (10.0) | 75 (15.9) | 87 (19.6) | <0.001 |
| Coronary artery disease | 525 (41.8) | 163 (39.0) | 190 (44.0) | 172 (42.4) | 0.33 |
| Previous PCI | 370 (27.2) | 102 (22.5) | 141 (29.9) | 127 (29.1) | 0.02 |
| Previous CABG | 126 (9.3) | 46 (10.1) | 45 (9.6) | 35 (8.0) | 0.54 |
| Previous SAVR | 23 (1.7) | 7 (1.5) | 8 (1.7) | 8 (1.8) | 0.95 |
| Previous BAV | 9 (0.6) | 1 (0.2) | 4 (0.8) | 4 (0.9) | 0.34 |
| Previous stroke | 122 (8.8) | 42 (9.1) | 37 (7.7) | 43 (9.7) | 0.56 |
| Peripheral vascular disease | 349 (25.2) | 98 (21.3) | 138 (28.8) | 113 (25.4) | 0.03 |
| LVEF, % | 54.1±13.9 | 58.0±12.3 | 52.7±13.9 | 51.6±14.6 | <0.001 |
| LVEF ≤30% | 138 (10.2) | 32 (7.1) | 48 (10.3) | 58 (13.4) | 0.008 |
| Mean aortic gradient, mm Hg | 47.3±15.7 | 47.7±15.7 | 47.4±15.5 | 46.8±16.0 | 0.74 |
| AVA, cm2 | 0.66±0.17 | 0.67±0.17 | 0.65±0.16 | 0.65±0.17 | 0.06 |
| Pulmonary artery systolic pressure, mm Hg | 45.7±12.9 | 42.8±12.0 | 46.8±13.5 | 47.3±12.6 | <0.001 |
| Pulmonary artery systolic pressure >50 mm Hg | 431 (37.4) | 104 (28) | 154 (38.1) | 173 (46.0) | <0.001 |
| eGFR, mL/min per 1.73 m2 | 62.8±23.5 | 71.0±22.0 | 59.4±24.3 | 58.0±21.8 | <0.001 |
| eGFR <40 mL/min per 1.73 m2 | 199 (14.3) | 25 (5.4) | 85 (17.7) | 89 (20.0) | <0.001 |
| Dialysis | 24 (1.9) | 0 (0) | 15 (3.5) | 9 (2.2) | 0.001 |
| Preprocedural NT‐proBNP, median (IQR), pg/mL | 1764 (760–4079) | 817 (356–1815) | 2458 (1092–6287) | 2698 (1292–5394) | <0.001 |
| COPD | 251 (18.1) | 79 (17.1) | 91 (19.0) | 81 (18.2) | 0.76 |
| BMI, kg/m2 | 26.6±5.1 | 26.6±5.3 | 26.7±5.0 | 26.5±5.0 | 0.84 |
Values are expressed as mean±SD or number (percentage) unless otherwise indicated. BAV indicates balloon aortic valvuloplasty; BMI, body mass index; CABG, coronary artery bypass graft; COPD, chronic obstructive pulmonary disease; eGFR, glomerular filtration rate estimated by the Modification of Diet in Renal Disease formula; EuroSCORE, European System for Cardiac Operative Risk Evaluation; IQR, interquartile range; LVEF, left ventricular ejection fraction; NT‐proBNP, N‐terminal pro‐B‐type natriuretic peptide; NYHA, New York Heart Association functional class; PCI, percutaneous coronary intervention; PPM, permanent pacemaker; SAVR, surgical aortic valve replacement; STS‐PROM, Society of Thoracic Surgeons Predicted Risk of Mortality; T1, tertile 1; T2, tertile 2; T3, tertile 3.
The distribution of the transfemoral and nontransfemoral approaches was similar among tertiles (Table 3). The use of self‐expanding devices differed significantly, with T1 exhibiting the lowest percentage (T1: 26.3% versus T2: 31.9% versus T3: 35.8%, P=0.008). Device sizes were also significantly different among tertiles, with patients in T1 receiving smaller valves.
Table 3.
Procedural Characteristics
| Variable | All Patients (N=1390) | T1 (n=463) | T2 (n=481) | T3 (n=446) | P Value |
|---|---|---|---|---|---|
| Approach | 0.59 | ||||
| Transfemoral | 928 (66.8) | 315 (68.0) | 317 (65.9) | 296 (66.4) | |
| Transapical | 62 (4.5) | 22 (4.8) | 25 (5.2) | 15 (3.4) | |
| Other | 400 (28.8) | 126 (27.2) | 139 (28.9) | 135 (30.3) | |
| Local anesthesia | 768 (63.1) | 262 (64.9) | 260 (60.9) | 246 (63.6) | 0.48 |
| Predilatation | 675 (48.6) | 205 (44.3) | 258 (53.6) | 212 (47.5) | 0.01 |
| Device type | 0.004 | ||||
| Balloon‐expandable | 927 (67.1) | 331 (71.5) | 326 (68.5) | 270 (60.9) | |
| Self‐expandable | 431 (31.2) | 122 (26.3) | 146 (30.7) | 163 (36.8) | |
| Other | 24 (1.7) | 10 (2.2) | 4 (0.8) | 10 (2.3) | |
| Implanted device size (balloon‐expandable) | 0.03 | ||||
| 23 mm | 266 (28.7) | 108 (32.6) | 86 (26.4) | 72 (26.7) | |
| 26 mm | 421 (45.4) | 158 (47.7) | 144 (44.2) | 119 (44.1) | |
| 29 mm | 235 (25.4) | 64 (19.3) | 94 (28.8) | 77 (28.5) | |
| Implanted device size (self‐expandable) | 0.04 | ||||
| 23 mm | 23 (5.3) | 7 (5.7) | 7 (4.8) | 9 (5.5) | |
| 26 mm | 101 (23.4) | 28 (23.0) | 30 (20.5) | 43 (26.4) | |
| 29 mm | 209 (48.5) | 69 (56.6) | 77 (52.7) | 63 (38.7) | |
| 31 mm | 95 (22) | 17 (13.9) | 32 (21.9) | 46 (28.2) | |
| Postdilatation | 113 (8.1) | 37 (8.0) | 43 (8.9) | 33 (7.4) | 0.67 |
| Need for second valve implantation | 40 (2.9) | 9 (2.0) | 17 (3.6) | 14 (3.2) | 0.32 |
| Annulus rupture | 13 (0.9) | 4 (0.9) | 5 (1.0) | 4 (0.9) | 0.96 |
| Conversion to SAVR | 20 (1.7) | 9 (2.3) | 8 (2.0) | 3 (0.8) | 0.24 |
| Contrast use, mL | 117±57 | 116±53 | 121±58 | 114±59 | 0.18 |
| Fluoroscopy time, min | 16.7±8.8 | 16.4±8.0 | 17.1±10.0 | 16.6±8.4 | 0.49 |
Values are expressed as mean±SD or number (percentage). SAVR indicates surgical aortic valve replacement; T1, tertile 1; T2, tertile 2; T3, tertile 3.
30‐Day Clinical Outcomes
Procedural outcomes such as the need for a second device or annulus rupture were similar between tertiles (Table 3). Thirty‐day mortality was significantly different between tertiles, with patients in T1 displaying a mortality rate less than half of that in patients in the other tertiles (T1: 3.5% versus T2: 8.3% versus T3: 7.0%, P=0.007) (Table 4). Myocardial injury occurred significantly less in patients in T3 compared with the other groups (T1: 66.4% versus T2: 59.7% versus T3: 14.3%, P<0.001). Other clinical outcomes such as stroke, new pacemaker implantation, and major vascular complications were similar between preprocedural troponin tertiles.
Table 4.
Thirty‐Day, 1‐Year, and 3‐Year Outcomes
| 30‐d Outcome | All Patients (N=1390) | T1 (n=463) | T2 (n=481) | T3 (n=446) | P Value |
|---|---|---|---|---|---|
| Death | 87 (6.3) | 16 (3.5) | 40 (8.3) | 31 (7.0) | 0.007 |
| Stroke | 40 (2.9) | 12 (2.6) | 16 (3.3) | 12 (2.7) | 0.76 |
| Myocardial injurya | 437 (47.2) | 204 (66.4) | 190 (59.7) | 43 (14.3) | <0.001 |
| New pacemaker implantationb | 225 (19.2) | 67 (16.1) | 78 (19.6) | 80 (22.4) | 0.08 |
| Major vascular complication | 189 (13.6) | 60 (13.0) | 78 (16.2) | 51 (11.4) | 0.09 |
| Paravalvular regurgitation >mild | 110 (8.6) | 25 (5.8) | 50 (11.5) | 35 (8.4) | 0.01 |
| Acute kidney injury | 85 (6.1) | 18 (3.9) | 45 (9.4) | 22 (4.9) | 0.001 |
| Mean gradient >20 mm Hg | 34 (2.8) | 13 (3.1) | 13 (3.2) | 8 (2.0) | 0.54 |
| Mean gradient, mm Hg | 10.6±5.4 | 10.6±5.0 | 10.9±6.6 | 10.1±4.2 | 0.14 |
| Hospital stay, d | 11.0±8.0 | 11.0±8.0 | 11.4±8.7 | 11.6±10.0 | 0.58 |
| 1‐y deathc | 190 (18.0) | 36 (10.0) | 83 (23.0) | 71 (21.4) |
T1 vs T2: 0.001 T1 vs T3: 0.009 T2 vs T3: 0.43 |
| 3‐y deathc | 241 (38.7) | 54 (28.5) | 102 (42.6) | 85 (47.8) |
T1 vs T2: 0.002 T1 vs T3: 0.003 T2 vs T3: 0.96 |
Values are expressed as mean±SD or number (percentage). T1 indicates tertile 1; T2, tertile 2; T3, tertile 3.
Patients with transapical approach were excluded from this analysis.
Patients with a previous permanent pacemaker were excluded from this analysis.
Kaplan–Meier estimate; adjusted P values (Cox proportional hazards model).
Patients in T1 had lower rates of significant paravalvular leak (grade 2 or more) at 30 days (T1: 5.8% versus T2: 11.5% versus T3: 8.4%, P=0.01). Finally, acute kidney injury occurred twice as often in patients in T2 compared with the other groups (P=0.001).
One‐Year Mortality
Median follow‐up was 360 days. Mortality at 1 year was 18% in the overall cohort (Kaplan–Meier estimate). The mortality rate in T1 was half those of the other tertiles. (T1: 10.0% versus T2: 23.0% versus T3: 21.4%, log‐rank P<0.001) (Figure 1). After multivariable adjustment, an elevated preprocedural troponin level was an independent predictor of 1‐year mortality (T2 versus T1: HR, 2.07 [adjusted P=0.001]; T3 versus T1: HR, 1.76 [adjusted P=0.009]), (Table 1). No significant 1‐year mortality differences were observed in T2 and T3 patients (adjusted P=0.43). The other significant independent predictors of mortality at 1 year were age, peripheral vascular disease, left ventricular ejection fraction, and glomerular filtration rate (all adjusted P<0.05). When using the same variables in an exploratory model with 3‐year mortality data, results remained consistent, with patients in T1 still showing significantly lower mortality than their T2 and T3 counterparts (adjusted P=0.002 and 0.003, respectively) (Figure 1).
Figure 1.
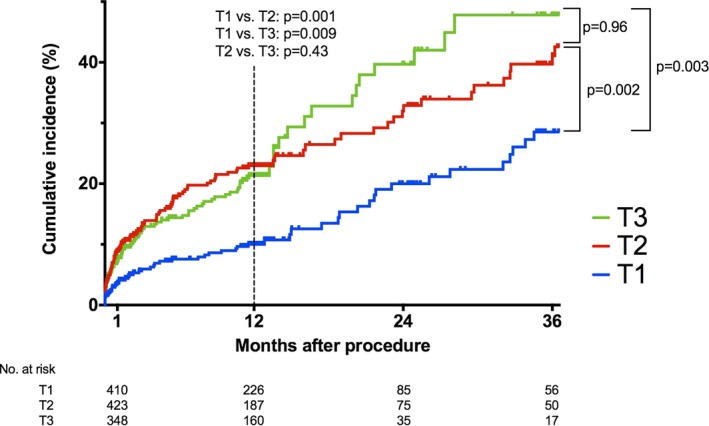
Mortality after transcatheter aortic valve intervention stratified by preprocedural troponin tertile. T1 indicates tertile 1; T2, tertile 2; T3, tertile 3.
In a model including STS score and logistic EuroScore (as they integrate most preprocedural variables collected), in addition to preprocedural troponin tertiles, independent predictors of 1‐year mortality were STS score (HR, 1.08 per 1% STS increase; adjusted P<0.001) and preprocedural troponin (T2 versus T1: adjusted P<0.001; T3 versus T1: adjusted P=0.001; T3 versus T2: adjusted P=0.41). Both the risk score model and the clinical variables model adjusted the data similarly (−2 log likelihood ratio: 2503.3 and 2496.4, respectively).
Variables Associated With Elevated Preprocedural Troponin
Four independent predictors of elevated preprocedural troponin value were identified by means of multivariate linear regression: male sex (β=0.61 μg/L), atrial arrhythmia (atrial flutter of fibrillation) (β=0.38 μg/L), low glomerular filtration rate (β=0.06 μg/L per 5 mL/min per 1.73 m2 decrement), and preprocedural NT‐proBNP levels (β=0.05 μg/L per 100 pg/mL increment) (all adjusted P<0.01) (Table 5).
Table 5.
Independent Predictors of Preprocedural Troponin Value
| Parameter | Multivariate Analysis | ||
|---|---|---|---|
| Coefficient, ng/L | 95% CI | P Value | |
| Male sex | 0.61 | 0.36–0.87 | <0.001 |
| Atrial arrhythmia (flutter or fibrillation) | 0.38 | 0.10–0.66 | 0.009 |
| eGFR (per 5‐mL/min per 1.73 m2 decrement) | 0.06 | 0.03–0.09 | <0.001 |
| Preprocedural NT‐proBNP (per 100‐pg/mL increment) | 0.005 | 0.003–0.007 | <0.001 |
Values are expressed as mean±SD or number (percentage) unless otherwise indicated. eGFR indicates glomerular filtration rate estimated by the Modification of Diet in Renal Disease formula; NT‐proBNP, N‐terminal pro‐B‐type natriuretic peptide.
Incremental Value of Myocardial Injury
Postprocedural troponin was assessed in patients with the nontransapical approach. Myocardial injury was an independent predictor of 1‐year mortality in addition to the other preprocedural variables identified, with an HR of 1.69 (95% CI, 1.12–2.55; P=0.01). The P value for the interaction term of myocardial injury by troponin tertile was not statistically significant (0.18). However, in T1, patients with myocardial injury had a 1‐year mortality rate more than 4 times higher than patients without myocardial injury (12.1% versus 2.8%, respectively; HR, 5.11 [adjusted P=0.03]) (Figure 2A). This HR was considerably higher than that of the overall cohort and of the other tertiles (T2: HR, 1.41; and T3: HR, 1.08) (Figure 2B and 2C). Patients with previous PCI had a trend for increased risk of myocardial injury (odds ratio, 1.32; P=0.065).
Figure 2.
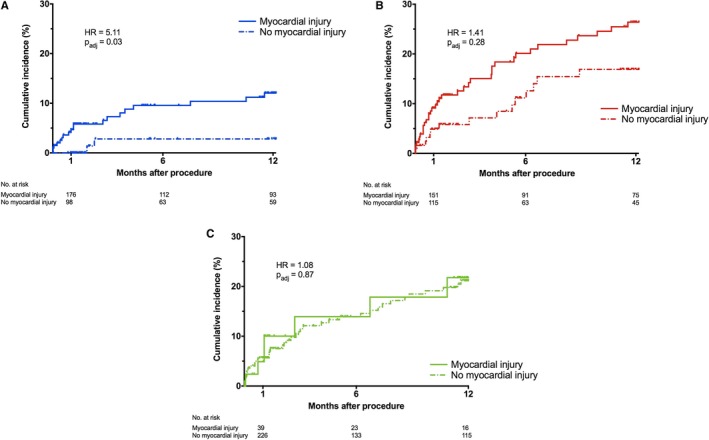
A, Mortality after transcatheter aortic valve intervention (TAVI) in tertile 1 (T1) stratified by the presence of myocardial injury. B, Mortality after TAVI in tertile 2 (T2) stratified by the presence of myocardial injury. C, Mortality after TAVI in tertile 3 (T3) stratified by the presence of myocardial injury. HR indicates hazard ratio.
Discussion
This study is the first large prospective registry describing the impact of both preprocedural and postprocedural high‐sensitivity troponin in patients undergoing TAVI with second‐ and third‐generation devices. New data on the prognostic value of troponin in patients implanted with TAVI have emerged with 3 main findings:
Preprocedural troponin was associated with 30‐day mortality and was an independent predictor of 1‐year mortality;
Male sex, atrial fibrillation, low glomerular filtration rate, and preprocedural NT‐proBNP levels were independent predictors of elevated preprocedural troponin;
Myocardial injury (ie, troponin rise) was independently predictive of 1‐year mortality, and its effect may be more pronounced in patients with normal or near‐normal preprocedural troponin.
Prognostic Impact of Preprocedural Troponin
In our study, preprocedural troponin was a strong predictor of mortality at 1 month and 1 year and remained a prognostic factor at 3 years after adjustment for potential confounding factors.
These results are consistent with several small series recently published in the literature. Indeed, Frank et al7 reported a series of 107 patients undergoing TAVI where preprocedural troponin was predictive of short‐ and long‐term mortality in a population at higher surgical risk than our cohort of patients. More recently, these data were confirmed by Köhler et al8 who showed that, in a population of Sapien XT valve recipients, preprocedural troponin and NT‐proBNP elevation were associated with increased 1‐month mortality in 259 patients. Another study of high‐sensitivity troponin T showed the same results in 201 patients implanted with both self‐expandable and balloon‐expandable prostheses17 as well as the study by Kofler et al.18
The largest study on biomarkers included 847 patients undergoing TAVI.19 The authors concluded that preprocedural troponin I was not predictive of 1‐year mortality. These contradictory results may be explained by the use of standard troponin (not high‐sensitivity troponin) in their study.
We confirm here the prognostic value of preprocedural high‐sensitivity troponin in a large cohort of patients and suggest the first data demonstrating persistent prognostic value of preprocedural troponin at 3 years. Preprocedural troponin is a biomarker able to predict 1‐year mortality in patients undergoing TAVI, thus increasing the predictive value of routine predictors of mortality such as STS score and EuroScore. An elevated preprocedural troponin level may warrant closer postprocedural monitoring and follow‐up.
Predictors of Elevated Preprocedural Troponin
Elevated baseline troponin levels may indicate myocardial damage, left ventricular hypertrophy, and advanced stages of cardiomyopathy, as well as other higher‐risk profiles for clinical outcomes.17, 20 In the present study, 4 independent predictors of preprocedural troponin value were identified: male sex, atrial arrhythmia, low glomerular filtration rate, and preprocedural NT‐proBNP. A significant impact of PCI on pre‐TAVI troponin values was unlikely as coronary intervention was performed at least 10 days before the TAVI procedure. Preprocedural NT‐proBNP was found to be an independent predictor of elevated preprocedural troponin levels in 2 studies7, 8 reflecting myocyte stretch, neurohormonal activation, and myocardial hypoxia.21 Chronic kidney failure was predictive of preprocedural troponin elevation in the study by Köhler et al8 and in a transfemoral series.17 Atrial arrhythmia and male sex were not correlated with preprocedural elevated troponin in patients undergoing TAVI in the literature. However, supraventricular tachycardia was described as being associated with elevated troponin baseline level and may be explained by an oxygen supply‐demand mismatch defined as a type 2 myocardial infarction.22
In our study, several modifiable factors were identified as predictors of preprocedural troponin and may be the target of treatments with the purpose of improving the prognosis of patients undergoing TAVI. Indeed, heart failure reflected by NT‐proBNP elevation and atrial arrhythmias may be managed before the procedure with diuretics and rhythm or heart rate control before the procedure, as well as renal function optimization.
Prognostic Impact of Postprocedural Troponin
Myocardial damage during TAVI, resulting in troponin elevation, could be caused by periprocedural conditions with a mismatch between myocardial oxygen supply and oxygen demand.22 Several mechanisms can be responsible for this mismatch such as balloon valvuloplasty, acute aortic regurgitation, microembolism and temporary hypotension during rapid ventricular pacing, and gradual deployment of the bioprosthesis.9
In our study, nearly half of the patients had myocardial injury according to the VARC‐2 definition.12 These data are consistent with recent literature.8, 11 In the present study, myocardial injury was predictive of mortality, and potentially more so in patients with near‐normal preprocedural troponin (T1). The prognostic impact of myocardial injury was demonstrated in several studies. In a study including 119 patients, myocardial injury after TAVI was predictive of 1‐month mortality.10 In a larger cohort including 577 patients, Koskinas et al23 showed that myocardial injury after TAVI was strongly associated with 1‐month mortality and remained associated after 2 years.23 However, contradictory results were found in the literature. In the study by Köhler et al8 including 259 patients undergoing TAVI, postprocedural elevation of troponin (at days 3 and 7) was not predictive of 1‐year mortality, while preprocedural troponin was predictive of survival. However, in this study, the proportion of patients with transapical approach was high (around one third) in comparison to our study cohort (4.5%). In a more recent study including 756 patients undergoing TAVI, myocardial injury assessed by high‐sensitivity troponin T depended on the type of device used but was not predictive of 1‐year mortality.11 Baseline troponin level was near normal in patients included in this study and the authors did not evaluate the prognostic value of myocardial injury according to preprocedural troponin level. Studies suggesting prognostic impact of myocardial injury included all patients undergoing TAVI regardless of access routes, which may explain these contradictory data compared with the study by Stundl et al11 including 97% of patients with transfemoral access. Our study included two thirds of patients with transfemoral access, <5% of patients with transapical route, and 28.8% of patients with transcarotid and transaortic access route. The only variable that was associated with myocardial injury was previous PCI. Although the P value did not reach statistical significance, these patients may have a more important atherosclerosis burden leading to an increased risk of myocardial injury during the procedure. These data are consistent with an increased risk of myocardial injury after TAVI in patients with coronary artery disease as reported in the study by Koskinas et al.23
Finally, the present study is the first of its kind to suggest that myocardial injury is more predictive of 1‐year mortality in patients with near‐normal preprocedural troponin. It may appear counterintuitive that troponin elevation in higher‐risk patients (ie, those in T2 or T3) had less impact than in a lower‐risk group. It is plausible, however, that troponin elevation exerts its effect on mortality upon occurrence, regardless of whether this is before or after the procedure. For patients in T2 and T3, the elevation in troponin has occurred before the procedure, which placed these patients at increased risk. Any additional increase in troponin may not have had any further impact. In comparison, patients in T1 had normal or near‐normal troponin to start. In some, the procedure caused myocardial injury, increasing their risk of death, similarly to patients in T2 and T3. Those without myocardial injury had a 1‐year mortality rate of 2.8%, whereas all of the other patients (ie, those with high troponin levels before the procedure and those who developed high troponin levels after the procedure) had a mortality rate >10%.
Study Limitations
The first limitation of this study is its single‐center design, which limits the external validity of the findings. However, troponin measurements were performed on a single analyzer, which maximized reproducibility and avoided the use of inaccurate conversion factors to harmonize values from different centers. Second, only 1 preprocedural and 1 postprocedural troponin measurement were performed. Additional assays would have allowed for more refined analyses. However, many patients were discharged early, making multiple measurements impractical. Another limitation is the difference in prosthesis type between groups. Indeed, the use of self‐expanding devices was significantly lower in patients in T1. This may be explained by the fact that, in our center, patients with lower risk profiles are less likely to receive a self‐expanding valve, because they often present with less extensive valve calcifications. As there were more women in T1, device sizes were also significantly different among tertiles, with patients in T1 receiving smaller valves. However, these characteristics may not have impacted our findings. Another limitation was the use of VARC‐2 criteria to define myocardial injury in the entire population. Indeed, this cutoff for troponin elevation may not be suitable for patients in T2 and T3 who have a higher preprocedural troponin level and may explain our findings concerning postprocedural troponin prognostic value, which was observed in patients in T1. The postprocedural troponin analysis suggesting an effect in T1 only should be considered hypothesis‐generating as the P value for the interaction term was not statistically significant. However, the HRs differed considerably between tertiles and the interaction analysis may have been underpowered.
Conclusions
Preprocedural troponin is an independent predictor of long‐term mortality after TAVI. Myocardial injury in patients with normal or near‐normal preprocedural troponin is also a predictor of long‐term events. Troponin assessment is simple and feasible in routine clinical practice and may improve risk stratification of patients undergoing TAVI. This may, in turn, improve patient selection and allow clinicians to better inform patients and their families about the risks of the procedure as they strive to reach an informed decision.
Disclosures
Dr Akodad received research grants from Edwards Lifescience and Medtronic. Dr Chevalier is a proctor for Medtronic. Dr Lefèvre is a proctor for Edwards LifeSciences. The remaining authors have no disclosures to report.
(J Am Heart Assoc. 2019;8:e011111 DOI: 10.1161/JAHA.118.011111.)
References
- 1. Baumgartner H, Falk V, Bax JJ, De Bonis M, Hamm C, Holm PJ, Iung B, Lancellotti P, Lansac E, Rodriguez Muñoz D, Rosenhek R, Sjögren J, Tornos Mas P, Vahanian A, Walther T, Wendler O, Windecker S, Zamorano JL; ESC Scientific Document Group . 2017 ESC/EACTS guidelines for the management of valvular heart disease. Eur Heart J. 2017;38:2739–2791. [DOI] [PubMed] [Google Scholar]
- 2. D'Ascenzo F, Ballocca F, Moretti C, Barbanti M, Gasparetto V, Mennuni M, D'Amico M, Conrotto F, Salizzoni S, Omedè P, Colaci C, Zoccai GB, Lupo M, Tarantini G, Napodanno M, Presbitero P, Sheiban I, Tamburino C, Marra S, Gaita F. Inaccuracy of available surgical risk scores to predict outcomes after transcatheter aortic valve replacement. J Cardiovasc Med (Hagerstown). 2013;14:894–898. [DOI] [PubMed] [Google Scholar]
- 3. Silaschi M, Conradi L, Seiffert M, Schnabel R, Schön G, Blankenberg S, Reichenspurner H, Diemert P, Treede H. Predicting risk in transcatheter aortic valve implantation: comparative analysis of EuroSCORE II and established risk stratification tools. Thorac Cardiovasc Surg. 2015;63:472–478. [DOI] [PubMed] [Google Scholar]
- 4. Røsjø H, Andreassen J, Edvardsen T, Omland T. Prognostic usefulness of circulating high‐sensitivity troponin T in aortic stenosis and relation to echocardiographic indexes of cardiac function and anatomy. Am J Cardiol. 2011;108:88–91. [DOI] [PubMed] [Google Scholar]
- 5. Saito T, Hojo Y, Hirose M, Ikemoto T, Katsuki T, Kario K. High‐sensitivity troponin T is a prognostic marker for patients with aortic stenosis after valve replacement surgery. J Cardiol. 2013;61:342–347. [DOI] [PubMed] [Google Scholar]
- 6. Paparella D, Guida P, Caparrotti S, Fanelli V, Martinelli G, Mazzei V, Zaccaria S, Bisceglia L, Scrascia G. Myocardial damage influences short‐ and mid‐term survival after valve surgery: a prospective multicenter study. J Thorac Cardiovasc Surg. 2014;148:2373–2379.e1. [DOI] [PubMed] [Google Scholar]
- 7. Frank D, Stark S, Lutz M, Weissbrodt A, Freitag‐Wolf S, Petzina R, Rosenberg M, Lutter G, Frey N. Preprocedural high‐sensitive troponin predicts survival after transcatheter aortic valve implantation (TAVI). Int J Cardiol. 2013;169:e38–e39. [DOI] [PubMed] [Google Scholar]
- 8. Köhler WM, Freitag‐Wolf S, Lambers M, Lutz M, Niemann PM, Petzina R, Lutter G, Bramlage P, Frey N, Frank D. Preprocedural but not periprocedural high‐sensitive troponin T (hsTNT) levels predict outcome in patients undergoing transcatheter aortic valve implantation (TAVI). Cardiovasc Ther. 2016;34:385–396. [DOI] [PubMed] [Google Scholar]
- 9. Rodés‐Cabau J, Gutiérrez M, Bagur R, De Larochellière R, Doyle D, Côté M, Villeneuve J, Bertrand OF, Larose E, Manazzoni J, Pibarot P, Dumont E. Incidence, predictive factors, and prognostic value of myocardial injury following uncomplicated transcatheter aortic valve implantation. J Am Coll Cardiol. 2011;57:1988–1999. [DOI] [PubMed] [Google Scholar]
- 10. Yong ZY, Wiegerinck EMA, Boerlage‐van Dijk K, Koch KT, Vis MM, Bouma BJ, Henriques JPS, Cocchieri R, Piek JJ, de Mol BAJM, Baan J. Predictors and prognostic value of myocardial injury during transcatheter aortic valve implantation. Circ Cardiovasc Interv. 2012;5:415–423. [DOI] [PubMed] [Google Scholar]
- 11. Stundl A, Schulte R, Lucht H, Weber M, Sedaghat A, Shamekhi J, Zur B, Grube E, Mellert F, Welz A, Fimmers R, Nickenig G, Werner N, Sinning J‐M. Periprocedural myocardial injury depends on transcatheter heart valve type but does not predict mortality in patients after transcatheter aortic valve replacement. JACC Cardiovasc Interv. 2017;10:1550–1560. [DOI] [PubMed] [Google Scholar]
- 12. Kappetein AP, Head SJ, Généreux P, Piazza N, van Mieghem NM, Blackstone EH, Brott TG, Cohen DJ, Cutlip DE, van Es G‐A, Hahn RT, Kirtane AJ, Krucoff MW, Kodali S, Mack MJ, Mehran R, Rodés‐Cabau J, Vranckx P, Webb JG, Windecker S, Serruys PW, Leon MB. Updated standardized endpoint definitions for transcatheter aortic valve implantation: the Valve Academic Research Consortium‐2 consensus document. Eur Heart J. 2012;33:2403–2418. [DOI] [PubMed] [Google Scholar]
- 13. Rodés‐Cabau J, Dumont E, De LaRochellière R, Doyle D, Lemieux J, Bergeron S, Clavel M‐A, Villeneuve J, Raby K, Bertrand OF, Pibarot P. Feasibility and initial results of percutaneous aortic valve implantation including selection of the transfemoral or transapical approach in patients with severe aortic stenosis. Am J Cardiol. 2008;102:1240–1246. [DOI] [PubMed] [Google Scholar]
- 14. Bapat V, Frank D, Cocchieri R, Jagielak D, Bonaros N, Aiello M, Lapeze J, Laine M, Chocron S, Muir D, Eichinger W, Thielmann M, Labrousse L, Rein KA, Verhoye J‐P, Gerosa G, Baumbach H, Bramlage P, Deutsch C, Thoenes M, Romano M. Transcatheter aortic valve replacement using transaortic access: experience from the multicenter, multinational, prospective ROUTE registry. JACC Cardiovasc Interv. 2016;9:1815–1822. [DOI] [PubMed] [Google Scholar]
- 15. Gilard M, Eltchaninoff H, Iung B, Donzeau‐Gouge P, Chevreul K, Fajadet J, Leprince P, Leguerrier A, Lievre M, Prat A, Teiger E, Lefevre T, Himbert D, Tchetche D, Carrié D, Albat B, Cribier A, Rioufol G, Sudre A, Blanchard D, Collet F, Dos Santos P, Meneveau N, Tirouvanziam A, Caussin C, Guyon P, Boschat J, Le Breton H, Collart F, Houel R, Delpine S, Souteyrand G, Favereau X, Ohlmann P, Doisy V, Grollier G, Gommeaux A, Claudel J‐P, Bourlon F, Bertrand B, Van Belle E, Laskar M; FRANCE 2 Investigators . Registry of transcatheter aortic‐valve implantation in high‐risk patients. N Engl J Med. 2012;366:1705–1715. [DOI] [PubMed] [Google Scholar]
- 16. Auffret V, Lefevre T, Van Belle E, Eltchaninoff H, Iung B, Koning R, Motreff P, Leprince P, Verhoye JP, Manigold T, Souteyrand G, Boulmier D, Joly P, Pinaud F, Himbert D, Collet JP, Rioufol G, Ghostine S, Bar O, Dibie A, Champagnac D, Leroux L, Collet F, Teiger E, Darremont O, Folliguet T, Leclercq F, Lhermusier T, Olhmann P, Huret B, Lorgis L, Drogoul L, Bertrand B, Spaulding C, Quilliet L, Cuisset T, Delomez M, Beygui F, Claudel J‐P, Hepp A, Jegou A, Gommeaux A, Mirode A, Christiaens L, Christophe C, Cassat C, Metz D, Mangin L, Isaaz K, Jacquemin L, Guyon P, Pouillot C, Makowski S, Bataille V, Rodés‐Cabau J, Gilard M, Le Breton H; FRANCE TAVI Investigators . Temporal trends in transcatheter aortic valve replacement in France: FRANCE 2 to FRANCE TAVI. J Am Coll Cardiol. 2017;70:42–55. [DOI] [PubMed] [Google Scholar]
- 17. Chorianopoulos E, Krumsdorf U, Geis N, Pleger ST, Giannitsis E, Katus HA, Bekeredjian R. Preserved prognostic value of preinterventional troponin T levels despite successful TAVI in patients with severe aortic stenosis. Clin Res Cardiol. 2014;103:65–72. [DOI] [PubMed] [Google Scholar]
- 18. Kofler M, Reinstadler SJ, Stastny L, Dumfarth J, Reindl M, Wachter K, Rustenbach CJ, Müller S, Feuchtner G, Mende M, Friedrich G, Metzler B, Grimm M, Bonaros N, Baumbach H. Prognostic implications of pre‐procedural high‐sensitivity cardiac troponin T in patients undergoing transcatheter aortic valve replacement. JACC Cardiovasc Interv. 2017;10:2345–2346. [DOI] [PubMed] [Google Scholar]
- 19. Seiffert M, Sinning JM, Meyer A, Wilde S, Conradi L, Vasa‐Nicotera M, Ghanem A, Kempfert J, Hammerstingl C, Ojeda FM, Kim W‐K, Koschyk DH, Schirmer J, Baldus S, Grube E, Möllmann H, Reichenspurner H, Nickenig G, Blankenberg S, Diemert P, Treede H, Walther T, Werner N, Schnabel RB. Development of a risk score for outcome after transcatheter aortic valve implantation. Clin Res Cardiol. 2014;103:631–640. [DOI] [PubMed] [Google Scholar]
- 20. Hamm CW, Giannitsis E, Katus HA. Cardiac troponin elevations in patients without acute coronary syndrome. Circulation. 2002;106:2871–2872. [DOI] [PubMed] [Google Scholar]
- 21. Hall C. NT‐ProBNP: the mechanism behind the marker. J Card Fail. 2005;11:S81–S83. [DOI] [PubMed] [Google Scholar]
- 22. Thygesen K, Alpert JS, Jaffe AS, Simoons ML, Chaitman BR, White HD; Joint ESC/ACCF/AHA/WHF Task Force for the Universal Definition of Myocardial Infarction , Katus HA, Lindahl B, Morrow DA, Clemmensen PM, Johanson P, Hod H, Underwood R, Bax JJ, Bonow RO, Pinto F, Gibbons RJ, Fox KA, Atar D, Newby LK, Galvani M, Hamm CW, Uretsky BF, Steg PG, Wijns W, Bassand JP, Menasché P, Ravkilde J, Ohman EM, Antman EM, Wallentin LC, Armstrong PW, Simoons ML, Januzzi JL, Nieminen MS, Gheorghiade M, Filippatos G, Luepker RV, Fortmann SP, Rosamond WD, Levy D, Wood D, Smith SC, Hu D, Lopez‐Sendon J‐L, Robertson RM, Weaver D, Tendera M, Bove AA, Parkhomenko AN, Vasilieva EJ, Mendis S. Third universal definition of myocardial infarction. Circulation. 2012;126:2020–2035.22923432 [Google Scholar]
- 23. Koskinas KC, Stortecky S, Franzone A, O'Sullivan CJ, Praz F, Zuk K, Räber L, Pilgrim T, Moschovitis A, Fiedler GM, Jüni P, Heg D, Wenaweser P, Windecker S. Post‐procedural troponin elevation and clinical outcomes following transcatheter aortic valve implantation. J Am Heart Assoc. 2016;5:e002430 DOI: 10.1161/JAHA.115.002430. [DOI] [PMC free article] [PubMed] [Google Scholar]