

Abstract
Background
Lung cancer 5-year survival has doubled over 15 years. Although the risk of second primary cancer is recognised, quantification over time is lacking. We describe the incidence of second and higher order smoking-related primary cancers in lung cancer survivors, identifying high-incidence groups and how incidence changes over time from first diagnosis.
Methods
Data on smoking-related primary cancers (lung, laryngeal, head and neck, oesophageal squamous cell carcinoma and bladder) diagnosed in England between 2000 and 2014 were obtained from Public Health England National Cancer Registration and Analysis Service. We calculated absolute incidence rates and standardised incidence rate ratios, both overall and for various subgroups of second primary cancer for up to 10 years from the initial diagnosis of lung cancer, using Poisson regression.
Results
Elevated incidence of smoking-related second primary cancer persists for at least 10 years from first lung cancer diagnosis with those aged 50 and 79 at first diagnosis at particularly high risk. The most frequent type of second malignancy was lung cancer although the highest standardised incidence rate ratios were for oesophageal squamous cell carcinoma (2.4) and laryngeal cancers (2.8) and consistently higher in women than in men. Over the last decade, the incidence of second primary lung cancer has doubled.
Conclusion
Lung cancer survivors have increased the incidence of subsequent lung, laryngeal, head and neck and oesophageal squamous cell carcinoma for at least a decade from the first diagnosis. Consideration should be given to increasing routine follow-up from 5 years to 10 years for those at highest risk, alongside surveillance for other smoking-related cancers.
Keywords: lung cancer, clinical epidemiology, non-small cell lung cancer
Key messages.
What is the key question?
What are the age and sex-specific absolute and relative risks of developing smoking-related second and higher order primary cancers following lung cancer?
What is the bottom line?
Our population-based approach shows that lung cancer survivors, particularly women, have increased the incidence of smoking-related primary cancers for at least a decade from the time of their first primary lung cancer diagnosis, with those aged 50–79 at first diagnosis at particularly high risk.
Why read on?
With improving lung cancer survival rates consideration should be given to extending lung cancer follow-up from 5 years to 10 years and to undertaking surveillance for other smoking-related cancers including head and neck, laryngeal and oesophageal squamous cell carcinoma.
Introduction
Five-year survival of patients with lung cancer has doubled in England during the past 15 years leading to increasing numbers of survivors.1 2 Lung cancer survivors are thought to be at an increased risk of second primary cancer (SPC).3–6 However, neither the way in which incidence of subsequent malignancy changes during follow-up nor patient characteristics associated with increased risk of SPC are well understood. We have estimated the incidence of smoking-related second and higher order primary cancers following a primary diagnosis of lung cancer to determine which groups are at higher risk and evaluate how incidence changes over time following diagnosis. We have focused on cancers of the lung, larynx, head and neck, oesophagus (squamous cell carcinoma) and urinary bladder as these cancers have the largest proportion of deaths attributable to cigarette smoking.7 We assessed the incidence of developing an SPC at different time points after initial diagnosis to inform clinicians about optimal follow-up periods and surveillance regimens after lung cancer treatment with curative intent.
Methods
Smoking-related primary cancers
Data from the National Cancer Registration and Analysis Service of Public Health England (the organisation responsible for cancer registration in England) provided information on first, second and higher order smoking-related primary cancers diagnosed in English residents aged 30–99 between 1 January 2000 and 31 December 2014. This included all diagnoses of the lung (ICD-10, C33–C34), bladder (C67), oesophageal squamous cell carcinoma (OSCC) (C15, morphology codes 8070–8074, 8094, 8123, 8560), laryngeal (C32) and head and neck cancers (C00–C14, C31). The cancer registry captures at least 98% of primary cancer diagnoses in England8 and records multiple primary cancers following International Agency for Research on Cancer and European Network of Cancer Registries’ rules.9 Cases classified as recurrence of first primary lung cancer were excluded. Data were available on tumour type (site, morphology), month of diagnosis as well as patient information including age at diagnosis, sex, income deprivation quintile and vital status (whether a patient was alive, dead or lost to follow-up).10 Lung cancers were divided into small cell lung cancer (SCLC) and non-SCLC (NSCLC), and NSCLC was split into adenocarcinoma, squamous cell carcinoma, other NSCLC, carcinoid and unspecified lung (online supplementary appendix 1 table 1).
thoraxjnl-2018-212456supp001.pdf (1.2MB, pdf)
Estimating expected incidence of smoking-related primary cancers
To evaluate whether lung cancer survivors were at an increased risk of SPC compared with those with no diagnosis of lung cancer, we estimated the number of cancers we would expect in people without lung cancer (online supplementary appendix 2 figure 2). We obtained midyear population estimates for England from 2000 to 2014 from the Office for National Statistics and matched these with first primary cancers in our dataset to calculate the expected age-sex-year-specific incidence rates.11 We matched these rates with person-years of follow-up in the cancer registry dataset stratified by sex, attained age and attained year. We multiplied the person-years of follow-up by the expected age-sex-year-specific incidence rates to calculate the number of expected cancers. We compared the number of observed and expected cancers to calculate standardised incidence rate ratios (SIRs).
Statistical analysis
Analysis cohort
After restriction (online supplementary appendix 2 figure 1), the analysis cohort included 490 328 patients with first primary lung cancer. Most patients (489 740, 99.9%) had complete survival follow-up to death or censoring at 31 December 2014. Follow-up for the remaining 588 patients was censored on the day they were last known to be alive.
Our analyses exclude primary cancers diagnosed within 6 months of the first primary cancer as such tumours were deemed likely to represent ‘synchronous’ diagnoses.
Descriptive analysis
We described absolute incidence rates and SIRs for the cohort from 6 months to 10 years follow-up, including by sex, age at diagnosis and deprivation group, as well as by the site of the SPC. We provide a brief summary of the incidence of subsequent smoking-related SPC up to 10 years from diagnosis for those diagnosed in 2000–2004, with complete follow-up, as other descriptive results may be affected by variable follow-up periods.
The choice to limit at 10 years follow-up was informed by the results of Kaplan-Meier survival analyses, presented in online supplementary appendix 4 figure 1.
Describing how risk changes over follow-up
We investigated how absolute incidence rates (second and higher order primary cancers diagnosed per 100 000 patient-years) and SIRs changed during follow-up. We plotted age-sex-specific incidence rate and SIR against months of follow-up and modelled how the incidence rate or SIR changed over time using Poisson models with patient-years (incidence rate) or expected cancers (SIR) as exposure. We modelled elapsed follow-up time using restricted cubic splines allowing us to avoid the disadvantages of categorisation while providing for potentially non-linear associations between elapsed follow-up and SPC risk.12 13 Exploratory modelling guided the choice and number of knots and the interaction terms used in the model. The final models included pairwise interactions between age and follow-up, sex and follow-up, and age and sex, and parameterised follow-up using splines with knots at 6, 12, 60 and 120 months. Further interaction terms were not included as they decreased model fit measured using the Akaike information criterion.14 We used the same approach to evaluate changes in SIR over follow-up by the site of SPC and by the morphology of first primary lung cancer, removing age at diagnosis and sex from the model. Results were not sensitive to the exact knot locations (online supplementary appendix 3 figure 1).
Describing how risk changes by year of first primary lung cancer diagnosis
We extended our initial approach to evaluate how the risk of SPC changed during different study periods, limiting observations to 6–60 months of follow-up. Based on exploratory analyses, we split SPC into second primary lung cancers and other smoking-related primary cancers. We initially described the observed changes in absolute risk of second primary lung and other smoking-related primary cancers in patients diagnosed with first primary lung cancer in 2005–2009 and 2010–2014 compared with 2000–2004. We then used the Akaike information criterion to select an adjusted model,14 considering patient age, sex, deprivation and elapsed follow-up (modelled as above using restricted cubic splines with knots at 6, 12 and 60 months follow-up) and all two-way interactions. This provided a check that apparent differences were not explained by changes in patient casemix or improvements in survival.
Results
Description of analysis cohort
Between 2000 and 2014, 490 328 patients were diagnosed with first primary lung cancer (table 1). We have a priori focused on the 213 245 patients (43%) surviving 6 months after diagnosis, contributing 335 436 patient-years of follow-up (table 1; online supplementary appendix 4 figure 1). The median follow-up was 10 months per patient (IQR 4–28 months). Despite low survival rates, 4710 patients diagnosed in 2004 or before were still alive at 10 years follow-up (table 1). Survival rates were higher for women than men and for younger than older patients (online supplementary appendix 4 figure 1). Lung cancer was more common in patients from more deprived areas and more deprived patients had worse survival.
Table 1.
Number of patients alive and in follow-up at the start of interval and absolute incidence rate within interval periods within the first 10 years after diagnosis with first primary lung cancer, by patient and tumour characteristics. The period ‘diagnosis to 6 months’ was discarded from all other analyses
| Diagnosis to 6 months | 6–12 months | 1–5 years | 5–10 years | 10 years | ||||||||||
| Patients | Absolute incidence rate per 100 000 | Patients | Absolute incidence rate per 100 000 | Patients | Absolute incidence rate per 100 000 | Patients | Absolute incidence rate per 100 000 | Patients | ||||||
| Estimate | (95% CI) | Estimate | (95% CI) | Estimate | (95% CI) | Estimate | (95% CI) | |||||||
| Overall | 490 328 | 1338 | (1276 to 1402) | 213 245 | 399 | (358 to 443) | 128 128 | 683 | (647 to 720) | 19 280 | 1184 | (1093 to 1280) | 4710 | |
| Subsite of first primary cancer | Small cell carcinoma | 57 179 | 534 | (427 to 660) | 26 896 | 213 | (133 to 322) | 13 224 | 495 | (388 to 622) | 1275 | 995 | (697 to 1378) | 335 |
| Adenocarcinoma | 100 395 | 1461 | (1330 to 1601) | 55 363 | 422 | (342 to 514) | 36 524 | 738 | (672 to 809) | 6063 | 1275 | (1106 to 1461) | 1394 | |
| Squamous cell carcinoma | 97 253 | 1672 | (1532 to 1822) | 56 077 | 552 | (461 to 656) | 35 960 | 864 | (790 to 943) | 6120 | 1398 | (1227 to 1586) | 1568 | |
| Other non-small cell lung cancer | 75 505 | 1226 | (1083 to 1382) | 35 004 | 295 | (212 to 400) | 20 008 | 590 | (505 to 686) | 2826 | 1310 | (1062 to 1598) | 592 | |
| Carcinoid | 3422 | 1930 | (1260 to 2827) | 3074 | 539 | (233 to 1061) | 2834 | 146 | (75 to 255) | 1368 | 253 | (126 to 453) | 484 | |
| Unspecified lung | 156 574 | 1341 | (1212 to 1479) | 36 831 | 332 | (244 to 441) | 19 578 | 515 | (428 to 614) | 1628 | 853 | (594 to 1187) | 337 | |
| Age at diagnosis | 30–49 | 13 890 | 925 | (667 to 1251) | 8500 | 452 | (258 to 733) | 5484 | 262 | (172 to 381) | 1429 | 340 | (194 to 551) | 541 |
| 50–59 | 51 944 | 1075 | (921 to 1247) | 28 981 | 283 | (196 to 396) | 18 168 | 579 | (497 to 670) | 3728 | 1006 | (832 to 1206) | 1203 | |
| 60–69 | 125 462 | 1412 | (1293 to 1538) | 64 156 | 404 | (331 to 488) | 40 145 | 746 | (681 to 816) | 6898 | 1396 | (1234 to 1574) | 1756 | |
| 70–79 | 173 884 | 1552 | (1440 to 1670) | 73 690 | 426 | (355 to 506) | 44 198 | 766 | (701 to 836) | 5934 | 1339 | (1160 to 1538) | 1108 | |
| 80–99 | 125 148 | 1104 | (983 to 1234) | 37 918 | 418 | (320 to 537) | 20 133 | 596 | (502 to 703) | 1291 | 1037 | (671 to 1530) | 102 | |
| Sex | Male | 278 006 | 1540 | (1452 to 1633) | 1 17 308 | 460 | (401 to 526) | 68 811 | 806 | (752 to 863) | 9814 | 1316 | (1183 to 1460) | 2437 |
| Female | 212 322 | 1081 | (998 to 1169) | 95 937 | 325 | (271 to 387) | 59 317 | 549 | (503 to 599) | 9466 | 1045 | (924 to 1177) | 2273 | |
| Deprivation quintile | 1-least deprived | 68 084 | 1335 | (1175 to 1512) | 31 084 | 378 | (279 to 502) | 19 002 | 601 | (516 to 695) | 3017 | 1033 | (828 to 1273) | 777 |
| 2 | 85 982 | 1266 | (1126 to 1419) | 38 313 | 362 | (273 to 469) | 22 840 | 639 | (558 to 729) | 3426 | 1195 | (983 to 1440) | 859 | |
| 3 | 98 660 | 1372 | (1234 to 1520) | 42 644 | 451 | (356 to 562) | 25 703 | 649 | (572 to 734) | 3867 | 1211 | (1011 to 1438) | 947 | |
| 4 | 111 788 | 1363 | (1234 to 1503) | 47 560 | 354 | (275 to 448) | 28 445 | 685 | (609 to 768) | 4239 | 1074 | (894 to 1280) | 1024 | |
| 5-most deprived | 125 814 | 1339 | (1218 to 1470) | 53 644 | 437 | (353 to 534) | 32 138 | 790 | (713 to 874) | 4731 | 1354 | (1159 to 1572) | 1103 | |
| Year of diagnosis | 2000 | 31 289 | 750 | (573 to 966) | 12 610 | 258 | (137 to 441) | 7335 | 432 | (324 to 565) | 1615 | 857 | (640 to 1124) | 918 |
| 2001 | 30 924 | 743 | (566 to 959) | 12 567 | 316 | (181 to 513) | 7371 | 714 | (573 to 880) | 1632 | 977 | (746 to 1258) | 911 | |
| 2002 | 29 999 | 885 | (689 to 1121) | 12 386 | 301 | (169 to 497) | 7332 | 511 | (392 to 656) | 1591 | 1008 | (771 to 1294) | 899 | |
| 2003 | 30 071 | 670 | (501 to 879) | 12 352 | 477 | (306 to 710) | 7484 | 519 | (402 to 661) | 1749 | 899 | (684 to 1159) | 981 | |
| 2004 | 30 543 | 971 | (767 to 1211) | 12 957 | 342 | (202 to 540) | 7859 | 497 | (384 to 632) | 1763 | 1506 | (1225 to 1832) | 1001 | |
| 2005 | 30 850 | 1124 | (906 to 1379) | 13 244 | 258 | (141 to 433) | 8126 | 546 | (430 to 683) | 1867 | 1438 | (1160 to 1761) | – | |
| 2006 | 32 075 | 857 | (672 to 1077) | 13 841 | 389 | (244 to 589) | 8468 | 671 | (544 to 819) | 1940 | 1371 | (1080 to 1716) | – | |
| 2007 | 32 236 | 1207 | (987 to 1461) | 14 332 | 426 | (275 to 628) | 8831 | 700 | (575 to 845) | 2152 | 1122 | (840 to 1468) | – | |
| 2008 | 32 994 | 1466 | (1225 to 1739) | 14 837 | 311 | (187 to 486) | 9270 | 662 | (543 to 798) | 2290 | 1496 | (1103 to 1984) | – | |
| 2009 | 33 244 | 1160 | (951 to 1402) | 15 509 | 297 | (179 to 463) | 9877 | 853 | (726 to 997) | 2681 | 1570 | (984 to 2377) | – | |
| 2010 | 33 772 | 1754 | (1497 to 2043) | 15 900 | 271 | (161 to 428) | 10 340 | 771 | (649 to 909) | – | – | |||
| 2011 | 34 651 | 1710 | (1460 to 1989) | 16 802 | 454 | (310 to 640) | 11 070 | 803 | (672 to 953) | – | – | |||
| 2012 | 35 838 | 2277 | (1995 to 2587) | 18 068 | 612 | (450 to 814) | 12 276 | 962 | (802 to 1145) | – | – | |||
| 2013 | 35 900 | 1771 | (1524 to 2046) | 18 351 | 617 | (455 to 818) | 12 489 | 843 | (621 to 1117) | – | – | |||
| 2014 | 35 942 | 2150 | (1848 to 2488) | 9489 | 602 | (337 to 994) | – | – | – | |||||
Around 1.1% (2328 of 213 245) of patients alive at 6 months had SPCs during follow-up, some of whom had higher order (ie, third or fourth) primary cancers as well. Restricting to patients diagnosed in 2000–2004 who survived to 6 months and have 10 years complete follow-up gives similar results.
Overall incidence of second and higher order primary cancers
Over the entire length of follow-up, SIRs for second and higher order primary cancer were highest for those aged 30–49 (SIR 3.4, 95% CI 2.6 to 4.4) or 50–59 at diagnosis (SIR 2.7, 2.5 to 3.1), for women (SIR 2.0, 1.9 to 2.1) and for the most deprived patients (SIR 1.8, 1.7 to 2.0) (table 2). Patients whose first primary lung cancer was adenocarcinoma (SIR 1.9, 1.7 to 2.0) or squamous cell carcinoma (SIR 1.8, 1.6 to 1.9) were at highest risk of SPC, while those with carcinoid tumours were not at increased risk (SIR 0.7, 0.5 to 1.1) (table 2; online supplementary appendix 4 figure 4).
Table 2.
Observed and expected second and higher order primary cancers over the entire 335 436 patient-years of follow-up from 6 months after diagnosis to 10 years follow-up or the 31 December 2014, overall, by subsite of first primary lung cancer and by patient characteristics. Italics denotes the lung sub-sites
| Observed SPCs | Expected SPCs | Absolute incidence rate per 100 000 person-years | Standardised incidence rate ratio | ||||
| Estimate | (95% CI) | Estimate | (95% CI) | ||||
| Overall | 2313 | 1491.9 | 689.6 | (661.7 to 718.2) | 1.55 | (1.49 to 1.61) | |
| Subsite of first primary lung cancer | Small cell carcinoma | 131 | 109.0 | 455.3 | (380.7 to 540.2) | 1.20 | (1.00 to 1.43) |
| Adenocarcinoma | 759 | 407.0 | 752.4 | (699.8 to 807.9) | 1.86 | (1.73 to 2.00) | |
| Squamous cell carcinoma (SCC) | 873 | 497.9 | 882.8 | (825.2 to 943.3) | 1.75 | (1.64 to 1.87) | |
| Other NSCLC | 312 | 223.0 | 619.4 | (552.6 to 692.1) | 1.40 | (1.25 to 1.56) | |
| Carcinoid | 31 | 41.7 | 219.4 | (149.1 to 311.4) | 0.74 | (0.51 to 1.06) | |
| Unspecified lung | 207 | 213.2 | 488.3 | (424.0 to 559.5) | 0.97 | (0.84 to 1.11) | |
| Site of SPC | Lung | 1460 | 993.8 | 435.3 | (413.2 to 458.2) | 1.47 | (1.39 to 1.55) |
| Small cell carcinoma | 142 | 94.3 | 42.3 | (35.7 to 49.9) | 1.51 | (1.27 to 1.78) | |
| NSCLC | 1318 | 899.5 | 392.9 | (372.0 to 414.7) | 1.47 | (1.39 to 1.55) | |
| Adenocarcinoma | 485 | 187.8 | 144.6 | (132.0 to 158.0) | 2.58 | (2.36 to 2.82) | |
| Squamous cell carcinoma | 400 | 190.9 | 119.2 | (107.8 to 131.5) | 2.10 | (1.90 to 2.31) | |
| Other NSCLC | 216 | 143.5 | 64.4 | (56.1 to 73.6) | 1.51 | (1.31 to 1.72) | |
| Carcinoid | 13 | 4.4 | 3.9 | (2.1 to 6.6) | 2.98 | (1.59 to 5.10) | |
| Unspecified lung | 204 | 372.9 | 60.8 | (52.8 to 69.8) | 0.55 | (0.47 to 0.63) | |
| Bladder | 397 | 299.9 | 118.4 | (107.0 to 130.6) | 1.32 | (1.20 to 1.46) | |
| Oesophageal SCC | 124 | 52.1 | 37.0 | (30.7 to 44.1) | 2.38 | (1.98 to 2.84) | |
| Laryngeal | 122 | 43.5 | 36.4 | (30.2 to 43.4) | 2.81 | (2.33 to 3.35) | |
| Head and neck | 210 | 102.6 | 62.6 | (54.4 to 71.7) | 2.05 | (1.78 to 2.34) | |
| Age at diagnosis | 30–49 | 59 | 17.5 | 316.1 | (240.6 to 407.8) | 3.38 | (2.57 to 4.35) |
| 50–59 | 332 | 121.0 | 608.3 | (544.6 to 677.3) | 2.74 | (2.46 to 3.05) | |
| 60–69 | 862 | 428.0 | 779.0 | (727.8 to 832.7) | 2.01 | (1.88 to 2.15) | |
| 70–79 | 833 | 658.9 | 751.4 | (701.2 to 804.2) | 1.26 | (1.18 to 1.35) | |
| 80–99 | 227 | 266.4 | 558.1 | (487.9 to 635.6) | 0.85 | (0.74 to 0.97) | |
| Sex | Male | 1398 | 1030.7 | 792.7 | (751.7 to 835.4) | 1.36 | (1.29 to 1.43) |
| Female | 915 | 461.1 | 575.2 | (538.5 to 613.7) | 1.98 | (1.86 to 2.12) | |
| Deprivation quintile | 1-least deprived | 315 | 234.4 | 616.1 | (549.9 to 688.0) | 1.34 | (1.20 to 1.50) |
| 2 | 391 | 273.5 | 653.7 | (590.5 to 721.8) | 1.43 | (1.29 to 1.58) | |
| 3 | 464 | 303.2 | 688.4 | (627.2 to 754.0) | 1.53 | (1.39 to 1.68) | |
| 4 | 492 | 325.1 | 663.9 | (606.5 to 725.2) | 1.51 | (1.38 to 1.65) | |
| 5 - most deprived | 651 | 355.6 | 784.5 | (725.4 to 847.2) | 1.83 | (1.69 to 1.98) | |
| Period of first diagnosis | 2000–2004 | 762 | 535.8 | 633.3 | (589.2 to 680.0) | 1.42 | (1.32 to 1.53) |
| 2005–2009 | 941 | 575.2 | 724.6 | (679.1 to 772.5) | 1.64 | (1.53 to 1.74) | |
| 2010–2014 | 610 | 380.9 | 715.4 | (659.8 to 774.5) | 1.60 | (1.48 to 1.73) | |
| Elapsed follow-up time | 6–12 months | 390 | 450.9 | 401.4 | (362.5 to 443.3) | 0.87 | (0.78 to 0.96) |
| 1–5 years | 1302 | 804.8 | 698.9 | (661.4 to 737.9) | 1.62 | (1.53 to 1.71) | |
| 5–10 years | 621 | 236.2 | 1194.9 | (1102.7 to 1292.6) | 2.63 | (2.43 to 2.84) | |
The most common smoking-related second SPC in this cohort was NSCLC, with 1318 SPCs (table 2), primarily adenocarcinoma (485 SPCs) or squamous cell carcinoma (400 SPCs). Bladder cancers were next most common (397 SPCs) followed by head and neck cancers (210 SPCs). However, there were many more laryngeal cancers (SIR 2.8, 95% CI 2.3 to 3.4 and OSCC, SIR 2.4, 95% CI 2.0 to 2.8) than would be expected given incidence rates in the general population, although absolute numbers of these rarer cancers remained small (122 laryngeal and 124 OSCC). Additional results on risk by the site of SPC and by histological type of first primary lung cancer are shown in online supplementary appendix 4.
Variation in SPC incidence rates over follow-up
Absolute incidence rate
For patients aged 50–59, 60–69 or 70–79 at first cancer diagnosis, absolute incidence of SPC increased sharply from 6 to 36 months follow-up, and then increased more slowly or remained stable up to 10 years after first cancer (figure 1; online supplementary appendix 4 table 1). For example, at 1 year after first primary in men aged 50–59, incidence of SPC was 373 per 100 000 patient-years (95% CI 298 to 468), rising to 718 (578 to 892) at 3 years and 895 (731 to 1096) at 5 years, with the rate at 10 years being 999 (770 to 1296). For younger patients, aged 30–49 at first cancer, incidence rates remained relatively low throughout follow-up. For those aged 80–99, small sample size prevents meaningful long-term examination of SPC risk. In contrast to incidence in the general population, absolute incidence was relatively similar for men and women with NSCLC in most age groups (figure 1).
Figure 1.

Absolute incidence of second and higher order smoking-related primary cancers after lung diagnosis up to 10 years follow-up, by sex and age group.
Standardised incidence rate ratio
Patients aged 50–59, 60–69 and 70–79 at first lung cancer diagnosis had a higher-than-expected incidence of smoking-related SPCs from 3 to at least 10 years follow-up, when compared with the general population without lung cancer (figure 2; online supplementary appendix 4 table 1). Similar to absolute incidence rates, SIRs increased rapidly from 6 months to 3 years follow-up, but then remained stable or slightly decreased as follow-up continued. For example, the SIR for SPC in men diagnosed with first primary lung cancer aged 50–59 was 1.5 (95% CI 1.2 to 1.8) at 1-year follow-up, increasing to 2.8 (2.3 to 3.5) at 3 years. From 3 years, the SIR decreased slightly but remained higher than the risk in the general population over the entire follow-up (eg, SIR 2.9 at 5 years, 2.6 at 7 years, 2.2 at 10 years, online supplementary appendix 4 table 1). Results for those aged 30–49 were highly variable due to the smaller number of cancers than expected in this group, and similarly to the absolute results, meaningful estimation of long-term SPC risk was not possible for those aged 80–99.
Figure 2.
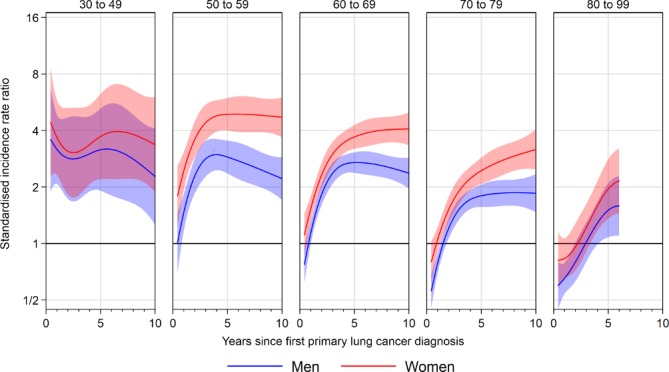
Standardised incidence rate ratios for second and higher order smoking-related primary cancers after lung diagnosis up to 10 years follow-up, by sex and age group. Results for the 30–49 age group are imprecise due to the small number of cancers expected in this group.
Of note, women had higher SIR for smoking-related SPC than men, with SIR for women aged 60–69 at diagnosis being 3.7 (95% CI 3.2 to 4.3) at 5 years follow-up compared with 2.7 (2.4 to 3.1) for men (figure 2). Similar differences were seen in other age groups.
Analysis of different cancer sites revealed that they followed one of three patterns. SIRs for second primary NSCLC and SCLC followed the same pattern as the overall SIRs, beginning with reduced risk but increasing over time (figure 3). SIRs for second primary OSCC, laryngeal cancer and head and neck cancer were elevated across the entire period of follow-up. SIRs for second primary bladder cancer were similar to the general population at the start and end of follow-up, appearing to peak at around 5 years from first primary lung cancer diagnosis, with an SIR at 5 years of 1.8 (95% CI 1.5 to 2.2) (figure 3).
Figure 3.
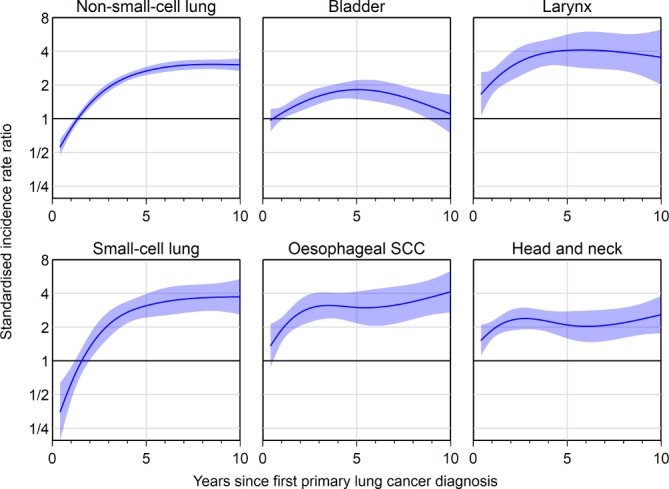
Standardised incidence rate ratios for second and higher order smoking-related primary cancers after lung diagnosis up to 10 years follow-up, by site of second primary cancer. SCC, squamous cell carcinoma.
Trends in incidence by year of first primary lung cancer diagnosis
Patients with more recent first primary lung cancers had higher rates of second primary lung cancers. The incidence rate among patients first diagnosed with lung cancer in 2010–2014 was 715 per 100 000 patient-years (95% CI 660 to 775, table 2), higher than among those first diagnosed in 2000–2004 (633, 589 to 680). Given differences in elapsed follow-up, we would have anticipated higher incidence rates among those diagnosed in earlier periods. A more detailed examination, limiting to data between 6 months and 5 years from diagnosis, showed that patients with first primary lung cancer diagnosed in 2010–2014 had double the rate of second primary lung cancers compared with those with first primary diagnosis in 2000–2004 (figure 4A) even though most patients diagnosed in 2010–2014 had not reached 5 years follow-up. In contrast, rates of other smoking-related SPCs remained stable between 2000 and 2014 (figure 4A). Adjusting for patient age, sex, deprivation and elapsed follow-up did not meaningfully change these results (figure 4B).
Figure 4.

Incidence rate ratio for incidence of second primary cancers between 6 and 60 months after first primary lung cancer diagnosis in patients diagnosed with first primary lung cancer in 2005–2009 and 2010–2014 compared with 2000–2004, split into lung cancer, bladder cancer and OSCC, laryngeal, head and neck cancer. Note that most patients diagnosed in 2010–2014 have less than 5 years follow-up in our analysis dataset. OSCC, oesophageal squamous cell carcinomas.
Discussion
There is strong evidence that elevated incidence of second and higher order primary cancers prevails for at least 10 years from first lung cancer diagnosis for patients aged 50–59, 60–69 and 70–79 at first cancer diagnosis. Oesophageal squamous and laryngeal cancers are associated with the greatest excess incidence in lung cancer survivors, although the most frequent type of subsequent malignancy is another lung cancer. We have also identified that the incidence of second primary lung cancer has doubled between 2000–2004 and 2010–2014.
Some recent studies have reported an increased risk of SPC after lung cancer compared with the general population.3–6 15–18 One large cohort study in the USA found the incidence of second primary lung cancer was 1% per patient-year,18 with higher SIRs for women and for younger patients, but did not explore changes in incidence over follow-up from the first primary cancer diagnosis. The majority of other studies had relatively small samples of patients with lung cancer,4 5 15 16 preventing detailed analysis of incidence by patient characteristics or site of SPC. Other work focuses on describing factors associated with higher risk or incidence of SPC among patients with lung cancer.19–21 These show that risk varies by patient demographics and behaviour and are similar, if not more important, than tumour factors. These studies are broadly in agreement with our results that incidence is highest in patients aged between 50 and 79 at first lung cancer diagnosis with relatively small differences between the main histological subtypes of lung cancer.19 They confirm that continued smoking is associated with higher risk of SPC and adverse outcomes,22 with smoking cessation reducing the incidence of SPC among lung cancer survivors.20
Our observation that the incidence rate of SPC is lower in the first 2 years of follow-up may be explained by the fact that many tumours, which would have been diagnosed during this period, were diagnosed during initial investigation for lung cancer and were excluded from analysis because we a priori excluded subsequent registrations within the first 6 months from diagnosis of an index smoking-related cancer. The second possibility is that patients with an SPC diagnosed early in follow-up may have been mislabelled as a recurrence of the first primary cancer by their treating clinicians rather than as a true SPC. This is a particularly plausible explanation given that the risk of non-lung SPCs was not reduced at the beginning of follow-up.
Major strengths of our study are its large sample size and population-based nature including all English residents diagnosed with first primary lung cancer between 2000 and 2014. This has allowed us to estimate age-specific and sex-specific incidence for several strata and given sufficient numbers of cancer survivors for meaningful estimation of incidence rates even 10 years after the first lung cancer diagnosis. The flexible parameterisation of follow-up time avoids arbitrary categorisation (and associated loss of statistical power) and enables the assessment of variation in incidence during the time from diagnosis.
The main study limitation is the lack of information on smoking status before and after diagnosis, both of which are moderators of SPC risk.20 Additionally, we have not been able to investigate the impact of tumour factors, such as stage at diagnosis, because this information is incomplete for most study years. Staging information is much more complete for patients diagnosed from 2013 onwards, but these patients do not yet have any meaningful length of follow-up for analysis.
The key implication of this work is that incidence rates for second and higher order primary cancers continue to rise beyond the end of routine specialist 5-year follow-up after an initial lung cancer diagnosis. Given the incidence of SPC varies substantially by age at first diagnosis, consideration should be given to extending routine follow-up from 5 to 10 years, particularly for patients aged 50–79 at first diagnosis. In addition, this evidence can be used to inform lung cancer survivors and their families about the level and nature of risk of other organ cancers; this prognostic information is important for patients and clinicians and may facilitate patient education about possible symptoms of subsequent cancers and, given previous evidence of associations between continued smoking and incidence of further primary cancers, enhance smoking cessation among lung cancer survivors.
Surveillance efforts to promote early detection of subsequent smoking-related primary cancers should focus equally on both men and women. SIRs for second and higher order primary cancers are much higher in female survivors than male survivors. This is due to absolute incidence rates of subsequent primary cancers being similar for both men and women, despite incidence of first primary cancers being higher among men.
Survival rates, particularly for early-stage disease, are expected to improve further which will lead to an increasing population of patients alive 5, 10 or more years from their diagnosis. Our findings suggest a stable increase in the incidence of smoking-related cancers among lung cancer survivors, which will lead to an increasing number of diagnoses of SPC. The observation that the incidence of second primary lung cancer has doubled between 2000–2004 and 2010–2014 indicates that this issue is becoming increasingly important. The reasons behind this rapid change require further investigation but may be related to the changes in incidence of multifocal adenocarcinoma, particularly in women and to an increasing recognition of the issue of SPCs.
The optimal follow-up schedules and investigations to manage this expanding pool of cancer survivors will need to be determined by guideline development groups and policy-makers. Patient and clinician education about risks of SPC will be required to promote prompt diagnosis thereby achieving the best possible longer term outcomes.
Acknowledgments
Data for this study are based on information collected and quality assured by the PHE National Cancer Registration and Analysis Service. Access to the data was facilitated by the Public Health England Office for Data Release. We thank David Greenberg for early discussions around this analysis and for help assigning morphology groups and Catherine Saunders for useful discussions about the analytical approach. We are grateful to Doris Rassl, Consultant Histopathologist for help with review of lung cancer coding.
Footnotes
Contributors: RCR conceived the study and MEB, GL, FMW, SJ and RCR designed it. MEB performed statistical analyses and wrote the first draft. All authors contributed to revisions and approved the final manuscript. The guarantor (RCR) accepts full responsibility for the work, had access to the data and controlled decision to publish.
Funding: This study was supported the Early Diagnosis programme Cancer Research UK Cambridge Centre. FMW is supported by an NIHR Clinician Scientist award. GL is supported by a Cancer Research UK award (Advanced Clinician Scientist Fellowship C18081/A18180). RCR is part funded by the Cambridge Biomedical Research Centre and Cancer Research UK Cambridge Centre.
Disclaimer: The funder had no input into the study design, collection, analysis or interpretation of the data, in the writing of the report or in the decision to submit the paper for publication.
Competing interests: None declared.
Patient consent: Not required.
Provenance and peer review: Not commissioned; externally peer reviewed.
References
- 1. Walters S, Benitez-Majano S, Muller P, et al. Is England closing the international gap in cancer survival? Br J Cancer 2015;113:848–60. 10.1038/bjc.2015.265 [DOI] [PMC free article] [PubMed] [Google Scholar]
- 2. De Angelis R, Sant M, Coleman MP, et al. Cancer survival in Europe 1999-2007 by country and age: results of EUROCARE-5-a population-based study. Lancet Oncol 2014;15:23–34. 10.1016/S1470-2045(13)70546-1 [DOI] [PubMed] [Google Scholar]
- 3. Tabuchi T, Ito Y, Ioka A, et al. Incidence of metachronous second primary cancers in Osaka, Japan: update of analyses using population-based cancer registry data. Cancer Sci 2012;103:1111–20. 10.1111/j.1349-7006.2012.02254.x [DOI] [PMC free article] [PubMed] [Google Scholar]
- 4. Jégu J, Colonna M, Daubisse-Marliac L, et al. The effect of patient characteristics on second primary cancer risk in France. BMC Cancer 2014;14:94 10.1186/1471-2407-14-94 [DOI] [PMC free article] [PubMed] [Google Scholar]
- 5. Youlden DR, Baade PD. The relative risk of second primary cancers in Queensland, Australia: a retrospective cohort study. BMC Cancer 2011;11:83 10.1186/1471-2407-11-83 [DOI] [PMC free article] [PubMed] [Google Scholar]
- 6. Surapaneni R, Singh P, Rajagopalan K, et al. Stage I lung cancer survivorship: risk of second malignancies and need for individualized care plan. J Thorac Oncol 2012;7:1252–6. 10.1097/JTO.0b013e3182582a79 [DOI] [PubMed] [Google Scholar]
- 7. Siegel RL, Jacobs EJ, Newton CC, et al. Deaths due to cigarette smoking for 12 smoking-related cancers in the United States. JAMA Intern Med 2015;175:1574–6. 10.1001/jamainternmed.2015.2398 [DOI] [PubMed] [Google Scholar]
- 8. Møller H, Richards S, Hanchett N, et al. Completeness of case ascertainment and survival time error in English cancer registries: impact on 1-year survival estimates. Br J Cancer 2011;105:170–6. 10.1038/bjc.2011.168 [DOI] [PMC free article] [PubMed] [Google Scholar]
- 9. Working Group Report. International rules for multiple primary cancers (ICD-0 third edition). Eur J Cancer Prev 2005;14:307–8. 10.1097/00008469-200508000-00002 [DOI] [PubMed] [Google Scholar]
- 10. Department for Communities and Local Government. English indices of deprivation 2015. 2015. https://www.gov.uk/government/statistics/english-indices-of-deprivation-2015
- 11. Office for National Statistics. Lower super output area mid-year population estimates. 2015. http://www.ons.gov.uk/peoplepopulationandcommunity/populationandmigration/populationestimates/datasets/lowersuperoutputareamidyearpopulationestimates (Accessed 07 Mar 2016).
- 12. Bennette C, Vickers A. Against quantiles: categorization of continuous variables in epidemiologic research, and its discontents. BMC Med Res Methodol 2012;12:21 10.1186/1471-2288-12-21 [DOI] [PMC free article] [PubMed] [Google Scholar]
- 13. Harrel FE. Regression modelling strategies: with applications to linear models, logistic regression, and survival analysis. New York: Springer, 2015. [Google Scholar]
- 14. Akaike H. A new look at the statistical model identification. IEEE Trans Automat Contr 1974;19:716–23. 10.1109/TAC.1974.1100705 [DOI] [Google Scholar]
- 15. Coyte A, Morrison DS, McLoone P. Second primary cancer risk - the impact of applying different definitions of multiple primaries: results from a retrospective population-based cancer registry study. BMC Cancer 2014;14:272–72. 10.1186/1471-2407-14-272 [DOI] [PMC free article] [PubMed] [Google Scholar]
- 16. Su VY, Liu CJ, Chen YM, et al. Risk of second primary malignancies in lung cancer survivors - The influence of different treatments. Target Oncol 2017;12:219–27. 10.1007/s11523-016-0459-0 [DOI] [PubMed] [Google Scholar]
- 17. Abdel-Rahman O, Cheung WY. Subsequent thoracic cancers among patients diagnosed with lung cancer: a SEER database analysis. Curr Med Res Opin 2017;33:2009–17. 10.1080/03007995.2017.1333953 [DOI] [PubMed] [Google Scholar]
- 18. Thakur MK, Ruterbusch JJ, Schwartz AG, et al. Risk of second lung cancer in patients with previously treated lung cancer: analysis of Surveillance, Epidemiology, and End Results (SEER) Data. J Thorac Oncol 2018;13:46–53. 10.1016/j.jtho.2017.09.1964 [DOI] [PMC free article] [PubMed] [Google Scholar]
- 19. Han SS, Rivera GA, Tammemägi MC, et al. Risk stratification for second primary lung cancer. J Clin Oncol 2017;35:2893–9. 10.1200/JCO.2017.72.4203 [DOI] [PMC free article] [PubMed] [Google Scholar]
- 20. Tabuchi T, Ito Y, Ioka A, et al. Tobacco smoking and the risk of subsequent primary cancer among cancer survivors: a retrospective cohort study. Ann Oncol 2013;24:2699–704. 10.1093/annonc/mdt279 [DOI] [PubMed] [Google Scholar]
- 21. Donin N, Filson C, Drakaki A, et al. Risk of second primary malignancies among cancer survivors in the United States, 1992 through 2008. Cancer 2016;122:3075–86. 10.1002/cncr.30164 [DOI] [PMC free article] [PubMed] [Google Scholar]
- 22. Warren GW, Sobus S, Gritz ER. The biological and clinical effects of smoking by patients with cancer and strategies to implement evidence-based tobacco cessation support. Lancet Oncol 2014;15:e568–80. 10.1016/S1470-2045(14)70266-9 [DOI] [PMC free article] [PubMed] [Google Scholar]
Associated Data
This section collects any data citations, data availability statements, or supplementary materials included in this article.
Supplementary Materials
thoraxjnl-2018-212456supp001.pdf (1.2MB, pdf)