

Abstract
Genomic structural variants (SVs) are distributed nonrandomly across the human genome. The “hotspots” of SVs have been implicated in evolutionary innovations, as well as medical conditions. However, the evolutionary and biomedical features of these hotspots remain incompletely understood. Here, we analyzed data from 2,504 genomes to construct a refined map of 1,148 SV hotspots in human genomes. We confirmed that segmental duplication–related nonallelic homologous recombination is an important mechanistic driver of SV hotspot formation. However, to our surprise, we also found that a majority of SVs in hotspots do not form through such recombination-based mechanisms, suggesting diverse mechanistic and selective forces shaping hotspots. Indeed, our evolutionary analyses showed that the majority of SV hotspots are within gene-poor regions and evolve under relaxed negative selection or neutrality. However, we still found a small subset of SV hotspots harboring genes that are enriched for anthropologically crucial functions and evolve under geography-specific and balancing adaptive forces. These include two independent hotspots on different chromosomes affecting alpha and beta hemoglobin gene clusters. Biomedically, we found that the SV hotspots coincide with breakpoints of clinically relevant, large de novo SVs, significantly more often than genome-wide expectations. For example, we showed that the breakpoints of multiple large SVs, which lead to idiopathic short stature, coincide with SV hotspots. Therefore, the mutational instability in SV hotpots likely enables chromosomal breaks that lead to pathogenic structural variation formations. Overall, our study contributes to a better understanding of the mutational and adaptive landscape of the genome.
Keywords: copy number variation, CNV, background selection, hemoglobin, SHOX deficiency
Introduction
Structural variants (SVs) are an important source of polymorphic genomic variation within primate species (Conrad et al. 2010; Gokcumen et al. 2011; Gokcumen, Tischler, et al. 2013; Sudmant et al. 2015). Unlike single nucleotide variants, SVs involve blocks of sequences that vary in copy number (Conrad et al. 2010), chromosomal locations, or directionality (Feuk et al. 2006; Alkan et al. 2011). Given their larger size, an individual SV potentially has a higher phenotypic impact than single nucleotide variants, especially when affecting functional sequences (Conrad et al. 2010; Iskow, Gokcumen, Abyzov, et al. 2012; Iskow, Gokcumen, and Lee 2012). In fact, SVs have been associated with many human diseases (Weischenfeldt et al. 2013), especially autoimmune, metabolic, and cognitive disorders (Hollox et al. 2008; Stefansson et al. 2008; Traherne et al. 2010; Polley et al. 2015). However, the haplotype architectures around SVs are generally complex due to repeat content, gene conversion, and recurrent formation of SVs, making it difficult to accurately impute them in genome-wide association studies (Sudmant et al. 2015). As such, it is plausible that many disease-associated SVs are yet to be revealed. For example, recent locus-specific studies have unearthed novel SVs with associations to schizophrenia (Sekar et al. 2016) and blood cholesterol levels (Boettger et al. 2016) that were invisible to previous genome-wide association studies. So, the biomedical impact of SVs is likely greater than is currently appreciated.
SVs exhibit a nonrandom distribution across the human genome. For example, it has been observed that SVs cluster into “hotspots” on primate genomes (Perry et al. 2006; Gokcumen et al. 2011). These early studies have developed both mechanistic and evolutionary scenarios to explain the formation and maintenance of these hotspots. Specifically, Perry et al. (2006) highlighted nonallelic homologous recombination (NAHR) during meiosis as the major mechanistic contributor to hotspot formation. Gokcumen et al. (2011) identified nonneutral evolutionary forces that have maintained hotspots since before the human–rhesus macaque ancestor. However, the recent and more complete human SV data sets (Sudmant et al. 2015) allow us to answer three questions in a more definitive manner: What are the features of local genomic architecture facilitating the formation of hotspots? What are, if any, the adaptive forces that maintain hotspots? What is the biomedical impact of SV hotspots in the human genome?
The presence of SV hotspots can be understood as an interplay between the mutational mechanisms that give rise to them and the evolutionary forces that eliminate or maintain them. Indeed, previous studies have reported the coincidence of SVs with specific genomic architectural features (Hastings et al. 2009). One of the genomic features commonly accompanying SVs is segmental-duplication content (Sharp et al. 2005; Bailey and Eichler 2006; She et al. 2008). The long and highly homologous sequences of tandem segmental duplications enable the misalignment between paralogous counterparts during recombination, which leads to unequal crossing over. This process is called NAHR. Segmental duplication–mediated NAHR is a major cause of recurrent, de novo genomic rearrangements that are associated with rare disorders (Dittwald et al. 2013). Nonpathogenic SVs are also commonly observed within segmental duplication–rich regions (Conrad et al. 2010). Segmental duplications are discussed as the primary genomic element that facilitates the formation of SV hotspots (Hastings et al. 2009; Zarrei et al. 2015), especially in great apes, the genomes of which have been shaped by a “burst” of segmental duplications (Marques-Bonet et al. 2009; Gokcumen, Tischler, et al. 2013).
Another component of genomic architecture associated with SVs is transposable elements. For example, artificially introducing a single copy of the highly repeated Ty element into the yeast genome increased the local rate of genomic rearrangements (Chan and Kolodner 2011). In primate genomes, the rearrangements mediated by retroelements were suggested as an important factor in primate genome evolution (Cordaux and Batzer 2009). Moreover, studies have discovered cases of human SVs generated through Alu-, HERV-, or LINE-mediated NAHR (Robberecht et al. 2013; Campbell et al. 2014; Startek et al. 2015). However, the relationship between transposable elements and SV hotspots has not been directly interrogated.
Mechanisms other than recombination-based errors (e.g., NAHR) and transposable element activity are also significant contributors to structural variation formation (Hastings et al. 2009). These include, but are not limited to nonhomologous (NH) events, such as nonreplicative NH repair, replication slippage, fork stalling, and template-switching. These events are harder to map and often can lead to complex rearrangements involving multiple SVs (Zhao et al. 2016). To further complicate the issue, the individual mechanisms are not necessarily independent of each other and the genomic architectural features that facilitate some of these mechanisms are not uniformly distributed across the genome. For example, Alu-richness in a locus was argued to facilitate structural variation formation through both recombination- and repair-based mechanisms (Boone et al. 2014). The exact impact of these mechanisms on the genome and their codependency is not precisely known.
Although the formation of SVs depends on their local architectures, their maintenance depends on the evolutionary forces acting upon them. It is suggested that SVs that disrupt functional sequences are mostly deleterious, and therefore have been eliminated from the human population via negative selection (Conrad et al. 2006) or drift. Indeed, previous studies have shown a drastic depletion of deletion polymorphisms from exonic regions (Conrad et al. 2010). Despite the overall depletion of SVs in functional sequences, there are still some SVs that are passively tolerated under relaxed negative selection (Nguyen et al. 2008; Eaaswarkhanth et al. 2016), and some others that are actively maintained by nonneutral evolutionary forces (Gokcumen, Zhu, et al. 2013; Polley et al. 2015; Pajic et al. 2016, 2018; Inchley et al. 2016).
In this article, we use recently available, high-resolution data sets (1000 Genomes Project Consortium et al. 2015) to define and investigate SV hotspots in the human genome both from mechanistic and evolutionary perspectives and investigate their biomedical impact.
Materials and Methods
Data Sources
We obtained the data used in this project from the following sources:
The sequencing gaps were from Genome Reference Consortium (International Human Genome Sequencing Consortium 2004). The segmental duplications were from Bailey et al. (2002) The fixed mobile elements were from RepeatMasker (Smit et al. 2016). The single nucleotide polymorphism (SNP) information was downloaded from dbSNP (Sherry et al. 2001). The coding and genic sequences were from the NCBI RefSeq Project (Pruitt et al. 2014). The genome-wide association study (GWAS) SNPs information was downloaded from GWAS catalog (Hindorff et al. 2009). The ClinVar variants were downloaded from NCBI ClinVar archive (Landrum et al. 2016). The DNase I hypersensitive sites were downloaded from ENCODE (ENCODE Project Consortium 2012). The above data were available through UCSC Table Browser (Karolchik 2004).
We parsed the data from 1000 Genomes Project Phase 3 release (1000 Genomes Project Consortium et al. 2015) for the coordinates of genomic SVs and polymorphic mobile elements. The B-statistics values were available from McVicker et al. (2009). The list of adaptive SNPs was available from Sugden et al. (2018). The list of genes under balancing selection was available from DeGiorgio et al. (2014). The deletions discovered from SHOX deficiency patients were available from Benito-Sanz et al. (2006). We estimated the breakpoints of these deletions as the midpoints of the mapping markers.
A Note on Potential Technical Issues and Biases in the Data Sets
One of the main concerns in studying SVs is that they often coincide with repeat-rich regions of the genome. This trend leads to some biases. For example, segmental-duplication sites can lead to mismapping of short-reads, where a read originating from one of the paralogs can end up mapping to the other paralog, resulting in false-positive single nucleotide variant calls, which are in fact nucleotide differences between paralogs. We addressed this issue when considered enrichment of balancing selection sites in the SV hotspot regions (detailed in the main text as well as in supplementary fig. S5, Supplementary Material online). A second bias that is important to note here with regards to SV calling, in general, is false-negatives. For example, neither the polymorphic gene duplications nor the majority of the SNPs in the amylase locus has been reported in the 1000 Genomes Project due to reduced mappability of the short-reads (supplementary fig. S7, Supplementary Material online). Thus, we believe that our data set is conservative and we failed to detect other hotspot regions in the genome. Similar mapping issues may also affect some analysis with regards to short read–dependent data sets (e.g., DNAse-seq data). To avoid such biases, we matched the repeat content of the segments that we compare to each other as described in the “Matching Intervals” section.
Hotspot Determination
We divided the autosomes and X chromosome of the human genome (hg19) into 100-kb intervals. To ensure that all intervals in our data set have the same length of annotated sequences, the remainder sequences at the distal end of chromosomes which do not make up to a full-length interval (23) are discarded from our data set. Similarly, the intervals overlapping with sequencing gaps (2,250) are discarded from our data set. Finally, we created a data set with 28,103 intervals. We mapped the 42,758 SVs (deletions, duplications, multiallelic copy number variants, inversions, and insertions) from 1000 Genomes Project Phase 3 data release to the 28,103 intervals from our data set. We assumed that the number of SVs hitting each interval would follow a Poisson probability distribution if SV distributed randomly across the genome, and built the expected Poisson distribution using the average number of SVs in each interval. The expected Poisson distribution was used to decide the criteria for SV hotspots. The intervals with an SV number equaling to or higher than the 99 percentile of the estimated Poisson probability distribution are determined as SV hotspots.
Genomic Content Measurement
We used bedtools (Quinlan and Hall 2010) to quantify the overlapping of genomic features to each of the intervals in our data set. We quantified the coverage of segmental duplications, coding sequences, genic sequences, fixed mobile elements, SNPs, GWAS SNPs, ClinVar SNPs, de novo copy number alterations (de novo CNVs), and DNase I hypersensitive sites in each interval for further comparison. We quantified the number of genes under balancing selection, SVs with specific types, and polymorphic mobile elements that have any overlap with each interval. We quantified the B-statistics of an interval by summing up the B-statistics value of all sites of the interval and dividing it by the total length of an interval.
Matching Intervals
For each SV hotspot, we used a customized python code (available through github, https://github.com/ontalin/matching-intervals; last accessed January 20, 2019) to screen out all the nonhotspot intervals that have the required genomic content similar to the hotspot (10% differences is tolerated) and randomly pick one from the subset as its matched nonhotspot interval.
Ontology Enrichment Analysis
We used the “two unranked lists of genes” mode of GOrilla to perform gene ontology (GO) overrepresentation test of genes (Eden et al. 2009). Specifically, we built a list of hotspot genes with RefSeq genes that have at least one base pair of their coding sequences overlapping with SV hotspot, and a list of background genes with RefSeq genes that have at least one base pair overlapping with any interval of our data set. The target list was compared against the background list for overrepresented GO terms. The GO terms with their q-value (false discovery rate adjusted p-value) smaller 0.05 are considered significantly overrepresented among the SV hotspot genes.
We used GREAT (McLean et al. 2010) to perform hypergeometric ontology overrepresentation test of cis-regulatory sequences. We used the bed file of SV hotspots as the target regions and the bed file of all intervals in our data set as the background regions. The ontology terms with hyper q-value <0.05 are considered overrepresented among the SV hotspots.
Results
High-Resolution Detection of Hotspots Confirms Nonrandom Distribution of SVs in the Human Genome
We determined the SV hotspots by dividing the human genome (hg19) into 28,103 100-kb nonoverlapping intervals and directly counting the number of SVs in each interval (supplementary table S1, Supplementary Material online). Using intervals of fixed size allowed us to directly compare genomic content (e.g., gene content and Guanine-Cytosine [GC] content) among intervals to conduct powerful enrichment analysis.
Overall, we worked with 42,758 independent SVs (deletions, duplications, multiallelic copy number variants, inversions, and insertions) called from 2,504 human genomes across 26 populations available through the 1000 Genomes Project Phase 3 data release (1000 Genomes Project Consortium et al. 2015). This data set gives a relatively unbiased snapshot of the distribution of SVs in the human genome with consistent variant calling pipeline as compared with more comprehensive data sets, such as Database of Genomic Variants (Zarrei et al. 2015), which integrates data from multiple studies. In addition, 1000 Genomes data set provides the complete allele frequency spectrum from multiple human populations for the variants interrogated. Last but may be the most important, 1000 Genomes data set provides well annotated polymorphic mobile element variation along with the SV calls from the same genomes. Therefore, it provides unprecedented inclusiveness, accuracy, and genomic context to the study of hotspots of structural variation. It is important to note that this data set aims to be very accurate (1000 Genomes Project Consortium et al. 2015) but sacrifices from sensitivity for achieving this accuracy.
Prior studies have demonstrated that SV distribution across the genome is nonrandom (Perry et al. 2006; Gokcumen et al. 2011). To replicate this finding in our interval-based framework, we first built a Poisson probability distribution, where we assumed that the 42,758 SVs fall randomly into the 28,103 intervals (fig. 1A). This allowed us to model the range of expected SV count within an interval. We compared the empirical observation to the expected distribution and found the empirical distribution is significantly different from the expected distribution (P < 2.2 × 10⁻¹⁶, Kolmogorov–Smirnov test). Specifically, we observed a surfeit of the SV-rich “hotspots” and the SV-free “deserts” as compared with the expectation (supplementary table S2, Supplementary Material online). We used the 99th percentile (6 SVs per 100-kb interval) of the expected distribution of SV numbers as the cutoff to determine the SV hotspots in our empirical data set, and we found 1,148 intervals (4% of all intervals). This is significantly higher than expected by chance under the assumption of a random distribution (fig. 1B, P < 0.0001, chi-square test). Conversely, we also found that the number of intervals where we found no SVs is also higher in the observed data (6,827) as compared with the expected distribution (fig. 1B, P < 0.0001, chi-square test). These results further support the nonrandom distribution of SVs across the human genome (fig. 1).
Fig. 1.
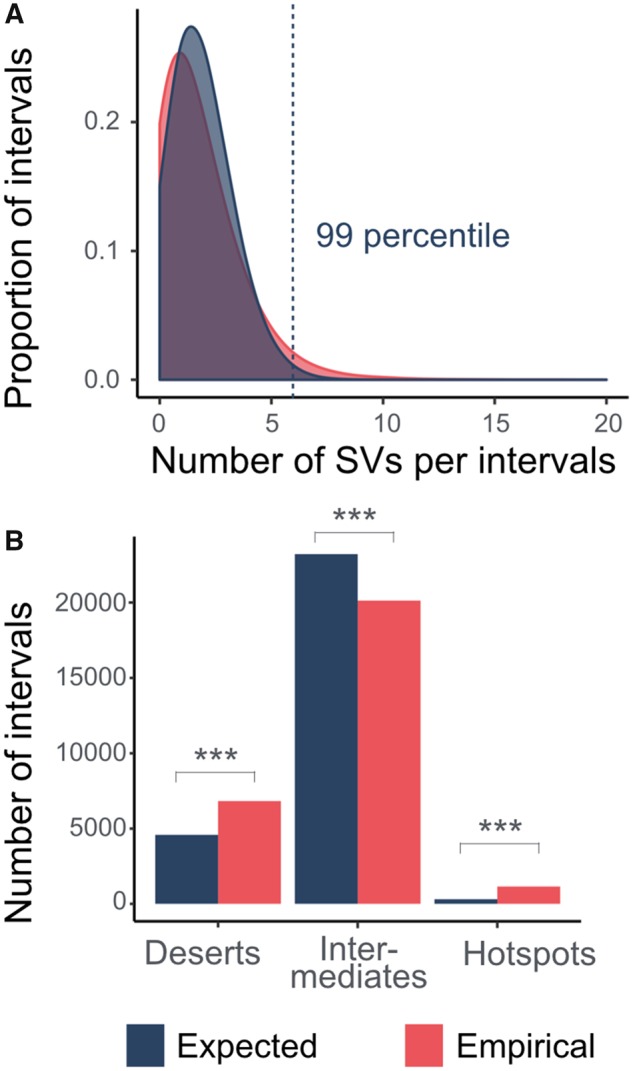
—The nonrandom distribution of SVs across human genomes. (A) The density plot overlay the empirical and the expected probability distribution of the number of SV(s) within a 100-kb-long interval of the human reference genome (hg19). The empirical probability distribution was estimated by the actual number of SVs within each of the 28,103 intervals. The expected probability distribution was estimated assuming a Poisson distribution. As compared with the expected data, the empirical data have higher proportions of the interval on both extremes of the distribution. (B) The significant enrichment of SV deserts (with no SV) and SV hotspots (with six or more SVs) in the empirical data. *** indicates where there is a significant difference with P values <0.05 as calculated by chi-square test.
NAHR and NH Mechanisms, but not Fixed Mobile Element Content, Coincide with SV Hotspots
Previous studies have shown that SV hotspots coincide with segmental duplications (Perry et al. 2006). NAHR facilitated by segmental duplications leads to recurrent genomic rearrangements (Sharp et al. 2005), which in turn contribute to the formation of SV hotspots (Perry et al. 2006). To replicate this finding, we tested the hypothesis that SV hotspots are enriched for segmental duplications. Indeed, we found the hotspot intervals harbor significantly higher level of segmental duplication as compared with the rest of the genome (P < 2.2 × 10⁻¹⁶, Mann–Whitney U test). To avoid biases in this correlation, we randomly matched nonhotspots intervals with specific hotspot intervals for their genomic composition (i.e., GC content, number of base pairs attributed to the coding sequence, mobile elements, and single nucleotide variation, supplementary table S3, Supplementary Material online). Using this matched data set, we were able to replicate the observation that the segmental-duplication content of the hotspot intervals is significantly higher than the segmental-duplication coverage of the matched nonhotspot intervals (fig. 2A, P = 9.962 × 10⁻⁴, Mann–Whitney U test). This observation implicates that NAHR mediated by segmental duplications, which present in ∼30% of the SV hotspots, is a major mechanism that leads to the formation of SV hotspots. In other words, segmental duplications increase the SV mutation rate in these hotspot regions (Liu et al. 2011). This result matches very well with the previous studies (Perry et al. 2006; Zarrei et al. 2015) and, as such, serves as a validation for our pipeline to detect SV hotspots. However, it is important to note here that there are still ∼70% of the SV hotspots whose formation cannot be explained by segmental duplication–mediated NAHR.
Fig. 2.

—The architectural characteristics and SV formation mechanisms of SV hotspots. The violin plots compare the number of base pair(s) constituting segmental duplications (A), SINEs (B), and DNA transposons (C) between the hotspots (red) and matched nonhotspot intervals (blue). The horizontal line on the plots indicates the median values. The *** signs indicate where there is a significant difference with a P value <0.05, calculated by Mann–Whitney U test. (D) The coincidence of NAHR, NH, and other SV formation mechanisms of the SVs within (red) or outside (blue) hotspots. For each category, the proportions of SVs attributed to individual mechanisms are plotted. (E) The replication timing of the hotspots (red) and nonhotspots (blue) that overlap or not overlap with any segmental-duplication content (SegDup). *** indicates where there is a significant difference with a P value <0.05, calculated by Fisher’s exact test.
We then asked what other mechanisms coincide with SV hotspots. One obvious candidate is mobile elements. Mobile elements can generate local genomic instability in many ways. For example, the homologous sequences between the dispersed mobile elements can serve as substrates for NAHR and lead to large genomic rearrangements (Kazazian and Goodier 2002; Cordaux and Batzer 2009). To test the involvement of reference genome mobile elements in SV hotspot formation, we compared the SV hotspots and their matched, nonhotspot intervals (supplementary table S3, Supplementary Material online) for their composition of fixed LINEs, SINEs, and DNA transposons (as reported in RepeatMasker [Smit et al. 2016]). To our surprise, we did not find any enrichment of mobile elements in the hotspots. In fact, we observed a slight but significant depletion of SINE elements and DNA transposons in SV hotpots as compared with the matched nonhotspot intervals (fig. 2B, SINE: P = 0.04419; fig. 2C, DNA transposon: P = 0.01719, Mann–Whitney U test). The depletion was also observed when we compared the hotspots with the rest of the genome, without matching their features (SINE: P = 1.175 × 10⁻⁶, Mann–Whitney U test; DNA transposon: P < 2.2 × 10⁻¹⁶, Mann–Whitney U test). It is important to highlight that none of the reference genome mobile elements are found to be polymorphic in the 1000 genomes project individuals. Thus, we argue that it is reasonable to consider these mobile elements as fixed. In sum, our results suggest that when the entire genome is considered, fixed mobile elements do not act as drivers of SV hotspot formation.
This finding contradicts the prediction from individual cases of SVs driven by retroelement-mediated NAHR (Belancio et al. 2009) and other observations where Alu-richness leads to recurrent SV formation (Boone et al. 2014). We were especially surprised that reference genome LINE elements are not significantly enriched in human SV hotspots despite their large size, which can lead to NAHR (supplementary fig. S1A, Supplementary Material online). To further interrogate this finding, we used available Drosophila data (Zichner et al. 2013) to conduct a similar analysis. We found a significant enrichment of Drosophila mobile element content in its reference genome in the Drosophila hotspots (defined the same way) as compared with the nonhotspot intervals (supplementary fig. S1B, Supplementary Material online, P < 2.2 × 10⁻¹⁶, Mann–Whitney U test), contrasting to our observations in the human genome. This disparity could be explained, at least partially, by the observation that Drosophila LINE elements are overall much larger and less degraded than those observed in humans (supplementary fig. S1C, Supplementary Material online, P < 2.2 × 10⁻¹⁶, Mann–Whitney U test). One possible technical caveat to this result is that the depletion of LINE elements in SV hotspots is an artifact caused by the ascertainment bias inherent in paired-end SV calling methodology, where there may be a higher false-negative rate for SVs flanking LINE elements as compared with other types of SVs. However, the Drosophila data set that we used as a comparison also depends heavily on paired-read algorithms and likely suffers from similar ascertainment bias with regards to SVs adjacent to retrotransposon elements. Thus, we argue that the more likely explanation for our results is that even though retrotransposons can induce SV formation in principle, rather short and differentiated fixed human retrotransposons are not a major contributor to SV hotspot formation in humans.
NH mechanisms potentially contribute to the formation of SV hotspots. These include non-homologous end-joining (NHEJ) events and template-switching during replication (Hastings et al. 2009). This type of mechanism does not show dependency on recombination and is difficult to identify based on the context of local architecture alone (Lam et al. 2010). As such, we used a subset of SVs from 1000 Genomes Project data set which have their formation mechanisms characterized (Sudmant et al. 2015), and we found that NH mechanisms, along with NAHR, contributed significantly to SV hotspot formation (fig. 2D, P = 1.238 × 10⁻⁴, Fisher’s exact test).
We then investigated whether the NH mechanisms are responsible for the SV hotspots that are not facilitated by segmental duplications. The NH-based mutations have been associated with later replication timing, whereas NAHR-based mutations associated with earlier replication timing as compared with the genome-wide background (Koren et al. 2012). If the hotspots without segmental duplication are attributed mainly by NH mechanisms, we would expect them to have later replication timing. Indeed, we found that the hotspots without segmental duplications replicate significantly later than the hotspots with segmental duplications (fig. 2E, P < 8.363 × 10⁻¹⁴, Mann–Whitney U test). This difference may be partly due to the earlier replication timing associated with the NAHR events in the hotspots with segmental duplications. In addition, we found that the nonhotspot regions of the genome without segmental duplications replicate later than the hotspots without segmental duplications (fig. 2E, P < 2.2 × 10⁻¹⁶, Mann–Whitney U test). Overall, our findings align well with the notion that the activity of NH mechanisms is also an important mutational contributor to SV hotspot formation.
Collectively, our results indicate that rather than overactivity of a particular mechanism, both NAHR- and NH-based mechanisms contribute to SV hotspots. Therefore, mechanistic disposition of a region for de novo SV formation (e.g., presence or absence of segmental duplications) does not fully explain the presence and distribution of SV hotspots in the human genome.
Negative Selection Shapes the Distribution of Hotspots in the Genome
Previous studies have suggested that negative selection against SVs is the predominant selective force that shapes the distribution of SVs in the genome (Conrad et al. 2010). As such, we hypothesize that SV hotspots would be biased away from conserved regions. Indeed, we found the hotspot intervals are significantly depleted with coding sequences (P = 3.278 × 10⁻¹¹, Mann–Whitney U test) and genic sequences (P = 1.378 × 10⁻¹¹, Mann–Whitney U test). When we compared the SV hotspots to regions that are matched for other genetic features (supplementary table S3, Supplementary Material online), we still observed that hotspots are significantly depleted for both coding and genic sequences (coding sequence: fig. 3A, P = 1.673 × 10⁻⁷; genic sequences: supplementary fig. S2, Supplementary Material online, P = 0.002901, Mann–Whitney U test). In addition, we found significant depletion of DNase I hypersensitive sites, which are enriched for regulatory sequences, in hotspots as compared with the rest of the genome (supplementary fig. S3, Supplementary Material online, P = 0.048, Mann–Whitney U test). These observations are especially relevant within the context of the recent study by Fudenberg and Pollard (2018) suggesting that chromatin properties and their regulatory involvement contribute to evolutionary constraints on the distribution of SVs across the genome.
Fig. 3.

—Signatures of relaxed purifying selection in hotspots. Comparisons between hotspots (red) and matched nonhotspot intervals (blue) reveal a significant depletion of the coding sequence content (A) and significant enrichment of SNPs (B) in the SV hotspots. (C) The hotspots (red) have significantly higher B-statistics as compared with the nonhotspot intervals (blue). B-Statistics is a measure of background selection where the higher the B-statistics, the lower the background selection. The horizontal lines indicate the median values. The *** signs indicate where there is a significant difference with a P value <0.05, calculated by Mann–Whitney U test.
Based on our observations, we hypothesize that SVs in functionally relevant sections of the genome, such as those that contain coding and regulatory sequences, would be eliminated from the population by the action of negative selection. In contrast, SV may be retained in regions that do not have such functional sequences along with other types of genetic variants, such as single nucleotide variants. Indeed, we found that the SV hotspots harbor more single nucleotide variants as compared with the matched nonhotspot intervals (fig. 3B, P < 2.2 × 10⁻¹⁶, Mann–Whitney U test) as well as to the genome-wide average (P < 2.2 × 10⁻¹⁶, Mann–Whitney U test). With the same logic, we reasoned that even though we found a depletion of fixed SINE elements and DNA transposons as reported above, we still expect an enrichment of polymorphic mobile elements in the hotspot regions. Our results confirmed this expectation as we showed that the SV hotspots are enriched with the polymorphic insertions of Alu and L1 as compared with the nonhotspot regions (supplementary fig. S2, Supplementary Material online, Alu: P = 0.01916; L1: P = 0.01668, Mann–Whitney U test).
These observations all support the hypothesis that negative selection is the primary force shaping the distribution of SV hotspots in the genome. In other words, SV hotspots that overlap with functional sequences have been eliminated by negative selection, whereas the hotspots overlapping with evolutionarily less conserved sequences remain. To further test this scenario, we used B-statistics, a measure of background selection (McVicker et al. 2009), to demonstrate that SV hotspots overlap with sequences affected significantly less by background selection as compared with the rest of the genome (fig. 3C, P < 2.2 × 10⁻¹⁶, Mann–Whitney U test). SV hotspots, with some exceptions that we discuss below, are distributed away from conserved, phenotypically relevant sequences, supporting the notion that most SV hotspots coincide with neutrally evolving sequences with little fitness effect. This result also suggests that the mutation rate for SVs across the human genome may be relatively high, that is, high enough to generate hotspots unless eliminated by negative selection.
Nonneutral Forces Maintain the Few Functionally Relevant SV Hotspots Involving in Environment Interaction
Despite the general depletion of coding sequences within SV hotspots, some of them harbor a relatively high proportion of genic sequences (supplementary fig. S2A, Supplementary Material online). Overall, there are 941 genes with their coding sequences overlapping with the SV hotspots (fig. 4A). Based on gene ontology enrichment analyses using GOrilla (Eden et al. 2009), we found that blood oxygen transport, sensory perception to smell, synapse assembly, and antigen-binding categories are overrepresented among the genes in SV hotspots (fig. 4A and supplementary table S4 and supplementary fig. S4, Supplementary Material online). Some of the specific genes involved in these categories have been reported to be under “rapid evolution” either because of relaxation of evolutionary constraint and/or positive selection (Voight et al. 2006; Hasin-Brumshtein et al. 2009; Lek et al. 2016). In addition, gene families in these hotspots happen to be also discussed within the context of adaptive evolution (López de Castro et al. 1982; Erlich et al. 1986; Hamza et al. 2010; Traherne et al. 2010; Ottolini et al. 2014; Krause and Pestka 2015).
Fig. 4.

—The nonneutral forces and the protein-coding roles of SV hotspots. (A) The number of genes with their coding sequences overlapping with the SV hotspots. The biological process ontologies overrepresented among the genes fall into the five distinct categories, boxed at the right of the figure. (B) Compares between the SV hotspots (red) and the nonhotspot intervals (blue) for their ratios of duplication and mCNV variant(s) over deletion variant(s) within an interval. The *** signs indicate where there is a significant difference with a P value <0.05, calculated by Mann–Whitney U test. (C) The proportions of all intervals, the nonhotspot intervals, and the hotspot intervals that overlap with genes reported as under balancing selection. (D) The proportions of these intervals that harbor the adaptive SNPs. The *** signs indicate where there is a significant difference between two sets of intervals, with a P value <0.05, calculated by Fisher’s exact test. (E) The overlaps between the hotspot intervals, the intervals with genes under balancing selection, and the intervals harboring adaptive SNPs.
To explain the presence of such genic hotspots, we propose two scenarios that are not mutually exclusive: First, it is plausible that these SVs are mostly duplications, which leads to gain-of-function/gene redundancy rather than loss-of-function. As such, their evolutionary impact may be less likely to be negative as compared with deletion variants. It follows, then, that these regions, despite being genic, may tolerate more events than other genic regions. Indeed, we found that the SV hotspots are significantly enriched for duplications and multiallelic copy number variants (fig. 4B, P < 2.2 × 10⁻¹⁶, Mann–Whitney U test).
The second possibility is that multiple alleles of the affected sequences are beneficial and actively maintained through adaptive forces. To test whether positive or balancing selective forces affect hotspots in an observable scale, we investigated enrichment of previously reported adaptive sites in SV hotspot regions. First, we surmised that balancing selection may maintain some SVs across time, which then contributes to more than the expected number of SVs observed in some of the hotspots. To specifically test this, we also examined the overlap between SV hotspots and a list of 195 genes that show signatures of balancing selection as described in a previous article (DeGiorgio et al. 2014). We found that genes that were found to be evolving under balancing selection in this data set are more often located within SV hotspots than expected by chance (fig. 4C, P = 1.554 × 10⁻⁶, Fisher exact test).
One technical issue with regards to this analysis is that the mismapping of short-reads in highly homologous sequences will create a false signal of heterozygosity. Specifically, any differences between the paralogs will register as heterozygous SNPs. This is especially a concern given that the SV hotspots are enriched with segmental-duplication contents. DeGiorgio et al. (2014) put effort to avoid such mismapping artifact by eliminating sites that overlap with common SVs as well as those sites with extremely high heterozygosity. In addition, we found that the windows harboring balancing selection sites reported in that study do not coincide with segmental duplications more than other sections of the genome (supplementary fig. S5, Supplementary Material online). Thus, we believe that the enrichment analysis we present here of balancing selection sites in SV hotspots remains robust.
Then, we hypothesized that population-specific adaptive forces may favor and thus maintain certain SVs, contributing the hotspots in the human genome. To test this, we used a recent, powerful study (Sugden et al. 2018), which interrogates each single nucleotide variation site in the genome for multiple statistics (i.e., Fst, XP-EHH, iHS, and ΔDAF), and use these data to test neutrality within a machine learning framework. By doing so, this study documents >3,000 of single nucleotide variations that underwent putative sweeps in European (CEU), Asian (CHB and JBT), and African (YRI) populations. We found that these putatively adaptive variants are overrepresented within hotspots as compared with the rest of the genome. Specifically, we found that 38 (3.3%) of the hotspots harbor the adaptive variants, which shows a significant enrichment when considering the proportion of hotspot regions (fig. 4D, P = 0.04699, Fisher exact test).
Overall, we demonstrate that the majority of the SV hotspots have little or no fitness effects. However, our results showed that a small number of SV hotspots may be evolving under selective forces and that these hotspots may have important evolutionary and biomedical relevance (fig. 4A and E). Specifically, our results reveal that the functional sequences within SV hotspots are involved in environmental interaction, blood groups, immunity, perception, and skin function. These findings are consistent with our proposed evolutionary scenario where the relatively small number of functionally relevant SV hotspots are primarily maintained through balancing, diversifying or geography-specific positive selection (Key et al. 2014). These regions should be of great interest in understanding complex diseases, particularly those related to immune-related disorders (supplementary table S5, Supplementary Material online).
Of Hotspots, Malaria, and Blood Disorders
To exemplify our findings with regards to selection in SV hotspots, we focused on the alpha and beta globin clusters, both of which are SV hotspots despite being on different chromosomes (fig. 5A). We are particularly interested in these regions because the variation herein has long been associated with protection against malaria in a geography-specific balancing selection context (Hill et al. 1991; Modiano et al. 2001). When we investigated the variation in these loci, we found that there are in total fifteen distinct SVs in these two loci—eight in the alpha globin cluster and seven in the beta globin cluster. Almost all known alpha and beta globin genes are influenced by at least one SV. Notably, it is plausible that there are even more SVs in this repeat-rich region which are not present in the 1000 Genomes data set, as the project aims to maximize accuracy over sensitivity (Sudmant et al. 2015).
Fig. 5.

—Hemoglobin gene clusters are hotspots for SVs. (A) The alpha and beta globin cluster on chr16 and chr11. Genes in these two clusters code for the two alpha (red) and the two beta (blue) globins of the hemoglobin tetramer. Boxes show the enlarged views of the two gene clusters. Genes are plotted in navy across these hotspot regions. Deletion variants are represented as blue bars and duplication variants are blue bars marked with “DUP.” (B) The allele frequency distribution of the eight SVs in the alpha globin gene cluster.
When we investigated the geographic distribution of SVs in these two hotspot regions, we found that many of them are particularly common in malaria endemic regions (fig. 5B). These include esv337548 form the alpha globin cluster, which reaches an allele frequency of 16% in sub-Saharan African populations. This particular deletion, also known as −α3.7, is one of the major genotypes leading to alpha thalassemia (Embury et al. 1980). Thalassemia, similar to sickle cell anemia, has been associated with protection against malaria (Allen et al. 1997; Clegg and Weatherall 1999). In other words, esv337548 is a prime candidate to be evolving under balancing selection in a relatively straightforward framework. Briefly, a person carrying the esv337548 deletion homozygously suffers from thalassemia traits but gains protection against malaria.
Similarly, esv337547, another thalassemia-causing deletion also known as −αSEA, is especially common in Southeast Asia (Harteveld et al. 2005). We hypothesize that these distinct SVs coexist in the globin loci because they have similar phenotypic consequences evolving under similar adaptive dynamics. Specifically, we argue that loss of a globin gene may provide protection against malaria, while conferring susceptibility to hemoglobinopathy. To support our hypothesis, we map the allele frequency distribution of each of the SVs within the alpha globin cluster. We found that although each alpha globin SV allele has variable frequencies in different populations, their cumulative frequency is high across the regions where malaria has been prevalent but close to zero in regions where it is not (fig. 5B). This is concordant with our hypothesis that the SVs affecting alpha globin cluster have been maintained in a geography-specific balancing selection context. In fact, the link between malaria, blood disorders, and SV hotspots can further be generalized as other regions that are associated with protection against malaria were found to be SV hotspots in our study, including the GYPB locus (Leffler et al. 2017).
SV Hotspots Coincide with Breakpoints of Clinically Relevant De Novo SVs
We further investigated the co-occurrence of biomedically relevant variations with hotspots. We measure the number of single nucleotide variants that are associated with health conditions in ClinVar archive (ClinVar SNPs) and GWAS SNPs across the genome. We found significantly fewer ClinVar and GWAS SNPs in hotspot intervals as compared with non-hotspot intervals (P = 6.154 × 10⁻⁸ and P = 7.837 × 10⁻⁷, respectively, Mann–Whitney U test). Furthermore, we replicated this finding by comparing SV hotspots and the matched nonhotspot intervals (supplementary table S3, Supplementary Material online). Despite the fact that there are similar amounts of coding sequences in the SV hotspots and the matched intervals, we observed a significant depletion of ClinVar SNPs (P = 0.003813, Mann–Whitney U test) and GWAS SNPs (P = 0.002612, Mann–Whitney U test) in hotspots as compared with the matched nonhotspot intervals. The observations that the disease-associated markers are depleted in the SV hotspots are consistent with the evolutionary scenario we proposed, that the negative selection has prevented SV hotspots at regions linked to fitness. A potential bias to these finding may stem from the fact that the single nucleotide variant genotyping chips used in GWAS/ClinVar studies often excluded variants in regions of segmental duplication. Such exclusion can potentially lead to the false observation that the disease-associated SNPs are depleted in the segmental duplication–rich SV hotspots. To address this issue, we normalize the GWAS and ClinVar SNP counts by the number of variants detectable by the commonly used Illumina Human Omni 2.5-8 chip in each interval. We found that the normalized GWAS SNPs and ClinVar SNPs remain significantly lower in the SV hotspots than the rest of the genome (normalized GWAS SNPs: P = 8.086 × 10⁻⁷, normalized ClinVar SNPs: P = 3.295 × 10⁻⁸, Mann–Whitney U test), as well as when compared with the nonhotspot intervals with similar GC content, exonic sequence, and total SNPs (normalized GWAS SNPs: P = 0.003288, normalized ClinVar SNPs: P = 0.003704, Mann–Whitney U test).
The majority of GWAS SNPs contribute to complex diseases in an incremental fashion (i.e., with relatively low effect sizes) and they are often under weak negative selection (Maher et al. 2012). The depletion of GWAS SNPs in SV hotspots suggests that the variation in these loci, in general, do not usually confer to susceptibility to complex diseases. However, it is important to make two notes here. First, given the difficulty to confidently establish the linkage disequilibrium relationship within an SV hotspot, it is plausible that some of the genome-wide association studies are underpowered to interrogate hotspots regions. Specifically, the higher repeat content of SV hotspots complicates mapping of short-reads. In addition, higher levels of gene-conversion events may be expected, where linkage disequilibrium is lower than the genome-wide average, complicating imputation of individual SVs. Second, as mentioned above, some SVs in these hotspots have previously been associated with complex diseases (Boettger et al. 2016; Sekar et al. 2016; Leffler et al. 2017). As such, we argue that careful evolutionary categorizations of SV hotspots, as we are attempting here, is an important step toward understanding the complete functional impact of these regions.
Functional enrichment analyses can help identify clinically relevant SV hotspots. For example, we used GREAT (McLean et al. 2010) to show that SV hotspots are enriched for genomic regions linked to the idiopathic bone development of distal limbs within the context of a series of SHOX deficiency disorders, ranging from nonspecific short stature to severe conditions such as Leri-Weill dyschondrosteosis and Langer mesomelic dysplasia (supplementary table S6, Supplementary Material online). When we investigated this locus closely, we observed that the SHOX gene, deletion of which is causal to the described disorders, is located in between two individual hotspot regions (fig. 6A). When we overlay the breakpoints of de novo deletions involving SHOX, we found a curious clustering of breakpoints within the hotspots (fig. 6A).
Fig. 6.

—The SV hotspots and the de novo CNVs. (A) A snapshot of the SV hotspots around the SHOX gene on chrX. There are two consecutive SV hotspots at the telomeric side of SHOX gene and three consecutive SV hotspots at its centromeric side (red bars). The deletions found in SHOX deficiency patients are represented as blue bars. There are twelve recurrent deletions spanned the hotspot regions on each side of the SHOX gene. Note that the breakpoints of these deletions are estimated as the midpoints of nearby mapping markers. The exact breakpoints may be more variable. (B) The number of base pair(s) affected by de novo CNVs from the ClinVar data in SV hotspots (red) and their matched intervals (blue). The dump-belled shape of the violin plots implicates that a majority of ClinVar de novo CNVs are probably larger than a single interval. The *** signs indicate where there is a significant difference with a P value <0.05, calculated by Mann–Whitney U test. (C) Overlays the density plots of the number of de novo CNV breakpoint(s) coincides with each of the hotspots (red) and nonhotspot intervals (blue). The enrichment of de novo CNV breakpoints in SV hotspots has a P value of 1.136 × 10⁻⁵, calculated by Mann–Whitney U test. (D) Overlays the density plots of the number of de novo CNV breakpoint(s) coincides with each of the hotspots (red) and nonhotspot intervals with matched segmental-duplication content (blue). The enrichment of de novo CNV breakpoints in SV hotspots has a P value of 0.008582, calculated by Mann–Whitney U test.
Previous studies found that various extremely large (generally at megabase range) de novo CNVs with similar but distinct breakpoints can lead to such disorders (Binder and Rappold 2005; Benito-Sanz et al. 2006; Chen et al. 2009). The usually devastating effects of such de novo CNVs prevent them to be passed down to offsprings, and therefore often discussed within the context of their recurrent mutation.
The notion that SV formation hotspots form points of plasticity in the genome that leads to the formation of large, de novo CNVs is an intriguing one and it also fits well with the findings of several previous studies that the segmental duplication–rich regions overlap more than expected by chance with such de novo CNVs (Sharp et al. 2006; Lupski 2007; Xu et al. 2008; Sanders et al. 2011). As such, we hypothesized that genome plasticity evident in SV hotspot regions may be linked to large chromosomal de novo events that lead to drastic developmental and cognitive disorders. Indeed, we found the hotspot intervals overlap significantly more with de novo CNVs from ClinVar database as compared with intervals with matched segmental duplication, exonic content, SNP, GC, and repeat elements (fig. 6B, P = 0.03929, Mann–Whitney U test).
This result is particularly interesting as it makes a connection between natural variation among healthy individuals and clinically relevant large de novo CNVs. The implication being that the plasticity observed in the SV hotspots predispose these regions to larger copy number alterations with major disease relevance. One mechanistic explanation for this observation is that concurrent mutational events in two distinct hotspot regions may lead to a large duplication or deletion event spanning the larger interval in these two hotspots. We tested this hypothesis and found that approximately ∼12% of the breakpoints of de novo SVs (129 out of 1,055 in ClinVar database) coincide with hotspot intervals significantly more than expected by chance (fig. 6C and supplementary table S7, Supplementary Material online, P = 1.136 × 10⁻⁵, Mann–Whitney U test).
This notion has been touched on in previous studies (Varki et al. 2008). We also asked whether this coincidence is primarily driven by segmental-duplication content that has already been shown independently for both hotspots and for de novo CNV breakpoints. To our surprise, we found that the de novo CNV breakpoints occur in SV hotspots more often than in the intervals with matched segmental-duplication contents (fig. 6D, P = 0.008582, Mann–Whitney U test), suggesting the co-occurrence of hotspots and de novo CNV breakpoints is not completely dependent on segmental-duplication content. Overall, our results suggest that hotspots indicate plastic regions of the genome where recurrent copy number changes can emerge more often than other parts of the genome. This fits well with the earlier observation that replication stress can lead to copy number changes in the same locations where both polymorphic and de novo events are observed (Arlt et al. 2009).
Discussion
Genomic SVs have increasingly been under scrutiny both within a biomedical and evolutionary context. Here, we reaffirmed previous studies that SVs are not uniformly distributed across the genome, instead they cluster within formation hotspots. Our work has attributed various architectural and evolutionary factors to the SV hotspots. We highlighted the importance of segmental duplication, relaxed negative selection, and balancing selection as the general factors associated with SV hotspots. However, we cannot oversimplify all SV hotspots as results of these factors. For example, approximately two-thirds of the SV hotspots do not contain any segmental duplications, and thus cannot be explained by segmental duplication–mediated NAHR. The role of other SV formation mechanisms, such as double-stranded break repair and template-switching (Hastings et al. 2009) remains fascinating areas of inquiry.
Understanding the mechanistic basis of SV hotspot formation is biomedically important. In this study, we showed that hotspot regions are enriched for large de novo CNVs, which are often clinically relevant. These SV formation hotspots may mark regions where the likelihood of abnormal chromosomal alterations is mechanistically increased. Similar observations have been made, especially within the context of segmental-duplication mediated NAHR (Bailey and Eichler 2006; Sharp et al. 2006). Another recent study identified “copy number stable” regions, which would correspond to deserts in our data set, as primary candidates for searching for de novo structural mutations leading to congenital disorders (Zarrei et al. 2015). Our results extend this observation to other mechanisms and showed that density of benign, smaller SVs can predict the breakpoints of pathogenic, larger de novo SVs.
A Note on Background Selection and SVs
The finding that NH mechanisms explain the majority of the SVs in the hotspot region raises a curious issue. NH mechanisms do not heavily depend on homology or other sequence motifs. Therefore, relaxation of negative selection, rather than the genomic architecture, may be the primary driver of the formation of SV hotspots. This interpretation is further supported by the enrichment of single nucleotide polymorphisms and polymorphic mobile element insertions in SV hotspots. More recent studies have suggested that background selection plays a major role in shaping the variation landscape of human genomes (Pouyet et al. 2018; Woerner et al. 2018). To follow this thread, we can conclude that nonhotspot regions of the genome may have a lower number of SVs because of the background selection. However, if that is indeed the case, the SV formation rate may actually be faster than observed but remains hidden because it would be quelled by negative selection in most of the genome.
We can envision two other forces that may contribute to the increased SNP and mobile element polymorphisms in SV hotspots. First, it is known that some single nucleotide variations can occur during SV formation, increasing the SNP content in SV-rich regions (Abyzov et al. 2015). However, it does not explain the increased mobile element polymorphisms in the region. Second, if indeed a considerable number of SV hotspots have been maintained under some type of balancing/diversifying selection, then the increased variation is expected as is observed and reported for HLA locus (Lenz et al. 2016). Indeed, when we compared the SV hotspots that harbor genes evolving under balancing selection with other SV hotspots, we see a dramatic increase in SNP and mobile element insertion polymorphisms (supplementary fig. S6, Supplementary Material online). As such, at least some co-occurrence of different types of variation (SV, mobile element, and SNP) can be explained by the action of balancing or diversifying adaptive forces. Regardless, our study provides a strong rationale for future studies to model the background selection in the human genome that incorporates the effects of SVs.
One of the novel insights we gained from this study is that balancing and positive selection are observable forces that maintain a subset of SV hotspots. It has been shown that some SVs can be maintained for hundreds of thousands of years through balancing selection (Hollox and Armour 2008; Gokcumen, Zhu, et al. 2013; Lin et al. 2015; Pajic et al. 2016). In addition to the hemoglobin clusters that we discussed above, we should also comment on the HLA locus, which is an SV hotspot not only in humans but in all primate species (Gokcumen et al. 2011). At least some variation in this locus has been evolving under diversifying selection (Parham et al. 1989; Prugnolle et al. 2005; Yawata et al. 2006; Lenz et al. 2016), where different haplotypes interact with each other to form various levels of fitness effects (Lenz et al. 2015). Moreover, the HLA locus in humans is enriched for Neanderthal haplotypes (Abi-Rached et al. 2011) and HLA variation within specific African populations is adaptively shaped by admixture events (Patin et al. 2017). As such, we argue that we can conceptualize the HLA locus as a reservoir of variation, SV and single nucleotide variation alike, where diversity is adaptively maintained through rapid changes in pathogenic pressures, and different fitness effects of diverse HLA haplotype combinations. Such adaptive scenarios can also apply to other SV hotspots, including those that harbor immune-related SV hotspots, including killer-cell immunoglobulinlike receptor genes (Traherne et al. 2010; Pelak et al. 2011; Jiang et al. 2012), immunoglobins (Watson et al. 2013), and defensin genes (Aldred et al. 2005).
Another related adaptive scenario within the context of SV hotspots is the convergent geography-specific selection. There are few such examples in humans where recurrent mutations with similar phenotypic adaptively been maintained in different populations (Sweeney et al. 2017). In fact, some of the variations in the HLA locus has been suggested to evolve in such a manner (Erlich and Gyllensten 1991; Titus-Trachtenberg et al. 1994). Our example of the globin loci, where loss-of-function mutation due to deletions can lead to resistance to malaria with the cost of causing blood disorders also fit in this general category. Another recent example is GYPB locus, which is an SV hotspot. Leffler et al. (2017) showed geography-specific selection for a given SV in this region, as this SV provides resistance to malaria -a similar situation with what is observed for globin loci, whereas it was also postulated recurrent SV formation may be an important feature of this locus (Algady et al. 2018).
Our results identify a subset of SV formation hotspots, which are enriched for genes that are involved in the environmental interaction, and implied in multiple human diseases. It seems that diverse forms of selection (Key et al. 2014) maintain the variation in these hotspots. The characterization of SV hotspots also gives hints about the global adaptive and mechanistic forces that shape the human genome. For example, we showed that some of the hotspot regions harbor dozens of adaptive single nucleotide variants, likely suggesting specific adaptive haplotypes sweeping multiple variants at the same time in these loci. The linkage between single nucleotide variants and structural variation in these loci and the evolutionary history of these putatively adaptive haplotypes remain important venues for future research.
Our work follows previous work that investigates the genomic and biomedical impact of SVs using an evolutionary framework. For example, Makino et al. (2013) highlighted the importance of cross-species SV deserts in identifying disease-related SVs in humans. Rice and McLysaght (2017) and Makino and McLysaght (2010) used conservation at both the sequence and the copy number levels as a proxy to show that SV pathogenicity can be predicted by dosage sensitivity. In sum, by constructing an updated map of SV hotspots, and outlining their broad evolutionary implications, our study opens new avenues for research to better understand genome evolution and biomedical implications of complex variations.
Supplementary Material
Supplementary data are available at Genome Biology and Evolution online.
Supplementary Material
Acknowledgments
We like to thank our friends in the Gokcumen Lab: Marie Saitou, Ozgur Taskent, Petar Pajic, and Izzy Starr for careful reading of this manuscript and multiple discussions to better present the data. We also are grateful to our colleagues Amanda Larracuente, Trevor Krabbenhoft, and Derek Taylor for their insightful criticism, which improved our manuscript substantially. This work was supported by the National Science Foundation (grant number 1714867).
Literature Cited
- 1000 Genomes Project Consortium, et al. 2015. A global reference for human genetic variation. Nature 526:68–74. [DOI] [PMC free article] [PubMed] [Google Scholar]
- Abi-Rached L, et al. 2011. The shaping of modern human immune systems by multiregional admixture with archaic humans. Science 334(6052):89–94. [DOI] [PMC free article] [PubMed] [Google Scholar]
- Abyzov A, et al. 2015. Analysis of deletion breakpoints from 1,092 humans reveals details of mutation mechanisms. Nat Commun. 6:7256.. [DOI] [PMC free article] [PubMed] [Google Scholar]
- Aldred PMR, Hollox EJ, Armour J.. 2005. Copy number polymorphism and expression level variation of the human α-defensin genes DEFA1 and DEFA3. Hum Mol Genet. 14(14):2045–2052. [DOI] [PubMed] [Google Scholar]
- Algady W, et al. 2018. The Malaria-Protective Human Glycophorin Structural Variant DUP4 Shows Somatic Mosaicism and Association with Hemoglobin Levels. Am. J. Hum. Genet. 103:769–776. [DOI] [PMC free article] [PubMed] [Google Scholar]
- Alkan C, Coe BP, Eichler EE.. 2011. Genome structural variation discovery and genotyping. Nat Rev Genet. 12(5):363–376. [DOI] [PMC free article] [PubMed] [Google Scholar]
- Allen SJ, et al. 1997. α+-Thalassemia protects children against disease caused by other infections as well as malaria. Proc Natl Acad Sci U S A. 94(26):14736–14741. [DOI] [PMC free article] [PubMed] [Google Scholar]
- Arlt MF, et al. 2009. Replication stress induces genome-wide copy number changes in human cells that resemble polymorphic and pathogenic variants. Am J Hum Genet. 84(3):339–350. [DOI] [PMC free article] [PubMed] [Google Scholar]
- Bailey JA, Eichler EE.. 2006. Primate segmental duplications: crucibles of evolution, diversity and disease. Nat Rev Genet. 7(7):552–564. [DOI] [PubMed] [Google Scholar]
- Bailey JA, et al. 2002. Recent segmental duplications in the human genome. Science 297(5583):1003–1007. [DOI] [PubMed] [Google Scholar]
- Belancio VP, Deininger PL, Roy-Engel AM.. 2009. LINE dancing in the human genome: transposable elements and disease. Genome Med. 1(10):97.. [DOI] [PMC free article] [PubMed] [Google Scholar]
- Benito-Sanz S, et al. 2006. Characterization of SHOX deletions in Léri-Weill Dyschondrosteosis (LWD) reveals genetic heterogeneity and no recombination hotspots. Am J Hum Genet. 79(2):409–414. [DOI] [PMC free article] [PubMed] [Google Scholar]
- Binder G, Rappold GA.. 2005. SHOX deficiency disorders In: Adam MP, Ardinger HH, Pagon RA, Wallace SE, Bean LJH, Stephens K, Amemiya A, editors. GeneReviews®. Seattle (WA: ): University of Washington, Seattle. [PubMed] [Google Scholar]
- Boettger LM, et al. 2016. Recurring exon deletions in the HP (haptoglobin) gene contribute to lower blood cholesterol levels. Nat Genet. 48(4):359–366. [DOI] [PMC free article] [PubMed] [Google Scholar]
- Boone PM, et al. 2014. The Alu-rich genomic architecture of SPAST predisposes to diverse and functionally distinct disease-associated CNV alleles. Am J Hum Genet. 95(2):143–161. [DOI] [PMC free article] [PubMed] [Google Scholar]
- Campbell IM, et al. 2014. Human endogenous retroviral elements promote genome instability via nonallelic homologous recombination. BMC Biol. 12:74. [DOI] [PMC free article] [PubMed] [Google Scholar]
- Chan JE, Kolodner RD.. 2011. A genetic and structural study of genome rearrangements mediated by high copy repeat Ty1 elements. PLoS Genet. 7(5):e1002089.. [DOI] [PMC free article] [PubMed] [Google Scholar]
- Chen J, et al. 2009. Enhancer deletions of the SHOX gene as a frequent cause of short stature: the essential role of a 250 kb downstream regulatory domain. J Med Genet. 46(12):834–839. [DOI] [PMC free article] [PubMed] [Google Scholar]
- Clegg JB, Weatherall DJ.. 1999. Thalassemia and malaria: new insights into an old problem. Proc Assoc Am Physicians 111(4):278–282. [DOI] [PubMed] [Google Scholar]
- Conrad DF, Andrews TD, Carter NP, Hurles ME, Pritchard JK.. 2006. A high-resolution survey of deletion polymorphism in the human genome. Nat Genet. 38(1):75–81. [DOI] [PubMed] [Google Scholar]
- Conrad DF, et al. 2010. Origins and functional impact of copy number variation in the human genome. Nature 464(7289):704–712. [DOI] [PMC free article] [PubMed] [Google Scholar]
- Cordaux R, Batzer MA.. 2009. The impact of retrotransposons on human genome evolution. Nat Rev Genet. 10(10):691–703. [DOI] [PMC free article] [PubMed] [Google Scholar]
- DeGiorgio M, Lohmueller KE, Nielsen R.. 2014. A model-based approach for identifying signatures of ancient balancing selection in genetic data. PLoS Genet. 10(8):e1004561.. [DOI] [PMC free article] [PubMed] [Google Scholar]
- Dittwald P, et al. 2013. NAHR-mediated copy-number variants in a clinical population: mechanistic insights into both genomic disorders and Mendelizing traits. Genome Res. 23(9):1395–1409. [DOI] [PMC free article] [PubMed] [Google Scholar]
- Eaaswarkhanth M, et al. 2016. Atopic dermatitis susceptibility variants in filaggrin hitchhike hornerin selective sweep. Genome Biol Evol. 8(10):3240–3255. [DOI] [PMC free article] [PubMed] [Google Scholar]
- Eden E, Navon R, Steinfeld I, Lipson D, Yakhini Z.. 2009. GOrilla: a tool for discovery and visualization of enriched GO terms in ranked gene lists. BMC Bioinformatics 10:48.. [DOI] [PMC free article] [PubMed] [Google Scholar]
- Embury SH, et al. 1980. Two different molecular organizations account for the single alpha-globin gene of the alpha-thalassemia-2 genotype. J Clin Invest. 66(6):1319–1325. [DOI] [PMC free article] [PubMed] [Google Scholar]
- ENCODE Project Consortium. 2012. An integrated encyclopedia of DNA elements in the human genome. Nature 489:57–74. [DOI] [PMC free article] [PubMed] [Google Scholar]
- Erlich H, Lee JS, Petersen JW, Bugawan T, DeMars R.. 1986. Molecular analysis of HLA class I and class II antigen loss mutants reveals a homozygous deletion of the DR, DQ, and part of the DP region: implications for class II gene order. Hum Immunol. 16(2):205–219. [DOI] [PubMed] [Google Scholar]
- Erlich HA, Gyllensten UB.. 1991. Shared epitopes among HLA class II alleles: gene conversion, common ancestry and balancing selection. Immunol Today 12(11):411–414. [DOI] [PubMed] [Google Scholar]
- Feuk L, Carson AR, Scherer SW.. 2006. Structural variation in the human genome. Nat Rev Genet. 7(2):85–97. [DOI] [PubMed] [Google Scholar]
- Fudenberg G, Pollard KS. 2019. Chromatin features constrain structural variation across evolutionary timescales. Proc. Natl. Acad. Sci. U. S. A. 116:2175–2180. [DOI] [PMC free article] [PubMed] [Google Scholar]
- Gokcumen O, Tischler V, et al. 2013. Primate genome architecture influences structural variation mechanisms and functional consequences. Proc Natl Acad Sci U S A. 110(39):15764–15769. [DOI] [PMC free article] [PubMed] [Google Scholar]
- Gokcumen O, Zhu Q, et al. 2013. Balancing selection on a regulatory region exhibiting ancient variation that predates human–neandertal divergence. PLoS Genet. 9(4):e1003404. [DOI] [PMC free article] [PubMed] [Google Scholar]
- Gokcumen O, et al. 2011. Refinement of primate copy number variation hotspots identifies candidate genomic regions evolving under positive selection. Genome Biol. 12(5):R52. [DOI] [PMC free article] [PubMed] [Google Scholar]
- Hamza TH, et al. 2010. Common genetic variation in the HLA region is associated with late-onset sporadic Parkinson’s disease. Nat Genet. 42(9):781–785. [DOI] [PMC free article] [PubMed] [Google Scholar]
- Harteveld CL, et al. 2005. Nine unknown rearrangements in 16p13.3 and 11p15.4 causing alpha- and beta-thalassaemia characterised by high resolution multiplex ligation-dependent probe amplification. J Med Genet. 42(12):922–931. [DOI] [PMC free article] [PubMed] [Google Scholar]
- Hasin-Brumshtein Y, Lancet D, Olender T.. 2009. Human olfaction: from genomic variation to phenotypic diversity. Trends Genet. 25(4):178–184. [DOI] [PubMed] [Google Scholar]
- Hastings PJ, Lupski JR, Rosenberg SM, Ira G.. 2009. Mechanisms of change in gene copy number. Nat Rev Genet. 10(8):551.. [DOI] [PMC free article] [PubMed] [Google Scholar]
- Hill AV, et al. 1991. Common west African HLA antigens are associated with protection from severe malaria. Nature 352(6336):595–600. [DOI] [PubMed] [Google Scholar]
- Hindorff LA, et al. 2009. Potential etiologic and functional implications of genome-wide association loci for human diseases and traits. Proc Natl Acad Sci U S A. 106(23):9362–9367. [DOI] [PMC free article] [PubMed] [Google Scholar]
- Hollox EJ, Armour J.. 2008. Directional and balancing selection in human beta-defensins. BMC Evol Biol. 8:113.. [DOI] [PMC free article] [PubMed] [Google Scholar]
- Hollox EJ, et al. 2008. Psoriasis is associated with increased beta-defensin genomic copy number. Nat Genet. 40(1):23–25. [DOI] [PMC free article] [PubMed] [Google Scholar]
- Inchley CE, et al. 2016. Selective sweep on human amylase genes postdates the split with Neanderthals. Sci Rep. 6:37198.. [DOI] [PMC free article] [PubMed] [Google Scholar]
- International Human Genome Sequencing Consortium. 2004. Finishing the euchromatic sequence of the human genome. Nature 431(7011):931–945. [DOI] [PubMed] [Google Scholar]
- Iskow RC, Gokcumen O, Abyzov A, et al. 2012. Regulatory element copy number differences shape primate expression profiles. Proc Natl Acad Sci U S A. 109(31):12656–12661. [DOI] [PMC free article] [PubMed] [Google Scholar]
- Iskow RC, Gokcumen O, Lee C.. 2012. Exploring the role of copy number variants in human adaptation. Trends Genet. 28(6):245–257. [DOI] [PMC free article] [PubMed] [Google Scholar]
- Jiang W, et al. 2012. Copy number variation leads to considerable diversity for B but not A haplotypes of the human KIR genes encoding NK cell receptors. Genome Res. 22(10):1845–1854. [DOI] [PMC free article] [PubMed] [Google Scholar]
- Karolchik D. 2004. The UCSC Table Browser data retrieval tool. Nucleic Acids Res. 32(90001): D493–D496. [DOI] [PMC free article] [PubMed] [Google Scholar]
- Kazazian HH Jr, Goodier JL.. 2002. LINE drive. retrotransposition and genome instability. Cell 110(3):277–280. [DOI] [PubMed] [Google Scholar]
- Key FM, Teixeira JC, de Filippo C, Andrés AM.. 2014. Advantageous diversity maintained by balancing selection in humans. Curr Opin Genet Dev. 29:45–51. [DOI] [PubMed] [Google Scholar]
- Koren A, et al. 2012. Differential relationship of DNA replication timing to different forms of human mutation and variation. Am J Hum Genet. 91(6):1033–1040. [DOI] [PMC free article] [PubMed] [Google Scholar]
- Krause CD, Pestka S.. 2015. Cut, copy, move, delete: the study of human interferon genes reveal multiple mechanisms underlying their evolution in amniotes. Cytokine 76(2):480–495. [DOI] [PubMed] [Google Scholar]
- Lam HYK, et al. 2010. Nucleotide-resolution analysis of structural variants using BreakSeq and a breakpoint library. Nat Biotechnol. 28(1):47–55. [DOI] [PMC free article] [PubMed] [Google Scholar]
- Landrum MJ, et al. 2016. ClinVar: public archive of interpretations of clinically relevant variants. Nucleic Acids Res. 44(D1):D862–D868. [DOI] [PMC free article] [PubMed] [Google Scholar]
- Leffler EM,et al. 2017. Resistance to malaria through structural variation of red blood cell invasion receptors. Science 356(6343): pii: eaam6393. [DOI] [PMC free article] [PubMed] [Google Scholar]
- Lek M, et al. 2016. Analysis of protein-coding genetic variation in 60, 706 humans. Nature 536(7616):285–291. [DOI] [PMC free article] [PubMed] [Google Scholar]
- Lenz TL, Spirin V, Jordan DM, Sunyaev SR.. 2016. Excess of deleterious mutations around HLA genes reveals evolutionary cost of balancing selection. Mol Biol Evol. 33(10):2555–2564. [DOI] [PMC free article] [PubMed] [Google Scholar]
- Lenz TL, et al. 2015. Widespread non-additive and interaction effects within HLA loci modulate the risk of autoimmune diseases. Nat Genet. 47(9):1085–1090. [DOI] [PMC free article] [PubMed] [Google Scholar]
- Lin Y-L, Pavlidis P, Karakoc E, Ajay J, Gokcumen O.. 2015. The evolution and functional impact of human deletion variants shared with archaic hominin genomes. Mol Biol Evol. 32(4):1008–1019. [DOI] [PMC free article] [PubMed] [Google Scholar]
- Liu P, et al. 2011. Frequency of nonallelic homologous recombination is correlated with length of homology: evidence that ectopic synapsis precedes ectopic crossing-over. Am J Hum Genet. 89(4):580–588. [DOI] [PMC free article] [PubMed] [Google Scholar]
- López de Castro JA, Strominger JL, Strong DM, Orr HT.. 1982. Structure of crossreactive human histocompatibility antigens HLA-A28 and HLA-A2: possible implications for the generation of HLA polymorphism. Proc Natl Acad Sci U S A. 79(12):3813–3817. [DOI] [PMC free article] [PubMed] [Google Scholar]
- Lupski JR. 2007. Genomic rearrangements and sporadic disease. Nat Genet. 39(7 Suppl):S43–S47. [DOI] [PubMed] [Google Scholar]
- Maher MC, Uricchio LH, Torgerson DG, Hernandez RD.. 2012. Population genetics of rare variants and complex diseases. Hum Hered. 74(3-4):118–128. [DOI] [PMC free article] [PubMed] [Google Scholar]
- Makino T, McLysaght A.. 2010. Ohnologs in the human genome are dosage balanced and frequently associated with disease. Proc Natl Acad Sci U S A. 107(20):9270–9274. [DOI] [PMC free article] [PubMed] [Google Scholar]
- Makino T, McLysaght A, Kawata M.. 2013. Genome-wide deserts for copy number variation in vertebrates. Nat Commun. 4:2283.. [DOI] [PubMed] [Google Scholar]
- Marques-Bonet T, et al. 2009. A burst of segmental duplications in the genome of the African great ape ancestor. Nature 457(7231):877–881. [DOI] [PMC free article] [PubMed] [Google Scholar]
- McLean CY, et al. 2010. GREAT improves functional interpretation of cis-regulatory regions. Nat Biotechnol. 28(5):495–501. [DOI] [PMC free article] [PubMed] [Google Scholar]
- McVicker G, Gordon D, Davis C, Green P.. 2009. Widespread genomic signatures of natural selection in hominid evolution. PLoS Genet. 5(5):e1000471.. [DOI] [PMC free article] [PubMed] [Google Scholar]
- Modiano D, et al. 2001. Haemoglobin C protects against clinical Plasmodium falciparum malaria. Nature 414(6861):305–308. [DOI] [PubMed] [Google Scholar]
- Nguyen D-Q, et al. 2008. Reduced purifying selection prevails over positive selection in human copy number variant evolution. Genome Res. 18(11):1711–1723. [DOI] [PMC free article] [PubMed] [Google Scholar]
- Ottolini B, et al. 2014. Evidence of convergent evolution in humans and macaques supports an adaptive role for copy number variation of the β-defensin-2 gene. Genome Biol Evol. 6(11):3025–3038. [DOI] [PMC free article] [PubMed] [Google Scholar]
- Pajic P, Lin Y-L, Xu D, Gokcumen O.. 2016. The psoriasis-associated deletion of late cornified envelope genes LCE3B and LCE3C has been maintained under balancing selection since Human Denisovan divergence. BMC Evol Biol. 16(1):265.. [DOI] [PMC free article] [PubMed] [Google Scholar]
- Pajic P, et al. 2018. Amylase copy number analysis in several mammalian lineages reveals convergent adaptive bursts shaped by diet. bioRxiv 339457. doi:10.1101/339457. [Google Scholar]
- Parham P, Lawlor DA, Lomen CE, Ennis PD.. 1989. Diversity and diversification of HLA-A, B, C alleles. J Immunol. 142(11):3937–3950. [PubMed] [Google Scholar]
- Patin E, et al. 2017. Dispersals and genetic adaptation of Bantu-speaking populations in Africa and North America. Science 356(6337):543–546. [DOI] [PubMed] [Google Scholar]
- Pelak K, et al. 2011. Copy number variation of KIR genes influences HIV-1 control. PLoS Biol. 9(11):e1001208. [DOI] [PMC free article] [PubMed] [Google Scholar]
- Perry GH, et al. 2006. Hotspots for copy number variation in chimpanzees and humans. Proc Natl Acad Sci U S A. 103(21):8006–8011. [DOI] [PMC free article] [PubMed] [Google Scholar]
- Polley S, et al. 2015. Evolution of the rapidly mutating human salivary agglutinin gene (DMBT1) and population subsistence strategy. Proc Natl Acad Sci U S A. 112(16):5105–5110. [DOI] [PMC free article] [PubMed] [Google Scholar]
- Pouyet F, Aeschbacher S, Thiéry A, Excoffier L.. 2018. Background selection and biased gene conversion affect more than 95% of the human genome and bias demographic inferences. Elife 7: pii: e36317. [DOI] [PMC free article] [PubMed] [Google Scholar]
- Prugnolle F, et al. 2005. Pathogen-driven selection and worldwide HLA class I diversity. Curr Biol. 15(11):1022–1027. [DOI] [PubMed] [Google Scholar]
- Pruitt KD, et al. 2014. RefSeq: an update on mammalian reference sequences. Nucleic Acids Res. 42(Database issue):D756–D763. [DOI] [PMC free article] [PubMed] [Google Scholar]
- Quinlan AR, Hall IM.. 2010. BEDTools: a flexible suite of utilities for comparing genomic features. Bioinformatics 26(6):841–842. [DOI] [PMC free article] [PubMed] [Google Scholar]
- Rice AM, McLysaght A.. 2017. Dosage sensitivity is a major determinant of human copy number variant pathogenicity. Nat Commun. 8:14366.. [DOI] [PMC free article] [PubMed] [Google Scholar]
- Robberecht C, Voet T, Esteki MZ, Nowakowska BA, Vermeesch JR.. 2013. Nonallelic homologous recombination between retrotransposable elements is a driver of de novo unbalanced translocations. Genome Res. 23(3):411–418. [DOI] [PMC free article] [PubMed] [Google Scholar]
- Sanders SJ, et al. 2011. Multiple recurrent de novo CNVs, including duplications of the 7q11.23 Williams syndrome region, are strongly associated with autism. Neuron 70(5):863–885. [DOI] [PMC free article] [PubMed] [Google Scholar]
- Sekar A, et al. 2016. Schizophrenia risk from complex variation of complement component 4. Nature 530(7589):177–183. [DOI] [PMC free article] [PubMed] [Google Scholar]
- Sharp AJ, et al. 2005. Segmental duplications and copy-number variation in the human genome. Am J Hum Genet. 77(1):78–88. [DOI] [PMC free article] [PubMed] [Google Scholar]
- Sharp AJ, et al. 2006. Discovery of previously unidentified genomic disorders from the duplication architecture of the human genome. Nat Genet. 38(9):1038–1042. [DOI] [PubMed] [Google Scholar]
- She X, Cheng Z, Zöllner S, Church DM, Eichler EE.. 2008. Mouse segmental duplication and copy number variation. Nat Genet. 40(7):909–914. [DOI] [PMC free article] [PubMed] [Google Scholar]
- Sherry ST, et al. 2001. dbSNP: the NCBI database of genetic variation. Nucleic Acids Res. 29(1):308–311. [DOI] [PMC free article] [PubMed] [Google Scholar]
- Smit A, Hubley R, Green P.. 2016. RepeatMasker Open-4.0. 2013–2015. http://www.repeatmasker.org; last accessed November 14, 2017.
- Startek M, et al. 2015. Genome-wide analyses of LINE-LINE-mediated nonallelic homologous recombination. Nucleic Acids Res. 43(4):2188–2198. [DOI] [PMC free article] [PubMed] [Google Scholar]
- Stefansson H, et al. 2008. Large recurrent microdeletions associated with schizophrenia. Nature 455(7210):232–236. [DOI] [PMC free article] [PubMed] [Google Scholar]
- Sudmant PH, et al. 2015. An integrated map of structural variation in 2, 504 human genomes. Nature 526(7571):75–81. [DOI] [PMC free article] [PubMed] [Google Scholar]
- Sugden LA, et al. 2018. Localization of adaptive variants in human genomes using averaged one-dependence estimation. Nat Commun. 9(1):703. [DOI] [PMC free article] [PubMed] [Google Scholar]
- Sweeney CG, et al. 2017. Convergent balancing selection on the mu-opioid receptor in primates. Mol Biol Evol. 34(7):1629–1643. [DOI] [PMC free article] [PubMed] [Google Scholar]
- Titus-Trachtenberg EA, Rickards O, De Stefano GF, Erlich HA.. 1994. Analysis of HLA class II haplotypes in the Cayapa Indians of Ecuador: a novel DRB1 allele reveals evidence for convergent evolution and balancing selection at position 86. Am J Hum Genet. 55(1):160–167. [PMC free article] [PubMed] [Google Scholar]
- Traherne JA, et al. 2010. Mechanisms of copy number variation and hybrid gene formation in the KIR immune gene complex. Hum Mol Genet. 19(5):737–751. [DOI] [PMC free article] [PubMed] [Google Scholar]
- Varki A, Geschwind DH, Eichler EE.. 2008. Human uniqueness: genome interactions with environment, behaviour and culture. Nat Rev Genet. 9(10):749–763. [DOI] [PMC free article] [PubMed] [Google Scholar]
- Voight BF, Kudaravalli S, Wen X, Pritchard JK.. 2006. A map of recent positive selection in the human genome. PLoS Biol. 4(3):e72.. [DOI] [PMC free article] [PubMed] [Google Scholar]
- Watson CT, et al. 2013. Complete haplotype sequence of the human immunoglobulin heavy-chain variable, diversity, and joining genes and characterization of allelic and copy-number variation. Am J Hum Genet. 92(4):530–546. [DOI] [PMC free article] [PubMed] [Google Scholar]
- Weischenfeldt J, Symmons O, Spitz F, Korbel JO.. 2013. Phenotypic impact of genomic structural variation: insights from and for human disease. Nat Rev Genet. 14(2):125–138. [DOI] [PubMed] [Google Scholar]
- Woerner AE, Veeramah KR, Watkins JC, Hammer MF. Forthcoming 2018. The role of phylogenetically conserved elements in shaping patterns of human genomic diversity. Mol Biol Evol. 35(9):2284–2295. [DOI] [PMC free article] [PubMed] [Google Scholar]
- Xu B, et al. 2008. Strong association of de novo copy number mutations with sporadic schizophrenia. Nat Genet. 40(7):880–885. [DOI] [PubMed] [Google Scholar]
- Yawata M, et al. 2006. Roles for HLA and KIR polymorphisms in natural killer cell repertoire selection and modulation of effector function. J Exp Med. 203(3):633–645. [DOI] [PMC free article] [PubMed] [Google Scholar]
- Zarrei M, MacDonald JR, Merico D, Scherer SW.. 2015. A copy number variation map of the human genome. Nat Rev Genet. 16(3):172–183. [DOI] [PubMed] [Google Scholar]
- Zhao X, Emery SB, Myers B, Kidd JM, Mills RE.. 2016. Resolving complex structural genomic rearrangements using a randomized approach. Genome Biol. 17(1):126.. [DOI] [PMC free article] [PubMed] [Google Scholar]
- Zichner T, et al. 2013. Impact of genomic structural variation in Drosophila melanogaster based on population-scale sequencing. Genome Res. 23(3):568–579. [DOI] [PMC free article] [PubMed] [Google Scholar]
Associated Data
This section collects any data citations, data availability statements, or supplementary materials included in this article.