

Abstract
Sinusoidal endothelial cells (SEC) and hepatic stellate cells (HSC), are closely associated specialized vascular cells residing in the hepatic sinusoid. These cells have been shown to play important roles in many different pathophysiologic processes, in particular in liver fibrosis/cirrhosis and portal hypertension. Caveolin-1 functions as a scaffolding protein, and has a variety of functions including in many disease states, such as liver cirrhosis. Although previous studies have shown that in the injured rat liver, caveolin-1 is upregulated, the precise cells in which remains unclear. Therefore, the purpose of this study was to clarify the cell type (or types) in which caveolin-1 is expressed in normal and injured rat liver. We have utilized both detailed immunohistochemical labeling with cell specific markers as well as cell isolation techniques (isolating sinusoidal endothelial cells, HSCs, and hepatocytes) in normal and injured (bile duct ligation) rat liver. We show here that in the normal liver caveolin-1 is expressed predominantly in HSCs and SECs but after liver injury there is upregulation of caveolin-1 in HSCs, but not in SECs. These data have functional implications for the cells in which caveolin-1 is regulated.
Keywords: nitric oxide, eNOS, signaling, immunohistochemistry, immunoblotting
Graphical Abstarct
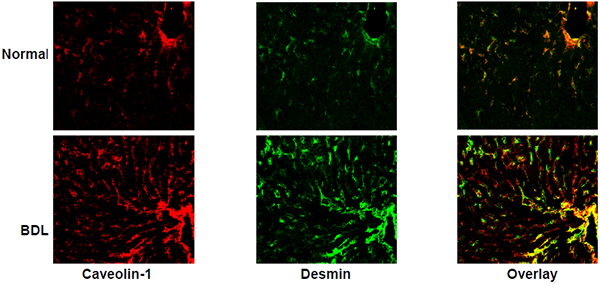
Immunohistochemical detection of caveolin-1 in normal and injured rat liver tissue. The images depict caveolin-1 co-labeling with desmin (a marker of HSCs), which is greater in the injured liver than the normal liver. Desmin labelling is visualized in portal and central vascular structures, in addition to HSCs.
1. Introduction
Sinusoidal endothelial cells (SECs) and hepatic stellate cells (HSCs) are specialized cells residing in the hepatic sinusoid. These cells have been shown to play important roles in many different pathophysiologic processes, in particular in liver fibrosis/cirrhosis and portal hypertension (Iwakiri et al., 2014).
Caveolae, organelles containing lipid rafts, are abundantly present on the plasma membrane of many specialized cells including endothelial cells, fibroblasts, epithelial cells and adipocytes (Yokomori et al., 2015). They are involved in many cellular functions including the regulation of endocytosis, intracellular trafficking, cholesterol homeostasis, and signal transduction (Simons and Toomre, 2000). Caveolin-1, a 22KDa integral membrane protein, is one of the important proteins found in caveolae. Caveolin-1 has been shown to play a role in tissue repair and fibrosis in different studies (Gvaramia et al., 2013). For example, previous investigation reported downregulation of caveolin-1 in a radiation/bleomycin induced lung fibrosis model (Kasper et al., 1998; Tourkina et al., 2008) and also in other fibrotic diseases such as idiopathic pulmonary fibrosis, scleroderma, cardiac fibrosis, keloid scars and systemic sclerosis (Del Galdo et al., 2008; Miyasato et al., 2011; Wang et al., 2006; Zhang et al., 2011). In contrast, caveolin-1 expression has been reported to be elevated in liver diseases after liver injury (Gao et al., 2014; Yamazaki et al., 2013; Yokomori et al., 2002), including after alcoholic liver injury (Gao et al., 2014), fatty liver disease (Qiu et al., 2013), liver regeneration after partial hepatectomy (Mayoral et al., 2007), and hepatocellular carcinomas (Cokakli et al., 2009; Zhang et al., 2009). Additionally, there has been confusion about expression and cellular localization of caveolin-1 in the liver (Garver et al., 1997; Oh et al., 1998). In one study, caveolin-1 was suggested to be present in SECs (Garver et al., 1997) whereas, in another it was reported to be enriched in hepatocytes (Pol et al., 1999). However, careful review of the literature indicates that the precise cellular localization of caveolin-1 in liver is unclear and that there is a need for more robust data that elucidates the specific cell type(s) in which caveolin-1 is expressed in the liver, especially after injury.
Given other literature in which during injury, caveolin-1 is regulated primarily in fibrogenic cells (Gvaramia et al., 2013), we hypothesized that in the liver during injury, caveolin-1 expression is regulated primarily in HSCs rather than other liver specific cells. To test this hypothesis, we have utilized cell isolation techniques as well as immunohistochemical methodology to more accurately assess caveolin-1 expression during liver injury.
2. Material and methods
2.1. Isolation and culture of liver cells
HSCs and SECs were isolated as described previously. In brief, the liver was perfused sequentially with a series of the following solutions: solution A: L15 buffer containing EGTA (0.5mM) and glucose (5mM); solution B: L15 containing CaCl2 (3.8mM) and pronase (1mg/ml, Roche); solution C: L15 containing CaCl2 (0.38mM) and collagenase type I (0.13mg/ml, Worthington). The digested liver was agitated in solution D (L15 containing pronase (0.2mg/ml) and DNase (0.0375mg/ml) at 37°C for 20 minutes. The resultant cell suspension was washed once with cold GBSS, and resuspended in cold GBSS solution with Accudenz (Accudenz, Accurate Chemical & Scientific Co., Westbury, NY) gradients and centrifuged as described (Shi and Rockey, 2010). After centrifugation, HSCs were removed from the upper part of gradient, washed and placed in plastic culture dishes in 199OR medium containing 20% serum (10% horse/calf). Cell purity was assessed after 24 hours by examination of morphologic features, vitamin A droplets, and immunohistochemical detection of desmin (characteristic of HSCs) and was greater than 95%. HSCs underwent spontaneous activation after 3 to 5 days when grown in 199OR medium containing 20% serum (Rockey et al., 1992). SECs were isolated with the same methodology except that they were removed from the middle part of the gradient and further purified by centrifugal elutriation (15–18 ml/min flow) as described (Liu et al., 2012). SECs were plated on rat-tail collagen coated dishes in the same medium as above. Cell purity was assessed by visual inspection of SEC cultures, and in addition, contamination with HSCs and/or Kupffer cells was detected by immunolabeling and/or immunoblotting with anti-desmin (Abcam, Cambridge, MA) and anti-F4/80 (Abcom, Cambridge, MA) antibodies, respectively as previously described (Rockey and Chung, 1994). Only primary sinusoidal endothelial isolates of >95% purity were used for study. For hepatocyte isolation, liver was digested by collagenase type I only and hepatocytes were separated by centrifugation in percoll gradient (Sigma, St. Louis, MO) and cultured on rat-tail collagen coated dishes in the same medium as above. All cells were grown at 37 °C with 2.5% CO2. Cell purity was assessed by visual inspection of hepatocyte cultures, and in addition, contamination with nonparenchymal cells was as above.
2.2. Liver injury induced by bile duct ligation
Liver injury and portal hypertension were induced by performing bile duct ligation in 450–500-g male retired breeder Sprague-Dawley rats. The common bile duct was isolated, ligated at two locations. This model creates a portal based fibrogenic response and portal hypertension in 10–14 days of surgery (Connelly et al., 2005). In sham-operated rats, same surgical procedure was followed other than isolation and section of the bile duct. All animals received humane care according to National Institutes of Health guidelines; studies were approved by the local Institutional Animal Care and Use Committees.
2.3. RNA isolation and PCR
Total RNA was isolated from normal and injured rat liver tissue, cultured SECs, HSCs and hepatocytes using TRIzol (Invitrogen, Grand Island, NY), according to the manufacturer’s instruction. 2 μg of total RNA was used for cDNA synthesis in a 20μl reaction volume, by reverse transcription kit (Invitrogen) and the cDNAs were subjected to quantitative PCR using the SYBR Green Master Mix (Biorad, Hercules, CA). Relative expression of caveolin-1 mRNA was normalized to endothelial nitric oxide synthase (eNOS) and β actin mRNA expression using the 2−ΔΔCT method (Livak and Schmittgen, 2001). Primer pairs used were as follows: caveolin-1-F 5’atgtctgggggtaaatacgtagac 3’, caveolin-1-R 5’gatggaatagacacggctga 3’, eNOS-F 5’ctggccaaagtgaccattg 3’, eNOS-R 5’ggcaggggacaggaaatagt 3’, β actin-F 5’caagatcattgctcctcctg 3’, β actin-R 5’ taacagtccgcctagaagca 3’. The PCR program was as follows: one cycle at 95°C for 2 min followed by 40 cycles of 15 s at 95 °C, 30s at 62 °C, and 30 s at 72 °C.
2.4. Immunoblotting
Cultured cells were washed in ice cold PBS and lysed with RIPA buffer. Tissues were homogenized and after removing debris and unbroken cells by centrifugation at 8000g for 15 min, the protein concentration was measured as described (Boyd et al., 2003). Proteins were separated by SDS-PAGE and transferred to nitrocellulose and probed by indicated primary antibodies followed by respective HRP-conjugated secondary antibodies. Immunoreactive bands were visualized by SuperSignal West Pico chemiluminescent substrate (Thermo Scientific, Fremont, CA) as per the manufacturer’s instruction. Antibodies used included the following: anti-caveolin-1 (Santa Cruz Biotechnology, Dallas, TX), anti-eNOS (Transduction Laboratories, San Jose, CA), anti-G protein-coupled receptor kinase 2 (GRK2, Santa Cruz Biotechnology, Dallas, TX), anti-smooth muscle α-actin (Sigma, St Louis, MO) and anti-β-actin (Sigma, St Louis, MO).
2.5. Immunohistochemistry and microscopy
Fresh frozen rat liver sections were fixed in methanol for 5 minutes, permeabilized in 0.1% Triton X-100 and incubated in blocking reagent. Liver tissue was incubated with primary antibodies, anti-caveolin-1 (Santa Cruz Biotechnology, Dallas, TX), anti-VE cadherin (BD Pharmingen, San Jose, CA), anti-desmin (Thermo Scientific, Fremont, CA) and anti-albumin (Santa Cruz Biotechnology, Dallas, TX) at 4°C overnight. Tissue was washed, exposed to secondary staining performed by fluorescent antibodies Alexa Flour 555 (red) and Alexa Flour 488 (green). The fluorescent images for all the stained slides were acquired on Zeiss Axio imager M2 fluorescence microscope using a 20 × lens (Carl Zeiss, Thornwood, NY).
2.7. Statistical Analysis
All experiments were performed in triplicates using cells isolated from different rats. Results are expressed as mean ± SE, and compared using the Student t test. Two-tailed p values less than 0.05 were considered significantly different (between groups).
For RT-PCR, the Ct value of candidate gene (caveolin-1) after normalization with endogenous control (ΔCt) was used for calculating the relative expression (fold difference) in normal and BDL rat liver using the 2−ΔΔCt formula. ΔCt values representing the mean level of mRNA in normal whole tissue, SECs, HSCs and hepatocytes were considered 1 for normalization of the fold difference of caveolin-1 gene expression in normal and BDL.
3. Results
We initially measured caveolin-1 in normal and injured whole rat liver samples and found caveolin-1 mRNA was 5.7 fold higher in injured than in normal liver. Additionally, caveolin-1 protein expression was 2 fold higher in injured liver than in normal liver (Figure 1A, 1B).
Figure 1.

Caveolin-1 is upregulated after liver injury. In (A), total RNA was isolated from normal and injured (BDL) rat liver. RNA was reverse transcribed to cDNA followed by RT-PCR to detect caveolin-1 mRNA expression, which is presented graphically (n=3, (*p <0.05 vs normal). In (B), Liver tissue was homogenized and prepared from normal and injured (BDL) rat liver as in Methods. Proteins were separated by SDS PAGE and analyzed by immunoblotting. In the upper panel, a representative immunoblot is shown. In the lower panel, specific signals were scanned and quantitated and normalized to β-actin (n=3, *p < 0.01 vs normal).
To investigate at a cellular level the cell type responsible for the upregulation of caveolin-1 in the injured rat liver, we examined expression of caveolin-1 at the mRNA and protein levels in primary purified isolated normal and injured SECs, HSCs and hepatocytes. For all of these experiments, we isolated cells, allowed them to adhere to culture dishes or on glass coverslips overnight, then inspected the cells and performed immunohistochemical and/or histochemical studies to assess cell purity. We went to great effort to obtain pure isolates of non-parenchymal cells and hepatocytes. Hepatocyte purity was routinely >95% and HSC purity was routinely > 99% (Supplemental Figures 1–4). SEC purity was routinely > 90% (Supplemental Figures 1–4), with contaminants being primarily HSCs.
In SECs, caveolin-1 mRNA expression was 12.2 fold higher in injured (Figure 2A). However, immunoblotting revealed no difference in caveolin-1 protein expression (Figure 2B). To further ensure the purity of cells isolated, we normalized caveolin-1 expression to eNOS (because eNOS is only found in liver sinusoidal endothelial cells and not in any other liver specific cell type, and because eNOS expression remains unchanged after injury (Rockey and Chung, 1998). In HSCs, caveolin-1 mRNA expression was increased by 7.8 fold after injury (Figure 3A). Further, protein expression of caveolin-1 was significantly increased in BHSCs (Figure 3B). To further evaluate caveolin-1 expression in injured HSCs, and to explore whether caveolin-1 expression was associated with HSC activation, we utilized a well-characterized culture model of activation (Bachem et al., 1992; Shafiei and Rockey, 2012). We found that caveolin-1 protein expression increased progressively during HSC activation in culture, from day 1 to day 5 of culture (Figure 3C). As expected, smooth muscle α-actin, a protein well established to be upregulated during HSC activation (Rockey et al., 1992), was also increased in this model (Figure 3C). Finally, we measured caveolin-1 expression in hepatocytes from normal and injured rat liver. Caveolin-1 mRNA (Figure 4A) and protein levels (Figure 4B) were unchanged in normal and injured hepatocytes.
Figure 2.

Caveolin-1 remains unchanged in SECs after liver injury. SECs were isolated from normal (NSEC) and injured (BDL, BSEC) rat liver and cultured in collagen coated dishes for 24 hours as in Methods. In (A), total RNA was extracted and cDNA was prepared after reverse transcription and used for real time PCR analysis to determine caveolin-1 mRNA expression, which is presented graphically (n=3, *p < 0.01 vs NSEC). In (B), total protein lysates were prepared from the same cells and caveolin-1 expression was detected by immunoblot analysis, (representative immunoblots are shown in upper panel). In the middle panel, specific signals were quantitated and normalized to β-actin and eNOS. The lowest panel depicts GRK2 expression, known to be upregulated in only injured SECs (Liu et al., 2005), was used as a control (n=3, *p<0.05 vs NSEC).
Figure 3.

Caveolin-1 is upregulated in injured HSCs. HSCs were isolated from normal and injured (BDL, BHSC) rat liver and cultured. In (A), total RNA was extracted and cDNA was prepared, followed by RT-PCR to detect caveolin-1 mRNA expression, which is presented graphically (n=3, *p < 0.01 vs HSC). In (B), total protein lysates were prepared from the same cells and caveolin-1 expression was detected by immunoblot analysis (representative immunoblots are shown in upper panel). In the middle panel, specific signals were quantitated, normalized to β-actin and the data presented graphically (n=3, *p<0.05 vs HSC). In (C), HSCs were grown for 1, 3 and 5 days in culture and processed as in (B). The upper panel shows a representative immunoblot while the middle panel depicts quantitative analysis of blots. In both (B) and (C) the lowest panels depict expression of smooth muscle α actin, known to be upregulated only in injured HSCs (Rockey et al., 1992), was used as a control (n=3, *p<0.05 vs day1).
Figure 4.

Hepatocytes have a minimal expression of caveolin-1. Hepatocytes were isolated from normal and injured (BDL) rat liver and cultured for 24 hours. In (A), total RNA was extracted and cDNA was prepared, followed by RT-PCR to detect caveolin-1 mRNA expression, which is presented graphically (n=3, p > 0.05 vs normal). In (B), total protein lysates were prepared from normal and injured (BDL) hepatocytes and caveolin-1 expression was detected by immunoblot analysis (a representative immunoblot is shown in the upper panel). In the lower panel, specific signals were quantitated, normalized to β-actin, and the data presented graphically (n=3, p > 0.05 vs normal).
We next investigated the localization of caveolin-1 in situ in normal and injured liver by immunohistochemical analysis. The approach was to examine cell specific expression in the major liver cells including in SECs, HSCs and hepatocytes. In the normal liver, caveolin-1 was expressed in vascular structures as well as in cells in sinusoids (Figure 5A, 5B). Maximal caveolin-1 co-labeling was with desmin (Figure 5A, upper panels), which was greater than with co-labeling with VE cadherin (Figure 5B, upper panels). Since desmin is expressed exclusively in HSCs and in portal and central vascular structures, the co-labeling data suggest abundant expression of caveolin-1 in normal HSCs and vascular smooth muscle cells in injured liver. Since SECs express VE cadherin, the co-labeling data indicate that there is some caveolin-1 expression in normal SECs. In contrast, there was less to no co-labeling overlap between the hepatocyte specific marker albumin and caveolin-1 (Figure 5C, upper panels). After liver injury, the expression of caveolin-1 appeared to be increased in HSCs, but not in SECs (Figure 5A–5B, lower panels). Desmin, labeling was also increased, consistent with previous data demonstrating proliferation of HCSs after liver injury (Figure 5A, lower panel) (Rockey et al., 1992). There was not apparent increase in SEC number or hepatocyte number after liver injury (Figure 5B/5C, lower panel). These data are consistent with the PCR and immunoblotting data in all the three isolated cells (Figure 2/3/4).
Figure 5.

Immunohistochemical detection of caveolin-1 in normal and injured rat liver tissue. Immunoflorescence staining to detect caveolin-1 and desmin (A), VE cadherin (B), or albumin (C) was performed in normal and BDL rat liver sections. Desmin expression is restricted to HSCs and smooth muscle cells, VE cadherin to endothelial cells, whereas albumin expression is restricted to hepatocytes. In each series, the upper panels depict representative normal liver sections, while the lower panels depict representative injured (BDL) liver sections. The scale bar represents 100 μm.
4. Discussion
In the present study, we have shown that expression of caveolin-1 mRNA and protein are increased after liver injury (Figure 1), consistent with previous studies (Shah et al., 1999). However, the most important advance reported here is that we have carefully characterized the cellular expression of caveolin-1 expression in liver specific cell types. We have now shown that caveolin-1 is not expressed in hepatocytes to a significant degree, but rather is found in sinusoids (as well as large vascular structures – as previously described (Shah et al., 2001). Both SECs and HSCs express caveolin-1, and more importantly, caveolin-1 expression is increased in HSCs after liver injury but not in SECs (Figure 2 and 3). Of note, we did not find a change in caveolin-1 expression in bile duct epithelial cells after injury.
The findings presented here are consistent with data presented in previous studies of caveolin-1 expression in the normal liver. In one study, immunoblot analysis of cell fractions revealed that caveolin-1 was not detected in hepatocytes, but was found to be enriched in non-parenchymal cell fractions, and was additionally found to be expressed in both HSCs and SECs (Shah et al., 2001). Caveolin-1 expression appeared to be greater in SECs than HSCs, although quantitative data were not provided.
Perhaps more importantly, our data not only extend the previous data examining caveolin-1 expression in the injured liver, but also bring into question the conclusion that the expression of caveolin-1 is increased in SECs after liver injury (Hendrickson et al., 2003; Shah et al., 1999). In one study (Ogi et al., 2003), it was shown by electron microscopy using immunogold labeling that after liver injury induced by bile duct ligation, there was an increase in caveolin-1 labeling in SECs lining larger hepatic vascular structures and that there immunogold particles were prominent on SECs. Of note, immunogold particles were also prominently visible on a HSC from the BDL liver. However, this study did not specifically address the relative expression of caveolin-1 in HSCs and SECs. Another study demonstrated labeling of caveolin-1 in sinusoidal endothelial cells in human liver (Yokomori et al., 2002; Yokomori et al., 2003), and demonstrated what appeared to be an increase in caveolin-1 expression in hepatic lining cells in cirrhotic samples. However, this study did not perform co-localization studies and thus was unable to provide insight as to the cellular source of caveolin-1.
Our extensive quantitative data advance the field by demonstrating that caveolin-1 is upregulated in HSCs but not SECs. These data are important for several reasons. First, they bring in to question the conventional dogma that a reason that SEC eNOS function is impaired after liver injury in SECs by simple upregulation of caveolin-1. This is critical because other literature suggests that a key regulator of eNOS is phosphorylated caveolin-1 rather than simple total caveolin-1 (Joshi et al., 2012). Thus, it is possible that phospho-caveolin-1 is a more important regulator of eNOS than total caveolin-1 after liver injury.
We recognize strengths and limitations of our study. First, the current study provides two different types of evidence supporting the expression of caveolin-1 in liver; we provide both immunohistochemical cell localization and cell based data indicating expression of caveolin-1. Additionally, we have provided quantitative measurements of caveolin-1 mRNA and protein expression, and have included important controls which provide further assurance that the cells isolated are more than 95% pure (Supplemental Figures 1–4), and are what they are purported to be. One limitation of the immunohistochemical studies is that by their nature, these are qualitative only. It should also be noted that we have also performed quantitative analyses on cells after culture overnight, and it could be argued that these do not have precisely the same gene and/or protein expression profile as do cells placed in culture. The rationale for this approach is that we also that there may be dead cells present in cell isolations. By harvesting only living (attached cells), the technique allows us to avoid the contamination of dead cells and include only healthy cells for study. We have also found that after a very short time period in culture (as used in this study), there is very little if any effect on gene or protein expression. This is important in hepatocytes since caveolin-1 may be regulated by cellular stress; in one study fenofibric acid, a peroxisome proliferator-activated receptor-α agonist, led to changes in caveolin-1 expression (Woudenberg et al., 2010) and in another study, dedifferentiation and loss of hepatocyte polarity during primary culture also affected caveolin-1 expression in hepatocytes (Meyer et al., 2013). Finally, it should also be pointed out that this practice has become standard in the field.
In summary, we have shown that caveolin-1 mRNA and protein are increased after liver injury in HSCs, but not in SECs. Since caveolin-1 appears to be an important scaffolding protein and regulator of signaling, these data have important implications for the cellular pathobiology of various signaling cascades in HSCs after liver injury. Further, these data raise questions about the importance of caveolin-1 - eNOS signaling in injured SECs.
Supplementary Material
Acknowledgments
Funding: This work was supported by a grants from the NIH: R01 DK57830 and R01 DK98819 to D.R.
Footnotes
Publisher's Disclaimer: This is a PDF file of an unedited manuscript that has been accepted for publication. As a service to our customers we are providing this early version of the manuscript. The manuscript will undergo copyediting, typesetting, and review of the resulting proof before it is published in its final citable form. Please note that during the production process errors may be discovered which could affect the content, and all legal disclaimers that apply to the journal pertain.
Conflicts of interest: The authors certify that we have no financial arrangements (e.g., consultancies, stock ownership, equity interests, patent-licensing arrangements, honoraria, etc.) with a company whose product figures in this manuscript or with a company making a competing product.
References
- Bachem MG, Meyer D, Melchior R, Sell KM, Gressner AM, 1992. Activation of rat liver perisinusoidal lipocytes by transforming growth factors derived from myofibroblastlike cells. A potential mechanism of self perpetuation in liver fibrogenesis. J Clin Invest 89, 19–27. [DOI] [PMC free article] [PubMed] [Google Scholar]
- Boyd NL, Park H, Yi H, Boo YC, Sorescu GP, Sykes M, Jo H, 2003. Chronic shear induces caveolae formation and alters ERK and Akt responses in endothelial cells. Am J Physiol Heart Circ Physiol 285, H1113–1122. [DOI] [PubMed] [Google Scholar]
- Cokakli M, Erdal E, Nart D, Yilmaz F, Sagol O, Kilic M, Karademir S, Atabey N, 2009. Differential expression of Caveolin-1 in hepatocellular carcinoma: correlation with differentiation state, motility and invasion. BMC Cancer 9, 65. [DOI] [PMC free article] [PubMed] [Google Scholar]
- Connelly L, Madhani M, Hobbs AJ, 2005. Resistance to endotoxic shock in endothelial nitric-oxide synthase (eNOS) knock-out mice: a pro-inflammatory role for eNOS-derived no in vivo. J Biol Chem 280, 10040–10046. [DOI] [PubMed] [Google Scholar]
- Del Galdo F, Lisanti MP, Jimenez SA, 2008. Caveolin-1, transforming growth factor-beta receptor internalization, and the pathogenesis of systemic sclerosis. Curr Opin Rheumatol 20, 713–719. [DOI] [PMC free article] [PubMed] [Google Scholar]
- Gao L, Zhou Y, Zhong W, Zhao X, Chen C, Chen X, Gu Y, Chen J, Lv Z, Shen J, 2014. Caveolin-1 is essential for protecting against binge drinking-induced liver damage through inhibiting reactive nitrogen species. Hepatology 60, 687–699. [DOI] [PubMed] [Google Scholar]
- Garver WS, Erickson RP, Wilson JM, Colton TL, Hossain GS, Kozloski MA, Heidenreich RA, 1997. Altered expression of caveolin-1 and increased cholesterol in detergent insoluble membrane fractions from liver in mice with Niemann-Pick disease type C. Biochim Biophys Acta 1361, 272–280. [DOI] [PubMed] [Google Scholar]
- Gvaramia D, Blaauboer ME, Hanemaaijer R, Everts V, 2013. Role of caveolin-1 in fibrotic diseases. Matrix Biol 32, 307–315. [DOI] [PubMed] [Google Scholar]
- Hendrickson H, Chatterjee S, Cao S, Morales Ruiz M, Sessa WC, Shah V, 2003. Influence of caveolin on constitutively activated recombinant eNOS: insights into eNOS dysfunction in BDL rat liver. Am J Physiol Gastrointest Liver Physiol 285, G652–660. [DOI] [PubMed] [Google Scholar]
- Iwakiri Y, Shah V, Rockey DC, 2014. Vascular pathobiology in chronic liver disease and cirrhosis - current status and future directions. J Hepatol 61, 912–924. [DOI] [PMC free article] [PubMed] [Google Scholar]
- Joshi B, Bastiani M, Strugnell SS, Boscher C, Parton RG, Nabi IR, 2012. Phosphocaveolin-1 is a mechanotransducer that induces caveola biogenesis via Egr1 transcriptional regulation. J Cell Biol 199, 425–435. [DOI] [PMC free article] [PubMed] [Google Scholar]
- Kasper M, Reimann T, Hempel U, Wenzel KW, Bierhaus A, Schuh D, Dimmer V, Haroske G, Muller M, 1998. Loss of caveolin expression in type I pneumocytes as an indicator of subcellular alterations during lung fibrogenesis. Histochem Cell Biol 109, 41–48. [DOI] [PubMed] [Google Scholar]
- Liu S, Premont RT, Kontos CD, Zhu S, Rockey DC, 2005. A crucial role for GRK2 in regulation of endothelial cell nitric oxide synthase function in portal hypertension. Nat Med 11, 952–958. [DOI] [PubMed] [Google Scholar]
- Liu S, Premont RT, Rockey DC, 2012. G-protein-coupled receptor kinase interactor-1 (GIT1) is a new endothelial nitric-oxide synthase (eNOS) interactor with functional effects on vascular homeostasis. J Biol Chem 287, 12309–12320. [DOI] [PMC free article] [PubMed] [Google Scholar]
- Livak KJ, Schmittgen TD, 2001. Analysis of relative gene expression data using real-time quantitative PCR and the 2(-Delta Delta C(T)) Method. Methods 25, 402–408. [DOI] [PubMed] [Google Scholar]
- Mayoral R, Fernandez-Martinez A, Roy R, Bosca L, Martin-Sanz P, 2007. Dispensability and dynamics of caveolin-1 during liver regeneration and in isolated hepatic cells. Hepatology 46, 813–822. [DOI] [PubMed] [Google Scholar]
- Meyer C, Dzieran J, Liu Y, Schindler F, Munker S, Muller A, Coulouarn C, Dooley S, 2013. Distinct dedifferentiation processes affect caveolin-1 expression in hepatocytes. Cell Commun Signal 11, 6. [DOI] [PMC free article] [PubMed] [Google Scholar]
- Miyasato SK, Loeffler J, Shohet R, Zhang J, Lindsey M, Le Saux CJ, 2011. Caveolin-1 modulates TGF-beta1 signaling in cardiac remodeling. Matrix Biol 30, 318–329. [DOI] [PMC free article] [PubMed] [Google Scholar]
- Ogi M, Yokomori H, Oda M, Yoshimura K, Nomura M, Ohshima S, Akita M, Toda K, Ishii H, 2003. Distribution and localization of caveolin-1 in sinusoidal cells in rat liver. Med Electron Microsc 36, 33–40. [DOI] [PubMed] [Google Scholar]
- Oh P, McIntosh DP, Schnitzer JE, 1998. Dynamin at the neck of caveolae mediates their budding to form transport vesicles by GTP-driven fission from the plasma membrane of endothelium. J Cell Biol 141, 101–114. [DOI] [PMC free article] [PubMed] [Google Scholar]
- Pol A, Calvo M, Lu A, Enrich C, 1999. The “early-sorting” endocytic compartment of rat hepatocytes is involved in the intracellular pathway of caveolin-1 (VIP-21). Hepatology 29, 1848–1857. [DOI] [PubMed] [Google Scholar]
- Qiu Y, Liu S, Chen HT, Yu CH, Teng XD, Yao HT, Xu GQ, 2013. Upregulation of caveolin-1 and SR-B1 in mice with non-alcoholic fatty liver disease. Hepatobiliary Pancreat Dis Int 12, 630–636. [DOI] [PubMed] [Google Scholar]
- Rockey DC, Boyles JK, Gabbiani G, Friedman SL, 1992. Rat hepatic lipocytes express smooth muscle actin upon activation in vivo and in culture. J Submicrosc Cytol Pathol 24, 193–203. [PubMed] [Google Scholar]
- Rockey DC, Chung JJ, 1994. Interferon gamma inhibits lipocyte activation and extracellular matrix mRNA expression during experimental liver injury: implications for treatment of hepatic fibrosis. J Investig Med 42, 660–670. [PubMed] [Google Scholar]
- Rockey DC, Chung JJ, 1998. Reduced nitric oxide production by endothelial cells in cirrhotic rat liver: endothelial dysfunction in portal hypertension. Gastroenterology 114, 344–351. [DOI] [PubMed] [Google Scholar]
- Shafiei MS, Rockey DC, 2012. The function of integrin-linked kinase in normal and activated stellate cells: implications for fibrogenesis in wound healing. Lab Invest 92, 305–316. [DOI] [PMC free article] [PubMed] [Google Scholar]
- Shah V, Cao S, Hendrickson H, Yao J, Katusic ZS, 2001. Regulation of hepatic eNOS by caveolin and calmodulin after bile duct ligation in rats. Am J Physiol Gastrointest Liver Physiol 280, G1209–1216. [DOI] [PubMed] [Google Scholar]
- Shah V, Toruner M, Haddad F, Cadelina G, Papapetropoulos A, Choo K, Sessa WC, Groszmann RJ, 1999. Impaired endothelial nitric oxide synthase activity associated with enhanced caveolin binding in experimental cirrhosis in the rat. Gastroenterology 117, 1222–1228. [DOI] [PubMed] [Google Scholar]
- Shi Z, Rockey DC, 2010. Interferon-gamma-mediated inhibition of serum response factor-dependent smooth muscle-specific gene expression. J Biol Chem 285, 32415–32424. [DOI] [PMC free article] [PubMed] [Google Scholar]
- Simons K, Toomre D, 2000. Lipid rafts and signal transduction. Nat Rev Mol Cell Biol 1, 31–39. [DOI] [PubMed] [Google Scholar]
- Tourkina E, Richard M, Gooz P, Bonner M, Pannu J, Harley R, Bernatchez PN, Sessa WC, Silver RM, Hoffman S, 2008. Antifibrotic properties of caveolin-1 scaffolding domain in vitro and in vivo. Am J Physiol Lung Cell Mol Physiol 294, L843–861. [DOI] [PubMed] [Google Scholar]
- Wang XM, Zhang Y, Kim HP, Zhou Z, Feghali-Bostwick CA, Liu F, Ifedigbo E, Xu X, Oury TD, Kaminski N, Choi AM, 2006. Caveolin-1: a critical regulator of lung fibrosis in idiopathic pulmonary fibrosis. J Exp Med 203, 2895–2906. [DOI] [PMC free article] [PubMed] [Google Scholar]
- Woudenberg J, Rembacz KP, van den Heuvel FA, Woudenberg-Vrenken TE, Buist-Homan M, Geuken M, Hoekstra M, Deelman LE, Enrich C, Henning RH, Moshage H, Faber KN, 2010. Caveolin-1 is enriched in the peroxisomal membrane of rat hepatocytes. Hepatology 51, 1744–1753. [DOI] [PubMed] [Google Scholar]
- Yamazaki H, Oda M, Takahashi Y, Iguchi H, Yoshimura K, Okada N, Yokomori H, 2013. Relation between ultrastructural localization, changes in caveolin-1, and capillarization of liver sinusoidal endothelial cells in human hepatitis C-related cirrhotic liver. J Histochem Cytochem 61, 169–176. [DOI] [PMC free article] [PubMed] [Google Scholar]
- Yokomori H, Ando W, Yoshimura K, Yamazaki H, Takahashi Y, Oda M, 2015. Increases in endothelial caveolin-1 and cavins correlate with cirrhosis progression. Micron 76, 52–61. [DOI] [PubMed] [Google Scholar]
- Yokomori H, Oda M, Ogi M, Sakai K, Ishii H, 2002. Enhanced expression of endothelial nitric oxide synthase and caveolin-1 in human cirrhosis. Liver 22, 150–158. [DOI] [PubMed] [Google Scholar]
- Yokomori H, Oda M, Yoshimura K, Nomura M, Wakabayashi G, Kitajima M, Ishii H, 2003. Elevated expression of caveolin-1 at protein and mRNA level in human cirrhotic liver: relation with nitric oxide. J Gastroenterol 38, 854–860. [DOI] [PubMed] [Google Scholar]
- Zhang GY, Yu Q, Cheng T, Liao T, Nie CL, Wang AY, Zheng X, Xie XG, Albers AE, Gao WY, 2011. Role of caveolin-1 in the pathogenesis of tissue fibrosis by keloid-derived fibroblasts in vitro. Br J Dermatol 164, 623–627. [DOI] [PubMed] [Google Scholar]
- Zhang ZB, Cai L, Zheng SG, Xiong Y, Dong JH, 2009. Overexpression of caveolin-1 in hepatocellular carcinoma with metastasis and worse prognosis: correlation with vascular endothelial growth factor, microvessel density and unpaired artery. Pathol Oncol Res 15, 495–502. [DOI] [PubMed] [Google Scholar]
Associated Data
This section collects any data citations, data availability statements, or supplementary materials included in this article.