

Abstract
Expansions of both GGC and CCG sequences lead to a number of expandable, trinucleotide repeat (TR) neurodegenerative diseases. Understanding of these diseases involves, among other things, the structural characterization of the atypical DNA and RNA secondary structures. We have performed molecular dynamics simulations of (GCC)n and (GGC)n homoduplexes in order to characterize their conformations, stability, and dynamics. Each TR has two reading frames, which results in eight nonequivalent RNA/DNA homoduplexes, characterized by CpG or GpC steps between the Watson–Crick base pairs. Free energy maps for the eight homoduplexes indicate that the C-mismatches prefer anti–anti conformations, while G-mismatches prefer anti–syn conformations. Comparison between three modifications of the DNA AMBER force field shows good agreement for the mismatch free energy maps. The mismatches in DNA-GCC (but not CCG) are extrahelical, forming an extended e-motif. The mismatched duplexes exhibit characteristic sequence-dependent step twist, with strong variations in the G-rich sequences and the e-motif. The distribution of Na+ is highly localized around the mismatches, especially G-mismatches. In the e-motif, there is strong Na+ binding by two G(N7) atoms belonging to the pseudo GpC step created when cytosines are extruded and by extrahelical cytosines. Finally, we used a novel technique based on fast melting by means of an infrared laser pulse to classify the relative stability of the different DNA-CCG and -GGC homoduplexes.
Graphical Abstract
INTRODUCTION
Simple sequence repeats (SSRs) consist of all sequences where core motif nucleotides are repeated a significant number of times; typically, these consist of 1–6 (and sometimes even 12) nucleotides with up to 30 repeats in the human genome, in both the genetic and intergenic regions.1 Of all the different possible repeats, the microsatellite family of trinucleotide repeats (TRs) represents a significant and important class of SSRs. The length of these repeats varies greatly among people, and the fact that they are over-represented in genes indicates that they may have played an important role in evolution and gene regulation.1 One significant feature of SSRs is that they do not follow Mendelian inheritance laws which asserts that a single gene mutation is stably transmitted between the generations. Instead, SSRs exhibit “dynamic mutations”, which are behind the intergenerational expansion of SSRs that gives rise to inherited neurological disorders known as “anticipation diseases”. In such diseases, the age of onset of the disease decreases and its severity increases with each successive generation.2–4 Once a certain threshold in the length of the repeated sequence is crossed, the probability of an increased expansion and the severity of the disease is increased as the length of the repeats becomes larger. To date, approximately 30 DNA expandable SSR diseases have been identified and the list is expected to grow.5,6 In particular, the dynamic mutations in human genes associated with TRs cause severe neurodegenerative and neuromuscular disorders, known as trinucleotide (or triplet) repeat expansion diseases (TREDs).2,7,8 It is believed that the repeat expansion takes place primarily during DNA repair, replication, recombination, and transcription by means of some sort of slippage.4–13 Atypical conformations and functional changes of the RNA transcripts and DNA itself5,14 have been linked to cell toxicity and consequent cellular death.5,15–23 The expanded RNA transcripts exhibit secondary structures that sequester regulatory proteins and cause abnormal nuclear foci.24–27 Adding to the intrincacy of the toxic mechanisms is the experimental evidence that antisense transcripts of the expansion, i.e., the expanded repeats created by a bidirectional transcription of the DNA SSR expansions, can also contribute to toxicity by means of the formed RNA foci. Both sense and antisense expansions can result in protein translation even without the start ATG codon, causing the nontraditional repeat-associated non-ATG (RAN) translation.28
In this work, we are interested in CGG and CCG TRs, which are overexpressed in the exons of the human genome. CGG TRs are present in the 5′-untranslated region (5′-UTR) of the fragile X mental retardation gene (FMR1),29 while CCGs have been located in both the 5′-UTR and translated regions of several genes. In a normal population, the typical range of the CGG TRs is 5–54, with the last 10 repeats resulting in an increased probability of the disease in the descendants.30,31 CGG TRs with repeats in the range 55–200 lead to male fragile X-associated tremor ataxia syndrome (FXTAS)32 and female premature ovarian failure.33 When the number of CGG TRs exceeds 200, it spawns the inherited fragile X mental retardation syndrome.34 The CCG TRs are connected to three TREDs. Specifically, the longest expansion occurs in the FRM2 gene which leads to chromosome X-linked mental retardation (FRAXE).35 The CCG TRs also play a role in Huntington’s disease and myotonic dystrophy of type 1.36
A key insight in TREDs has been the understanding that stable, atypical DNA secondary structures in the expanded repeats is the trigger for further expansion in SSRs.37 This atypical secondary structure forms when the parental DNA strands are separated freeing single-stranded DNA, which can occur during the processes of replication, translation, recombination, and repair. In addition, mutant transcripts also contribute to the pathogenesis of TREDs through toxic RNA gain-of-function.5,15–20 Thus, a first step toward the understanding of these diseases involves the structural characterization of the atypical DNA and RNA structures. Various experimental methods in vitro, such as CD, UV absorbance, NMR, electrophoretic mobility assay, and chemical or enzymatic digestion,38 show a general trend to formation of duplexes and hairpins, depending on the sequence length and environment conditions. Among these secondary structures, those formed by CGG expansions seem to be the most stable.
Crystallographic studies for short RNA duplexes provide valuable atomic detail. For the CGG expansion, two crystallographic studies using unmodified sequences 5′-G-(CGG)2-C-3′ (PDB ID 3R1C, ref 39) and 5′-UU-GGGC-(CGG)3-GUCC-3′ (PDB ID 3SJ2, ref 40) found that the RNA helices have the Aform, with some variations, with the G·G pairs in a typical anti–syn conformation, with two hydrogen bonds between the Watson–Crick edge of Ganti and the Hoogsteen edge of Gsyn. For the CCG sequence, there is one crystallographic RNA duplex with an unmodified sequence 5′-G-(CCG)2-C-3′ (PDB ID 4E59, ref 41) and one solution NMR DNA duplex 5′-(CCG)2-3′ (PDB ID 1NOQ, refs 42 and 43). The C-rich structures are less conclusive because they involve only two repeats, which results in the slipping of one strand with respect to the other. In the RNA crystal structure, this dislocation and the stacking of the oligomers along the c-axis in the crystal results in a single C·C pair effectively surrounded by four C–G Watson–Crick pairs (with two overhanging C’s). Thus, it is not clear whether this structural environment for the single “mismatch” can reproduce the one that would occur in the cell for longer (CCG)n sequences, where each C·C pair may (or may not) be surrounded by only two Watson–Crick pairs. The C·C pair surrounded by four Watson–Crick C–G base pairs as shown in the RNA crystal might be overconstrained with respect to that in a real CCG expansion. In the DNA duplex, the slippage of the strands causes the two 5′-C terminals to become unpaired, which results in a single, central C·C mismatch surrounded by two Watson–Crick pairs. This generates an “e-motif”, where the mismatched C-bases flip out symmetrically from the minor groove, pointing their base moieties toward the 5′ direction in each strand.44
An important consideration regarding possible TR conformations is the nature of the Watson–Crick pairs that surround the mismatches:45,46 sequences of the form 5′-(CGG)n-3′ and 5′-(CCG)n-3′ (without slipping) exhibit GpC steps between the Watson–Crick base pairs, while sequences of the form 5′-(GGC)n-3′ and 5′-(GCC)n-3′ (without slipping) exhibit CpG steps between the Watson–Crick base pairs. The two RNA G-rich crystal structures39,40 involve GpC steps; terminal mismatches in 5′-UU-GGGC-(CGG)3-GUCC-3′ in ref 40 are surrounded by CC/GG steps, not present in a (CGG)n expansion. Indeed, with the use of high level ab initio calculations, it has been shown that CC/GG steps are the least stable of the 10 dinucleotide steps, with well-separated energies47 from the other dinucleotide steps. The slipping of strands with respect to each other in the (CCG) sequences results in GpC steps for the RNA crystal41 and in CpG steps for the DNA NMR structure42 (in contrast to the GpC steps that would arise if the DNA strands were paired at the ends).
Given the association between the nucleic acid secondary structures and the related neurodegenerative diseases, this paper focuses on understanding the structural and dynamical characteristics of both DNA and RNA double helices on the basis of CCG and GGC trinucleotide repeats, considering all possible reading frames that result in CpG or GpC steps between the Watson–Crick base pairs. Our previous work has focused on other SSRs and includes a characterization of the four helical duplexes obtained from the CAG (GpC steps) and GAC (CpG steps) TRs for both RNA and DNA48 and of the 12 helical duplexes derived from the (GGGGCC) hexanucleotide repeat (HR) expansion in the C9ORF72 gene and its associated antisense (GGCCCC) expansion.49 CAG TRs are known to cause 10 late-onset progressive neurodegenerative diseases, including spinocerebellar ataxia type 12 (SCA12), Huntington’s disease (HD), dentatorubral-pallidoluysian atrophy (DRPLA), spinal and bulbar muscular atrophy (SBMA), and several other spinocerebellar ataxia (SCA) diseases.50 On the other hand, GAC repeats behave quite differently: expansion by one repeat in the human gene for cartilage oligomeric matrix protein, which exhibits a (GAC)5 repeat, causes multiple epiphyseal dysplasia, while expansion by two repeats or, alternatively, deletion by one repeat causes pseudoachondroplasia.51 A (GGGGCC) HR expansion in the first intron of the C90RF72 gene is known to be a major cause behind frontotemporal dementia (FTD) and amyotrophic lateral scleriosis (ALS).52,53 Generally speaking, in the unaffected population, the gene carries fewer than 20 repeats, while a large number of expansions (greater than 70 and usually entailing 250–1600 repeats) has been found in C9FTD and ALS patients. The 12 duplexes that were investigated result from the three different reading frames in both the sense and antisense HRs for DNA and RNA. The atypical structures which characterize these duplexes are relevant not only for a molecular level understanding of these diseases but also for enlarging our repertoire of the structural motifs associated with nucleic acids.
In this work, we present results for molecular dynamics (MD) simulations and free energy calculations for both CCG and GGC trinucleotide repeats, with either CpG or GpC steps, for both RNA and DNA. This results in eight different nonequivalent helical duplexes. We compare results with the one case, G-rich RNA with GpC steps, which is well characterized experimentally. The good agreement with the experimental structures helps validate our results for the other seven cases. We present a comparative study of the conformations of the eight duplexes and their dynamics, with a characterization of the neutralizing Na+ ion distributions around the mismatches. For DNA, we also employed a simulated infrared laser pulse melting technique as a tool for investigating the structural healing and for ranking the relative stabilities of the homoduplexes and correlated stabilities of the homoduplexes. This is a nonequilibrium technique that can be used to qualitatively rank different structures by stability, and it has been successfully applied to compare the responses of polyasparagine and polyglutamine amyloid aggregates54 and in comparative melting and healing of B-DNA and Z-DNA helical duplexes.55 Strictly speaking, the noncanonical C·C and G·G pairs in RNA are not “mismatches”, since RNA is not necessarily self-complementary. However, since we are considering both DNA and RNA in their duplex form, we will call these noncanonical base pairs mismatches for simplicity.
MATERIALS AND METHODS
Molecular Dynamics Simulations.
The sequences used here are given in Figure 1. The simulations were carried out using the PMEMD module (pmemd.cuda with GPU enhanced calculation) of the AMBER v.1656 software package with force fields ff99 BSC157 for DNA and ff99 BSC058 + χOL3 modification59 for RNA. In addition, we have used the BSC0 and OL1560 to compute and compare various free energy maps for single mismatch DNA and have run regular MD for the DNA C-rich four-repeat sequences both with BSC0 and with BSC1. For the waters, the TIP3P model61 was used, as well as the standard AMBER force field parameters for the ions.62 To model the long-range Coulomb interaction, the particle-mesh Ewald (PME) method63 with a 9 Å cutoff and an Ewald coefficient of 0.30768 was used. Likewise, the van der Waals interactions were calculated by means of a 9 Å atom-based nonbonded list, with a continuous correction applied to the long-range part. MD production runs were generated using the leapfrog algorithm with a 2 fs time step utilizing Langevin dynamics with a collision frequency of 1 ps−1. The SHAKE algorithm was applied to all bonds with hydrogen atoms. Regular 1 μs long MD simulations were run for all sequences, using different initial conformational values for the χ glycosyl torsion angles; configurations were saved every picosecond.
Figure 1.

Nucleic acid sequences considered in this study.
Free Energy Maps.
The sequences with a single mismatch, CCG1, GCC1, CGG1, and GGC1, were used to identify the mismatch conformation that minimizes the free energy. To calculate the free energy maps, we made use of the adaptively biased molecular dynamics (ABMD) method64,65 which has been implemented for PMEMD in AMBER v.16.56 The free energy—or potential of mean force (PMF)—is calculated as a function of one or more collective variables, which must carefully be chosen so as to reflect the underlying physics of the problem. ABMD has been implemented with multiple walkers (both noninteracting66 and interacting walkers, with the latter interacting by means of a selection algorithm67), replica exchange molecular dynamics (REMD),68 and “well tempered” (WT) extensions.69 The free energy of these mismatches was calculated as a function of two main collective variables, which were chosen so as to bring out the conformations of the different mismatches. We define (1) χ5 as the glycosyl torsion angle χ of C5 or G5, namely, the dihedral angle O4′–C1′–N1–C2 for C and O4′–C1′–N9–C4 for G, and (2) χ14 which represents the χ angle of C14 or G14. With these variables, we constructed the two-dimensional phase diagrams (χ5, χ14), which can explore all options of χ (anti–anti, anti–syn, syn–anti, syn–syn). A given free energy landscape is deemed to have converged when both the position and differences in the free energy values of the minima remain approximately constant as further ABMD cycles are performed. For both DNA and RNA, at least 270 ns simulations are performed for each of the (χ5, χ14) maps; for some sequences, runs needed to be extended up to 600 ns to reach a better convergence.
After the initial conformations were set up as explained below, multiple walker ABMD runs at constant volume and 300 K were carried out with eight replicas. The first ABMD simulation was for 30.0 ns with parameters τF = 1 ps and 4Δξ = 0.5 rad. This simulation provided for a rough estimate of the free energy landscape over the relevant parameter space. We then followed this up with a finer 120 ns WT-ABMD simulation (parameters τF = 1 ps, 4Δξ = 0.2 rad, pseudotemperature 10,000 K). For these runs, the total number of hydrogen bonds in neighboring CG Watson–Crick base pairs was slightly restrained to be six using a 1.0 kcal/mol harmonic constraint. This was used in order to avoid the large-scale twisting of the whole structure during the long simulations. This constraint, however, was chosen to be flexible enough so as to readily allow for the relevant anti–syn transitions. Finally, a slower and smoother flooding in order to refine the landscapes was carried out with parameters τF = 2 ps, 4Δξ = 0.2 rad, and pseudotemperature 10,000 K. The final biasing potential was processed by the nfe-umbrella-slice tool56 to get the two-dimensional free energy.
Initial Conformations.
Initial conformations for one- and three-repeat sequences were created as follows. First, we created the duplexes with the four possible combinations of the χ angle for the C·C or G·G mismatches: anti–anti, anti–syn, syn–anti, and syn–syn. These were then solvated in an octahedral box with neutralizing Na+ ions as in previous work,70 with a distance of at least 10 Å between the duplexes and the walls of the box. The box was then filled with a suitable number of waters. The system was then minimized: first keeping the nucleic acid and ions fixed and then allowing them to move. Subsequently, the temperature was gradually raised using constant volume simulations from 0 to 300 K over 50 ps, followed by a further 50 ps run. Then, a 100 ps run at constant volume was used to gradually reduce the restraining harmonic constants for nucleic acids and ions. This was followed by a 1.0 ns constant pressure run, with the χ angles of the mismatches slightly restrained so that these retain their initial anti or syn conformation. We took random conformations from the last 200 ps of these runs as the initial conformations for both the ABMD and MD runs. That means we picked two structures from each of the four runs (anti–anti, anti–syn, syn–anti, and syn–syn). For the four repeats, (CCG)4, (GCC)4, (CGG)4, and (GGC)4, the initial mismatch conformation was chosen as the one that minimizes the free energy, and two 1 μs simulations were run at 310 K: one starting from an ideal A form and one starting from an ideal B form.
Fast Melting by a Simulated Infrared Laser Pulse.
In order to rank the relative stability of the different DNA homoduplexes, we made use of a novel laser-melting simulation technique using the sequences (CCG)4, (GCC)4, (CGG)4, and (GGC)4, with (GCC)4 in the extended e-motif conformation. To model the laser pulse, we used the following equation
with E0 denoting the electric field amplitude, σ the pulse width, t the time, t0 the maximal time of the pulse, k the wavenumber, and c the velocity of light. The wavenumber k needs to be carefully chosen in such way as to disrupt a targeted set of bonds only, e.g., Watson–Crick hydrogen bonds, amide bonds, etc. The other parameters are selected in such a way so that the “laser melting” takes place over a reasonable simulation time scale. Our laser-melting simulations here parallel closely those of our previous work on B- and Z-DNA,55 and hence, we relegate all of the simulation details to the Supporting Information.
RESULTS
In this section, we discuss our results. The sequences considered in this study are shown in Figure 1. Unless otherwise stated, results for DNA are shown for the BSC1 modification of the force field.
A. Free Energy Maps.
As described in the Materials and Methods section, we use as collective variables the dihedral angles χ5 for C5 (G5) and χ14 for C14 (G14). Values of χ between 90 and 270° (or, equivalently, between 90 and 180° and between −180 and −90°) are considered anti conformations; the other half of the values ranging from −90° to 90° (or, equivalently 270 to 360° and 0 to 90°) correspond to syn conformations. These free energy landscapes display several stable minima. We have set the deepest minimum in each free energy map as the zero level of the free energy. Because the two bases of the mismatch are completely equivalent, one can expect the free energy maps to show mirror symmetry across the diagonal once the maps have converged, a feature that can generally be observed in these phase diagrams. Table 1 gives the position of the principal minima in the phase diagram and their relative free energy value.
Table 1.
Summary of Main Minima Identified on the (χ5, χ14) (Units: deg) Free Energy Landscapes (Units: kcal/mol) for the Single Mismatch Models
| A–A form | anti–anti | anti–syn | syn–syn | ||
|---|---|---|---|---|---|
| RNA-CCG1 | approximate location (χ5, χ14) | (−163, –163) | (−160, 65) | (70, –163) | (63, 60) |
| relative free energy (kcal/mol) | 0.0 | 5.9 ± 0.1 | 4.6 ± 0.1 | 10.4 ± 0.1 | |
| main H-bond | N3–N4:H41, N4–N4:H41 | N3–N4:H42 | |||
| DNA-CCG1 | approximate location (χ5, χ14) | (−122, –125) | (−128, 70) | (70, –125) | (73, 73) |
| relative free energy (kcal/mol) | 0.0 | 7.8 ± 0.1 | 7.0 ± 0.1 | 10.7 ± 0.1 | |
| main H-bond | N3–N4:H41, N4–N4:H41 | N3–N4:H42 | |||
| RNA-GCC1 | approximate location (χ5, χ14) | (−163, –163) | (−160, 60) | (65, –160) | (63, 61) |
| relative free energy (kcal/mol) | 0.0 | 5.8 ± 0.3 | 5.0 ± 0.1 | 9.0 ± 0.6 | |
| main H-bond | N3–N4:H41, N4–N4:H41 | N3–N4:H42 | |||
| DNA-GCC1 | approximate location (χ5, χ14) | (−122, –125) | (−142, 64) | (64, –137) | (61, 58) |
| relative free energy (kcal/mol) | 0.0 | 7.4 ± 0.1 | 7.0 ± 0.4 | 10.8 ± 0.6 | |
| main H-bond | N3–N4:H41, N4–N4:H41 | N3–N4:H42 | |||
| RNA-CGG1 | approximate location (χ5, χ14) | (−165, –165) | (−160, 40) | (40, –158) | (45, 45) |
| relative free energy (kcal/mol) | 0.0 | 0.2 ± 1.0 | 0.0 ± 0.7 | 9.8 ± 0.2 | |
| main H-bond | O6–N2:H21 | O6–N1:H1, N7–N2:H21, OP2–N2:H22 | |||
| DNA-CGG1 | approximate location (χ5, χ14) | (−99, –105) | (−96, 73) | (73, –96) | (67, 67) |
| relative free energy (kcal/mol) | 2.7 ± 0.1 | 0.0 | 1.4 ± 0.3 | 5.6 ± 0.2 | |
| main H-bond | O6–N2:H22 | O6–N1:H1, N7–N2:H21 | |||
| RNA-GGC1 | approximate location (χ5, χ14) | (−165, –155) | (−160, 40) | (40, –160) | (61, 63) |
| relative free energy (kcal/mol) | 3.1 ± 0.8 | 0.0 | 1.5 ± 0.8 | 4.0 ± 0.4 | |
| main H-bond | O6–N2:H21 | O6–N1:H1, N7–N2:H21, OP2– N2:H22 |
|||
| DNA-GGC1 | approximate location (χ5, χ14) | (−116, –90) | (−113, 70) | (70, –113) | (75, 73) |
| relative free energy (kcal/mol) | 4.9 ± 0.2 | 0.0 | 0.4 ± 0.2 | 9.9 ± 0.4 | |
| main H-bond | O6–N2:H21 | O6–N1:H1, N7–N2:H21 | |||
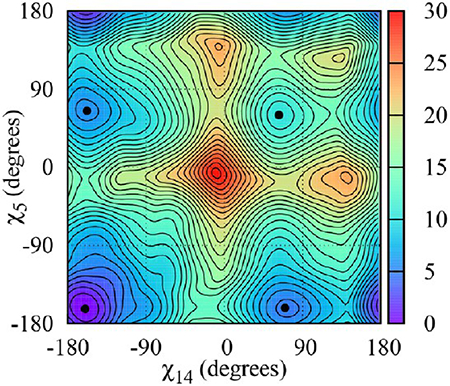
We begin our discussion with a consideration of the free energy maps for the single-mismatch sequences CCG1, GCC1, CGG1, and GGC1. Figure 2 shows the (χ5, χ14) free energy maps for the C-rich duplexes. For RNA, the deepest minimum is located at χ = −163° for both C’s in the mismatch and both sequences, and for DNA, the deepest minimum is located between χ = −122° and χ = −125° for both sequences. These χ values correspond to anti–anti conformations. For all duplexes, the next minima correspond to anti–syn conformations, while syn–syn conformations are considerably higher in energy. For RNA, the anti–syn minima are closer in value to the absolute anti–anti minimum than for DNA.
Figure 2.

The (χ5, χ14) free energy landscapes for single C·C mismatches (units kcal/mol): (a) DNA-CCG1; (b) DNA-GCC1; (c) RNA-CCG1; (d) RNA-GCC1.
Figure 3 shows the (χ5, χ14) free energy maps for the G-rich duplexes. For all duplexes but RNA-CGG1, the absolute minimum corresponds to anti–syn conformations. In RNA-CGG1, the anti–anti and anti–syn minima have the same value within the error of the calculation. We believe the inability of the free energy calculation to pin down the anti–syn conformation as the absolute minimum is due to a strong triple G-base stacking not present in the GGC repeat. Figure 4a illustrates this stacking. Notice also that the strong hydrogen bond between G14(N2) and G15(O6) also contributes to the stacking stability of RNA-CGG (see Figure 4b). For DNA, the anti–syn minima are located at (−96°, 73°) and mirror image (73°, −96°) for CGG1 and (−113°, 70°) and mirror image (70°, −113°) for GGC1. For RNA, the anti–syn minima are located at (−160°, 40°) and mirror image (40°, −158°) for CGG1 and (−160°, 40°) and mirror image (40°, −160°) for GGC1.
Figure 3.

The (χ5, χ14) free energy landscapes for single G·G mismatches (units kcal/mol): (a) DNA-CGG1; (b) DNA-GGC1; (c) RNA-CGG1; (d) RNA-GGC1.
Figure 4.

Triple G stacking observed in CGG sequences. The figure is shown for DNA-CGG1, but a similar situation occurs in RNA-CGG1. (a) Stacking involving G5–G14 bases (red), G6 base (yellow), and G15 (blue). (b) Hydrogen bond between G14(N2) (blue) and G15(O6) (red).
Recently, several improved force fields have been introduced for DNA. A comparison of free energy maps computed with different force fields BSC0, BSC1, and OL15 is shown in Figure 5 for two DNA sequences. The free energy maps are relatively similar: All force fields predict the absolute minimum to be anti–anti for the C·C mismatches and anti–syn for the G·G mismatches. The positions of the minima are similar, especially for the G-rich duplexes. The main difference is that the minima are deeper in BSC1 and OL15, providing for a more rigid mismatched DNA duplex with respect to that in BSC0. In addition, in the C-rich duplexes, the anti–syn minima are closer in depth to the anti–anti absolute minimum in BSC0 than in the other two fields; OL15 seems to give intermediate results in this respect.
Figure 5.

Comparison of (χ5, χ14) free energy maps for different force fields: (left) DNA-GCC1; (right) DNA-GGC1. Results shown are for (a) BSC0,58 (b) BSC1,57 and (c) OL15.60
B. MD Simulations for One- and Three-Mismatch Sequences.
To gain further insight into the dynamics of the mismatches, we have followed these calculations up with regular, 1 μs MD simulations, both for the one- and three-mismatch sequences, starting from the four possible combinations for the mismatches: anti–anti, anti–syn, syn–anti, and syn–syn. Figures S2–S17 show the χ5 and χ14 torsion angles, the hydrogen bond number (hbond) between the mismatches, and the distance between the centers of mass of the bases in the mismatch, as a function of time. For the C-rich sequences, general observations are as follows: (i) Sequences starting in anti–anti conformations are stable. (ii) Sequences starting in anti–syn quickly transition to anti–anti in DNA. Movie S1 (jp8b01658_si_002.mp4) shows the quick transition after only 4.5 ns from anti–syn to anti–anti in the major groove in DNA-CCG1. (iii) Sequences starting in anti–syn take several hundred nanoseconds (close to the full 1 μs time scale) to transition to anti–anti in RNA with one mismatch but transition quickly in the looser three-mismatch sequence. Movie S2 (jp8b01658_si_003.mp4) shows the transition around 940 ns from anti–syn to anti–anti in the minor groove for RNA-CCG1. (iv) Sequences starting in syn–syn transition to either the absolute anti–anti minimum or the intermediate anti–syn minimum. For the G-rich sequences, general observations (ignoring the ambivalence in the anti/syn definition when χ = ±90°) are (i) sequences starting in the anti–anti relative minimum remain in anti–anti in the 1 μs time scale; (ii) sequences starting in the anti–syn absolute minimum remain in this minimum; (iii) RNA sequences starting in syn–syn quickly transition to anti–syn (one repeat) or stay in syn–syn over the 1 μs time scale (three repeats), while DNA sequences remain around χ = +90°. For sequences starting in the (rather artificial) syn–syn conformations, long-lived stacking among the bases can be observed in a few runs. Although RNA does not display an e-motif, extrusion of a C base is observed in RNA-GCC1 (anti–syn) and RNA-CCG3 (syn–syn), probably caused by the duplex seeking a transition path toward the anti–anti global minimum.
The hydrogen bond populations observed during the 1 μs regular MD runs for the single mismatch sequences are given in Table 2. First, we consider the C·C mismatch conformations shown in Figure 6a,b. For the DNA BSC1 force field, there is no e-motif formation in the 1 μs time scale; thus, the hydrogen bonds described here correspond to an intrahelical C·C mismatch. For the anti–anti conformations, the main hydrogen bonds are N3–N4:H41 and N4:H41–N4 with an additional important contribution by N4:H41–O2 in RNA-CCG. For the anti–syn conformations, the hydrogen bond N4:H42(syn)–N3(anti) is present in all RNA and DNA duplexes; the hydrogen bond N4:H41(anti)–N4(syn) is present in all duplexes but RNA-CCG; and the hydrogen bond N4:H42(syn)–O2(anti) is present in DNA duplexes only. The presence of three, relatively stable hydrogen bonds in DNA results in shorter C·C mismatch distances. Next, we consider the G·G mismatch conformations shown in Figure 6c,d. For the anti–anti conformations, the main hydrogen bonds are N2:H21/H22–O6 and N1:H1–N2, while, for the anti–syn conformations, the main hydrogen bonds are N1:H1(anti)–O6(syn) and N2:H21(anti)–N7(syn) for both RNA and DNA; the RNA duplexes also have an important contribution from N2:H22(syn)–OP2(syn), and there is a smaller contribution from N1:H1(anti)–N7(syn). Notice the very good agreement in the populations for the anti–syn and syn–anti conformations, which are expected to be equivalent due to the symmetry of the sequences. For either mismatch type, it is difficult to obtain reliable data for the hydrogen bond number for the syn–syn conformation. This is due to the conformational fluctuations and rapid transitioning into other configurations associated with these states.
Table 2.
H-Bond Percentage for the Different Conformations in the Single Mismatch Sequencesa
| RNA-CCG |
RNA-GCC |
DNA-CCG |
DNA-GCC |
|||||||||
| H-bond percentage (%) | AA | AS/SA | AA | AS/SA | AA | AS/SA | AA | AS/SA | ||||
| C(N3)–C(N4:H41) | 50.5 | 47.8 | 95.5 | 87.9 | ||||||||
| C(O2)–C(N4:H41) | 28.5 | 6.2 | 12.7 | 9.0 | ||||||||
| C(N4)–C(N4:H41) | 20.7 | 2.6 | 35 | 8.2 | 16.1 | 20.5 | 33.2 | 17.3 | ||||
| C(N3)–C(N4:H42) | 15.5 | 16.2 | 64.4 | 48.8 | ||||||||
| C(O2)–C(N4:H42) | 11.0 | 15.1 | ||||||||||
| RNA-CCG |
RNA-GCC |
DNA-CCG |
DNA-GCC |
|||||||||
| H-bond percentage (%) | AA | AS | SA | AA | AS | SA | AA | AS | SA | AA | AS | SA |
| G(O6)–G(N2:H21) | 18.4 | (28.9) | 29.0 | 34.8 | (14.8) | 17.8 | 52.3 | |||||
| G(O6)–G(N2:H22) | 6.8 | 17.0 | 70.0 | 10.2 | ||||||||
| G(N2)–G(N1:H1) | 11.7 | 21.8 | ||||||||||
| G(O6)–G(N1:H1) | (86.5) | 88.0 | 14.5 | (65.4) | 70.1 | (87.0) | 88.9 | 7.0 | (79.1) | 80.4 | ||
| G(OP2)–G(N2:H22) | (92.4) | 92.0 | (96.4) | 96.3 | (11.3) | 8.8 | (9.3) | 10.1 | ||||
| G(N7)–G(N2:H21) | (67.0) | 67.8 | (97.4) | 97.4 | (84.5) | 81.4 | (97.1) | 96.7 | ||||
| G(N7)–G(N1:H1) | (34.5) | 31.1 | (11.8) | 9.1 | (24.1) | 23.0 | ||||||
AA stands for anti–anti and AS (SA) for anti–syn (syn–anti) conformations. The mismatch (Figure 1) is B5–B14 (with B representing G or C bases). For AA, the value represents the total H-bond. The values under AS/SA in C-rich sequences represent the average of AS and SA. In G-rich sequences, in the AS and SA columns, the values in brackets correspond to B14(N3)–B5(H41) and those outside the brackets to the complementarys B5(N3)–B14(H41). All of the calculations use a 3.5 Å distance cutoff and a 135° angle cutoff. Percentages less than 2% are not listed.
Figure 6.

Schematic illustrating the main hydrogen bonds for mismatches: (a) C·C mismatch (anti–anti); (b) C·C mismatch (anti–syn); (c) G·G mismatch (anti–anti); (d) G·G mismatch (anti–syn). Anti bases are shown in blue, and syn bases, in red.
C. MD Simulations for Four-Mismatch Sequences.
For the sequences with four TRs, we carry out MD simulations with initial mismatch conformations corresponding to the absolute minimum of the free energy, i.e., anti–anti for the C·C mismatches and anti–syn for the G·G mismatches. For each sequence, two runs were performed: one with the initial duplex in ideal A form and one with the initial duplex in ideal B form. The two simulations quickly converge. Convergence and stability of these runs is displayed in Figures S18–S21, that present results for the dihedral angles of the internal mismatches, the number of hydrogen bonds, and the C1′–C1′ distances. Structural features of the resulting duplexes are presented in Figures 7 and 8. These figures show the distribution of the four TR sequences grouped by double helix handedness, C1′–C1′ distance, and χ6 and χ23 dihedral angles. Handedness (defined in the Supporting Information) has values of 5.1 and 6.1 for ideal A and B helices. First, we consider the C-rich sequences: (i) For RNA, there is almost no difference between the CCG4 and GCC4 sequences, with both sequences resulting in duplexes distributed around the ideal A-form and dihedral angle χ distributions corresponding to anti -ap conformations. (ii) The DNA duplexes slightly unwind from the initial B-form and end in forms intermediate between the A- and B-forms: GCC is more B-like, while CCG is more A-like; in other words, DNA duplexes with GpC steps unwind more. This conformational difference is seen both in the handedness and in the C1′–C1′ distances, that are considerably shorter than those for regular double helices; both sequences have the same χ distribution centered at χ ≃ −120° and corresponding to anti -ac conformations. Now we consider the results for the G-rich sequences presented in Figure 8: (i) Except for RNA-GGC4, the other three duplexes experience some degree of unwinding, with DNA-CGG4 closer to the A-form than DNA-GGC4 (in other words, duplexes with GpC steps between the Watson–Crick base pairs tend to unwind slightly more than duplexes with CpG steps); (ii) syn χ values are centered around 40° for RNA and 72° for DNA, while anti χ values are centered around −161° for RNA, −104° for DNA-GGC4, and −90° for DNA-CGG4.
Figure 7.

Distribution of the four TR helical duplexes CCG4 and GCC4 grouped by handedness, C1′–C1′ distance, and χ6 and χ20 dihedral angles. Handedness was calculated for the two central TRs. The curves are based on data from the last 800 ns of the two simulations for each sequence.
Figure 8.

Distribution of the four TR helical duplexes CGG4 and GGC4 grouped by handedness, C1′–C1′ distance, and χ6 and χ20 dihedral angles. Handedness was calculated for the two central TRs. The curves are based on data from the last 800 ns of the two simulations for each sequence.
To further quantify these structures, we show the “simple twist” based on C1′ atoms (see the definition in the Supporting Information) in Figure 9 for the middle steps for DNA and RNA. For reference, ideal B-DNA has a twist with a value of 36° and ideal A-RNA has a twist with a value of 31.5°. Immediately after equilibration, the twist quickly acquires sequence-dependent values. Convergence of the simulations is confirmed by the mirror symmetry of the twist around the central step (step 7) that reflects the inversion symmetry of the sequences. To describe the twist, we name the step types, starting with the general definition of Watson–Crick steps as L = GpC = GC/GC and M = CpG = CG/CG. In addition, we define “steps” containing mismatches as MC = CG/CC = CC/CG (like a CpG step M but containing C mismatches) and LC = GC/CC = CC/GC (like a GpC step L containing C mismatches). Thus, the pattern of steps (4–5-6–7-8–9-10) in Figure 9 for (CCG)4 is L-MC-MC-L-MC-MC-L, and for (GCC)4, it is M-LC-LC-M-LC-LC-M. Proceeding in a similar manner for the G-rich sequences, we define MG = CG/GG = GG/CG (like CpG step M with G·G mismatches) and LG = GC/GG = GG/GC (like a GpC step L containing G·G mimatches). Thus, the pattern of steps (4–5-6–7-8–9-10) in Figure 9 for (CGG)4 is L-MG-MG-L-MG-MG-L, and for (GGC)4, it is M-LG-LG-M-LG-LG-M. In the C-rich sequences, the twist is more uniform along the sequence, especially for the (GCC)4 sequences with step pattern M-LC-LC-M-LC-LC-M. Sequences CCG4 experience increased twist at steps 5 and 9 (MC step types) with twist decrease in the other steps for both RNA and DNA (although the differences are more marked for RNA). G-rich sequences, on the other hand, experience dramatic variation on the sequence-dependent twist, accompanied by some local unwinding. The GGC4 sequences experience a considerable decrease of twist at mismatch steps 6 and 8 (LG step type) surrounding the central CpG step, with the twist in the other steps either staying close to the initial value or increasing. In CGG4 sequences, the decrease of twist at steps 6 and 8 (MG step type) surrounding the central GpC step is even more pronounced, particularly for DNA. This is agreement with the twist behavior observed in DNA-(CAG)4, where the most unwinding occurs in the mismatch steps surrounding the central GpC step.48
Figure 9.

Simple twist in the four-mismatch homoduplexes. Data was averaged over the last 800 ns of the two runs for each duplex.
To elucidate to what extent the mismatches distort the initial A-RNA and B-DNA forms, we have carried out a standard principal component analysis71 (PCA) on the backbone of the duplexes. Figure 10 shows the distribution of conformations projected onto the first principal component for the backbone of the eight four-mismatch duplexes. This figure shows that the first eigenvector corresponds to the simultaneous coupling of bending and unwinding modes.
Figure 10.

Conformational fluctuations around the first eigenvector direction based on the PCA analysis of the backbone of the four-mismatch homoduplexes.
D. E-Motif in DNA-GCC.
In a parallel paper,44 we presented results about the conformations, stability, and dynamics of formation of the e-motif in DNA homoduplexes of TRs and hexanucleotide repeats (HRs). In an e-motif, the cytosines of a mismatch flip out symmetrically into the minor groove with the bases rotating toward the 5′ direction of each strand. E-motifs are not observed in RNA homoduplexes (at least not in sequences with chemically unmodified repeat sequences solvated in simple water solutions). Trinucleotide repeats have two reading frames, (CCG)n and (GCC)n, while HRs have three, (CCCCGG)n, (CGGCCC)n, and (CCCGGC)n. Previously, we defined seven types of pseudo base pair steps related to the mismatches and showed that the e-motif is only stable in (GCC)n and the (CCCGGC)n homoduplexes. This is primarily due to the favorable stacking of the pseudo GpC steps (whose exact nature depends on the nature of the repeat) and the formation of hydrogen bonds between the mismatched cytosine (at position i) and cytosine (for TRs) or guanine (for HRs) at position i – 2 (i – 4) along the same (opposite) strand. We showed that the e-motif is stable under the three modifications of the DNA force field, mainly BSC0, BSC1, and OL15.44 In Figure 5, we show that free energy maps for these three force fields all share the same free energy minima (in terms of the dihedral angles χ) for the mismatch conformations. The barriers between the different minima are lowest for BSC0 and highest for BSC1 (barriers for OL15 are intermediate). This suggests that the mismatches generated with BSC1 are probably less flexible. Thus, transitions between the different conformations will, statistically speaking, happen faster in BSC0 than in BSC1. Indeed, our simulations show the spontaneous formation of e-motifs during regular molecular dynamics simulations over a time period of a few hundreds of nanoseconds in TRs (GCC4) and HRs using the BSC0 force field.
The results under the BSC1 force field presented so far for the eight nonequivalent homoduplexes correspond to the equilibrium conformations, except for DNA-GCC. For this particular sequence, the intrahelical C·C mismatches under the BSC1 force field represent a metastable or transient conformation, while extrahelical e-motifs characterize the stable conformation. In Figure 11a,b, we show an extended e-motif studied in our previous work. The extrahelical C mismatches in an extended e-motif are stabilized by (i) pseudo GpC steps formed by the Watson–Crick base pairs adjacent to the mismatches, (ii) hydrogen bonds between the extruded C bases at a given position and C bases belonging to Watson–Crick base pairs a few positions away from that, and (iii) the stacking of the extruded C bases themselves. The pattern of stabilizing hydrogen bonds for GCC4 with an extended e-motif depends on the force field: OL15 consistently displays intrastrand Ci(N4)–C(i–2)(O2) bonding, BSC0 shows a mix of intra- and interstrand bonding, and BSC1 shows interstrand bondings between the N4 atom of the Ci mismatched base in one strand and the O4′ atom of the second Watson–Crick paired C in the opposite strand (i.e., C6–C27, C9–C24, etc.).44 Hydrogen bond populations for the extruded C’s in the extended e-motif are also shown in Figure 11c. Figure 12a shows the total handedness of the middle three regular (Watson–Crick) CpG steps for the extended e-motif. The extended e-motif is quite close to ideal B-DNA. Figure 12b shows the step twist of the middle seven steps for the extended e-motif. Notice that, due to the extrusion of the mismatches and the good stacking afforded by the pseudo GpC steps, base pair twist is well-defined, while in the previous figures we used simple twist because the intrahelical mismatches preclude an unambiguous definition of step twist. The pseudo GpC steps (2, 4, 6, 8) exhibit a large twist value, as high as ~85°, accompanied by a considerable decrease of twist in its Watson–Crick CpG neighbors. Intrahelical C mismatches, instead, give a fairly uniform (simple) twist, as shown for DNA-GCC4 in Figure 9.
Figure 11.

Extended e-motif in a DNA-GCC4 duplex. Duplex obtained using (a) the BSC1 force field and (b) the OL15 force field. The dash-lined squares show the extruded CC stacking. Intrastrand hydrogen bonds are shown in purple inside the circles. Part c shows the hydrogen bonds as obtained from the two force fields, with the hydrogen bonds with the highest percentage associated with the extruded C6, C9, and C12 bases and the symmetric ones on the other strand. Cyan color shows the percentage of the labeled hydrogen bonds, and red color shows the symmetric ones on the other strand.
Figure 12.

Handedness and base pair step twist for the DNA-GCC4 extended e-motif. (a) The total handedness of the middle three regular CpG steps. BSC1 gives better agreement with the ideal B-DNA value of 1.52. (b) The step twist of the middle seven steps. The pseudo GpC step shows a large twist value as high as around 85°, which at the same time decreases the neighboring twist values. Data are based on the last 1000 ns run in BSC1 and the last 400 ns run in OL15.
E. Distribution of the Neutralizing Na+ Ions.
Figures S22–S29 show the distance between Na+ ions to the center of mass of the single mismatches. Different colors represent different ions in order to show the single-ion binding time for separate ions. Ions within a distance of 5 Å always have direct interactions with the bases in the mismatch. For the C·C mismatches, there is an increased presence of ions around RNA than around DNA. These figures indicate that the binding time for any single ion is short (except for the nonequilibrium DNA-GCC1 starting in syn–syn). For both RNA and DNA, there is a greater population of Na+ ions around the G·G mismatches. Interestingly, for the equilibrium anti–syn sequences, ion binding in the GGC sequences is much longer than ion binding in the CGG sequences. The most important difference between the single-mismatch sequences in Figures S22–S25 and the inner mismatches in the three-mismatch sequences is that the latter do not display long-time ion binding for any of the conformations, a fact that we attribute to the enhanced flexibility of the multiple mismatches.
Figures 13 and 14 show the ion occupancy for the single mismatches in RNA and DNA. If the mismatches stayed in the initial anti–anti or syn–syn conformations, ion distributions around C5/G5 (blue) should be the same as ion distributions around C14/G14 (red) due to the inversion symmetry of the single-mismatch duplexes (which is not present in the initial anti–syn conformations). For all of the C-rich sequences, this is clearly seen in the initial anti–anti conformations (that correspond to the minimum of the free energy) but not in the conformations that start in syn–syn, as these transitions are very rapid. In fact, deviations from this symmetry such as in Figure 14c1 for DNA-CGG1 starting in anti–anti correspond to “unhappy” conformations that are transitioning to the global equilibrium, in this case, anti–syn. For the C-rich conformations corresponding to equilibrium (anti–anti), the major binding sites are O2 and N3 for both RNA and DNA, with DNA displaying much stronger binding at these sites. For G-rich sequences corresponding to the global minimum (anti–syn), considerable binding is seen at N7 and O6, with the latter becoming a stronger attractor of Na+ ions in the GGC sequences.
Figure 13.

Ion occupancy around the single C·C mismatch in RNA and DNA. Blue: base C5. Red: base C14. RNA-CCG1: (a1) anti–anti; (a2) anti–syn (first 900 ns); (a3) syn–syn. RNA-GCC1: (b1) anti–anti; (b2) anti–syn (first 700 ns); (b3) syn–syn. DNA-CCG1: (c1) anti–anti; (c2) anti–syn; (c3) syn–syn. DNA-GCC1: (d1) anti–anti; (d2) anti–syn (first 150 ns); (d3) syn–syn (first 450 ns). A schematic showing the labeling of the different atoms is given in Figure S30.
Figure 14.

Ion occupancy around the single G·G mismatch in RNA and DNA. Blue: base G5. Red: base G14. RNA-CGG1: (a1) anti–anti; (a2) anti–syn; (a3) syn–syn. RNA-GGC1: (b1) anti–anti; (b2) anti–syn; (b3) syn–syn. DNA-CGG1: (c1) anti–anti; (c2) anti–syn; (c3) syn–syn (first 950 ns). DNA-GGC1: (d1) anti–anti; (d2) anti–syn; (d3) syn–syn. A schematic showing the labeling of the different atoms is given in Figure S30.
Some typical Na+ ion binding conformations are shown in Figure 15. Figure 15a shows the binding to O2 and N3 atoms in the minor groove for a C·C mismatch in anti–anti conformation. This binding is found in both DNA and RNA and is particularly high in DNA (with occupancy near 100%). Figure 15b shows the binding of Na+ to atoms O2, N3, O5′, and OP2 in the C-base(syn) in the major groove of RNA-CCG in anti–syn conformation. This is a highly populated conformation (see in Figure 13a2); it may involve the four atoms as shown here or just two or three of those. For RNA-GCC, there is a similar binding site but closer to the backbone with less binding to N3. By contrast, the Na+ ion binding to anti–syn DNA-CCG shown in Figure 15c occurs in the minor groove and involves the O2 atom of the C base(anti) in the mismatch and a neighboring O2 atom of the C base belonging to an adjacent Watson–Crick base pair. Figure 15d shows that, in RNA-CGG and RNA-GGC, Na+ binds to the N7 and O6 atoms in the major groove. This binding is very close to the backbone and always includes the neighboring OP2 atoms. Figure 15e shows a particular high binding site comprised of N3, O6, and O4′ atoms in the minor groove of DNA-CGG in anti–anti conformation. This is a very stable binding that also involves the O2 and N2 atoms of the neighboring Watson–Crick base pair and precludes the transition to the global minimum (anti–syn). This binding is only found in DNACGG because of its B-form shape and the way neighboring bases stack. Figure 15f shows binding to the O6 atoms in the major groove for both RNA-CGG and DNA-CGG in anti–syn, while part g shows a similar binding to part f but as it occurs in GGC. The binding occupancy in GGC is much higher because Na+ also binds a third G-O6 atom.
Figure 15.

Some typical Na+ ion binding sites. C·C or G·G mismatches are highlighted in cyan color, and Na+ ions are represented by orange spheres. (a) Binding to O2 and N3 atoms in the minor groove for a C·C mismatch in anti–anti conformation, for both RNA and DNA. (b) Binding to O2, N3, O5′, and OP2 of C-base(syn) in the major groove of RNA-CCG in anti–syn conformation. (c) Typical binding for DNA-CCG in anti–syn, that occurs in the minor groove. It involves the O2 atom of a mismatched C base(anti) and the neighboring O2 atom of a Watson–Crick C base. (d) For RNA-CGG and RNA-GGC, Na+ binds to the N7 and O6 atoms in the major groove and the OP2 backbone atoms. (e) Binding to N3, O6, and O4′ in the minor groove of DNA-CGG in anti–anti conformation. Binding also involves the O2 and N2 atoms of the neighboring Watson–Crick base pair. (f) Binding to O6 atoms in the major groove for both RNA-CGG and DNA-CGG in anti–syn. (g) Similar binding to part f but in GGC. The binding occupancy in GGC is much higher because Na+ also binds a third G-O6 atom.
Figures 16 and 17 show the ion cloud densities around the C·C and G·G mismatched duplexes, respectively. First, we consider the C-rich sequences. For RNA-CCG4 and RNA-GCC4, the main ion binding occurs in the major groove, although the cyan surfaces in the major groove are not directly connected to the mismatches. In RNA-CCG4, there are also some cyan surfaces in the minor groove near the mismatches, which correspond to the binding site in Figure 15a. For DNA-CCG4 and DNA-GCC4, these minor groove binding sites, as shown in Figure 15a, are more localized and obvious. DNA-CCG4 in part c and DNA-GCC4 in part d show an ion density highly localized around the mismatches. Pink surfaces with low ion densities are observed in Watson–Crick GpC steps (part c), a behavior that is also observed in regular B-DNA. Next, we consider the G-rich sequences. For all four structures, binding mainly occurs in the major groove, which corresponds to the binding site in Figure 15f,g. Ion binding in RNA-GGC4 is more localized than that in RNA-CGG4 because of the binding conformation in Figure 15g. This also explains why, for DNA-GGC4, the cyan surfaces are more stretched in the direction of the central axis than in DNA-CGG4. DNA also shows binding with lower density in the minor groove. For all but RNA-CGG4, ion binding reaches its highest density around the mismatches.
Figure 16.

Ion cloud densities around the intrahelical C·C mismatched duplexes: (a) RNA-CCG4; (b) RNA-GCC4; (c) DNA-CCG4; (d) DNAGCC4. All of the C·C mismatches (shown in green) are in anti–anti form. The cyan surface shows a high ion density, and the pink surface shows a low ion density.
Figure 17.

Ion cloud densities around the G·G mismatched duplexes: (a) RNA-CGG4; (b) RNA-GGC4; (c) DNA-CGG4; (d) DNA-GGC4. All G·G mismatches (shown in green) are in anti–syn form. The cyan surface shows a high ion density, and the pink surface shows a low ion density.
Now we consider the particular case of DNA-GCC duplexes that display an extended e-motif. The Na+ distribution shown for DNA-GCC4 in the previous figures corresponds to mainly intrahelical C·C mismatches. The extended e-motif naturally brings about considerable changes in the ion distribution around the mismatches. Figure 18 shows the ion cloud densities for DNA-GCC4 duplexes exhibiting an extended e-motif under the BSC1 and OL15 force fields. In this figure, the black circles show the strong ion bindings in the pseudo GpC step (after C’s are extruded), while the red circles show the binding to the extrahelical C bases. In the pseudo GpC steps, the ion strongly binds to the G(N7) atoms. The average binding occupancy to G(N7) for the middle two pseudo GpC steps is 68.1% for BSC1 and 39.0% for OL15. On the other hand, the ion binding to the extruded C’s is higher in OL15 than in BSC1.
Figure 18.

Ion cloud densities and binding sites in DNA-GCC4 duplexes exhibiting an extended e-motif: (a) extended e-motif under BSC1; (b) extended e-motif under OL15. Extrahelical C bases are shown in green. Important ion densities are shown in cyan (slightly higher density) and pink (slightly lower density) surfaces. Black circles show the ion bindings in the pseudo GpC step; red circles show the bindings to extrahelical C bases. (c) Typical ion binding site in the pseudo GpC step. G bases are shown in cyan and C bases in yellow. Ions show strong bindings to the G(N7) atoms.
F. Fast Melting by an Infrared Laser Pulse of the Four DNA Homoduplexes.
Previously, we have used fast melting by an infrared laser pulse in order to investigate the responses of polyglutamine and polyasparagine amyloid aggregates. The laser frequency scanning simulations associated with this study showed that the optimum frequency was the one which targeted the C=O main-chain bonds equally in both aggregates, thereby destabilizing the β sheet structure (polyasparagine amyloid aggregates are less stable than polyglutamine amyloids).54 We have also successfully used the technique in a study of comparative melting and healing of B-DNA and Z-DNA.55 The nonequilibrium results obtained are in agreement with the fact that B-DNA is more stable than Z-DNA under physiological conditions of pH and ionic strength.
To unambiguously rank the relative stability of DNA or RNA structures which differ in sequence or in conformation can be quite expensive computationally. A meaningful comparison between the different homoduplexes considered here is possible, because there exists a single laser pulse frequency (specifically, at k = 1870 cm−1) that results in the same resonant peak when it targets the bond G(C6–O6) pertaining to a Watson–Crick hydrogen bond in both structures (see Figure 19). This gives exactly the same absorption pattern for the energy for all of the different helical duplexes, thereby allowing for a fair comparison of the fast melting of healing of the structures following the application of the laser pulse (except, as will be discussed, for the GCC e-motif duplex). The response to the laser is tuned to vary from small perturbations at low field strengths to substantial melting at high strengths. This allows for an extensive comparison of the homoduplex responses. We note, however, that this laser-melting approach is by definition a nonequilibrium process, whose results cannot be converted into equilibrium melting curves and free energy estimates.
Figure 19.

Results of wavenumber scan over different bonds associated with the C and G bases of DNA-CCG4. A wavenumber of 1870 cm−1 gives the largest fluctuation for guanine bonds, as well as a medium fluctuation to cytosine bonds, and was therefore chosen for the laser-melting simulations.
The melting curves shown in this work indicate that DNAGGC sequences (with paired ends), characterized by CpG Watson–Crick steps and pseudo GpC LG steps, are the most stable of the four. This is due to the better stacking allowed by the LG steps, together with stronger Na+ ion binding, which allow the GGC sequences to be closer to ideal B-DNA than CGG sequences. Figure 20 displays the minima of the hydrogen-bond percentage curves shown in Figure 21 versus the magnitude of the electric field. This figure essentially displays the duplex nonequilibrium melting curves.
Figure 20.

Value of the minima of the hydrogen-bond percentage curves shown in Figure 21 versus the magnitude of the electric field.
Figure 21.

Percentage of hydrogen bonds versus time in laser-melting simulations of the four, four-mismatched homoduplexes in DNA. The force field ff99SB BSC0 has been used. C·C mismatches are in anti–anti conformation and G·G mismatches in anti–syn conformation. Different colors show different magnitudes of the electric field in units of V/nm: 4 (black); 5 (red); 6 (green); 7 (blue); 8 (yellow). The results for each field are averaged over 80 independent laser-melting runs.
DISCUSSION
In the exons of the human genome, sequences of the form d(CGG)·d(CCG) are overexpressed. Expansions of CGG sequences lead to FXTAS in males,32 premature ovarian failure in females,33 and the inherited fragile X mental retardation syndrome.34 CCG are related to FRAXE,35 Huntington’s disease, and myotonic dystrophy type 1.36 In order to understand the mechanisms underlying sequence expansion, it is important to characterize the secondary structure adopted by the TR sequences both in DNA, where expansion originally occurs,37 and in RNA, where the expansion leads to toxic RNA gain-of-function.5,15–20 Thus, a first step toward the understanding of these diseases involves the structural characterization of the atypical DNA and RNA structures.
The work presented here is part of our effort to achieve a unified and comparative description of the nucleic acid duplexes obtained from SSRs for both DNA and RNA, considering all of the possible reading frames that result in CpG or GpC steps between the Watson–Crick base pairs, as shown in Figure 1. The structural importance of these steps has been denoted in the previous literature. Darlow and Leach45,46 introduced a scheme in which hairpins were classified according to the alignment of hairpin sides and the presence of an odd (or even) number of unpaired bases in the hairpin loop. Here, “frame 1” refers to GpC steps between the stem Watson–Crick base pairs, while “frame 2” corresponds to CpG steps between the stem base pairs (a “frame 3” presented not a single Watson–Crick base pair, which would therefore correspond to a considerably less stable structure). We have presented results for MD simulations and free energy calculations for both CCG and GGC trinucleotide repeats, with either CpG or GpC steps, for both RNA and DNA. This results in eight different nonequivalent helical duplexes. Our main results are as follows.
1. The Global Minimum of the Free Energy Maps Associated with C·C Mismatches in the Four Duplexes RNA/DNA-CCG/GCC Correspond to Anti−Anti conformations: Anti -ap in the RNA Duplexes and Anti -ac in the DNA Duplexes.
The energy difference between the (anti−syn)/(syn−anti) relative minima and the anti−anti absolute minimum is relatively large, around 5 kcal/mol for RNA and 7.5 kcal/mol for DNA. Syn–syn minima are even higher. Anti–anti conformations are also observed in the extruded mismatches in the DNA e-motifs. Typical hydrogen bond conformations for the mismatches are given in Table 2 and Figure 6 for intrahelical mismatches and Figure 11c for the DNA extended e-motif.
2. The Global Minimum of the Free Energy Maps Associated with G·G Mismatches in the Four Duplexes RNA/DNA-GGC/CGG Correspond to Anti–Syn Conformations.
In terms of the free energy, the next higher minimum corresponds to anti–anti conformations, while syn–syn conformations are even higher in free energy. However, short CGG sequences behave differently. In the phase diagram obtained for the CGG1 sequences, the anti–anti minima are comparable to the anti–syn minima due to the stacking of three consecutive G’s (Figure 4), rendered more stable by the considerable clamping exerted by the three G–C Watson–Crick base pairs on each side of the CGG sequence. Less constrained G·G mismatches in RNA-CGG4 and DNA-CGG4 exhibit the preferred anti–syn conformation during the 1 μs regular MD. Typical hydrogen bond conformations for the mismatches are given in Table 2 and Figure 6.
3. For DNA, the Force Fields BSC0, BSC1, and OL15 Give Similar Free Energy Maps for the Mismatch Configurations.
These force fields predict that the global minimum of the free energy landscapes based on the χ angles of the mismatch bases corresponds to anti–anti conformations for the C·C mismatches and anti–syn conformations for the G·G mismatches. The primary difference between these maps is that the minima generated are deeper in BSC1 and OL15. These then provide for a more rigid DNA duplex with respect to the one predicted by BSCO. We also note that, for C-rich duplexes, the anti–syn minima are closer in depth to the anti–anti absolute minima in BSCO than in the other two fields, with OL15 providing intermediate results.
4. DNA Duplexes in the GCC Reading Frame, with CpG Steps between the Watson–Crick Base Pairs, Exhibit the e-Motif.
In an e-motif, the set of mismatched C-bases (associated with the i residue) flip symmetrically out of the minor groove and point their base moieties toward the 5′ direction of each strand. The phase diagrams based on the torsion angle χ are degenerate with respect to the intra- or extrahelical position of the mismatches. Careful study of all of the conformations obtained for both free energy maps and various MD simulations indicate that occasionally the C bases can be temporarily extruded as nonequilibrium duplexes (such as those started in syn–syn conformations) seek the global minimum. However, the only duplexes where the e-motif is stable under the three force fields44 correspond to DNA-GCC (paired) sequences. This corresponds to CpG steps between the Watson–Crick bonded base pairs and to pseudo GpC steps when the mismatches stack on the helix as the result of the C bases extrusion. The latter is the crucial factor in the stability of the e-motif: the pseudo GpC steps maximize helical stacking. The extruded C bases at position i further stabilize the helix by forming hydrogen bonds with Watson–Crick base paired C bases in the 5′ direction (position (i – 2) along the same strand for BSC0 and OL15 and position (i – 4) across strands for BSC1). The extended e-motif has been proposed experimentally,45,46,72 but our work is the first one to provide a fully atomistic characterization of this particular and rather interesting secondary structure of DNA.
5. RNA Cannot Form e-Motifs.
We extended the RNAGCC duplex simulation up to 2 μs and found that, although occasionally C bases can flip into the major or minor groove, an e-motif never forms. We believe that RNA cannot form e-motifs (at least not in sequences with chemically unmodified repeat sequences solvated in simple water solutions) for two main reasons. First, the O2′ hydroxyl group can form hydrogen bonds with neighboring sugar and phosphate backbone atoms such as O2′–O4′, O2′–OP, etc., which significantly hinders the extrusion of the C bases. Second, the A-form that characterizes RNA precludes good stacking either for pseudo GpC or pseudo CpG steps. This is illustrated in Figure 22.
Figure 22.

Pseudo GpC step in RNA-GCC1. G4-C15 is shown in blue, and C6-G13 is shown red. C14 is flipping out and shown in green.
6. When Mismatches Are Initially Placed in Nonequilibrium Conformations, Intrahelical C·C Mismatches Make the Transition toward the Global Minimum Faster than G·G Mismatches.
The G bases tend to form nonequilibrium stacking interactions that can considerably slow their evolution toward the equilibrium anti–syn conformation. On the other hand, the extrusion of the C mismatches in DNA-GCC homoduplexes to form an e-motif can take from a few hundred of nanoseconds (BSC0) to microseconds or more (BSC1).
7. The Mismatched Duplexes Exhibit Characteristic Sequence-Dependent Patterns: Twist Is More Regular in Intrahelical C-Mismatched Sequences and Undergoes the Largest Variations in G-Mismatched Sequences and the DNA-GCC Extended e-Motif.
Twists for all of the helical duplexes with intrahelical mismatches are shown in Figure 9. In the Results section, we introduced the following notation: L = GpC = GC/GC; LC = GC/CC = CC/GC and LG = GC/GG = GG/GC (pseudo GpC step L containing either C or G mismatches); M = CpG = CG/CG; MC = CG/CC = CC/CG and MG = CG/GG = GG/CG (pseudo CpG step M containing either C or G mismatches). Thus, for steps (4–5-6–7-8–9-10) in Figure 9, the step types are the following: (CCG)4, L-MC-MC-L-MC-MC-L; (GCC)4, M-LC-LC-M-LC-LC-M; (CGG)4, L-MG-MG-L-MG-MG-L; and (GGC)4, M-LG-LG-M-LG-LG-M. In the intrahelical C-mismatched sequences, the twist is more uniform along the sequence. G-rich sequences, on the other hand, experience dramatic variation on the sequence-dependent twist, accompanied by some local unwinding. Both G-rich sequences for both DNA and RNA experience a considerable decrease of twist at mismatch steps 6 and 8, although the decrease in CGG4 is more pronounced for the MG steps surrounding the central GpC step than in GGC4 for the LG step surrounding the central CpG step. This is in agreement with the twist behavior observed in DNA-(CAG)4, where the most unwinding occurs in the mismatch steps surrounding the central GpC step.48 The resulting unwinding of the DNA duplexes can also be observed in the handedness function shown in Figure 8, where both CGG4 and GGC4 decrease their handedness with respect to the ideal B-DNA but CGG4 becomes closer to A-DNA than GGC4.
The situation for DNA-GCC4 is rather different. The extrusion of the C bases creates a different type of pseudo step, LL = GC//GC, such that the two step base pairs are just stacked on top of each other while not being covalently linked along the backbone.44 This effectively diminishes the number of steps. The resulting stacking base pairs form a helix that is quite close to B-DNA, as shown in Figure 12a. In the extended e-motif, the base pair twist of the pseudo GpC steps LL (2, 4, 6, 8) exhibits a large twist value, as high as ~85°, accompanied by a considerable decrease of twist in its Watson–Crick CpG neighbors (Figure 12b). Notice that, if one adds the twist of one pseudo GpC step and its regular neighbor CpG step, one obtains ~110° ~ 3 × 36°, where 36° would be the average twist value that the three base pairs would have in ideal B-DNA.
8. We Have Characterized the Neutralizing Na+ Ion Distribution around the Homoduplexes.
Some typical, very localized Na+ ion binding conformations are shown in Figure 15. These include binding (O2, N3, O2) in the minor groove for intrahelical C·C mismatch in anti–anti conformations for both RNA and DNA; binding (N7, O6 and OP2) in the major groove of RNA-CGG and RNA-GGC; binding (O6, O6) in the major groove for all G-rich sequences in anti–syn (the binding occupancy in GGC is much higher because Na+ also binds a third G-O6 atom); as well as various strong bindings to nonequilibrium glycosidic conformations, whose net effect is to lengthen the transition time scales. For all mismatches, ion density is more localized in DNA than in RNA. In the intrahelical C-mismatched sequences, ion density is more localized in the major groove for RNA and in the minor groove for DNA. For both RNA and DNA, there is a greater population of Na+ ions around the G·G mismatches. For all of the G-rich sequences, binding mainly occurs in the major groove, which corresponds to the binding site in Figure 15fg. Ion binding in RNA-GGC4 is more localized than that in RNA-CGG4 because of the binding conformation in Figure 15g. DNA also shows binding with a lower density in the minor groove. For all but RNA-CGG4, ion binding reaches its highest density around the mismatches.
Finally, the DNA-GCC extended e-motif, exhibits strong ion binding in the pseudo GpC LL steps [G(N7)–G(N7)] and around the extrahelical C bases (Figure 18).
9. A Qualitative Comparison of the Relative Stability of Intrahelically Mismatched Homoduplexes via Fast Melting by an Infrared Laser Pulse Indicates That DNA Homoduplex Stability Satisfies Grich(CpG) > Crich(GpC) ≥ Grich(GpC).
The use of the laser melting in order to determine the relative stability of related structures is not a universal technique. A crucial element for the application of the technique is that the application of the laser must alter or damage the structures in the same way. For the intrahelically mismatched DNA homoduplexes, we found that the single laser pulse wavenumber k = 1870 cm−1 generates the same resonant peak for the same bonds (Figure 19). This results in exactly the same energy absorption pattern for intrahelically mismatched duplexes, thereby allowing for a fair comparison of the fast melting of healing of the structures following the application of the laser pulse. Unfortunately, we could not find a laser frequency that equally affects homoduplexes with intrahelical mismatches and homoduplexes with extrahelical mismatches. In the e-motif, all laser frequencies seem to additionally disrupt the extrahelical hydrogen bonds that stabilize the e-motif. Therefore, GCC with an e-motif is affected considerably more than the other structures (see Figure 21d), as it absorbs additional energy from the laser.
Because the laser-melting technique is inherently a nonequilibrium process, the obtained results cannot be translated into equilibrium melting curves or provide rigorous estimates of the free energy involved. The melting curves shown in this work indicate that DNA-GGC sequences (with paired ends), characterized by CpG Watson–Crick steps and pseudo GpC LG steps, are the most stable of the four. This is due to the better stacking allowed by the LG steps, together with stronger Na+ ion binding, which allow the GGC sequences to be closer to ideal B-DNA than CGG sequences. Figure 20 displays the minima of the hydrogen-bond percentage curves shown in Figure 21 versus the magnitude of the electric field. This figure can be thought of as providing nonequilibrium melting curves of the different duplexes.
The laser-melting results are in excellent agreement with the scarce experimental data available. For experimental comparisons, it is important to notice that naming of the sequence alone (i.e., GGC or CGG) can be ambiguous due to slipped strands, hairpin formation, etc. Thus, it is better to identify the type of steps for the regular Watson–Crick base pairs. Following this, the DNA, G-rich, TR sequence with CpG steps among the Watson–Crick base pairs has been found in thermodynamic experiments as the most stable TR of all (including other TRs), with a melting temperature of 75 °C (see ref 73, referred to as CGG but with CpG W–C base pairs). Other experimental data also indicates that, in G-rich sequences, CpG Watson–Crick steps are more stable than GpC W–C steps.45 C-rich sequences are more ambiguous due to the formation of the e-motif and possible dependence on the number of repeats.43,45,46,74
CONCLUSIONS
Given the experimental consensus that the most typical DNA and RNA trinucleotide repeat secondary structures, at least in the initial stages of expansion, are hairpins whose stem lengths can vary wildly, a characterization of the mismatched helical duplexes forming the stems—here, specifically based on CCG and GGC trinucleotide repeats—provides a foundation toward a structural and dynamical understanding of the relevant trinucleotide repeat based atypical secondary structures. Experimental efforts in this direction with full atomic resolution currently are only comprised of two crystallographic studies of RNA duplexes for sequences (CGG) with GpC Watson–Crick steps,39,40 one crystallographic RNA duplex for the sequence (CCG) with GpC steps,41 and one NMR DNA C-rich duplex with CpG steps.42,43 As discussed at length in the paper, there are eight possible duplexes that can be formed from RNA and DNA with GpC and CpG steps between the Watson–Crick base pairs. Thus, we have carried out extensive and comprehensive MD simulations of these eight duplexes in order to elucidate their structural and dynamical characteristics. Our simulation results are in excellent agreement with the three known experimental cases, and therefore, we feel confident about the goodness of the results for the other five duplexes for which no experimental data is currently available. Some of the most salient results from our study are the following: On the basis of free energy calculations using relevant collective variables, the global minimum structures associated with C·C mismatches in the four duplexes RNA/DNA-CCG/GCC correspond to anti–anti conformations; similarly, the global minimum structures associated with G·G mismatches in the four duplexes RNA/DNA-GGC/CGG correspond to anti–syn conformations. To allay any misgivings in terms of the force fields being used for these calculations, we compared results for three of the most current DNA AMBER force fields, which completely agree as to the glycosyl conformations that correspond to the absolute minimum and the next minimum in the free energy maps (although the depths of the minima and barriers do vary with the force field). DNA duplexes in the GCC reading frame with CpG steps between the Watson–Crick base pairs exhibit the so-called e-motif structure. We have fully characterized the e-motif for longer sequences and presented a description of the extended e-motif that had been proposed in the literature45,46,72 but not characterized at the molecular level. On the basis of our data, we provide arguments about why RNA cannot display an e-motif. When duplexes with mismatches are initially prepared in nonequilibrium conformations, intrahelical C·C mismatches make the transitions toward the global minimum conformation faster than structures based on G·G mismatches. Our studies show that the duplexes exhibit characteristic sequence dependent patterns such that the twist is more regular in intrahelical C-mismatched sequences and undergoes the largest variations in G-mismatched sequences as well as in the DNA-GCC extended e-motif structure. Likewise, we have characterized the neutralizing Na+ ion distributions around the different homoduplexes, with a special focus on their distribution around the mismatches. Lastly, a qualitative comparison of the relative stability of homoduplexes via fast melting by an infrared laser pulse indicates that DNA homoduplex stability satisfies Grich(CpG) > Crich(GpC) ≥ Grich(GpC), which agrees very well with thermodynamical experimental measurements.45,73
Supplementary Material
ACKNOWLEDGMENTS
The work was supported by the National Institute of Health [NIH-R01GM118508]; the National Science Foundation (NSF) [SI2-SEE-1534941]; and the Extreme Science and Engineering Discovery Environment (XSEDE) [TG-MCB160064].
Footnotes
The authors declare no competing financial interest.
ASSOCIATED CONTENT
Supporting Information
The Supporting Information is available free of charge on the ACS Publications website at DOI: 10.1021/acs.jpcb.8b01658.
Definitions of twist and handedness, details of fast melting by a simulated infrared laser pulse, and Figures S1–S30 (PDF)
Movie S1 showing the transition from anti–syn to anti–anti in the major groove for DNA-CCG1 (MP4)
Movie S2 showing the transition from anti–syn to anti–anti in the minor groove for RNA-CCG1 (MP4)
REFERENCES
- (1).Ellegren H Microsatellites: Simple Sequences with Complex Evolution. Nat. Rev. Genet 2004, 5, 435–445. [DOI] [PubMed] [Google Scholar]
- (2).Giunti P; Sweeney MG; Spadaro M; Jodice C; Novelletto A; Malaspina P; Frontali M; Harding AE The Trinucleotide Repeat Expansion on Chromosome 6p (SCA1) in Autosomal Dominant Cerebellar Ataxias. Brain 1994, 117, 645–649. [DOI] [PubMed] [Google Scholar]
- (3).Campuzano V; Montermini L; Moltò MD; Pianese L; Cossée M; Cavalcanti F; Monros E; Rodius F; Duclos F; Monticelli A; et al. Friedreich’s Ataxia: Autosomal Recessive Disease Caused by an Intronic GAA Triplet Repeat Expansion. Science 1996, 271, 1423–1427. [DOI] [PubMed] [Google Scholar]
- (4).Mirkin SM DNA Structures, Repeat Expansions and Human Hereditary Disorders. Curr. Opin. Struct. Biol 2006, 16, 351–358. [DOI] [PubMed] [Google Scholar]
- (5).Mirkin SM Expandable DNA Repeats and Human Disease. Nature 2007, 447, 932–940. [DOI] [PubMed] [Google Scholar]
- (6).Pearson CE; Edamura KN; Cleary JD Repeat Instability: Mechanisms of Dynamic Mutations. Nat. Rev. Genet 2005, 6, 729–742. [DOI] [PubMed] [Google Scholar]
- (7).Wells RD; Warren ST Genetic Instabilities and Hereditary Neurological Diseases; Academic Press: San Diego, CA, 1998. [Google Scholar]
- (8).Orr HT; Zoghbi HY Trinucleotide Repeat Disorders. Annu. Rev. Neurosci 2007, 30, 575–621. [DOI] [PubMed] [Google Scholar]
- (9).Wells RD; Dere R; Hebert ML; Napierala M; Son LS Advances in Mechanisms of Genetic Instability Related to Hereditary Neurological Diseases. Nucleic Acids Res. 2005, 33, 3785–3798. [DOI] [PMC free article] [PubMed] [Google Scholar]
- (10).Kim JC; Mirkin SM The Balancing Act of DNA Repeat Expansions. Curr. Opin. Genet. Dev 2013, 23, 280–288. [DOI] [PMC free article] [PubMed] [Google Scholar]
- (11).Cleary JP; Walsh DM; Hofmeister JJ; Shankar GM; Kuskowski MA; Selkoe DJ; Ashe KH Natural Oligomers of the Amyloid-β Protein Specifically Disrupt Cognitive Function. Nat. Neurosci 2005, 8, 79–84. [DOI] [PubMed] [Google Scholar]
- (12).Dion V; Wilson JH Instability and Chromatin Structure of Expanded Trinucleotide Repeats. Trends Genet. 2009, 25, 288–297. [DOI] [PMC free article] [PubMed] [Google Scholar]
- (13).McMurray CT Hijacking of the Mismatch Repair System to Cause CAG Expansion and Cell Death in Neurodegenerative Disease. DNA Repair 2008, 7, 1121–1134. [DOI] [PMC free article] [PubMed] [Google Scholar]
- (14).Lin Y; Wilson JH Transcription-Induced DNA Toxicity at Trinucleotide Repeats: Double Bubble is Trouble. Cell Cycle 2011, 10, 611–618. [DOI] [PMC free article] [PubMed] [Google Scholar]
- (15).Ranum LP; Cooper TA RNA-Mediated Neuromuscular Disorders. Annu. Rev. Neurosci 2006, 29, 259–277. [DOI] [PubMed] [Google Scholar]
- (16).Li LB; Bonini NM Roles of Trinucleotide-Repeat RNA in Neurological Disease and Degeneration. Trends Neurosci. 2010, 33, 292–298. [DOI] [PMC free article] [PubMed] [Google Scholar]
- (17).Jin P; Zarnescu DC; Zhang F; Pearson CE; Lucchesi JC; Moses K; Warren ST RNA-Mediated Neurodegeneration Caused by the Fragile X Premutation rCGG Repeats in Drosophila. Neuron 2003, 39, 739–747. [DOI] [PubMed] [Google Scholar]
- (18).Jiang H; Mankodi A; Swanson MS; Moxley RT; Thornton CA Myotonic Dystrophy Type 1 is Associated with Nuclear Foci of Mutant RNA, Sequestration of Muscleblind Proteins and Deregulated Alternative Splicing in Neurons. Hum. Mol. Genet 2004, 13, 3079–3088. [DOI] [PubMed] [Google Scholar]
- (19).Daughters RS; Tuttle DL; Gao W; Ikeda Y; Moseley ML; Ebner TJ; Swanson MS; Ranum LP RNA Gain-of-Function in Spinocerebellar Ataxia Type 8. PLoS Genet. 2009, 5, e1000600. [DOI] [PMC free article] [PubMed] [Google Scholar]
- (20).Krzyzosiak WJ; Sobczak K; Wojciechowska M; Fiszer A; Mykowska A; Kozlowski P Triplet Repeat RNA Structure and Its Role as Pathogenic Agent and Therapeutic Target. Nucleic Acids Res. 2012, 40, 11–26. [DOI] [PMC free article] [PubMed] [Google Scholar]
- (21).Campuzano V; Montermini L; Lutz Y; Cova L; Hindelang C; Jiralerspong S; Trottier Y; Kish SJ; Faucheux B; Trouillas P; et al. Frataxin is Reduced in Friedreich Ataxia Patients and is Associated with Mitochondrial Membranes. Hum. Mol. Genet 1997, 6, 1771–1780. [DOI] [PubMed] [Google Scholar]
- (22).Kim E; Napierala M; Dent SY Hyperexpansion of GAA Repeats Affects Post-initiation Steps of FXN Transcription in Friedreich’s Ataxia. Nucleic Acids Res. 2011, 39, 8366–8377. [DOI] [PMC free article] [PubMed] [Google Scholar]
- (23).Punga T; Bühler M Long Intronic GAA Repeats Causing Friedreich Ataxia Impede Transcription Elongation. EMBO Mol. Med 2010, 2, 120–129. [DOI] [PMC free article] [PubMed] [Google Scholar]
- (24).O’Rourke JR; Swanson MS Mechanisms of RNA-Mediated Disease. J. Biol. Chem 2009, 284, 7419–7423. [DOI] [PMC free article] [PubMed] [Google Scholar]
- (25).Todd PK; Paulson HL RNA-Mediated Neurodegeneration in Repeat Expansion Disorders. Ann. Neurol 2010, 67, 291–300. [DOI] [PMC free article] [PubMed] [Google Scholar]
- (26).Echeverria GV; Cooper TA RNA-binding Proteins in Microsatellite Expansion Disorders: Mediators of RNA Toxicity. Brain Res. 2012, 1462, 100–111. [DOI] [PMC free article] [PubMed] [Google Scholar]
- (27).Wojciechowska M; Krzyzosiak WJ Cellular Toxicity of Expanded RNA Repeats: Focus on RNA Foci. Hum. Mol. Genet 2011, 20, 3811–3821. [DOI] [PMC free article] [PubMed] [Google Scholar]
- (28).Zu T; Gibbens B; Doty NS; Gomes-Pereira M; Huguet A; Stone MD; Margolis J; Peterson M; Markowski TW; Ingram MA; et al. Non-ATG-Initiated Translation Directed by Microsatellite Expansions. Proc. Natl. Acad. Sci. U. S. A 2011, 108, 260–265. [DOI] [PMC free article] [PubMed] [Google Scholar]
- (29).Fu Y-H; Kuhl DP; Pizzuti A; Pieretti M; Sutcliffe JS; Richards S; Verkert AJ; Holden JJ; Raymond GF Jr; Warren ST; et al. Variation of the CGG Repeat at the Fragile X Site Results in Genetic Instability: Resolution of the Sherman Paradox. Cell 1991, 67, 1047–1058. [DOI] [PubMed] [Google Scholar]
- (30).Zhong N; Ju W; Pietrofesa J; Wang D; Dobkin C; Brown WT Fragile X “Gray Zone” Alleles: AGG Patterns, Expansion Risks, and Associated Haplotypes. Am. J. Med. Genet 1996, 64, 261–265. [DOI] [PubMed] [Google Scholar]
- (31).Dombrowski C; Lévesque S; Morel ML; Rouillard P; Morgan K; Rousseau F Premutation and Intermediate-size FMR1 Alleles in 10572 Males From the General Population: Loss of an AGG Interruption is a Late Event in the Generation of Fragile X Syndrome Alleles. Hum. Mol. Genet 2002, 11, 371–378. [DOI] [PubMed] [Google Scholar]
- (32).Hagerman RJ; Leehey M; Heinrichs W; Tassone F; Wilson R; Hills J; Grigsby J; Gage B; Hagerman PJ Intention Tremor, Parkinsonism, and Generalized Brain Atrophy in Male Carriers of Fragile X. Neurology 2001, 57, 127–130. [DOI] [PubMed] [Google Scholar]
- (33).Sherman SL Premature Ovarian Failure Among Fragile X Premutation Carriers: Parent-of-Origin Effect? Am. J. Hum. Genet 2000, 67, 11–13. [DOI] [PMC free article] [PubMed] [Google Scholar]
- (34).Glass IA X Linked Mental Retardation. J. Med. Genet 1991, 28, 361–371. [DOI] [PMC free article] [PubMed] [Google Scholar]
- (35).Gu Y; Shen Y; Gibbs RA; Nelson DL Identification of FMR2, A Novel Gene Associated with the FRAXE CCG Repeat and CpG Island. Nat. Genet 1996, 13, 109–113. [DOI] [PubMed] [Google Scholar]
- (36).Braida C; Stefanatos RK; Adam B; Mahajan N; Smeets HJ; Niel F; Goizet C; Arveiler B; Koenig M; Lagier-Tourenne C; et al. Variant CCG and GGC Repeats within the CTG Expansion Dramatically Modify Mutational Dynamics and Likely Contribute Toward Unusual Symptoms in Some Myotonic Dystrophy Type 1 Patients. Hum. Mol. Genet 2010, 19, 1399–1412. [DOI] [PubMed] [Google Scholar]
- (37).McMurray CT DNA Secondary Structure: A Common and Causative Factor for Expansion in Human Disease. Proc. Natl. Acad. Sci. U. S. A 1999, 96, 1823–1825. [DOI] [PMC free article] [PubMed] [Google Scholar]
- (38).Mitas M Trinucleotide Repeats Associated with Human Disease. Nucleic Acids Res. 1997, 25, 2245–2253. [DOI] [PMC free article] [PubMed] [Google Scholar]
- (39).Kiliszek A; Kierzek R; Krzyzosiak WJ; Rypniewski W Crystal Structures of CGG RNA Repeats with Implications for Fragile X-associated Tremor Ataxia Syndrome. Nucleic Acids Res. 2011, 39, 7308–7315. [DOI] [PMC free article] [PubMed] [Google Scholar]
- (40).Kumar A; Fang P; Park H; Guo M; Nettles KW; Disney MD A Crystal Structure of a Model of the Repeating r(CGG) Transcript Found in Fragile X Syndrome. ChemBioChem 2011, 12, 2140–2142. [DOI] [PMC free article] [PubMed] [Google Scholar]
- (41).Kiliszek A; Kierzek R; Krzyzosiak WJ; Rypniewski W Crystallographic Characterization of CCG Repeats. Nucleic Acids Res. 2012, 40, 8155–8162. [DOI] [PMC free article] [PubMed] [Google Scholar]
- (42).Gao X; Huang X; Smith GK; Zheng M; Liu H New Antiparallel Duplex Motif of DNA CCG Repeats That Is Stabilized by Extrahelical Basis Symmetrically Located in the Minor Groove. J. Am. Chem. Soc 1995, 117, 8883–8884. [Google Scholar]
- (43).Zheng M; Huang X; Smith GK; Yang X; Gao X Genetically Unstable CXG Repeats are Structurally Dynamic and Have a High Propensity for Folding. An NMR and UV Spectroscopic Study. J. Mol. Biol 1996, 264, 323–336. [DOI] [PubMed] [Google Scholar]
- (44).Pan F; Zhang Y; Man VH; Roland C; Sagui C E-motif Formed by Extrahelical Cytosine Bases in DNA Homoduplexes of Trinucleotide and Hexanucleotide Repeats. Nucleic Acids Res. 2018, 46, 942–955. [DOI] [PMC free article] [PubMed] [Google Scholar]
- (45).Darlow JM; Leach DR Secondary Structures in d(CGG) and d(CCG) Repeat Tracts. J. Mol. Biol 1998, 275, 3–16. [DOI] [PubMed] [Google Scholar]
- (46).Darlow JM; Leach DR Evidence for Two Preferred Hairpin Folding Patterns in d(CGG).d(CCG) Repeat Tracts in Vivo. J. Mol. Biol 1998, 275, 17–23. [DOI] [PubMed] [Google Scholar]
- (47).Svozil D; Hobza P; Šponer, J. Comparison of Intrinsic Stacking Energies of Ten Unique Dinucleotide Steps in A-RNA and B-DNA Duplexes. Can We Determine Correct Order of Stability by Quantum-Chemical Calculations? J. Phys. Chem. B 2010, 114, 1191–1203. [DOI] [PubMed] [Google Scholar]
- (48).Pan F; Man VH; Roland C; Sagui C Structure and Dynamics of DNA and RNA Double Helices of CAG and GAC Trinucleotide Repeats. Biophys. J 2017, 113, 19–36. [DOI] [PMC free article] [PubMed] [Google Scholar]
- (49).Zhang Y; Roland C; Sagui C Structure and Dynamics of DNA and RNA Double Helices Obtained From the GGGGCC and CCCCGG Hexanucleotide Repeats That Are the Hallmark of C9FTD/ALS Diseases. ACS Chem. Neurosci. 2017, 8, 578–591. [DOI] [PMC free article] [PubMed] [Google Scholar]
- (50).Zoghbi HY; Orr HT Glutamine Repeats and Neurodegeneration. Annu. Rev. Neurosci 2000, 23, 217–247. [DOI] [PubMed] [Google Scholar]
- (51).Délot E; King LM; Briggs MD; Wilcox WR; Cohn DH Trinucleotide Expansion Mutations in the Cartilage Oligomeric Matrix Protein (COMP) Gene. Hum. Mol. Genet 1999, 8, 123–128. [DOI] [PubMed] [Google Scholar]
- (52).DeJesus-Hernandez M; Machkenzie IR; Boeve BF; Boxer AL; Baker M; Rutherford NJ; Nicholson AM; Finch NA; Flynn H; Adamson J; et al. Expanded GGGGCC Hexanucleotide Repeat in Noncoding Region of C9ORF72 Causes Chromosome 9p-Linked FTD and ALS. Neuron 2011, 72, 245–256. [DOI] [PMC free article] [PubMed] [Google Scholar]
- (53).Renton AE; Majounie E; Waite A; Simón-Sánchez J; Rollinson S; Gibbs JR; Schymick JC; Laaksovirta H; van Swieten JC; Myllykangas L; et al. Hexanucleotide Repeat Expansion in C9ORF72 Is the Cause of Chromosome 9p21-Linked ALS-FTD. Neuron 2011, 72, 257–268. [DOI] [PMC free article] [PubMed] [Google Scholar]
- (54).Zhang Y; Man VH; Roland C; Sagui C Amyloid Properties of Asparagine and Glutamine in Prion-like Proteins. ACS Chem. Neurosci 2016, 7, 576–587. [DOI] [PubMed] [Google Scholar]
- (55).Man VH; Pan F; Sagui C; Roland C Comparative Melting and Healing of B-DNA and Z-DNA by an Infrared Laser Pulse. J. Chem. Phys 2016, 144, 145101. [DOI] [PubMed] [Google Scholar]
- (56).Case DA; Betz RM; Cerutti DS; Cheatham TE III; Darden TA; Duke RE; Giese TJ; Gohlke H; Goetz AW; Homeyer N; et al. AMBER 16; University of California, San Francisco: San Francisco, CA, 2016. [Google Scholar]
- (57).Ivani I; Dans PD; Noy A; Pérez A; Faustino I; Hopsital A; Walther J; Andrio P; Goñi R; Balaceanu A; et al. Parmbsc1: A Refined Force Field for DNA Simulations. Nat. Methods 2016, 13, 55–58. [DOI] [PMC free article] [PubMed] [Google Scholar]
- (58).Pérez A; March’an I; Svozil D; Sponer J; Cheatham TE III; Laughton CA; Orozco M Refinement of the AMBER Force Field for Nucleic Acids: Improving the Description of α/γ Conformers. Biophys. J 2007, 92, 3817–3829. [DOI] [PMC free article] [PubMed] [Google Scholar]
- (59).Zgarbová M; Otyepka M; Šponer J; Mládek A; Banáš P; Cheatham TE III; Jurečka P Refinement of the Cornell et al.ˇ Nucleic Acids Force Field Based on Reference Quantum Chemical Calculations of Glycosidic Torsion Profiles. J. Chem. Theory Comput 2011, 7, 2886–2902. [DOI] [PMC free article] [PubMed] [Google Scholar]
- (60).Zgarbová M; Šponer J; Otyepka M; Cheatham TE III; Galindo-Murillo R; Jurecka P Refinement of the Sugar-Phosphatě Backbone Torsion Beta for AMBER Force Fields Improves the Description of Z- and B-DNA. J. Chem. Theory Comput 2015, 11, 5723–5736. [DOI] [PubMed] [Google Scholar]
- (61).Jorgensen WL; Chandrasekhar J; Madura JD; Impey RW; Klein ML Comparison of Simple Potential Functions for Simulating Liquid Water. J. Chem. Phys 1983, 79, 926–935. [Google Scholar]
- (62).Joung IS; Cheatham TE III Determination of Alkali and Halide Monovalent Ion Parameters for Use in Explicitly Solvated Biomolecular Simulations. J. Phys. Chem. B 2008, 112, 9020–9041. [DOI] [PMC free article] [PubMed] [Google Scholar]
- (63).Essmann U; Perera L; Berkowitz ML; Darden T; Lee H; Pedersen LG A Smooth Particle Mesh Ewald Method. J. Chem. Phys 1995, 103, 8577–8593. [Google Scholar]
- (64).Babin V; Roland C; Sagui C Adaptively Biased Molecular Dynamics for Free Energy Calculations. J. Chem. Phys 2008, 128, 134101. [DOI] [PubMed] [Google Scholar]
- (65).Babin V; Karpusenka V; Moradi M; Roland C; Sagui C Adaptively Biased Molecular Dynamics: An Umbrella Sampling Method with a Time-Dependent Potential. Int. J. Quantum Chem 2009, 109, 3666–3678. [Google Scholar]
- (66).Raiteri P; Laio A; Gervasio FL; Micheletti C; Parrinello M Efficient Reconstruction of Complex Free Energy Landscapes by Multiple Walkers Metadynamics. J. Phys. Chem. B 2006, 110, 3533–3539. [DOI] [PubMed] [Google Scholar]
- (67).Minoukadeh K; Chipot C; Lelièvre T Potential of Mean Force Calculations: A Multiple-Walker Adaptive Biasing Force Approach. J. Chem. Theory Comput 2010, 6, 1008–1017. [Google Scholar]
- (68).Sugita Y; Okamoto Y Replica-Exchange Molecular Dynamics Method for Protein Folding. Chem. Phys. Lett 1999, 314, 141–151. [Google Scholar]
- (69).Barducci A; Bussi G; Parrinello M Well-Tempered Metadynamics: A Smoothly Converging and Tunable Free Energy Method. Phys. Rev. Lett 2008, 100, 020603. [DOI] [PubMed] [Google Scholar]
- (70).Pan F; Roland C; Sagui C Ion Distribution Around Left- and Right-handed DNA and RNA Duplexes: A Comparative Study. Nucleic Acids Res. 2014, 42, 13981–13996. [DOI] [PMC free article] [PubMed] [Google Scholar]
- (71).Amadei A; Linssen AB; Berendsen HJ Essential Dynamics of Proteins. Proteins: Struct., Funct., Genet 1993, 17, 412–425. [DOI] [PubMed] [Google Scholar]
- (72).Yu A; Barren MD; Romero RM; Christy M; Gold B; Dai J; Gray DM; Haworth IS; Mitas M At Physiological pH, d(CCG)15 Forms a Hairpin Containing Protonated Cytosines and a Distorted Helix. Biochemistry 1997, 36, 3687–3699. [DOI] [PubMed] [Google Scholar]
- (73).Mitas M; Yu A; Dill J; Haworth I The Trinucleotide Repeat Sequence d(CGG)15 Forms a Heat-Stable Hairpin Containing G(syn).G(anti) Base Pairs. Biochemistry 1995, 34, 12803–12811. [DOI] [PubMed] [Google Scholar]
- (74).Santhana Mariappan SV; Catasti P; Chen X; Ratliff R; Moyzis RK; Bradbury EM; Gupta G Solution Structures of the Individual Single Strands of the Fragile X DNA Triplets (GCC)n. (GGC)n. Nucleic Acids Res. 1996, 24, 784–792. [DOI] [PMC free article] [PubMed] [Google Scholar]
Associated Data
This section collects any data citations, data availability statements, or supplementary materials included in this article.