

Abstract
Methods for optical measurement of voltage dynamics in living cells are attractive because they provide spatial resolution surpassing traditional electrode-based measurements and temporal resolution exceeding that of widely-used Ca2+-imaging. Chemically-synthesized voltage-sensitive dyes that use photoinduced electron transfer (PeT) as a voltage-sensing trigger offer high voltage sensitivity and fast response kinetics, but targeting chemical indicators to specific cells remains an outstanding challenge. Here, we present a new family of readily functionalizable, fluorescein-based voltage sensitive fluorescent dyes (sarcosine-VoltageFluors) that can be covalently attached to a genetically-encoded cell surface receptor to achieve voltage imaging from genetically defined neurons. We synthesized four new VoltageFluor derivatives that possess carboxylic acid functionality for simple conjugation to flexible tethers. The best of this new group of dyes was conjugated via a polyethyleneglycol (PEG) linker to a small peptide (SpyTag, 13 amino acids) that directs binding and formation of a covalent bond with its binding partner, SpyCatcher (15 kDa). The new VoltageSpy dyes effectively label cells expressing cell-surface SpyCatcher, display good voltage sensitivity, and maintain fast response kinetics. In cultured neurons, VoltageSpy dyes enable robust, single-trial optical detection of action potentials at neuronal soma with sensitivity exceeding genetically encoded voltage indicators. Importantly, genetic targeting of chemically synthesized dyes enables VoltageSpy to report on action potentials in axons and dendrites in single trials, tens to hundreds of micrometers away from the cell body. Genetic targeting of synthetic voltage indicators with VoltageSpy enables voltage imaging with low nanomolar dye concentration and offers a promising method for allying the speed and sensitivity of synthetic indicators with the enhanced cellular resolution of genetically encoded probes.
Graphical Abstract

Introduction
Cellular membrane potential, or voltage, is a key physiological parameter critically important to all aspects of life, but especially to excitable cells, like neurons. Optical methods to image voltage promise to relieve our dependence on classic electrode-based methods, which are highly invasive, often limited to single cells, and extremely low-throughput. Voltage-sensitive fluorescent indicators - either chemically synthesized or genetically encoded - offer an attractive solution for the direct observation of voltage dynamics in a minimally invasive, highly parallel, and high throughput manner.1–2
Pioneering work showed that many commercially available dyes possess voltage-sensitive optical properties.3–5 Targeted synthesis of voltage-sensitive compounds yielded dyes with voltage sensitivity arising from an electrochromic interaction between the fluorophore and the electric field across the membrane, or Stark-effect.6–7 These electrochromic dyes offer incredibly fast responses, but at the expense of relatively small shifts in their excitation/emission spectra. More recent versions display improved sensitivity but require torturous chemical syntheses.8–9 Other chemical indicators include oxonol dyes which partition on the outer or inner leaflet of the plasma membrane in a voltage-dependent fashion. These dyes can give larger fractional changes in fluorescence, but often-times do not possess the required response kinetics to enable resolution of action potentials.10–12 To address challenges associated with speed and sensitivity of chemical dyes, we were inspired by elegant theoretical models13 and early experimental examples,14 to explore photoinduced electron transfer (PeT) through molecular wires as a modality for voltage sensing. These voltage-sensitive fluorophores, or VoltageFluors, developed in our lab are amenable to voltage sensing across a wide range of colors, afford high voltage sensitivities (60% ΔF/F per 100 mV, in HEK cells), and maintain response times capable of clearly resolving action potential spikes in mammalian neurons.15–19
Completely genetically encoded approaches to voltage imaging offer a complementary method for voltage imaging.20–21 Genetically encoded platforms for voltage imaging cluster into three groups: fluorescent proteins coupled to voltage sensing domains from ion channels and/or enzymes,22–27 opsin-based indicators,28–32 or hybrid opsin-fluorescent protein fusions.33–35 Improved trafficking36–37 of fluorescent protein-based indicators enabled considerable improvement over early, pioneering protein-based voltage indicators.22–24 Yet despite progress in recent years, significant challenges remain regarding proper trafficking of heterologous proteins to the cell membrane, response speed, low brightness, added capacitance, and/or light induced ion pumping.
Hybrid chemical and genetic approaches to voltage imaging combine the speed and sensitivity of chemical indicators with the cell-type specificity of genetic model systems. Previous hybrid chemical-genetic methods for voltage sensing include hVOS indicators, in which an exogenously added, lipophilic anion partitions between inner and outer leaflets of the membrane in a voltage-dependent fashion to quench fluorescent protein fluorescence;38–42 enzymatic localization in which genetically encoded phosphatases on the cell surface improve the membrane accumulation of a modified electrochromic dye;43–45 electrochromic-FRET (eFRET), in which Cu-mediated click chemistry is employed to selectively attach a fluorophore to a picolyl azide incorporated on a voltage-sensitive opsin via an engineered lipoic acid ligase;46 and a fluorogenic approach from our lab in which a genetically encoded esterase unmasks a caged VF dye in defined neurons (VoltageFluor activated by esterase Expression, VF-EX).47 These approaches suffer variously from the use of capacitance-adding anions like dipicrylamine; low selectivity in cell uptake and difficult chemical syntheses; toxicity associated with Cu-mediated catalysis on neuronal surfaces and the requirement for expanded genetic codes; and/or low contrast between cells which express the targeting enzyme and the wild-type cells.
We hypothesized that we could address some of the short comings of our VF -EX targeting approach - specifically the low contrast between expressing and non-expressing cells - by covalently tethering VF dyes to a cell of interest (Scheme 1). A number of excellent approaches exist for the covalent labeling of modified enzymes.48–52 All rely on a modified enzyme that will label itself with a small, chemical ligand. We envisioned that one of these self-labeling enzymes could be targeted to the cell surface of a neuron of interest to direct covalent capture of a VF dye modified with the cognate ligand. We were specifically attracted to the SpyTag/SpyCatcher system52 that employs an engineered cell adhesion molecule from Streptococcus pyogenes. The SpyTag fragment is a small peptide (13 amino acid residues) that interacts with the SpyCatcher enzyme to form an isopeptide bond. We hoped that by linking the SpyTag peptide to a VF dye via a flexible polyethyleneglycol (PEG) linker, we could direct selective localization of VF dye only to those cells which express SpyCatcher on the cell surface. We additionally reasoned that use of the SpyTag peptide on VF would limit the amount of VF dye that passed through cell membranes, thus improving the membrane localization of the VF dye. Here, we show that SpyTag/SpyCatcher can be applied to a new VF scaffold to achieve fast and sensitive voltage imaging with only nanomolar concentrations of dye and in genetically-defined neurons.
Scheme 1.

Genetic targeting of VoltageFluor dyes using SpyTag/SpyCatcher methodology
Results
Synthesis of sarcosine VoltageFluor dyes
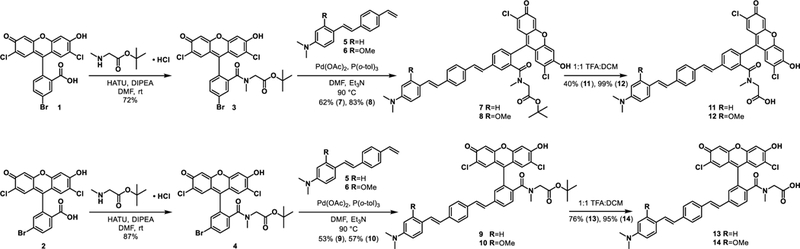
The structure of the prototypical green VoltageFluor VF2.1.Cl (Scheme 1) does not lend itself to further synthetic modification. We recently reported a family of rhodamine-based voltage reporters (RhoVRs) which have a sarcosine amide at the 3 position of the meso aromatic ring, rather than an aryl sulfonate as in VF2.1.Cl.18, 53 The resultant free carboxylic acid offers a convenient handle for synthetic modification, maintains cellular impermeability, and is largely decoupled from the conjugated system of the phenylenevinylene molecular wire, making it a logical site for installing a targeting moiety (Scheme 1). The brightness and voltage-sensitivity of VoltageFluor dyes are sensitive to the identity of the aniline electron donor54 and orientation of the molecular wire.17, 55 To find an optimized green VoltageFluor which could serve as a starting point for our targeted voltage indicators we synthesized and characterized a new series of sarcosine-containing VoltageFluor dyes (11–14) (Scheme 2). Starting from isomerically pure 5- and 6-bromo-2’,7’-dichlorofluorescein (1, 2),18, 56 HATU-mediated amide couplings yielded tert-butyl ester protected intermediates 3 and 4 in 72 and 87% yield, respectively. Heck couplings with molecular wire fragments 5 or 618 gave four tert-butyl ester protected VF-sarcosine compounds 7-10 in yields ranging from 53 to 83%. Removal of the tert-butyl ester with TFA gave sarcosinyl-VoltageFluors 11-14 in moderate to good yield (40%−99%) after purification by preparative TLC. We confirmed sarcosinyl-VoltageFluors and their synthetic precursors form stable rotamer pairs using VT-NMR (SI Spectra). All four sarcosine VF dyes (Table 1) displayed similar optical properties, with absorption and emission maxima centered at 525 and 540 nm respectively. Quantum yields ranged from 0.008 (12) to 0.055 (14), in line with typical values for fluorescein-type VoltageFluors.18–19
Scheme 2.
Synthesis of sarcosine VoltageFluors
Table 1. Properties of sarcosine VF dyes, PEGylated intermediates and VoltageSpy indicators.
| dye | isomer | R | PEG units | λmax (abs)[a] | λmax (em)[a] | Φ[a] | cellular bright- ness[b] |
Contrast [b][c] |
%ΔF/F [b][d] |
effective sensitivity [e] |
|---|---|---|---|---|---|---|---|---|---|---|
| 11 | 5 | -H | --- | 525 | 541 | 2.7 | 10 | --- | 27.2 ±0.2 |
7 |
| 12 | 5 | -OMe | --- | 525 | 540 | 5.5 | 1 | --- | 12.2 ±0.4 |
1 |
| 13 | 6 | -H | --- | 525 | 540 | 3.9 | 40 | --- | 22.7 ±0.1 |
12 |
| 14 | 6 | -OMe | --- | 524 | 540 | 0.8 | 6 | --- | 29.3 ±0.8 |
6 |
| 15 | 6 | -H | 3 | 526 | 545 | 5.8 | --- | --- | --- | --- |
| 16 | 6 | -H | 11 | 526 | 544 | 10.9 | --- | --- | 3.2 ±0.1 | --- |
| 17 | 6 | -H | 23 | 526 | 540 | 9.8 | --- | --- | --- | --- |
| 18 | 6 | -H | 35 | 526 | 540 | 11.2 | --- | --- | --- | --- |
| 19 | 6 | -H | 3 | 527 | 544 | 10.9 | --- | 5.6 ±3.8 |
12.5 ±0.2 [f] |
--- |
| 20 | 6 | -H | 11 | 526 | 544 | 7.9 | --- | 12.6 ±8.6 |
13.1 ±0.2 [f][g] |
--- |
| 21 | 6 | -H | 23 | 526 | 546 | 13.9 | --- | 17.8 ±9.7 |
11.6 ±0.2 [f] |
--- |
| 22 | 6 | -H | 35 | 526 | 546 | 8.7 | --- | 34.6 ±29.3 |
12.7 ±0.1 [f] |
--- |
Acquired in PBS, pH 7.4 with 0.1% Triton X-100.
measured in HEK cells.
ratio of fluorescence intensity of SpyCatcher expressing cells and median fluorescence intensity of untransfected cells loaded with 5 nM dye. Data is mean ±SD for 49 to 77 cells.
Per 100 mV step, optically sampled at 500 Hz.
Relative product of square root of cellular brightness and ΔF/F.
Values are measured in HEK cells expressing cell-surface SpyCatcher.
In cells that do not express SpyCatcher, voltage sensitivity is 9.1 ±0.1%.
Cellular characterization of sarcosine VoltageFluors
All the newly synthesized sarcosine VoltageFluors clearly labeled the plasma membranes of HEK cells (Fig. 1, Fig. S1) with variable fluorescence intensity. The brightest VF dye was 13, displaying cellular fluorescence 40-fold greater than the dimmest indicator, 12 (Table 1, Fig. S1). The voltage sensitivity of VoltageFluor-sarcosine probes was determined by dual optical and electrophysiology in HEK cells (Fig. 1). We delivered voltage steps from +100 to −100 mV volts in 20 mV increments to HEK293T in whole-cell voltage clamp while recording concomitant changes in fluorescence intensity over the cell body. Sarcosine VF 14 displayed the greatest voltage sensitivity, at 29% ΔF/F per 100 mV. The least sensitive was sarcosine VF 12, at 12% ΔF/F. Because sarcosine VF 13 possessed high cellular brightness, good voltage sensitivity, and superior signal to noise ratios (SNR) for detecting depolarizing voltage steps in HEK cells (Table 1, Fig. 1, Fig. S1), we thought it a promising candidate for covalent attachment to cell surfaces via SpyTag/SpyCatcher interaction.
Figure 1.

Characterization of sarcosine VoltageFluor dyes. a) Widefield, fluorescence microscopy image of HEK cells loaded with 1 μM sarcosine probe 13. Scale bar is 10 μM. b) Absorbance (black line) and emission (green line) spectra of 13. c) Representative plot of fractional change in fluorescence (ΔF/F) vs time from a series of voltage steps (+100 to −100 mV from a holding potential of −60 mV in 20 mV increments) recorded from a HEK cell stained with 1 μM 13 in whole-cell voltage clamp mode. d) Plot of fractional change in fluorescence vs membrane potential from voltage-clamped HEK cells stained with 1 μM 13. Data are mean ±SEM from six cells.
Design and synthesis of VoltageSpy Indicators
We envisioned that sarcosine VF 13 could be linked to the SpyTag peptide via a flexible PEG linker. The linker should be long enough to allow incorporation of the VF dye into the cell membrane. Because proper orientation of VF-type dyes in the cell membrane is critical for optimal voltage sensitivity,17 the linker should ideally allow the dye to freely orient in the membrane. To assess this, we coupled sarcosine VF 13 to PEG linkers of lengths ranging from 14 to 128 Å (PEGX; X = 3, 11, 23, or 35, Scheme 3). Amide coupling of sarcosine VF 13 with heterobifunctional PEG linkers terminating with amino and azido groups provided VF-PEGX-N3 intermediates 15–18 in 59 to 99% yields. PEGylation of 13 resulted in a small, linker-length dependant red shift in the emission spectra, as well as an increase in quantum yield (Table 1, Fig. S2). Copper catalyzed azidealkyne cyclization of compounds 15–18 with SpyTagalkyne, in which the native SpyTag 13-mer peptide (AHIVMVDAYKPTK) is modified to contain propargyl glycine (Pra) on the C-terminus, resulting in the 14-residue peptide, AHIVMVDAYKPTK-Pra (SpyTag-Pra), gave VF-PEGX-SpyTags 19–22 in 3 to 22% yield after purification by reversed-phase, semi-preparative HPLC (Scheme 3).
Scheme 3.

Synthesis of VoltageSpy indicators.
Evaluation of VoltageSpy dyes in HEK cells
In order to evaluate the performance of the new VF-PEGX-SpyTags (VoltageSpy dyes), we expressed SpyCatcher on the surface of HEK cells. The SpyCatcher protein, originally engineered from the second immunoglobulin-like collagen adhesion domain (CnaB2) from the fibronectin binding protein FbaB of Streptococcus pyogenes, forms a stable isopeptide bond with SpyTag.52 We hypothesized that the new VF-PEGx-SpyTag dyes would be dependent on the presence of cell-surface SpyCatcher for effective membrane staining. We fused the original SpyCatcher protein to an N-terminal PAT3-derived signal peptide57 for efficient export from the cell and appended a C-terminal glycophosphatidyl inositol (GPI) anchor sequence derived from decay accelerating factor (DAF) (Fig. S3).
SpyCatcher expression in HEK cells was confirmed by immunofluorescence directed against the hemagglutinin tag (HA) that was included at the N-terminus of the SpyCatcher protein (Fig. S4a-d). To readily identify living cells expressing SpyCatcher, we included a nuclear-localized mCherry on the same gene, linked through the self-cleaving T2A linker to provide stoichiometric expression of nuclear mCherry alongside cell-surface SpyCatcher (Fig. 2, Fig. S3). VF-PEGX-SpyTag conjugates 19–22 all show membrane labeling, with high selectivity for SpyCatcher expressing HEK293T cells over neighboring, non-expressing cells (Fig. 2, Fig. S5). SpyCatcher permits the use of other signal peptides and transmembrane domains; plasmids employing a signal peptide from immunoglobulin k (IgK) and platelet-derived growth factor receptor (PDGFR) also showed good surface-expression of SpyCatcher in HEK293T cells (Fig. S4e-k). The inclusion of the SpyTag peptide is essential for membrane localization: azido-PEG precursors 15–18 all show some degree of cellular internalization (Fig. S6). This internalization lowers the nominal voltage sensitivity of the dyes - VF-PEGh-N3 shows only a modest 3% AF/F per 100 mV in HEK cells (Fig. S6e).
Figure 2.
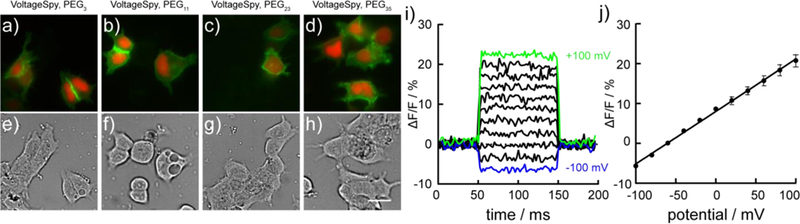
Evaluation of VoltageSpy dyes in HEK cells. a-h) Widefield fluorescence (a-d) and DIC (e-h) microscopy images of HEK cells co-expressing SpyCatcher and nuclear mCherry (red signal) labeled with 5 nM VoltageSpy (green signal) dyes 19 (PEG3, a, e), 20 (PEG11, b, f), 21 (PEG23, c, g) and 22 (PEG35, d, h). Scale bar is 20 μm. i) Representative plot of fractional change in fluorescence (ΔF/F) vs time from a series of voltage steps (+100 to −100 mV from a holding potential of −60 mV in 20 mV increments) recorded from a HEK cell labeled with 22 in whole-cell voltage clamp mode. j) Plot of fractional change in fluorescence vs membrane potential from voltage-clamped HEK cells labeled with 22. Data are mean ±SEM from five cells
SpyCatcher-mediated labeling of HEK cells
VoltageSpy labeling of live HEK293T cells provides good contrast between SpyCatcher-expressing and non-expressing cells (Fig. 2a-h, Fig. S5). At concentrations as low as 5 nM (two orders of magnitude lower than typical loading concentrations for untargeted voltage sensitive dyes), dyes of all PEG lengths gave mean contrast ratios ranging from 5.6 (± 3.8, S.D., n = 77, PEG3, VoltageSpy 19) to 35 (± 29, S.D., n = 50, PEG35, VoltageSpy 22). At a higher concentration of VoltageSpy, 25 nM, contrast ratios decreased, ranging from 3.9 (± 1.9, S.D., n = 40, PEG3, VoltageSpy 19) to 13 (± 8.8, S.D., n = 87, PEG35, VoltageSpy 22). At 100 nM VoltageSpy, contrast ratios decreased further to 3 (±1.9, S.D., n = 41, PEG11, VoltageSpy 20) and 7 (± 4.1, S.D., n = 38, PEG35, VoltageSpy 22). The decrease in contrast ratio is driven by increasing amounts of non-specific Volt-ageSpy labeling at higher dye concentrations. This non-specific labeling is worse for short PEG linkers (x = 3, 11, VoltageSpy 19 and 20) and is near negligible for the longer PEG linkers (x = 23, 35, VoltageSpy 21 and 22) (Fig. S5b). The fluorescence intensities of SpyCatcher-expressing cells do not substantially increase with addition of more VoltageSpy dye, indicating near-saturation of available SpyCatcher binding sites, even at 5 nM VoltageSpy treatment (Fig. S5a). The brighter regions that sometimes appear where two cell membranes touch (Fig. 2a,b) is a result of imaging from a larger volume of vertical membrane at an interface using widefield fluorescence microscopy. This is not an artifact of protein expression or labeling; we see a similar effect with the parent VoltageFluor (13, Fig. 1a).
VoltageSpy dependence on SpyCatcher
VoltageSpy labeling depends on the expression of cell surface SpyCatcher. Cellular VoltageSpy labeling could be blocked by preincubation of SpyCatcher-expressing cells with unlabeled SpyTag-peptide52 (Fig. S7). When VoltageSpy 20 (PEG11) was applied to SpyCatcher-expressing cells pre-treated with 10 μM SpyTag-Pra52, we observed a 62 % decrease in membrane-associated fluorescence (Fig. S7). The large excess of unlabeled SpyTag-Pra52 required to block nM concentrations of VoltageSpy suggests that the presence of a lipophilic molecular wire increases the labeling speed of VoltageSpy dyes. Partition of the molecular wire into the membrane may lead to a high local concentration of VoltageSpy at the cell surface, accelerating the SpyTag-SpyCatcher reaction and contributing to some of the background staining observed at higher VoltageSpy concentrations (Fig. S5). We find that SpyTag conjugated to a simple dichlorofluorescein (Fig. S8, DCF-PEG11-SpyTag, 24) applied at 100 nM gave only poor labeling of HEK cells, where Μm concentrations of 24 were required to achieve appreciable labeling of SpyCatcher-expressing cells (Fig. S8). However, in the absence of the lipophilic molecular wire, almost no off-target labeling was observed.
VoltageSpy labels extracellular membrane surfaces
The majority of the cellular fluorescence is associated with the extracellular face of the membrane. Treatment of Voltag-eSpy-labeled HEK cells (22, PEG35, 5 nM) with Trypan Blue (0.1%) to quench extracellularly-associated fluorescence58 results in a 79% decrease in fluorescence intensity (Fig. S9). In contrast, Trypan Blue treatment does not substantially decrease the fluorescence of a cytosolic fluorescent indicator, Oregon Green BAPTA (Fig. S9), establishing that the majority of VoltageSpy fluorescence is associated with the external face of the plasma membrane. In this regard, VoltageSpy circumvents a common problem observed with genetically encoded voltage indicators; the presence of a substantial intracellular pool of improperly-trafficked fluorophores which contribute a non-responsive background signal.36–37 Poor trafficking stymied the wide adoption of first-generation GEVIs,22–24, 36–37 and improvements to the trafficking and sub-cellular targeting of GEVIs continue to advance the usefulness of fluorescent GEVIs.32
VoltageSpy dyes are voltage-sensitive after labeling Spy-Catcher expressing cells (Fig. 2). VoltageSpy dyes 19-22 are all equally voltage sensitive (25 nM dye), with a response of 12% ΔF/F per 100 mV (Table 2, Fig. S10). We hypothesize that the small size of the SpyCatcher protein and the conformational flexibility of the C-terminus of SpyCatcher59 enables even a PEG3 linker (approximately 14 Å) to allow a VF dye to insert into the plasma membrane. Additionally, the final 3 amino acid residues of SpyTag project away from and do not form hydrogen bonds with SpyCatcher in the crystal structure,59 providing additional flexibility for a tethered VF to reach the membrane. In HEK cells that do not express SpyCatcher, higher concentrations (1 μM) of VoltageSpy 20 are needed to stain the membrane. VoltageSpy 20 is voltage-sensitive in non-expressing cells, at approximately 9% per 100 mV (Table 1, Fig. S10e). Because the voltage sensitivity of the VoltageSpy dyes (9 to 13%) are lower than sarconsine VF 13 (22%), we hypothesize that the replacement of the anionic carboxylate on 13 with the neutral amide in 15 – 18 results in a slightly different orientation in the membrane,17 decreasing voltage sensitivity. Conjugation to SpyCatcher may place additional constraints on the orientation of the VoltageFluor sensor.
VoltageSpy in Neurons
In neurons, VoltageSpy dyes recapitulate the selective staining observed in HEK293T cells. Using immunocytochemistry, we verified that the PAT3 signal sequence and the GPI sequence from DAF under control of the human synapsin promoter gave good cell surface expression of SpyCatcher in cultured rat hippocampal neurons (Fig. S11). A combination of live-cell imaging followed by fixation and immunocytochemistry confirm the high specificity of the VoltageSpy/SpyCatcher interaction in neurons (Fig. S11). Following live-cell staining with VoltageSpy 20 (PEGn), membrane-associated VoltageSpy fluorescence survived fixation (Fig. S11e,f) allowing us to establish good correlation between VoltageSpy localization and HA-epitope staining of SpyCatcher (Fig. S11g-j). Live-cell imaging in neurons stained with VoltageSpy dyes (PEGn, VoltageSpy 20, Fig. 3a-d; and PEG35, VoltageSpy 22, Fig. 3e-h) showed good selectivity for SpyCatcher-expressing neurons over non-expressing cells, with contrast ratios of approximately 5, across PEG lengths and concentrations (Fig. S12). The contrast in neurons varied widely, owing to differences in Spy-Catcher expression. The brightest neurons stained with VoltageSpy indicators possessed contrast ratios of approximately 25-fold over non-transfected cells, a 5-fold increase over contrast we achieved using fluorogenic VF dyes (~4-fold in neurons).47 We selected the brightest cells for subsequent imaging analysis.
Figure 3.

VoltageSpy dyes report on voltage dynamics in cultured hippocampal mammalian neurons. a-h) Widefield fluorescence and DIC microscopy images of neurons co-expressing SpyCatcher and nuclear mCherry labeled with VoltageSpy dyes 20 (a-d) and 22 (e-h). Scale bar is 40 μm. i) Representative ΔF/F traces of spontaneous activity recorded from SpyCatcher expressing neurons labeled with 22. Traces are ΔF/F from regions of interest at the cell bodies of neurons after background offset and bleach correction. Images were acquired at 500 Hz and represent single-trial acquisitions. Fluorescence (j, merged VoltageSpy and mCherry signals) and DIC (k) microscopy images of a VoltageSpy 22 labeled neuron in whole-cell current clamp mode. Scale bar is 20 μm. l) Overlaid optical and electrophysiology signals from a single action potential in a current-clamped neuron. Optical trace was acquired at 1 kHz.
Functional imaging with VoltageSpy in neurons
VoltageSpy dyes clearly report on action potentials from neurons expressing SpyCatcher. Under low-light illumination conditions (8 mW/mm2) we successfully recorded spontaneous activity in cultured neurons with good signal to noise (Fig. 3i). Both VoltageSpy 20 (PEGn) and VoltageSpy 22 (PEG35) readily recorded action potential spikes, with sensitivities of 11.6 ±1.3% and 11.1 ±1.4% ΔF/F, respectively (Fig. 3i, values are for n = 15 neurons and represent mean ± standard deviation, recorded at 500 Hz). The selectivity of targeting, lack of linker-length dependence on voltage sensitivity, and ΔF/F values in neurons match well with VoltageSpy performance in HEK cells. Dual optical and electrophysiological recordings of Volt-ageSpy 22 (PEG35) reveal that targeted indicators faithfully report underlying action potential dynamics with no lag time (Fig. 3j-l). Additionally, we established that the presence of either SpyCatcher alone or SpyCatcher + VoltageSpy did not alter neuronal membrane properties; we saw no difference in membrane capacitance, resting membrane potential, or action potential kinetics (Fig. S14).
VoltageSpy 22 (PEG35) performs well in neurons, compared to other genetically encoded voltage indicators. VoltageSpy dyes possessed excellent sensitivity, detecting evoked action potential with 9.7 ± 1.5% ΔF/F, compared to −2.7 ± 0.6% for ASAP2f,60 a fluorescent protein-based indicator, and −3.4 ± 0.9% for Ace2N-mNeon,61 an electrochromic FRET-based indicator (Fig. 4) when all three indicators were imaged under identical conditions. Both ASAP2f and Ace2N-mNeon displayed negative-going responses to membrane depolarization, as a result of their sensing mechanism.61–62 The SNR of VoltageSpy 22 for action potentials is 7.7 ± 1.9, comparable to Ace2N-mNeon (7.1 ± 1.1) and substantially larger than ASAP2f (4.4 ± 0.5) (Fig. 4f). ASAP2f and Ace2N-mNeon are 2.4- and 15-fold brighter than VoltageSpy, respectively (as measured at the soma of cells from which we recorded), but the majority of the fluorescence of the genetically encoded indicators comes from fluorescence associated with internal structures—not the plasma membrane (Fig. 4a-c, Fig. S13). This highlights again a unique advantage of a hybrid approach in which a voltage-sensitive fluorophore is appended to a non-fluorescent genetically-encoded membrane target: in the hybrid case of Voltag-eSpy/SpyCatcher, poorly-trafficked proteins are invisible and do not contribute to unproductive background fluorescence.
Figure 4.

Comparison of VoltageSpy to GEVIs. Widefield fluorescence microscopy images of cultured hippocampal neurons expressing a) Ace2N-mNeon, b) ASAP2f or c) SpyCatcher and labeled with VoltageSpy 22. Scale bar is 20 μm. d) Representative traces of optically recorded, evoked action potentials from each indicator recorded under identical imaging conditions (. e, f) Quantification of ΔF/F (e) and SNR (f) of evoked spikes. Data are mean ±SD for 17 (VoltageSpy), 15 (ASAP2f) and 15 (Ace2N-mNeon) cells and represent averaged ΔF/F and SNR values from all spikes in a single trace
Imaging sub-cellular voltage dynamics
Measurements of the electronic properties of pre- and post-synaptic sites in neurons have been a tremendous, long-standing experimental challenge in neuroscience. Patching pre-synaptic boutons is difficult, and dendritic spines are inaccessible to electrophysiology. These structures therefore provide a unique opportunity where optical tools are the only viable existing method for interrogating their biology. The electric properties of dendrites have previously been probed with VSDs, but requires laborious internal loading of dyes via patch pipette.63–67 GEVIs have been also been employed to interrogate pre and post-synaptic biology, but the slow kinetics and low brightness of GEVIs make these experiments challenging.68
By employing the speed and sensitivity of VF dyes with genetic targeting of the SpyTag/SpyCatcher system, we can readily image sub-cellular voltage dynamics in cultured hippocampal neurons. Application of 5 nM VoltageSpy 22 (PEG35) results in clear, membrane-associated fluorescent restricted to SpyCatcher-expressing neurons indicated by nuclear mCherry (Fig. 5a). VoltageSpy labeling discriminates sub-cellular dendritic morphology - peripheral regions of dendrites are brighter than the internal cytosolic component (Fig. 5b) - and micronsized structures, dendritic spines, are visible (Fig. 5b). Singletrial (no stimulus-timed averaging used) optical recordings of a train of 25 evoked action potentials imaged at dendritic sites (purple, green, and blue ROIs, Fig. 5c) reveal clear action potentials (Fig. 5d). VoltageSpy dyes enable remote monitoring of voltage dynamics in sub-cellular regions 60 to 90 μm away from neuronal soma, the site of traditional electrophysiological recordings (Fig. 5d). In this way, genetically targeted VoltageSpy circumvents space clamp errors69 associated with measuring voltage changes in structure that are not close to the neuronal cell body. In a complementary fashion, VoltageSpy 20 (PEG11) can also image voltage dynamics in pre-synaptic structures associated with axon terminals (Fig. 5e-g). The cellular specificity of the VoltageSpy/SpyCatcher interaction enables tracing of extensive axonal tracks (Fig. 5e). Zooming in on the boxed region reveals the fine structure of an axon, several hundred microns distant from the nearest cell body (Fig. 5f). Single-trial, high speed imaging of 25 evoked action potentials clearly resolves fast voltage dynamics in a micron-sized axonal terminal hundreds of micrometers away from the neuronal soma (Fig. 5g).
Figure 5.
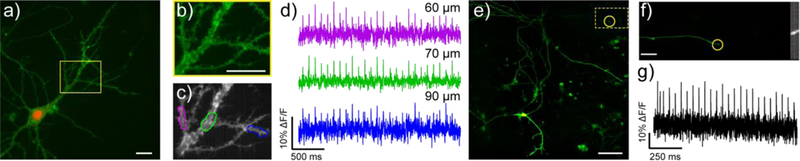
Sub-cellular voltage imaging with VoltageSpy dyes. a-d) imaging evoked action potentials in dendrites. a) Widefield fluorescence microscopy image of a hippocampal neuron co-expressing SpyCatcher and nuclear mCherry (red) and labeled with VoltageSpy 20 (green) under 63X magnification. Scale bar is 20 μm. b) Close-up of boxed region in panel (a). Scale bar is 20 μm. c) Average intensity projection of 2500 frames recorded at 500 Hz. ROIs are 10 μm long. d) ΔF/F traces of an evoked train of 25 APs. Color-coding corresponds to ROIs indicated in panel (c). Approximate distances from the center of the mCherry nucleus are indicated above each trace. e-g) imaging evoked action potentials in axons. e) Widefield fluorescence microscopy image of a hippocampal neuron co-expressing SpyCatcher and nuclear mCherry (red channel) and labeled with VoltageSpy 20 (green signal) under 20X magnification. Scale bar is 100 μm. f) Axon branch of the neuron in panel (e) under 63X magnification and close-up of axon terminal indicated by the yellow circle in panels (e) and (f) averaged intensity projection from 6000 frames imaged at 1.2 kHz. Scale bar is 10 μm. g) ΔF/F trace of an evoked train of 25 APs recorded at 1.2 kHz.
Conclusion
In conclusion, we show that voltage-sensitive fluorescent dyes can be covalently appended to the cell surface of mammalian cells and neurons, affording the opportunity for voltage imaging in genetically-defined cells or in sub-cellular regions of interest. The best of the newly-synthesized, sarcosine-containing VoltageFluors is readily functionalized with a PEG linker terminating with the SpyTag ligand. Localization of this VoltageSpy is determined by the expression of the SpyCatcher protein on cell surfaces. In this way, the speed and sensitivity of fluorescein-based voltage-sensitive fluorophores can be coupled with a genetically encoded component. This hybrid approach readily detects voltage changes in cultured cells and mammalian neurons. VoltageSpy performs well in cultured neurons, displaying up to 25-fold increase in staining in Spy-Catcher-expressing cells, and reporting on action potentials with higher sensitivity than commonly used genetically encoded voltage indicators. Using VoltageSpy, voltage dynamics in subcellular structures are readily observable in single trial experiments - an experiment which is otherwise difficult in culture due to the extensive overlap of axons and dendrites from different neurons in any given area. The sparse labeling achieved with VoltageSpy dyes also points the way towards future experiments in brain slice and in vivo, where the high density of cell bodies and their processes complicates imaging from single cells with untargeted dyes. Looking forward, we aim to expand the palette of available VoltageSpy dyes by engaging carboxylate-containing rhodamine-based voltage reporters (RhoVRs),53 develop new chemistries to target far-red dyes,15 apply next-generation SpyTag/SpyCatcher constructs,70 and mix and match complementary covalent targeting strategies48–52 with our existing palette of voltage-sensitive dyes for multiplexed imaging in complex neural tissue.
Supplementary Material
ACKNOWLEDGMENT
Research in the Miller lab is supported in part by grants from the National Institutes of Health (R35GM119855, R01NS098088), National Science Foundation (NSF 1707350), and the Klingenstein-Simons Foundation (40746). VG is supported in part by a graduate fellowship from the Natural Sciences and Engineering Research Council of Canada. PL is supported by an A*STAR graduate fellowship. BRD was supported in part by a training grant from the NIH (T32GM007232).
Footnotes
ASSOCIATED CONTENT
Supporting Information. Experimental details, synthetic procedures, imaging conditions, and supporting figures. This material is available free of charge via the Internet at http://pubs.acs.org.
REFERENCES
- 1.Peterka DS; Takahashi H; Yuste R, Imaging Voltage in Neurons. Neuron 2011, 69 (1), 9–21. [DOI] [PMC free article] [PubMed] [Google Scholar]
- 2.Scanziani M; Hausser M, Electrophysiology in the age of light. Nature 2009, 461 (7266), 930–939. [DOI] [PubMed] [Google Scholar]
- 3.Davila HV; Salzberg BM; Cohen LB; Waggoner AS, Large Change in Axon Fluorescence That Provides a Promising Method for Measuring Membrane-Potential. Nature-New Biol 1973, 241 (109), 159–160. [DOI] [PubMed] [Google Scholar]
- 4.Salzberg BM; Davila HV; Cohen LB, Optical Recording of Impulses in Individual Neurons of an Invertebrate Central Nervous-System. Nature 1973, 246 (5434), 508–509. [DOI] [PubMed] [Google Scholar]
- 5.Gupta RK; Salzberg BM; Grinvald A; Cohen LB; Kamino K; Lesher S; Boyle MB; Waggoner AS; Wang CH, Improvements in Optical Methods for Measuring Rapid Changes in Membrane-Potential. JMembrane Biol 1981, 58 (2), 123–137. [DOI] [PubMed] [Google Scholar]
- 6.Fluhler E; Burnham VG; Loew LM, Spectra, Membrane- Binding, and Potentiometric Responses of New Charge Shift Probes. Biochemistry-Us 1985, 24 (21), 5749–5755. [DOI] [PubMed] [Google Scholar]
- 7.Loew LM; Bonneville GW; Surow J, Charge Shift Optical Probes of Membrane-Potential - Theory. Biochemistry-Us 1978, 17 (19), 4065–4071. [DOI] [PubMed] [Google Scholar]
- 8.Hubener G; Lambacher A; Fromherz P, Anellated hemicyanine dyes with large symmetrical solvatochromism of absorption and fluorescence. Journal of Physical Chemistry B 2003, 107 (31), 7896–7902. [Google Scholar]
- 9.Kuhn B; Fromherz P, Anellated hemicyanine dyes in a neuron membrane: Molecular Stark effect and optical voltage recording. Journal of Physical Chemistry B 2003, 107 (31), 7903–7913. [Google Scholar]
- 10.Cacciatore TW; Brodfuehrer PD; Gonzalez JE; Jiang T; Adams SR; Tsien RY; Kristan WB Jr.; Kleinfeld D, Identification of neural circuits by imaging coherent electrical activity with FRET-based dyes. Neuron 1999, 23 (3), 449–59. [DOI] [PubMed] [Google Scholar]
- 11.Gonzalez JE; Tsien RY, Voltage sensing by fluorescence resonance energy transfer in single cells. Biophys J 1995, 69 (4), 1272–80. [DOI] [PMC free article] [PubMed] [Google Scholar]
- 12.Gonzalez JE; Tsien RY, Improved indicators of cell membrane potential that use fluorescence resonance energy transfer. Chem Biol 1997, 4 (4), 269–77. [DOI] [PubMed] [Google Scholar]
- 13.Li LS, Fluorescence probes for membrane potentials based on mesoscopic electron transfer. Nano Letters 2007, 7, 2981–2986. [DOI] [PubMed] [Google Scholar]
- 14.De Silva AP; Gunaratne HQN; Habibjiwan JL; Mccoy P; Rice TE; Soumillion JP, New Fluorescent Model Compounds for the Study of Photoinduced Electron-Transfer - the Influence of a Molecular Electric-Field in the Excited-State. Angew Chem Int Edit 1995, 34 (16), 1728–1731. [Google Scholar]
- 15.Huang Y-L; Walker AS; Miller EW, A Photostable Silicon Rhodamine Platform for Optical Voltage Sensing. Journal of the American Chemical Society 2015, 137, 10767–10776. [DOI] [PMC free article] [PubMed] [Google Scholar]
- 16.Kulkarni RU; Kramer DJ; Pourmandi N; Karbasi K; Bateup HS; Miller EW, Voltage-sensitive rhodol with enhanced two-photon brightness. P Natl Acad Sci USA 2017, 114 (11), 2813–2818. [DOI] [PMC free article] [PubMed] [Google Scholar]
- 17.Kulkarni RU; Yin H; Pourmandi N; James F; Adil MM; Schaffer DV; Wang Y; Miller EW, A Rationally Designed, General Strategy for Membrane Orientation of Photoinduced Electron Transfer-Based Voltage-Sensitive Dyes. ACS Chem Biol 2017, 12 (2), 407–413. [DOI] [PMC free article] [PubMed] [Google Scholar]
- 18.Miller EW; Lin JY; Frady EP; Steinbach PA; Kristan WB; Tsien RY, Optically monitoring voltage in neurons by photo induced electron transfer through molecular wires. P Natl Acad Sci USA 2012, 109 (6), 2114–2119. [DOI] [PMC free article] [PubMed] [Google Scholar]
- 19.Woodford CR; Frady EP; Smith RS; Morey B; Canzig Palida SF; Araneda RC; Kristan WB Jr.; Kubiak CP; Miller EW; Tsien RY, Improved PeT molecules for optically sensing voltage in neurons. J Am Chem Soc 2015, 137 (5), 1817–24. [DOI] [PMC free article] [PubMed] [Google Scholar]
- 20.Yang HH; St-Pierre F, Genetically Encoded Voltage Indicators: Opportunities and Challenges. J Neurosci 2016, 36 (39), 9977–89. [DOI] [PMC free article] [PubMed] [Google Scholar]
- 21.Lin MZ; Schnitzer MJ, Genetically encoded indicators of neuronal activity. Nature Neuroscience 2016, 19 (9), 1142–1153. [DOI] [PMC free article] [PubMed] [Google Scholar]
- 22.Siegel MS; Isacoff EY, A genetically encoded optical probe of membrane voltage. Neuron 1997, 19 (4), 735–41. [DOI] [PubMed] [Google Scholar]
- 23.Sakai R; Repunte-Canonigo V; Raj CD; Knopfel T, Design and characterization of a DNA-encoded, voltage-sensitive fluorescent protein. Eur JNeurosci 2001, 13 (12), 2314–2318. [DOI] [PubMed] [Google Scholar]
- 24.Ataka K; Pieribone VA, A genetically targetable fluorescent probe of channel gating with rapid kinetics. Biophysical Journal 2002, 82 (1), 509–516. [DOI] [PMC free article] [PubMed] [Google Scholar]
- 25.St-Pierre F; Marshall JD; Yang Y; Gong YY; Schnitzer MJ; Lin MZ, High-fidelity optical reporting of neuronal electrical activity with an ultrafast fluorescent voltage sensor. Nature Neuroscience 2014, 17 (6), 884–889. [DOI] [PMC free article] [PubMed] [Google Scholar]
- 26.Jin L; Han Z; Platisa J; Wooltorton JRA; Cohen LB; Pieribone VA, Single Action Potentials and Subthreshold Electrical Events Imaged in Neurons with a Fluorescent Protein Voltage Probe. Neuron 2012, 75 (5), 779–785. [DOI] [PMC free article] [PubMed] [Google Scholar]
- 27.Abdelfattah AS; Farhi SL; Zhao YX; Brinks D; Zou P; Ruangkittisakul A; Platisa J; Pieribone VA; Ballanyi K; Cohen E; Campbell RE, A Bright and Fast Red Fluorescent Protein Voltage Indicator That Reports Neuronal Activity in Organotypic Brain Slices. J Neurosci 2016, 36 (8), 2458–2472. [DOI] [PMC free article] [PubMed] [Google Scholar]
- 28.Kralj JM; Douglass AD; Hochbaum DR; Maclaurin D; Cohen AE, Optical recording of action potentials in mammalian neurons using a microbial rhodopsin. Nature Methods 2012, 9 (1), 90–U130. [DOI] [PMC free article] [PubMed] [Google Scholar]
- 29.Hochbaum DR; Zhao Y; Farhi SL; Klapoetke N; Werley A; Kapoor V; Zou P; Kralj JM; Maclaurin D; Smedemark-Margulies N; Saulnier JL; Boulting GL; Straub C; Cho YK; Melkonian M; Wong GKS; Harrison DJ; Murthy VN; Sabatini L; Boyden ES; Campbell RE; Cohen AE, All-optical electrophysiology in mammalian neurons using engineered microbial rhodopsins. Nature Methods 2014, 11 (8), 825–833. [DOI] [PMC free article] [PubMed] [Google Scholar]
- 30.Flytzanis NC; Bedbrook CN; Chiu H; Engqvist MKM; Xiao C; Chan KY; Sternberg PW; Arnold FH; Gradinaru V, Archaerhodopsin variants with enhanced voltage-sensitive fluorescence in mammalian and Caenorhabditis elegans neurons. Nature Communications 2014, 5. [DOI] [PMC free article] [PubMed] [Google Scholar]
- 31.Herwig L; Rice AJ; Bedbrook CN; Zhang RJK; Lignell A; Cahn JKB; Renata H; Dodani SC; Cho I; Cai L; Gradinaru V; Arnold FH, Directed Evolution of a Bright Near-Infrared Fluorescent Rhodopsin Using a Synthetic Chromophore. Cell Chem Biol 2017, 24 (3), 415–425. [DOI] [PMC free article] [PubMed] [Google Scholar]
- 32.Piatkevich KD; Jung EE; Straub C; Linghu CY; Park D,Suk HJ; Hochbaum DR; Goodwin D; Pnevmatikakis E; Pak N; Kawashima T; Yang CT; Rhoades JL; Shemesh O; Asano S; Yoon YG; Freifeld L; Saulnier JL; Riegler C; Engert F; Hughes T; Drobizhev M; Szabo B; Ahrens MB; Flavell SW; Sabatini BL; Boyden ES, A robotic multidimensional directed evolution approach applied to fluorescent voltage reporters. Nature Chemical Biology 2018, 14 (4), 352–+. [DOI] [PMC free article] [PubMed] [Google Scholar]
- 33.Zou P; Zhao YX; Douglass AD; Hochbaum DR; Brinks D; Werley CA; Harrison DJ; Campbell RE; Cohen AE, Bright and fast multicoloured voltage reporters via electrochromic FRET. Nature Communications 2014, 5. [DOI] [PMC free article] [PubMed] [Google Scholar]
- 34.Gong YY; Wagner MJ; Li JZ; Schnitzer MJ, Imaging neural spiking in brain tissue using FRET-opsin protein voltage sensors. Nature Communications 2014, 5. [DOI] [PMC free article] [PubMed] [Google Scholar]
- 35.Gong YY; Huang C; Li JZ; Grewe BF; Zhang YP; Eismann S; Schnitzer MJ, High-speed recording of neural spikes in awake mice and flies with a fluorescent voltage sensor. Science 2015, 350 (6266), 1361–1366. [DOI] [PMC free article] [PubMed] [Google Scholar]
- 36.Baker BJ; Lee H; Pieribone VA; Cohen LB; Isacoff EY; Knopfel T; Kosmidis EK, Three fluorescent protein voltage sensors exhibit low plasma membrane expression in mammalian cells. J Neurosci Meth 2007, 161 (1), 32–38. [DOI] [PubMed] [Google Scholar]
- 37.Baker BJ; Lee H; Cohen L; Ataka K; Kosmidis E; Isacoff E; Knopfel T; Pieribone V, Screening for plasma membrane expression of fluorescent protein (FP)-voltage sensors. Biophysical Journal 2005, 88 (1), 171a–171a. [DOI] [PubMed] [Google Scholar]
- 38.Chanda B; Blunck R; Faria LC; Schweizer FE; Mody I; Bezanilla F, A hybrid approach to measuring electrical activity in genetically specified neurons. Nature Neuroscience 2005, 8 (11), 1619–1626. [DOI] [PubMed] [Google Scholar]
- 39.Sjulson L; Miesenbock G, Rational optimization and Imaging in vivo of a genetically encoded optical voltage reporter. J Neurosci 2008, 28 (21), 5582–5593. [DOI] [PMC free article] [PubMed] [Google Scholar]
- 40.Bayguinov PO; Ma YH; Gao Y; Zhao XY; Jackson MB, Imaging Voltage in Genetically Defined Neuronal Subpopulations with a Cre Recombinase-Targeted Hybrid Voltage Sensor. J Neurosci 2017, 37 (38), 9305–9319. [DOI] [PMC free article] [PubMed] [Google Scholar]
- 41.Ghitani N; Bayguinov PO; Ma YH; Jackson MB, Single-trial imaging of spikes and synaptic potentials in single neurons in brain slices with genetically encoded hybrid voltage sensor. J Neurophysiol 2015, 113 (4), 1249–1259. [DOI] [PMC free article] [PubMed] [Google Scholar]
- 42.Wang DS; Zhang Z; Chanda B; Jackson MB, Improved Probes for Hybrid Voltage Sensor Imaging. Biophysical Journal 2010, 99 (7), 2355–2365. [DOI] [PMC free article] [PubMed] [Google Scholar]
- 43.Hinner MJ; Hbener G; Fromherz P, Enzyme-induced staining of biomembranes with voltage-sensitive fluorescent dyes. J Phys Chem B 2004, 108 (7), 2445–53. [DOI] [PubMed] [Google Scholar]
- 44.Hinner MJ; Hubener G; Fromherz P, Genetic targeting of individual cells with a voltage-sensitive dye through enzymatic activation of membrane binding. Chembiochem 2006, 7 (3), 495–505. [DOI] [PubMed] [Google Scholar]
- 45.Ng DN; Fromherz P, Genetic targeting of a voltage-sensitive dye by enzymatic activation of phosphonooxymethyl-ammonium derivative. ACS Chem Biol 2011, 6 (5), 444–51. [DOI] [PubMed] [Google Scholar]
- 46.Xu YX; Peng LX; Wang SC; Wang AQ; Ma RR; Zhou Y; Yang JH; Sun DE; Lin W; Chen X; Zou P, Hybrid Indicators for Fast and Sensitive Voltage Imaging. Angew Chem Int Edit 2018, 57 (15), 3949–3953. [DOI] [PubMed] [Google Scholar]
- 47.Liu P; Grenier V; Hong W; Muller VR; Miller EW, Fluorogenic Targeting of Voltage-Sensitive Dyes to Neurons. J Am Chem Soc 2017, 139 (48), 17334–17340. [DOI] [PMC free article] [PubMed] [Google Scholar]
- 48.Los GV; Encell LP; McDougall MG; Hartzell DD; Karassina N; Zimprich C; Wood MG; Learish R; Ohane RF; Urh M; Simpson D; Mendez J; Zimmerman K; Otto P; Vidugiris G; Zhu J; Darzins A; Klaubert DH; Bulleit RF; Wood KV, HatoTag: A novel protein labeling technology for cell imaging and protein analysis. Acs Chemical Biology 2008, 3 (6), 373–382. [DOI] [PubMed] [Google Scholar]
- 49.Keppler A; Gendreizig S; Gronemeyer T; Pick H; Vogel,; H Johnsson, K., A general method for the covalent labeling of fusion proteins with small molecules in vivo. Nat Biotechnol 2003, 21 (1), 86–89. [DOI] [PubMed] [Google Scholar]
- 50.Gallagher SS; Sable JE; Sheetz MP; Cornish VW, An In Vivo Covalent TMP-Tag Based on Proximity-Induced Reactivity. Acs Chemical Biology 2009, 4 (7), 547–556. [DOI] [PMC free article] [PubMed] [Google Scholar]
- 51.Vivero-Pol L; George N; Krumm H; Johnsson K; Johnsson N, Multicolor Imaging of cell surface proteins. Journal of the American Chemical Society 2005, 127 (37), 12770–12771. [DOI] [PubMed] [Google Scholar]
- 52.Zakeri B; Fierer JO; Celik E; Chittock EC; Schwarz-Linek U; Moy VT; Howarth M, Peptide tag forming a rapid covalent bond to a protein, through engineering a bacterial adhesin. Proc Natl Acad Sci US A 2012, 109 (12), E690–7. [DOI] [PMC free article] [PubMed] [Google Scholar]
- 53.Deal PE; Kulkarni RU; Al-Abdullatif SH; Miller EW, Isomerically Pure Tetramethylrhodamine Voltage Reporters. J Am Chem Soc 2016, 138 (29), 9085–8. [DOI] [PMC free article] [PubMed] [Google Scholar]
- 54.Woodford CR; Frady EP; Smith RS; Morey B; Canzi G; Palida SF; Araneda RC; Kristan WB; Kubiak CP; Miller EW; Tsien RY, Improved PeT molecules for optically sensing voltage in neurons. Journal of the American Chemical Society 2015, 13 7, 1817–24. [DOI] [PMC free article] [PubMed] [Google Scholar]
- 55.Deal PE; Kulkarni RU; Al-Abdullatif SH; Miller EW, Isomerically Pure Tetramethylrhodamine Voltage Reporters. Journal of the American Chemical Society 2016, 138, 9085–9088. [DOI] [PMC free article] [PubMed] [Google Scholar]
- 56.Jiao GS; Han JW; Burgess K, Syntheses of regioisomerically pure 5- or 6-halogenated fluoresceins. J Org Chem 2003, 68 (21), 8264–7. [DOI] [PubMed] [Google Scholar]
- 57.Kim J; Zhao T; Petralia RS; Yu Y; Peng H; Myers E; Magee JC, mGRASP enables mapping mammalian synaptic connectivity with light microscopy. Nat Methods 2011, 9 (1), 96–102. [DOI] [PMC free article] [PubMed] [Google Scholar]
- 58.Wakayama S; Kiyonaka S; Arai I; Kakegawa W; Matsuda S; Ibata K; Nemoto YL; Kusumi A; Yuzaki M; Hamachi I, Chemical labelling for visualizing native AMPA receptors in live neurons. Nat Commun 2017, 8, 14850. [DOI] [PMC free article] [PubMed] [Google Scholar]
- 59.Li L; Fierer JO; Rapoport TA; Howarth M, Structural analysis and optimization of the covalent association between SpyCatcher and a peptide Tag. J Mol Biol 2014, 426 (2), 309–17. [DOI] [PMC free article] [PubMed] [Google Scholar]
- 60.Yang HH; St-Pierre F; Sun X; Ding X; Lin MZ; Clandinin TR, Subcellular Imaging of Voltage and Calcium Signals Reveals Neural Processing In Vivo. Cell 2016, 166 (1), 245–57. [DOI] [PMC free article] [PubMed] [Google Scholar]
- 61.Gong Y; Huang C; Li JZ; Grewe BF; Zhang Y; Eismann S; Schnitzer MJ, High-speed recording of neural spikes in awake mice and flies with a fluorescent voltage sensor. Science 2015, 350 (6266), 1361–6. [DOI] [PMC free article] [PubMed] [Google Scholar]
- 62.St-Pierre F; Marshall JD; Yang Y; Gong Y; Schnitzer MJ; Lin MZ, High-fidelity optical reporting of neuronal electrical activity with an ultrafast fluorescent voltage sensor. Nat Neurosci 2014, 17 (6), 884–9 [DOI] [PMC free article] [PubMed] [Google Scholar]
- 63.Antic S; Zecevic D, Optical Signals from Neurons with Internally Applied Voltage-Sensitive Dyes. J Neurosci 1995, 15 (2), 1392–1405. [DOI] [PMC free article] [PubMed] [Google Scholar]
- 64.Yan P; Acker CD; Zhou WL; Lee P; Bollensdorff C; Negrean A; Lotti J; Sacconi L; Antic SD; Kohl P; Mansvelder HD; Pavone FS; Loew LM, Palette of fluorinated voltage-sensitive hemicyanine dyes. P Natl Acad Sci USA 2012, 109 (50), 20443–20448. [DOI] [PMC free article] [PubMed] [Google Scholar]
- 65.Roome CJ; Kuhn B, Simultaneous dendritic voltage and calcium imaging and somatic recording from Purkinje neurons in awake mice. Nature Communications 2018, 9. [DOI] [PMC free article] [PubMed] [Google Scholar]
- 66.Bradley J; Luo R; Otis TS; DiGregorio DA, Submillisecond Optical Reporting of Membrane Potential In Situ Using a Neuronal Tracer Dye. J Neurosci 2009, 29 (29), 9197–9209. [DOI] [PMC free article] [PubMed] [Google Scholar]
- 67.Fink AE; Bender KJ; Trussell LO; Otis TS; DiGregorio DA, Two-Photon Compatibility and Single-Voxel, Single Trial Detection of Subthreshold Neuronal Activity by a Two-Component Optical Voltage Sensor. Plos One 2012, 7 (8). [DOI] [PMC free article] [PubMed] [Google Scholar]
- 68.Hoppa MB; Gouzer G; Armbruster M; Ryan TA, Control and Plasticity of the Presynaptic Action Potential Waveform at Small CNS Nerve Terminals. Neuron 2014, 84 (4), 778–789. [DOI] [PMC free article] [PubMed] [Google Scholar]
- 69.Spruston N; Jaffe DB; Williams SH; Johnston D, Voltage- and space-clamp errors associated with the measurement of electrotonically remote synaptic events. J Neurophysiol 1993, 70 (2), 781–802. [DOI] [PubMed] [Google Scholar]
- 70.Keeble AH; Banerjee A; Ferla MP; Reddington SC; Anuar I; Howarth M, Evolving Accelerated Amidation by SpyTag/SpyCatcher to Analyze Membrane Dynamics. Angew Chem Int Ed Engl 2017, 56 (52), 16521–16525. [DOI] [PMC free article] [PubMed] [Google Scholar]
Associated Data
This section collects any data citations, data availability statements, or supplementary materials included in this article.