

Abstract
Background:
There is conflicting evidence about potential adverse neuropsychiatric effects of efavirenz and limited data from sub-Saharan Africa, where efavirenz is used as first-line therapy and 70% of people living with HIV (PLHIV) reside.
Objective:
To estimate associations between efavirenz use, depression, and suicidal ideation among PLHIV in Uganda.
Design:
Prospective observational cohort study
Setting:
Mbarara, Uganda
Participants:
Adult PLHIV enrolled at antiretroviral therapy (ART) initiation and observed every 3–4 months during 2005–2015
Measurements:
Our exposure of interest was time-varying efavirenz use, defined by use in the 7 days and 60 or more of the 90 days prior to a study visit, as compared to nevirapine use. Self-reported outcomes were: (1) depression, defined by a mean score >1.75 on the Hopkins Symptom Checklist depression subscale; and (2) suicidal ideation. We fit multivariable-adjusted generalized estimating equations (GEE) logistic regression models, Cox proportional hazard regression models, and marginal structural models (MSM) to estimate the association between efavirenz and risk of depression and suicidal ideation.
Results:
694 participants (median age 33, median pre-treatment CD4+ count 180 cells/μL) contributed 1,200 person-years of observation (460 person-years on efavirenz). There were no baseline differences in depression or suicidal ideation between those ever-exposed to efavirenz and those never-exposed and receiving nevirapine (both P>0.80). 61/305 (20.0%) and 19/305 (6.2%) participants ever-exposed to efavirenz had at least one follow-up visit with depression and suicidal ideation, respectively, compared to 125/389 (32.1%) and 48/389 (12.3%) of participants receiving nevirapine. In adjusted GEE models, efavirenz use was associated with decreased odds of depression compared to nevirapine use (adjusted odds ratio [AOR], 0.62 [95% CI, 0.40 to 0.96]) and was not significantly associated with suicidal ideation (AOR, 0.61 [95% CI, 0.30 to 1.26]). Time-to-event and MSM models yielded similar estimates.
Limitations:
Non-random assignment to treatment with substantial differences between participants receiving efavirenz or nevirapine
Conclusions:
We found no evidence that use of efavirenz in first-line ART increased risk of depression or suicidal ideation compared with nevirapine among PLHIV in Uganda.
Introduction
Efavirenz, an HIV non-nucleoside reverse transcriptase inhibitor, remains commonly used in both low- and high-income countries (1). There has been growing concern regarding serious morbid neuropsychiatric adverse events with efavirenz use, such as depression and suicidality (2,3). A pooled analysis of data from four AIDS Clinical Trial Group studies showed an association between efavirenz use and an increased hazard of suicidality (2), although such an association was not replicated by subsequent observational cohort studies (4–7). Nonetheless, in light of these data on suicidality, along with concerns related to the low barrier to resistance of efavirenz compared to newer agents, the United States Department of Health and Human Services has removed efavirenz as a recommended first-line agent for treatment of HIV (8).
The World Health Organization continues to recommend efavirenz as a key component of first-line antiretroviral therapy (ART) regimens in sub-Saharan Africa (9). However, little data exists concerning neuropsychiatric effects of efavirenz in the region, where over 12 million people living with HIV (PLHIV) are estimated to be taking ART (10). This question is especially important given the elevated prevalence of depression among PLHIV (11), and the role of depression in contributing to poor HIV treatment outcomes (12,13). The objective of this analysis was to examine the association between efavirenz use and risk of depression and suicidal ideation among a cohort of PLHIV taking ART in rural Uganda in order to provide data on the safety of efavirenz in the region.
Methods
Study population, design, and data collection
The Uganda AIDS Rural Treatment Outcome (UARTO) study was a prospective observational cohort study of PLHIV conducted between 2005–2015, with enrollment ending in 2013. Participants were recruited from the Mbarara Regional Referral Hospital HIV clinic at the time of ART initiation. To be eligible, patients at the clinic needed to be 18 years or older, ART-naïve, and living within 60 kilometers of the clinic.
Study participants were observed four times per year until June 2011, when visit frequency decreased to three times a year. Study visits occurred adjacent to the HIV clinic. At each visit, participants completed phlebotomy for CD4+ T-lymphocyte cell count and HIV-1 RNA viral load testing and structured interviews to assess for probable depression, suicidal ideation, alcohol use, and self-reported health status. Pregnancy was also measured by self-report until December 2011, when we began collected urine for beta-human chorionic gonadotropin testing. For the purpose of this analysis, we excluded those who did not start ART (n=47), were not on efavirenz or nevirapine-based therapy at any recorded follow-up visits (n=1), had their baseline probable depression assessment more than three days after ART initiation (n=7), did not have at least one follow-up probable depression assessment (n=6), and those who lacked covariate data for follow-up visits (n=7) (Appendix Figure 1).
Study Definitions
Outcomes
Our outcomes of interest were probable depression and suicidal ideation. Probable depression was measured with an adapted version of the 15-item depression subscale of the Hopkins Symptom Checklist, which we have previously validated among PLHIV in Uganda (14–18). This adapted version includes a 16th item (“feeling like I don’t care about my health”) (19). A participant was considered to have probable depression if the mean score on the items was greater than 1.75 (19,20). Suicidal ideation in the past week was assessed using the question: “Do you have thoughts about ending your life?”, measured on a four-point Likert-type scale. A participant was considered to have suicidal ideation if they endorsed any amount of suicidal ideation on this item (“a little,” “quite a bit,” “extremely” versus “not at all”).
Exposure
Our primary exposure of interest was time-varying use of efavirenz, which was defined as efavirenz use during the last 7 days and in 60 or more of the last 90 days prior to a study visit. Our referent group was those who used nevirapine, as defined by not meeting criteria for efavirenz use, and having any nevirapine use in the last 90 days prior to a study visit. We excluded any study visits in which a participant was neither on efavirenz or nevirapine-based therapy (i.e., on a protease inhibitor) at the time of visit (37 [1.0%] study visits); one participant was excluded from the analysis as s/he was on a protease inhibitor at all recorded follow-up study visits. For visits before participants completed 90 days of ART, exposure to efavirenz or nevirapine was defined by use during the last 7 days. ART regimens and durations were self-reported by participants, and in instances where the ART regimen was not valid (e.g., participant reported a monotherapy regimen), ART data from the HIV clinic was used in its place. Missing ART regimen data was imputed for 4,510 out of 399,484 study days (1.1%) (Appendix “Methods”).
Confounding Variables
We adjusted for several time-varying demographic covariates, including age, sex, marital status, educational attainment, and household asset ownership. Year of study enrollment was also included in models as a time-fixed covariate. The asset ownership index was derived from applying the method of principal component analysis to 25 binary variables pertaining to household assets and housing characteristics as suggested by Filmer and Pritchett (21). The first component was extracted and used to define the asset ownership index, which was categorized into quintiles of relative household wealth. Year of enrollment was defined as a categorical variable with three-year increments from 2005 until 2013, when enrollment concluded.
We adjusted for three baseline, time-fixed clinical variables: probable depression at enrollment, suicidal ideation at enrollment, and tuberculosis co-infection. We also adjusted for the following time-varying clinical variables: CD4+ T-lymphocyte cell count, viral suppression, ART duration, health status, and heavy drinking. Tuberculosis-co-infection was ascertained in participants who self-reported tuberculosis or who were concurrently registered in the electronic database of the Mbarara Hospital tuberculosis ward. The ascertainment process entailed a review of the clinical and laboratory records of the participants by an infectious disease physician (Appendix “Methods”). Viral suppression was defined as an undetectable viral load, which varied by type of assay and decreased from 400 to 20 copies/mL as the study progressed. ART duration was measured as cumulative weeks since ART initiation. Health status was measured by the Physical Health Summary score from the Medical Outcome Survey-HIV (MOS-HIV) questionnaire and was categorized into quartiles (22). Heavy drinking was determined by the three-item consumption subset of the Alcohol Use Disorders Identification Test (23). Participants were considered pregnant by self-report or with a positive urine beta-human chorionic gonadotropin test. Pregnancy was not adjusted for in models but served as a stratification variable in sensitivity analyses restricted to women.
Lost to follow-up and missing visits
For our primary analysis, we restricted estimation to the first two years of treatment, when efavirenz has been most commonly associated with neuropsychiatric symptoms (24). This time period also corresponds to a window for which nearly all study participants had full observation. We considered participants lost to follow-up if they withdrew from the study before two years or if their last study visit was earlier than 550 days from the date of ART initiation, except in the case of death. The 550-day threshold was selected, because it was a time point after which there is one more expected study visit in the first two years of treatment.
We performed an investigation after each death by reviewing the medical record and interviewing the medical team and/or family (if death occurred outside a health facility) at the time of death. We recorded the cause of death as suicide, not suicide, or by an unknown cause. Non-suicide deaths were censored at time of death.
Statistical Analysis
We characterized the distributions of variables at baseline and compared them between participants who met criteria for efavirenz exposure in one or more follow-up visits (ever-efavirenz users) and those who did not meet criteria in any follow-up visit in the first two years (only-nevirapine users). Differences in continuous and categorical variables at baseline were tested using the Wilcoxon rank-sum and Pearson’s chi square tests, respectively.
For our primary model, we fit generalized estimating equations (GEE) logistic regression models with an exchangeable correlation matrix for both depression and suicidal ideation, restricted to follow-up visits the first two years after ART initiation, with time-varying efavirenz exposure and adjusting for time-updated demographic and both baseline and time-updated clinical covariates. We calculated absolute risk reductions for our outcomes based on the GEE model via the average adjusted prediction method and associated 95% confidence intervals via the delta method. We next fit Cox proportional hazards regression models, using time-to-first-visit with depression or suicidal ideation as the outcome of interest. We accounted for time-varying exposure and adjusted for time-fixed, baseline covariates to estimate differences in time-to-depression and time-to-suicidal ideation by efavirenz use. For this model, we substituted the viral suppression covariate with the log10 of the baseline viral load. Participants were right-censored at their last visit before 2 years. We plotted cumulative incidence curves using the Kaplan-Meier method and performed log-rank tests of equality between efavirenz and nevirapine users, accounting for time-varying exposure. We also calculated crude incidence rate differences of first-ever events between the two groups. In subgroup analyses, we fit GEE models stratified by each covariate and plotted estimates of the association between efavirenz use and probable depression and suicidal ideation in forest plots. We interrogated the robustness of our primary and secondary models with multiple sensitivity analyses, including constructing a marginal structural model (described in the Appendix “Methods”). Sensitivity analyses accounting for lost to follow-up and missing visits imputed outcomes as positive and then as negative for suicidal ideation and probable depression at the last follow-up visit and at missing visits, respectively.
Finally, following methods proposed by VanderWeele and Ding (25), we performed an E-value analysis to determine the minimum strength of association, on the risk ratio scale, that would be required for an unobserved confounder to have with both the exposure and outcome, conditional on the measured covariates, in order to move an estimate to a certain risk ratio or the upper limit of a confidence interval to encapsulate this risk ratio. We used a reference risk ratio of 1.27, which represents the lower 95% confidence limit for the association between use of efavirenz and suicidal ideation or attempted/completed suicide estimated in a previous analysis (2).
All statistical analyses were performed using STATA version 14.2 (College Station, Texas).
Ethical Approval
Ethical approval for study procedures was obtained by the Partners Human Research Committee at Massachusetts General Hospital; the Committee on Human Research, University of California at San Francisco; and the Research Ethical Committee, Mbarara University of Science and Technology. The study was cleared by the Uganda National Council of Science and Technology. All participants gave written informed consent.
Role of the Funding Source
The U.S. National Institutes of Health, the Harvard and San Francisco Centers for AIDS Research, and the Doris Duke Charitable Foundation funded this study. The funding source had no role in the design and conduct of the study; collection, management, analysis, or interpretation of the data; or preparation or submission of the manuscript for publication.
Results
Participant Characteristics and Study Follow-Up
Of the 762 PLHIV who completed an enrollment study visit, 694 participants met inclusion criteria (Appendix Figure 1) and contributed a total of 3,858 follow-up study visits (median, 6 [IQR, 4–7]) and 1,200 person-years of observation time (median, 1.85 [IQR, 1.83–1.85]). 2 out of 4,244 visits and 384 out of 4,244 (9.1%) visits were censored due to missing outcome and covariate data, respectively (Appendix “Results”). During the follow up period, 17 (2.4%) participants died and 52 (7.5%) were lost to follow-up. Of the 17 deaths, the cause of death was not suicide in 16, and was unknown in one.
Table 1 summarizes participant characteristics at enrollment. Between the ever-efavirenz users (n=305) and only-nevirapine users (n=389), there was no difference in the proportion of participants with probable depression and suicidal ideation at enrollment (both P>0.80). Ever-efavirenz users were more likely to be enrolled later during observation and have a higher CD4+ T-cell count at enrollment (231 vs 151 cells/μL) compared to only-nevirapine users. The median proportion of visits with viral suppression were similar in both groups (83% vs 86%), as were the proportion of participants who died (2.0% vs 2.8%). There was a smaller proportion of missed visits (9.2% vs 15.2%) and fewer participants lost to follow-up (3.9% vs 10.3%) in the ever-efavirenz group compared to the only-nevirapine group.
Table 1.
Cohort characteristics by ever exposure to efavirenz
| Variable | Ever-EFV * (n = 305) |
Only-NVP (n = 389) |
P-value |
|---|---|---|---|
| Demographic Characteristics | |||
| Age, median (IQR) | 32 (27, 40) | 34 (28, 39) | 0.165 |
| Female, n (%) | 201 (65.9%) | 283 (72.8%) | 0.051 |
| Baseline pregnant | 48 (25.3%) | 41 (14.9%) | 0.005 |
| Married, n (%) | 169 (55.4%) | 179 (46.0%) | 0.014 |
| Educational attainment, n (%) | 0.051 | ||
| None | 54 (17.7%) | 53 (13.6%) | |
| Some primary | 95 (31.1%) | 156 (40.1%) | |
| Completed primary | 64 (21.0%) | 85 (21.9%) | |
| Some secondary and higher | 92 (30.2%) | 95 (24.4%) | |
| Asset index†, n (%) | 0.014 | ||
| 1st quintile (most poor) | 46 (15.1%) | 90 (23.1%) | |
| 2nd quintile | 57 (18.7%) | 83 (21.3%) | |
| 3rd quintile | 60 (19.7%) | 77 (19.8%) | |
| 4th quintile | 69 (22.6%) | 77 (19.8%) | |
| 5th quintile (least poor) | 73 (23.9%) | 62 (15.9%) | |
| Year of enrollment, n (%) | < 0.001 | ||
| 2005–07 | 68 (22.3%) | 251 (64.5%) | |
| 2008–10 | 32 (10.5%) | 103 (26.5%) | |
| 2011–13 | 205 (67.2%) | 35 (9.0%) | |
| Clinical Characteristics | |||
| Efavirenz use at enrollment, n (%) | 253 (83.0%) | 9 (2.3%) | < 0.001 |
| NRTI backbone at enrollment, n (%) | < 0.001 | ||
| 3TC + TDF | 172 | 11 | |
| 3TC + AZT | 117 | 285 | |
| FTC + TDF | 1 | 1 | |
| 3TC + D4T | 15 | 92 | |
| Probable depression at enrollment‡, n (%) | 99 (32.5%) | 129 (33.2%) | 0.84 |
| Suicidal ideation at enrollment, n (%) | 21 (6.9%) | 26 (6.7%) | 0.92 |
| Enrollment CD4+ count (cells/μL), median (IQR) | 231 (126, 348) | 151 (88, 219) | < 0.001 |
| Enrollment viral load (log10 copies/mL), median (IQR) | 0.83 (0.67, 1.00) | 0.86 (0.67, 1.00) | 0.75 |
| Tuberculosis co-infection | 26 (8.5%) | 8 (2.1%) | < 0.001 |
| Physical Health Summary score§, median (IQR) | 57.3 (48.6, 60.8) | 54.7 (46.2, 58.9) | 0.001 |
| Heavy drinking∥, n (%) | 49 (16.7%) | 74 (19.9%) | 0.28 |
| Follow-up Characteristics | |||
| Duration of follow-up (weeks), median (IQR) | 96 (95, 97) | 96 (95, 97) | 0.163 |
| Number of follow-up visits, median (IQR) | 6 (6, 6) | 7 (6, 8) | < 0.001 |
| Number of follow-up visits without missing covariate data, median (IQR) | 6 (4, 6) | 7 (5, 7) | < 0.001 |
| Proportion of follow-up visits with viral suppression¶, median (IQR) | 0.83 (0.67, 1.00) | 0.86 (0.67, 1.00) | 0.75 |
| Died, n (%) | 6 (2.0%) | 11 (2.8%) | 0.47 |
| Lost to follow-up**, n (%) | 13 (4.3%) | 40 (10.3%) | < 0.001 |
| Total number of missing visits, n (%) | 162 (10.6%) | 423 (18.1%) | < 0.001 |
| Number of missing visits per participant††, n (%) | 0 (0, 1) | 1 (0, 2) | < 0.001 |
| Number of visits censored for missing covariate data per participant, n (%) | 0 (0, 1) | 0 (0, 0) | <0.001 |
EFV = efavirenz; NVP = nevirapine; IQR = interquartile range; NRTI = nucleoside reverse transcriptase inhibitor; 3TC = lamivudine; TDF = tenofovir disoproxil; AZT = zidovudine; FTC = emtricitabine; D4T = stavudine
The ever-efavirenz group included participants who met criteria for efavirenz exposure for at least one follow-up visit in study period; the only-nevirapine group included participants who did not meet criteria for efavirenz exposure in any follow-up visits in study period
Asset index was calculated based on the methods described by Filmer and Pritchett (21).
Probable depression was defined as a score of >1.75 on the Hopkins Symptom Checklist-15 modified for the local Ugandan context (14–16,19,20).
The Physical Health Summary score was estimated using the Medical Outcomes Survey-HIV score (22).
Heavy drinking was based on the 3-item heavy consumption subset of the Alcohol Use Disorders Identification Test - Consumption screen (23).
Viral load suppression was defined by an undetectable viral load at the nearest visit after 2 months of antiretroviral therapy. The limit of detection ranged from 400 to 20 copies/mL as the study progressed, depending on the assay available at the time of the study visit.
Lost to follow-up was defined as not having a study visit 550 days after antiretroviral therapy initiation or having withdrawn from the study before 2 years.
The number of missed visits before the last recorded study visit. 1 missed visit was added if the last study visit was >3.5 months before the two-year time endpoint of the analysis.
Efavirenz Use and Probable Depression
The crude incidence of first probable depression was 12.0 and 24.1 per 100 person-years for efavirenz and nevirapine-exposed groups, respectively (difference, −12.1 events per 100 person-years [CI, −17.2 to −6.9]; Table 2). In the adjusted GEE model, use of efavirenz was associated with a decreased odds of probable depression (adjusted odds ratio [AOR], 0.62 [95% confidence interval (CI), 0.40–0.96]; P=0.031), corresponding to an adjusted absolute risk difference of −3.1% (CI, −5.7 to −0.4; P=0.022) for efavirenz compared to nevirapine use. Similarly, in the adjusted Cox proportional hazards regression model, use of efavirenz was associated with a decreased hazard of depression (adjusted hazard ratio, 0.57 [CI, 0.36–0.91]; P=0.018; Figure 1).
Table 2.
Adjusted general estimating equation and Cox regression models for depression and suicidal ideation
| All participants | Excluding those with the outcome at baseline | |||||||
|---|---|---|---|---|---|---|---|---|
| Depression | Suicidal ideation | Depression | Suicidal ideation | |||||
| EFV | NVP | EFV | NVP | EFV | NVP | EFV | NVP | |
| Proportion of participants ever with outcome* (%) | 61/305 (20.0%) | 125/389 (32.1%) | 19/305 (6.2%) | 47/389 (12.1%) | 17/206 (8.3%) | 52/260 (20.0%) | 14/284 (4.9%) | 35/363 (9.6%) |
| Proportion of person-visits with outcome (%) | 105/1522 (6.9%) | 228/2332 (9.8%) | 24/1522 (1.6%) | 62/2332 (2.7%) | 24/1014 (2.4%) | 86/1586 (5.4%) | 16/1405 (1.1%) | 41/2195 (1.9%) |
| Events/PY† | 49/430.0 | 142/598.4 | 15/478.4 | 52/699.6 | 15/313.3 | 57/444.2 | 11/451.5 | 39/662.4 |
| Crude IR (events/100 PY) | 11.4 | 23.7 | 3.1 | 7.4 | 4.8 | 12.8 | 2.4 | 5.9 |
| Crude IR difference‡ (95% CI) | −12.3 (−17.4, −7.3) | −4.2 (−6.8, −1.5) | −8.0 (−12.2, −3.9) | −3.5 (−5.8, −1.1) | ||||
| Crude IRR, (exact 95% CI) | 0.48 (0.34, 0.67), P<0.001 | 0.42 (0.22, 0.76), P=0.002 | 0.37 (0.20, 0.67), P<0.001 | 0.41 (0.19, 0.82), P=0.006 | ||||
| Adjusted risk of outcome at a visit§ (95% CI) | 6.6% (4.7, 8.5) | 9.7% (8.2, 11.2) | 1.6% (0.7, 2.5%) | 2.5% (1.8, 3.2%) | 2.1% (0.8, 3.5) | 5.0% (3.7, 6.4) | 1.0% (0.3, 1.7) | 1.9% (1.2, 2.5) |
| Adjusted risk difference at a visit§ (95% CI) | −3.1% (−5.8, −0.4), P=0.023 | −0.91% (−2.1, 0.3), P=0.143 | −2.9% (−5.0, −0.1), P=0.007 | −0.9% (−2.0, 0.2), P=0.097 | ||||
| GEE logistic regression aOR∥ (95% CI) | 0.62 (0.40, 0.96), P=0.032 | 0.61 (0.30, 1.25), P=0.178 | 0.40 (0.18,0.87), P=0.020 | 0.50 (0.20,1.25), P=0.138 | ||||
| Cox regression aHR¶ (95% CI) | 0.56 (0.35, 0.89), P=0.013 | 0.47 (0.21, 1.07), P=0.072 | 0.38 (0.17, 0.83), P=0.015 | 0.47 (0.18, 1.22), P=0.121 | ||||
| Weighted marginal structural model aOR** (95% CI) | 0.42 (0.21, 0.81), P=0.010 | 0.54 (0.25, 1.19), P=0.126 | 0.43 (0.16, 1.21), P=0.112 | 0.37 (0.15, 0.89), P=0.026 | ||||
ART = antiretroviral therapy; EFV = efavirenz; NVP = nevirapine; PY = person-year; IR = incidence rate; CI = confidence interval; IRR = incidence rate ratio; GEE = generalized estimating equations; aOR = adjusted odds ratio; aHR = adjusted hazard ratio
Comparing participants in ever-EFV vs only-NVP groups
Attributed events and person-time accounting for time-varying exposure; corresponding measures that follow also account for time-varying exposure
All measures of effect and association comparing efavirenz use to nevirapine use
Adjusted risk and risk differences based on GEE model estimates
In GEE model, efavirenz use was treated as a time-varying exposure and adjusted for the following time-dependent covariates: age, sex, marital status, educational attainment, household asset ownership, CD4+ T-lymphocyte count, viral suppression, ART duration, health status, and heavy drinking; and the following time-independent covariates: year of enrollment, probable depression at enrollment, suicidal ideation at enrollment, and tuberculosis co-infection.
In Cox model, efavirenz use treated as a time-varying exposure and adjusted for the following baseline, time-independent covariates: age, sex, marital status, educational attainment, household asset ownership, CD4+ T-lymphocyte count, viral suppression, RT duration, health status, heavy drinking, year of enrollment, probable depression, suicidal ideation, and tuberculosis co-infection
See methods appendix for details on model specification
Figure 1.
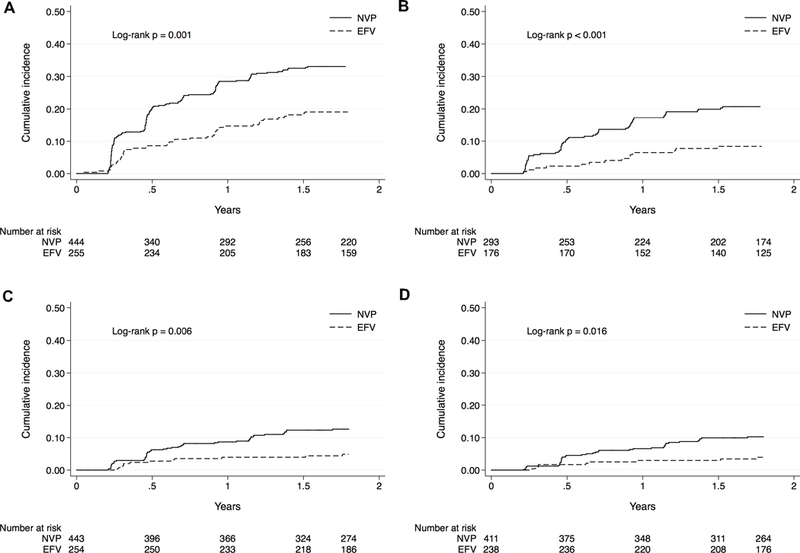
Unadjusted cumulative incidence curves for A. depression, B. depression restricted to those without baseline depression, C. suicidal ideation, and D. suicidal ideation restricted to those baseline suicidal ideation, EFV = time-varying efavirenz exposure; NVP = time-varying nevirapine exposure
Efavirenz Use and Suicidal Ideation
The crude incidence of first suicidal ideation was 3.3 and 7.5 per 100 person-years for efavirenz and nevirapine-exposed groups, respectively (difference, −4.2 events per 100 person-years [CI, −6.8 to −1.5]; Table 2). In the adjusted GEE model, use of efavirenz was not significantly associated with suicidal ideation (AOR, 0.61 [CI, 0.30–1.26]; P=0.180), corresponding to an adjusted absolute risk difference of −0.91% (CI, −2.1 to 0.3; P=0.145) for efavirenz compared to nevirapine use. Similarly, in the adjusted Cox proportional hazards regression model, use of efavirenz was not significantly associated with the hazard of suicidal ideation (adjusted hazard ratio, 0.50 [CI 0.22–1.13]; P=0.097; Figure 1).
Sensitivity analyses
Consistent with other models, in marginal structural models, use of efavirenz was significantly associated with a decreased odds of probable depression (weighted OR, 0.44 [CI, 0.23–0.83]; P=0.011; Table 2, Appendix “Results”) and was not significantly associated with suicidal ideation (weighted OR, 0.52 [CI, 0.35–1.18]; P=0.121).
The relationship between efavirenz use and probable depression or suicidal ideation was consistent in most sub-group analyses (Figures 2 and 3). Estimates for probable depression and suicidal ideation were also robust to various sensitivity analyses (Appendix “Results”; Appendix Table 1), including in analyses restricted to those with baseline probable depression (Appendix “Results”, Appendix Table 2).
Figure 2. Subgroup analysis for depression.
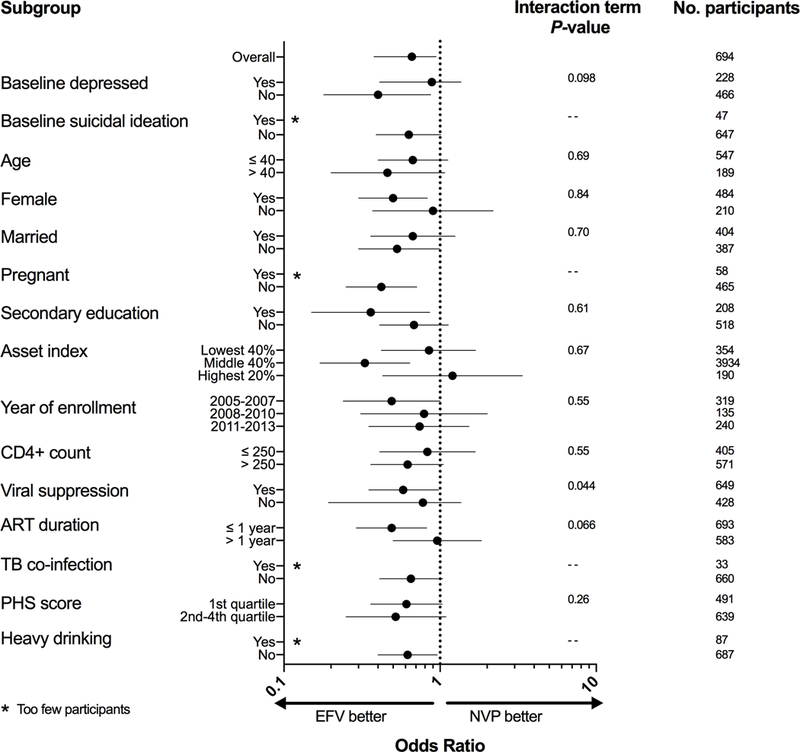
ART = antiretroviral; TB = tuberculosis; PHS = physical health summary; EFV = efavirenz; NVP = nevirapine, Odds ratio estimates from multivariable-adjusted generalized estimating equations logistic regression model
Figure 3. Subgroup analysis for suicidal ideation.
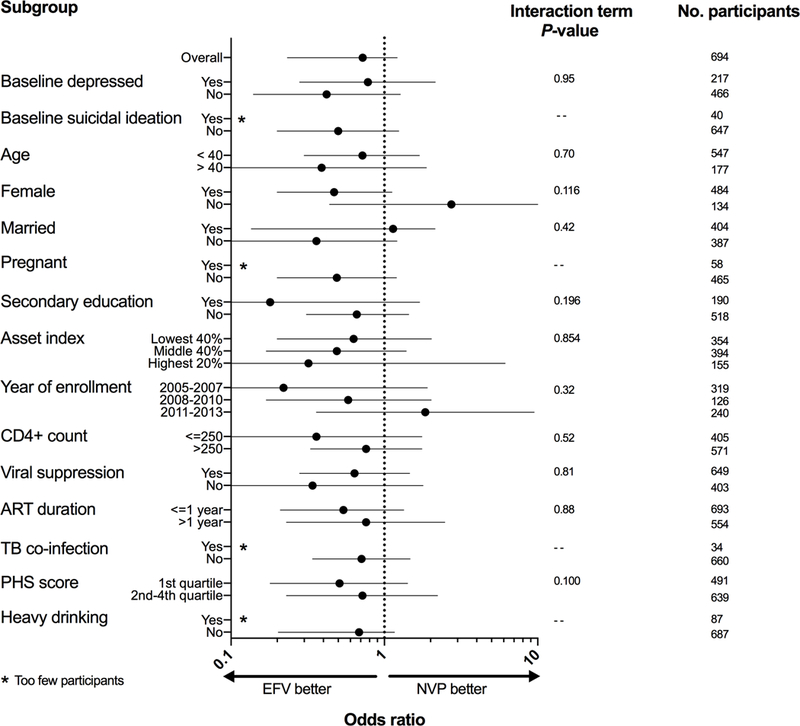
ART = antiretroviral; TB = tuberculosis; PHS = physical health summary; EFV = efavirenz; NVP = nevirapine, Odds ratio estimates from multivariable-adjusted generalized estimating equations logistic regression model
Based on estimates from our primary GEE model, E-value analyses showed that an unobserved confounder would need to have a strength of association of 3.51 with both efavirenz use and probable depression on the risk ratio scale to move our point estimate for the association of efavirenz use and depression (0.62) to a risk ratio of 1.27, and a strength of association of 1.98 to move the upper limit of our 95% confidence interval (0.96) to encapsulate the same risk ratio. For suicidal ideation, an unobserved confounder would need a strength of association of 3.58 to move our point estimate to the specified risk ratio, and 1.10 to move the 95% confidence interval to encapsulate the same risk ratio. E-values at other thresholds and for other models are presented in Appendix Table 3.
Discussion
We found no evidence that efavirenz use was associated with increased risk of probable depression or suicidal ideation among PLHIV initiating ART in rural Uganda. Our estimates unexpectedly showed that efavirenz use was associated with an approximately 40% decreased odds of probable depression and decreased hazard of time-to-first probable depression. These associations were robust to numerous sensitivity analyses and were corroborated by a marginal structural model accounting for potential time-varying confounding affected by prior treatment in cases where efavirenz was discontinued in patients with these symptoms. Moreover, our effect sizes were largely consistent across multiple demographic and clinical subgroups. Notably, efavirenz was not associated with increased risk of probable depression or suicidal ideation in participants with a baseline probable depression. Our findings offer compelling data that efavirenz is a safe option for first-line therapy in the region.
In a pooled analysis of trial data, Mollan et al found that, in contrast to our study, efavirenz use was associated with a two-fold increased hazard of suicidality in participants initiating ART, with 62 total first suicidality events reported in 9,916 person-years of observation time (2). The study found an increase of 6.25 suicidality events per 1,000 person-years with efavirenz use compared to other agents. Genetic differences in drug metabolism between Africans and Caucasians may partially explain the varied effects of efavirenz seen in these different populations. A recent study in Botswana found a high prevalence of the slow-metabolizing efavirenz phenotype and an unexpected association of this phenotype with a lower central nervous system toxicity score (26). However, this effect was measured at one month after ART initiation and not seen at 6 months. Nevertheless, studies associating slower efavirenz clearance with greater CNS toxicity have been conducted in predominantly Caucasian participants (27,28), whereas those done in participants of African ancestry have largely found no association (29–31). Efavirenz has also been shown to interact with multiple neurotransmitter pathways, and host genetic modulation of these pathways could lead to different phenotypic effects (32,33).
Differences in comparator ART regimens between studies could also be partially responsible. In Mollan et al, protease inhibitors were the comparator agents in 82% of the efavirenz-free regimens, whereas we compared efavirenz with nevirapine. There were also notable differences in methods of outcome assessment; we used the modified depression subscale of the Hopkins Symptom Checklist, a validated survey tool to directly query for depression and suicidal ideation, whereas Mollan et al retrospectively assessed suicidality via a combination of automated and in-person chart review. Finally, three out of the four trials in the analysis by Mollan et al were open-label, which makes the study susceptible to ascertainment bias, particularly in a trial setting. Though our study was an unblinded cohort study, clinic physicians prescribed ART separately from the structured assessment of depression and suicidal ideation, which was conducted in separate study offices by study staff.
Subsequent observational studies in the US following the study by Mollan et al have also found no association between efavirenz use and suicidality, though most are limited by the potential for channeling bias or time-varying confounding (4–7). One systematic review of forty-two randomized trials did not find any difference in the risk of central nervous system adverse events or suicidal ideation with efavirenz use (34). A single clinical trial in ART-experienced participants comparing efavirenz versus a protease inhibitor-based regimen did not find an association between efavirenz use and depressive symptoms (35). Similarly, a cross-sectional study in Senegal did not identify a difference in crude prevalence of depressive symptom score between efavirenz and protease inhibitor users (36). In our analysis, we attempted to account for channeling bias with sensitivity analyses excluding group of patients for which efavirenz might be preferentially prescribed (i.e., participants with tuberculosis co-infection or pregnancy) or avoided (i.e., those with baseline depression or suicidal ideation). We also fit a marginal structural model that accounted for both potential channeling bias and time-varying confounding. Moreover, in our cohort, neither baseline nor time-updated probable depression or suicidal ideation predicted efavirenz use. This finding was not unexpected given the rarity of depression or suicidal ideation screening in routine clinical practice in the region, where clinics remain largely focused on ART provision and opportunistic infection management and prevention.
Limitations
We recognize the potential for unobserved confounding to explain the estimated associations. We attempted to address this source of bias by using multiple types of models, model specifications, methods of adjustment, and exposure definitions; all models resulted in similar effect size estimates. We also performed E-value analyses to show how strong an unobserved confounder would need to be in order to move our estimates to and 95% confidence intervals to encompass a risk ratio of 1.27. Notably, E-value analyses only account for unmeasured confounding and do not address other forms of potential bias, including selection bias, measurement error, and bias caused by missing data. We identified substantial differences between ever-efavirenz and only-nevirapine users by year of ART initiation, which could potentially confound the association of efavirenz use and our outcomes. To account for this, we adjusted for year of enrollment in our analyses, described crude incidence of depression and suicidal ideation by time period, conducted adjusted stratified analyses by time period, and performed tests to assess for differences in crude and adjusted associations of efavirenz with our outcomes over time, which were not significant. Another limitation is the use of a self-reported depression screen to measure our outcomes of interest. This screening instrument, however, has been validated in our patient population (14–18) and tends to be overly sensitive and not responsible for under-reporting; we documented no suicides among the 17 deaths observed in follow-up. The receipt of ART regimen prescriptions was also self-reported and thus susceptible to reporter bias. Finally, as this is an observational study, our findings should be corroborated by a well-designed randomized control trial.
Summary
In summary, our study is the first to detect a statistically significant, unexpected inverse association between efavirenz use and depression. These data offer preliminary evidence of possible regional differences in efavirenz tolerability. Further work is needed to confirm these results, establish consistency in other sub-populations, and to elucidate possible genetic or environmental factors that could account for regional differences in efavirenz tolerability. We look forward to results of the ADVANCE study (NCT03122262), which is randomizing patients in South Africa to efavirenz versus dolutegravir-based ART regimens with a focus on safety and tolerability (37), to add to our work and elucidate optimal HIV treatment options in the region.
Supplementary Material
Acknowledgments
Funding Sources: National Institutes of Health (R01 MH054907, U01 CA066529, K23 MH099916), University of California, San Francisco - Gladstone Center for AIDS Research (P30AI027763), Harvard Center for AIDS Research (P30AI060354), Doris Duke Charitable Foundation
Appendix
Figure 1. Flow diagram for selecting final sample.
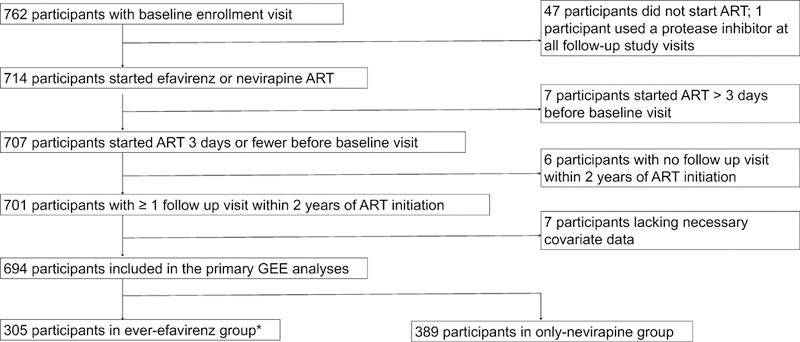
ART = antiretroviral therapy, *The ever-efavirenz group included participants who met criteria for efavirenz exposure for at least one follow-up visit in study period; the only- nevirapine group included participants who did not meet criteria for efavirenz exposure in any follow-up visits in study period and any nevirapine use in the last 90 days prior to every follow-up visit
Appendix Table 1.
Sensitivity analyses for GEE and Cox models
| Analysis | Depression | Suicidal ideation | ||||||||||
|---|---|---|---|---|---|---|---|---|---|---|---|---|
| GEE | Cox | GEE | Cox | |||||||||
|
AOR (95% CI) |
P-value | N |
AHR (95% CI) |
P- value |
N |
AOR (95% CI) |
P-value | N |
AHR (95% CI) |
P- value |
N | |
| Primary | 0.62 (0.40–0.96) |
0.032 | 694 | 0.56 (0.35–0.89) |
0.013 | 654 | 0.61 (0.30–1.25) |
0.178 | 694 | 0.47 (0.21–1.07) |
0.072 | 654 |
| Excluding baseline probable depression | 0.40 (0.18–0.87) |
0.020 | 466 | 0.38 (0.17, 0.83) |
0.015 | 473 | -- | -- | -- | -- | -- | -- |
| Excluding baseline suicidal ideation | -- | -- | -- | -- | -- | - | 0.50 (0.20–1.25) |
0.138 | 648 | 0.47 (0.18, 1.22) |
0.121 | 609 |
| Excluding some EFV use* | 0.55 (0.35–0.88) |
0.012 | 692 | 0.55 (0.34–0.89) |
0.015 | 643 | 0.55 (0.26–1.15) |
0.111 | 692 | 0.39 (0.16–0.91) |
0.029 | 645 |
| Excluding those with tuberculosis co-infection | 0.65 (0.41–1.04) |
0.072 | 660 | 0.61 (0.38–0.98) |
0.040 | 622 | 0.71 (0.34–1.47) |
0.36 | 660 | 0.56 (0.25–1.28) |
0.168 | 622 |
| Excluding pregnant women, restricted to females | 0.49 (0.29–0.83) |
0.008 | 394 | 0.58 (0.33–0.99) |
0.048 | 378 | 0.41 (0.15–1.11) |
0.078 | 394 | 0.34 (0.12–1.03) |
0.056 | 378 |
| Missing visits imputed as positive for depression or suicidal ideation† | 0.54 (0.42–0.71) |
< 0.001 | 694 | -- | -- | -- | 0.55 (0.41–0.73) |
< 0.001 | 694 | -- | -- | -- |
| Missing visits imputed as negative for depression or suicidal ideation | 0.73 (0.48, 1.12) |
0.153 | 694 | -- | -- | -- | 0.69 (0.34, 1.41) |
0.310 | 694 | -- | -- | -- |
| Lost to follow-up‡ coded as positive for depression or suicidal ideation at last visit | 0.61 (0.40–0.91) |
0.015 | 694 | 0.58 (0.38, 0.87) |
0.008 | 654 | 0.62 (0.34–1.12) |
0.114 | 694 | 0.53 (0.30, 0.93) |
0.026 | 654 |
| Lost to follow-up coded as negative for depression or suicidal ideation at last visit§ | 0.62 (0.40, 0.97) |
0.038 | 694 | -- | -- | -- | 0.51 (0.20–1.27) | 0.149 | 694 | -- | -- | -- |
| Limiting analysis to 1 year after ART initiation | 0.52 (0.31–0.87) |
0.013 | 693 | 0.52 (0.31–0.87) |
0.013 | 652 | 0.53 (0.21–1.34) |
0.181 | 693 | 0.52 (0.20–1.36) |
0.184 | 652 |
| Extending analysis to full follow-up period of study | 0.73 (0.51–1.03) |
0074 | 699 | 0.77 (0.53–1.11) |
0.162 | 658 | 0.52 (0.28–0.96) |
0.037 | 699 | 0.44 (0.23–0.84) |
0.013 | 658 |
| Including a spline term for ART duration∥ | 0.64 (0.41–0.98) |
0.042 | 694 | -- | -- | -- | 0.57 (0.28–1.15) |
0.117 | 694 | -- | -- | -- |
| Including term for internalized stigma score¶ | 0.58 (0.35–0.96) |
0.035 | 640 | 0.50 (0.26–0.94) |
0.032 | 380 | 0.60 (0.27–1.33) |
0.21 | 640 | 0.44 (0.17–1.16) |
0.096 | 380 |
GEE = generalized estimating equation; AOR = adjusted odds ratio; AHR = adjusted hazard ratio; N = sample size; EFV = efavirenz; ART = antiretroviral therapy
Some EFV use is defined as a prescription of EFV in the previous 90 days but not meeting the criteria for EFV exposure (receipt of an EFV prescription in the 60 out of previous 90 days and previous 7 days)
Missing visits were filled in between observed visits for the 694 participants in the primary analysis. 1 missed visit was also added after the last recorded visit if the last recorded visit was >3.5 months before the end of the two year study. Exposure and covariate values for missing visits were imputed using a last observation carried forward approach.
Lost to follow-up was defined as a participant whose last visit within two years was 550 days or fewer after ART initiation
This sensitivity analysis was not done for the Cox model, as the analysis would be the same as that of the primary Cox model
ART duration was fit as a natural cubic spline with knots at the 5th, 25th, 50th, 75th, and 95th percentiles
The Internalized AIDS-related stigma score (40) was defined as a continuous covariate (range 0–6).
Appendix Table 2.
Change in Hopkins Symptom Checklist depression subscale score from baseline restricted to those with baseline depression*
| Time point |
Number of
participants depressed at baseline with follow-up data |
Crude change
in depression score from baseline, mean (SD) |
Coefficient for change
in depression score from baseline* (EFV compared to NVP) (95% CI) |
P-value | ||
|---|---|---|---|---|---|---|
| EFV | NVP | EFV | NVP | |||
| 3 months | 72 | 100 | −0.81 (0.53) |
−0.62 (0.52) |
−0.21 (−0.42, 0.00) | 0.053 |
| 6 months | 74 | 118 | −0.90 (0.53) |
−0.71 (0.56) |
−0.18 (−0.37, 0.00) | 0.049 |
EFV = efavirenz at baseline; NVP = nevirapine at baseline; SD = standard deviation; CI = confidence interval
Adjusted for following baseline, time-independent covariates: suicidal ideation, age, sex, marital status, educational attainment, asset index, year of enrollment, baseline log viral load, tuberculosis infection, heavy drinking, and health status score
Appendix Table 3.
E-value analyses for different risk ratio thresholds
| E-values* for depression | E-values for suicidal ideation | |||||
|---|---|---|---|---|---|---|
| Reference risk ratio | 1.0 | 1.27 | 2.28† | 1.0 | 1.27 | 2.28 |
| GEE | 2.61 (1.25) | 3.51 (1.98) | 6.82 (4.18) | 2.66 (1.00) | 3.58 (1.14) | 6.94 (3.05) |
| Cox | 2.97 (1.50) | 3.96 (2.21) | 7.61 (4.56) | 3.68 (1.00) | 4.85 (1.66) | 9.17 (3.68) |
| MSM | 4.19 (1.77) | 5.50 (2.51) | 10.33 (5.07) | 3.11 (1.00) | 4.13 (1.34) | 7.91 (3.24) |
GEE = generalized estimating equations logistic regression model; Cox = Cox proportional hazards regression model; MSM = marginal structural model
Please see Table 2 for the results of the three models. E-values are given in the following format: e-value for estimate (e-value for upper confidence interval). The E-value denotes the minimum strength of association, on the risk ratio scale, that would be required for an unobserved confounder to have with both the exposure and outcome, conditional on the measured covariates, in order to move an estimate to a certain risk ratio or the upper limit of a confidence interval to encapsulate this risk ratio.
Estimated adjusted hazard ratio for suicidal ideation or attempted/completed suicide in Mollan et al (2).
Appendix Table 4.
Factors associated with initiation of efavirenz as compared to nevirapine in marginal structural models
| Variable | Adjusted OR* (95% CI) | P-value |
|---|---|---|
| Baseline covariates | ||
| Age | ||
| ≤ 30 | REF | -- |
| 31–40 | 1.04 (0.66–1.63) | 0.87 |
| 41–50 | 1.14 (0.63–2.08) | 0.66 |
| > 50 | 1.31 (0.53–3.23) | 0.56 |
| Female | 0.81 (0.52–1.27) | 0.36 |
| Married | 1.01 (0.67–1.51) | 0.98 |
| Education | ||
| None | REF | -- |
| Some primary | 0.64 (0.36–1.14) | 0.136 |
| Completed primary | 0.90 (0.46–1.74) | 0.75 |
| Secondary or higher | 0.80 (0.42–1.51) | 0.49 |
| Asset index | ||
| 1st quintile (most poor) | REF | -- |
| 2nd quintile | 0.87 (0.07–10.91) | 0.91 |
| 3rd quintile | 0.26 (0.01–4.91) | 0.37 |
| 4th quintile | 0.42 (0.03–6.29) | 0.53 |
| 5th quintile (least poor) | 0.08 (0.004–1.52) | 0.093 |
| Year of enrollment | ||
| 2005–07 | REF | -- |
| 2008–10 | 1.09 (0.63–1.89) | 0.76 |
| 2011–13 | 28.66 (16.76–49.01) | < 0.001 |
| Depressed at enrollment | 0.91 (0.37–2.25) | 0.84 |
| Suicidal ideation at enrollment | 2.46 (0.61, 9.91) | 0.21 |
| Baseline CD4+ count (100 cells/μL) | 2.01 (1.46–2.77) | < 0.001 |
| Tuberculosis co-infection | 6.60 (3.34–13.06) | < 0.001 |
| Physical health summary score | ||
| 1st quartile (least healthy) | REF | -- |
| 2nd quartile | 1.65 (0.72–3.81) | 0.24 |
| 3rd quartile | 2.04 (0.74–5.66) | 0.169 |
| 4th quartile (most healthy) | 3.23 (1.05–9.96) | 0.041 |
| Heavy drinking | 1.40 (0.56–3.51) | 0.48 |
| Time-varying covariates | ||
| Previous asset index | ||
| 1st quintile (most poor) | REF | -- |
| 2nd quintile | 1.06 (0.08–13.33) | 0.97 |
| 3rd quintile | 3.02 (0.16–55.95) | 0.46 |
| 4th quintile | 2.47 (0.16–37.52) | 0.52 |
| 5th quintile (least poor) | 21.42 (1.18–387.97) | 0.038 |
| Previous depression | 1.50 (0.60–3.77) | 0.39 |
| Previous suicidal ideation | 0.48 (0.11–2.13) | 0.33 |
| Previous CD4+ count | 0.54 (0.39–0.74) | < 0.001 |
| Previous viral load suppression | 0.16 (0.08–0.32) | < 0.001 |
| Previous heavy drinking | 0.88 (0.33–2.37) | 0.81 |
| Previous physical health summary score | ||
| 1st quartile (least healthy) | REF | -- |
| 2nd quartile | 0.41 (0.18–0.94) | 0.036 |
| 3rd quartile | 0.38 (0.14–1.02) | 0.055 |
| 4th quartile (most healthy) | 0.28 (0.09–0.85) | 0.025 |
| ART duration (weeks) | 1.04 (0.88–1.21) | 0.66 |
OR = odds ratio; CD4+ = CD4+ T-cell lymphocyte; ART = antiretroviral therapy
OR > 1 favors initiation of EFV;
OR < 1 favors initiation of NVP
Appendix Table 5.
Effect of efavirenz use on risk of suicidal ideation or depression, under progressive truncation of overall stabilized weights for marginal structural models
| Truncation | Estimated weights | Depression | Suicidal ideation | |||
|---|---|---|---|---|---|---|
| percentiles (%) | Mean (SD) | Min/max | AOR (95% CI) | P-value | AOR (95% CI) | P-value |
| 0, 100 | 0.997 (0.359) | 0.050/6.244 | 0.42 (0.21–0.81) | 0.010 | 0.54 (0.25–1.19) | 0.126 |
| 1, 99 | 0.979 (0.165) | 0.322/1.746 | 0.48 (0.24–0.92) | 0.028 | 0.58 (0.26–1.28) | 0.176 |
| 5, 95 | 0.979 (0.086) | 0.736/1.143 | 0.53 (0.29–0.98) | 0.043 | 0.58 (0.27–1.22) | 0.150 |
| 10, 90 | 0.984 (0.055) | 0.884/1.072 | 0.54 (0.30–0.99) | 0.045 | 0.57 (0.27–1.19) | 0.136 |
SD = standard deviation; AOR = adjusted odds ratio
Appendix Table 6.
Associations of other covariates and depression and suicidal ideation in GEE and Cox models
| Variable | Depression | Suicidal Ideation | ||||||
|---|---|---|---|---|---|---|---|---|
|
GEE AOR* (95% CI) |
P-value |
Cox AHR† (95% CI) |
P-value |
GEE AOR
(95% CI) |
P-value |
Cox*
AHR
(95% CI) |
P-value | |
| Demographics | ||||||||
| Age | ||||||||
| ≤ 30 | REF | -- | REF | -- | REF | -- | REF | -- |
| 31–40 | 1.09 (0.75–1.57) | 0.66 | 1.07 (0.75–1.53) | 0.70 | 1.67 (0.94–2.96) | 0.080 | 1.56 (0.86, 2.83) | 0.141 |
| 41–50 | 1.47 (0.93–2.33) | 0.096 | 1.73 (1.09–2.75) | 0.021 | 1.42 (0.67–3.02) | 0.362 | 1.46 (0.62, 3.40) | 0.38 |
| > 50 | 1.57 (0.78–3.19) | 0.21 | 1.00 (0.39–2.58) | > 0.99 | 1.51 (0.46–4.97) | 0.50 | 0.61 (0.08, 4.75) | 0.64 |
| Female | 1.97 (1.26–3.08) | 0.003 | 2.36 (1.48–3.74) | < 0.001 | 1.82 (0.90–3.70) | 0.097 | 2.17 (0.99, 4.73) | 0.052 |
| Married | 1.15 (0.84–1.58) | 0.38 | 1.17 (0.84–1.63) | 0.34 | 0.96 (0.59–1.56) | 0.86 | 1.04 (0.61, 1.78) | 0.88 |
| Education | ||||||||
| None | REF | -- | REF | -- | REF | -- | REF | -- |
| Some primary | 1.01 (0.66–1.54) | 0.98 | 1.13 (0.72–1.77) | 0.61 | 0.97 (0.49–1.92) | 0.94 | 0.90 (0.42, 1.95) | 0.79 |
| Completed primary | 0.69 (0.41–1.18) | 0.176 | 0.74 (0.42–1.31) | 0.31 | 0.73 (0.32–1.67) | 0.46 | 0.79 (0.31, 1.99) | 0.62 |
| Secondary or higher | 0.69 (0.41–1.16) | 0.157 | 0.83 (0.49–1.41) | 0.49 | 0.63 (0.27–1.47) | 0.28 | 0.69 (0.28, 1.74) | 0.43 |
| Asset index | ||||||||
| 1st quintile (most poor) | REF | -- | REF | -- | REF | -- | REF | -- |
| 2nd quintile | 1.09 (0.73–1.63) | 0.67 | 0.95 (0.60–1.49) | 0.81 | 0.86 (0.45–1.65) | 0.64 | 0.97 (0.45, 2.06) | 0.93 |
| 3rd quintile | 1.18 (0.76–1.81) | 0.46 | 0.91 (0.57–1.46) | 0.70 | 0.92 (0.45–1.90) | 0.83 | 0.89 (0.38, 2.07) | 0.78 |
| 4th quintile | 0.94 (0.59–1.50) | 0.79 | 0.90 (0.55–1.47) | 0.67 | 1.02 (0.50–2.08) | 0.95 | 1.32 (0.60, 2.89) | 0.49 |
| 5th quintile (least poor) | 0.75 (0.43–1.30) | 0.30 | 0.69 (0.40–1.20) | 0.192 | 0.51 (0.19–1.33) | 0.169 | 0.65 (0.24, 1.76) | 0.40 |
| Year of enrollment | ||||||||
| 2005–07 | REF | -- | REF | -- | REF | -- | REF | -- |
| 2008–10 | 0.88 (0.58–1.33) | 0.53 | 0.91 (0.61–1.35) | 0.64 | 1.51 (0.86–2.65) | 0.153 | 1.53 (0.84, 2.79) | 0.161 |
| 2011–13 | 1.02 (0.61–1.73) | 0.94 | 0.82 (0.48–1.40) | 0.47 | 1.13 (0.48–2.68) | 0.78 | 0.91 (0.36, 2.29) | 0.84 |
| Clinical characteristics | ||||||||
| Suicidal ideation at enrollment | 2.14 (1.31–3.48) | 0.002 | 1.50 (0.95–2.37) | 0.085 | 6.22 (3.49–11.11) | < 0.001 | 4.17 (2.16, 8.04) | < 0.001 |
| Depressed at enrollment | 4.04 (2.88–5.66) | < 0.001 | 3.81 (2.71–5.37) | < 0.001 | 1.77 (1.05–2.99) | 0.033 | 1.84 (1.02, 3.33) | 0.042 |
| CD4+ count (100 cells/μL) | 1.05 (0.97–1.14) | 0.25 | 1.10 (0.98–1.24) | 0.098 | 1.02 (0.88–1.19) | 0.78 | 1.16 (0.95, 1.41) | 0.149 |
| Viral load suppressed | 0.90 (0.67–1.20) | 0.48 | 0.95 (0.77–1.16) | 0.60 | 1.02 (0.60–1.74) | 0.94 | 1.00 (0.69, 1.43) | 0.99 |
| ART duration (in weeks) | 0.99 (0.98–0.99) | < 0.001 | -- | -- | 0.98 (0.97–0.99) | 0.001 | -- | -- |
| Tuberculosis co-infection | 1.45 (0.73–2.89) | 0.29 | 1.44 (0.74–2.77) | 0.28 | 0.44 (0.10–1.99) | 0.28 | 0.72 (0.17, 3.03) | 0.66 |
| Physical health summary score | ||||||||
| 1st quartile (least healthy) | REF | -- | REF | -- | REF | -- | REF | -- |
| 2nd quartile | 0.26 (0.18–0.37) | < 0.001 | 0.81 (0.48–1.39) | 0.45 | 0.32 (0.16–0.62) | 0.001 | 1.59 (0.77, 3.29) | 0.21 |
| 3rd quartile | 0.25 (0.17–0.37) | < 0.001 | 0.48 (0.22–1.06) | 0.071 | 0.45 (0.23–0.88) | 0.019 | 0.57 (0.17, 1.90) | 0.36 |
| 4th quartile (most healthy) | 0.35 (0.24–0.52) | < 0.001 | 1.88 (1.02–3.49) | 0.044 | 0.35 (0.16–0.73) | 0.005 | 1.42 (0.47, 4.32) | 0.53 |
| Heavy drinking | 0.52 (0.22–1.19) | 0.122 | 1.12 (0.75–1.68) | 0.54 | 1.89 (0.70–5.07) | 0.21 | 1.38 (0.70, 2.71) | 0.35 |
| Exposure to EFV vs. NVP | 0.62 (0.40–0.96) | 0.032 | 0.56 (0.35–0.89) | 0.013 | 0.61 (0.30–1.25) | 0.179 | 0.47 (0.21–1.07) | 0.072 |
GEE = generalized estimating equation; AOR = adjusted odds ratio; AHR = adjusted hazard ratio; CI = confidence interval; EFV = efavirenz; CD4+ = CD4+ T-cell lymphocyte; ART = antiretroviral therapy
Adjusted for every other covariate displayed in table
Viral load suppression covariate was replaced by the log10 baseline viral load in the Cox regression model
Appendix Table 7.
Descriptive statistics for depression stratified by years of enrollment
| All participants | ||||||
| 2005–2007 | 2008–2010 | 2011–2013 | ||||
| EFV | NVP | EFV | NVP | EFV | NVP | |
| Proportion of participants ever
with depression (%) |
14/68 (21%) | 90/251 (36%) | 10/32 (31%) | 26/103 (25%) | 37/205 (18%) | 9/35 (26%) |
| Proportion of person-visits
with depression (%) |
26/415 (6.3%) | 164/1536 (11%) | 24/212 (11%) | 51/640 (8.0%) | 55/895 (6.1%) | 13/156 (8.3%) |
| Events/PY | 7/74.5 | 99/362.5 | 5/34.8 | 32/161.5 | 37/320.7 | 11/74.4 |
| Crude IR (events/100 PY) | 9.4 | 27.3 | 14.4 | 19.8 | 0.11 | 0.15 |
| Crude IR difference* (95% CI) | −17.9 (−26.7, −9.1) | −5.4 (−19.8, 8.9) | −3.3 (−12.8, 6.2) | |||
| Crude IRR, (exact 95% CI) | 0.34 (0.13, 0.74) | 0.73 (0.22, 1.88) | 0.78 (0.39, 1.70) | |||
| Excluding participants with pre-ART depression | ||||||
| 2005–2007 | 2008–2010 | 2011–2013 | ||||
| EFV | NVP | EFV | NVP | EFV | NVP | |
| Proportion of participants ever
with depression (%) |
2/41 (4.9%) | 34/156 (22%) | 3/18 (17%) | 13/79 (16%) | 12/147 (8.2%) | 5/25 (20%) |
| Proportion of person-visits
with depression (%) |
3/248 (1.2%) | 57/981 (5.8%) | 8/124 (6.5%) | 22/490 (4.5%) | 13/642 (2.0%) | 7/115 (6.1%) |
| Events/PY | 1/46.0 | 36/256.0 | 2/22.1 | 14/131.6 | 12/245.1 | 7/56.6 |
| Crude IR (events/100 PY) | 2.2 | 14.1 | 9.0 | 10.6 | 4.9 | 12.4 |
| Crude IR difference (95% CI) | −11.9 (−18.2, −5.6) | −1.6 (−15.3, 12.1) | −7.5 (−17.0, 2.1) | |||
| Crude IRR, (exact 95% CI) | 0.15 (0.00, 0.92) | 0.85 (0.09, 3.70) | 0.40 (0.14, 1.19) | |||
*All incidence rate differences and incidence rate ratios are given as comparing use of efavirenz vs. use of nevirapine
EFV = efavirenz; NVP = nevirapine; PY = person-years; IR = incidence rate; IRR = incidence rate ratio; CI = confidence interval; ART = antiretroviral therapy
Appendix Table 8.
Descriptive statistics for suicidal ideation stratified by years of enrollment
| All participants | ||||||
| 2005–2007 | 2008–2010 | 2011–2013 | ||||
| EFV | NVP | EFV | NVP | EFV | NVP | |
| Proportion of participants ever with suicidal ideation (%) | 1/68 (1.5%) | 31/251 (12%) | 5/32 (16%) | 15/103 (15%) | 13/205 (6.3%) | 1/35 (2.9%) |
| Proportion of person-visits with suicidal ideation (%) | 1/415 (0.2%) | 43/1536 (2.8%) | 9/212 (4.2%) | 18/640 (2.8%) | 14/895 (1.6%) | 1/156 (0.6%) |
| Events/PY | 1/89.3 | 31/436.4 | 1/39.4 | 19/180.5 | 13/350.8 | 2/82.7 |
| Crude IR (events/100 PY) | 1.1 | 7.1 | 2.5 | 10.5 | 3.7 | 2.4 |
| Crude IR difference* (95% CI) | −6.0 (−9.3, −2.7) | −8.0 (−14.9, −1.1) | 1.3 (−2.6, 5.2) | |||
| Crude IRR, (exact 95% CI) | 0.16 (0.00, 0.95) | 0.24 (0.01, 1.51) | 1.53 (0.35, 14.00) | |||
| Excluding participants with pre-ART suicidal ideation | ||||||
| 2005–2007 | 2008–2010 | 2011–2013 | ||||
| EFV | NVP | EFV | NVP | EFV | NVP | |
| Proportion of participants ever with suicidal ideation (%) | 1/64 (1.6%) | 21/232 (9.1%) | 3/26 (12%) | 13/98 (13%) | 10/194 (5.2%) | 1/33 (3.3%) |
| Proportion of person-visits with suicidal ideation (%) | 1/387 (0.3%) | 27/1436 (1.9%) | 5/173 (2.9%) | 13/611 (2.1%) | 10/845 (1.2%) | 1/148 (0.7%) |
| Events/PY | 1/84.9 | 21/412.0 | 0/32.9 | 16/171.2 | 10/334.9 | 2/79.2 |
| Crude IR (events/100 PY) | 1.2 | 5.1 | 0.0 | 9.3 | 3.0 | 2.5 |
| Crude IR difference (95% CI) | −3.9 (−7.1, −0.7) | −9.3 (−13.9, −4.8) | 0.00 (−3.5, 4.4) | |||
| Crude IRR, (exact 95% CI) | 0.23 (0.01, 1.44) | 0.00 (0.00, 1.35) | 1.18 (0.25, 11.09) | |||
All incidence rate differences and incidence rate ratios are given as comparing use of efavirenz vs. use of nevirapine
EFV = efavirenz; NVP = nevirapine; PY = person-years; IR = incidence rate; IRR = incidence rate ratio; CI = confidence interval; ART = antiretroviral therapy
Appendix Table 9.
Pooled (crude) and common IRR after stratification by the year of enrollment
| Pooled IRR | Common IRR* | Mantel Haenzsel test of homogeneity p-value |
|
|---|---|---|---|
| Depression | |||
| All participants | 0.48 (0.34, 0.67) | 0.54 (0.34, 0.84) | 0.24 |
| Excluding baseline
depressed |
0.37 (0.20, 0.67) | 0.36 (0.20, 0.67) | 0.37 |
| Suicidal ideation | |||
| All participants | 0.42 (0.22, 0.76) | 0.40 (0.16, 1.03) | 0.122 |
| Excluding baseline
suicidal |
0.41 (0.19, 0.82) | 0.35 (0.11, 1.09) | 0.27 |
IRR = incidence rate ratio
The common IRR was produced by combining Mantel Haenzsel-weighted stratum-specific IRRs (the strata combined were the three strata for year of enrollment)
Appendix Table 10.
Amount of missing data for outcomes and covariates
| Variable* | Number of missing values (% of total visits) |
|---|---|
| Time-varying depression outcome | 1 (0.0%) |
| Time-varying suicidal ideation outcome | 2 (0.0%) |
| Baseline depression | 0 (0.0%) |
| Baseline suicidal ideation | 7 (0.2%) |
| Time-varying CD4+ count | 165 (3.9%) |
| Time-varying viral suppression | 267 (6.3%) |
| Time-varying ART duration | 0 (0.0%) |
| Time-fixed tuberculosis coinfection | 0 (0.0%) |
| Time-fixed year of enrollment | 0 (0.0%) |
| Time-varying health status | 25 (0.6%) |
| Time-varying heavy drinking | 68 (1.6%) |
CD4+ = CD4+ T-cell lymphocyte; ART = antiretroviral therapy
Demographic variables not shown as missing values were imputed
Footnotes
Registration: NCT01596322
References
- 1.Nelson LJ, Beusenberg M, Habiyambere V, Shaffer N, Vitoria M a, Montero RG, et al. Adoption of national recommendations related to use of antiretroviral therapy before and shortly following the launch of the 2013 WHO consolidated guidelines. AIDS [Internet]. 2014;28 Suppl 2:S217–24. Available from: http://www.ncbi.nlm.nih.gov/pubmed/24849481 [DOI] [PubMed] [Google Scholar]
- 2.Mollan KR, Smurzynski M, Eron JJ, Daar ES, Campbell TB, Sax PE, et al. Association between efavirenz as initial therapy for HIV-1 infection and increased risk for suicidal ideation or attempted or completed suicide: An analysis of trial data. Ann Intern Med. 2014;161(1):1–10. [DOI] [PMC free article] [PubMed] [Google Scholar]
- 3.Kenedi CA, Goforth HW. A systematic review of the psychiatric side-effects of efavirenz. AIDS Behav. 2011;15(8):1803–18. [DOI] [PubMed] [Google Scholar]
- 4.Nkhoma ET, Coumbis J, Farr AM, Johnston SS, Chu BC, Rosenblatt LC, et al. No Evidence of an Association Between Efavirenz Exposure and Suicidality Among HIV Patients Initiating Antiretroviral Therapy in a Retrospective Cohort Study of Real World Data. Medicine (Baltimore). 2016;95(3):e2480. [DOI] [PMC free article] [PubMed] [Google Scholar]
- 5.Napoli AA, Wood JJ, Coumbis JJ, Soitkar AM, Seekins DW, Tilson HH. No evident association between efavirenz use and suicidality was identified from a disproportionality analysis using the faers database. J Int AIDS Soc. 2014;17:1–4. [DOI] [PMC free article] [PubMed] [Google Scholar]
- 6.Smith C, Ryom L, Monforte A d’Arminio, Reiss P, Mocroft A, El-Sadr W, et al. Lack of association between use of efavirenz and death from suicide: evidence from the D:A:D study. J Int AIDS Soc [Internet]. 2014;17(4 Suppl 3):19512 Available from: http://www.pubmedcentral.nih.gov/articlerender.fcgi?artid=4224932&tool=pmcentrez&rendertype=abstract [DOI] [PMC free article] [PubMed] [Google Scholar]
- 7.Bengtson AM, Pence BW, Mollan KR, Edwards JK, Moore RD, O’Cleirigh C, et al. The relationship between efavirenz as initial antiretroviral therapy and suicidal thoughts among HIV-infected adults in routine care. JAIDS J Acquir Immune Defic Syndr [Internet]. 2017;1 Available from: http://insights.ovid.com/crossref?an=00126334-900000000-96883 [DOI] [PMC free article] [PubMed] [Google Scholar]
- 8.Arg M, Tietjen I, Gatonye T, Ngwenya BN, Namushe A, Simonambanga S, et al. Guidelines for the Use of Antiretroviral Agents in HIV-1-Infected Adults and Adolescents Developed by the DHHS Panel on Antiretroviral Guidelines for Adults. J Ethnopharmacol [Internet]. 2016;5(January):512–3. Available from: [Google Scholar]
- 9.World Health Organization. Consolidated guidelines on the use of antiretroviral drugs for treating and preventing HIV infection: recommendations for a public health approach. World Heal Organ. 2016;155 p. [PubMed] [Google Scholar]
- 10.UNAIDS. Global AIDS Update 2016. World Heal Organ [Internet]. 2016;(March):422 Available from: http://www.unaids.org/sites/default/files/media_asset/UNAIDS_Gap_report_en.pdf
- 11.Tsai AC. Reliability and validity of depression assessment among persons with HIV in sub-Saharan Africa: systematic review and meta-analysis. J Acquir Immune Defic Syndr [Internet]. 2014;66(5):503–11. Available from: http://www.pubmedcentral.nih.gov/articlerender.fcgi?artid=4096047&tool=pmcentrez&rendertype=abstract [DOI] [PMC free article] [PubMed] [Google Scholar]
- 12.Tsai AC, Weiser SD, Petersen ML, Ragland K, Kushel MB, Bangsberg DR. A marginal structural model to estimate the causal effect of antidepressant medication treatment on viral suppression among homeless and marginally housed persons with HIV. Arch Gen Psychiatry [Internet]. 2010;67(12):1282–90. Available from: 10.1001/archgenpsychiatry.2010.160 [DOI] [PMC free article] [PubMed] [Google Scholar]
- 13.Todd JV, Cole SR, Pence BW, Lesko CR, Bacchetti P, Cohen MH, et al. Effects of Antiretroviral Therapy and Depressive Symptoms on All-Cause Mortality among HIV-Infected Women. Am J Epidemiol. 2017;185(10):869–78. [DOI] [PMC free article] [PubMed] [Google Scholar]
- 14.Tsai AC, Weiser SD, Steward WT, Mukiibi NFB, Kawuma A, Kembabazi A, et al. Evidence for the reliability and validity of the internalized aids-related stigma scale in rural Uganda. AIDS Behav. 2013;17(1):427–33. [DOI] [PMC free article] [PubMed] [Google Scholar]
- 15.Kaida A, Matthews LT, Ashaba S, Psych M, Tsai AC, Kanters S, et al. Depression During Pregnancy and the Postpartum Among HIV-Infected Women on Antiretroviral Therapy in Uganda. 2014;67:15–8. [DOI] [PMC free article] [PubMed] [Google Scholar]
- 16.Martinez P, Andia I, Emenyonu N, Hahn JA, Hauff E, Pepper L, et al. Alcohol use, depressive symptoms and the receipt of antiretroviral therapy in southwest Uganda. AIDS Behav. 2008;12(4):605–12. [DOI] [PMC free article] [PubMed] [Google Scholar]
- 17.Tsai AC, Bangsberg DR, Frongillo EA, Hunt PW, Muzoora C, Martin JN, et al. Food insecurity, depression and the modifying role of social support among people living with HIV/AIDS in rural Uganda. Soc Sci Med [Internet]. Elsevier; 2012;74(12):2012–9. Available from: 10.1016/j.socscimed.2012.02.033 [DOI] [PMC free article] [PubMed] [Google Scholar]
- 18.Ashaba S, Kakuhikire B, Vořechovská D, Perkins JM, Cooper-Vince CE, Maling S, et al. Reliability, Validity, and Factor Structure of the Hopkins Symptom Checklist-25: Population-Based Study of Persons Living with HIV in Rural Uganda. AIDS Behav. 2017;1–8. [DOI] [PMC free article] [PubMed] [Google Scholar]
- 19.Bolton P, Ndogoni L. Cross-Cultural Assessment Of Trauma-Related Mental Illness. Johns Hopkins Univ; 2000; [Google Scholar]
- 20.Derogatis LR, Lipman RS, Rickels K, Uhlenhuth EH, Covi L. The Hopkins Symptom Checklist (HSCL): A self‐report symptom inventory. Behav Sci. 1974;19(1):1–15. [DOI] [PubMed] [Google Scholar]
- 21.Filmer D, Pritchett LH. Estimating wealth effects without expenditure data--or tears: an application to educational enrollments in states of India. Demography [Internet]. 2001;38(1):115–32. Available from: http://www.ncbi.nlm.nih.gov/pubmed/11227840 [DOI] [PubMed] [Google Scholar]
- 22.Wu AW, Rubin HR, Mathews WC, Ware JE, Lucy T, Hardy WD, et al. A Health Status Questionnaire Using 30 Items From The Medical Outcomes Study: Preliminary Validation in Persons With Early HIV Infection. Med Care. 1991;29(8):786–98. [DOI] [PubMed] [Google Scholar]
- 23.Bush K, Kivlahan DR, McDonell MB, Fihn SD, Bradley KA. The AUDIT alcohol consumption questions (AUDIT-C): an effective brief screening test for problem drinking. Arch Intern Med [Internet]. 1998;158(16):1789–95. Available from: http://archinte.jamanetwork.com/article.aspx?doi=10.1001/archinte.158.16.1789%5Cnhttp://www.ncbi.nlm.nih.gov/pubmed/9738608 [DOI] [PubMed] [Google Scholar]
- 24.Fumaz CR, Muñoz-Moreno JA, Moltó J, Negredo E, Ferrer MJ, Sirera G, et al. Long-term neuropsychiatric disorders on efavirenz-based approaches: quality of life, psychologic issues, and adherence. J Acquir Immune Defic Syndr [Internet]. 2005;38(5):560–5. Available from: http://pt.wkhealth.com/pt/re/lwwgateway/landingpage.htm;jsessionid=NkBbVFhdLyB3Q7Q2NVXdkvFjJ2hddgXfLglr74hHvyQY9p1tjwLV!832287970!181195629!8091!−1?issn=1525-4135&volume=38&issue=5&spage=560 [DOI] [PubMed] [Google Scholar]
- 25.VanderWeele TJ, Ding P. Sensitivity Analysis in Observational Research: Introducing the E-value. Ann Intern Med [Internet] 2017;167(4):268 Available from: http://annals.org/article.aspx?doi=10.7326/M16-2607 [DOI] [PubMed] [Google Scholar]
- 26.Gross R, Bellamy SL, Ratshaa B, Han X, Vujkovic M, Aplenc R, et al. CYP2B6 genotypes and early efavirenz-based hiv treatment outcomes in botswana. Aids [Internet]. 2017;(June):1 Available from: http://www.ncbi.nlm.nih.gov/pubmed/28692529%0Ahttp://Insights.ovid.com/crossref?an=00002030-900000000-97433 [DOI] [PMC free article] [PubMed] [Google Scholar]
- 27.Rotger M, Colombo S, Furrer H, Bleiber G, Buclin T, Lee BL, et al. Influence of CYP2B6 polymorphism on plasma and intracellular concentrations and toxicity of efavirenz and nevirapine in HIV-infected patients. Pharmacogenet Genomics. 2005;15(1):1–5. [DOI] [PubMed] [Google Scholar]
- 28.Haas DW, Ribaudo HJ, Kim RB, Tierney C, Wilkinson GR, Gulick RM, et al. Pharmacogenetics of efavirenz and central nervous system side effects: an Adult AIDS Clinical Trials Group study. Aids [Internet]. 2004;18(18):2391–400. Available from: http://www.ncbi.nlm.nih.gov/pubmed/15622315 [PubMed] [Google Scholar]
- 29.Mukonzo JK, Okwera A, Nakasujja N, Luzze H, Sebuwufu D, Ogwal-Okeng J, et al. Influence of efavirenz pharmacokinetics and pharmacogenetics on neuropsychological disorders in Ugandan HIV-positive patients with or without tuberculosis: a prospective cohort study. BMC Infect Dis [Internet]. 2013. [cited 2016 Sep 19];13:261 Available from: http://www.ncbi.nlm.nih.gov/pubmed/23734829 [DOI] [PMC free article] [PubMed] [Google Scholar]
- 30.Sarfo FS, Zhang Y, Egan D, Tetteh LA, Phillips R, Bedu-Addo G, et al. Pharmacogenetic associations with plasma efavirenz concentrations and clinical correlates in a retrospective cohort of ghanaian HIV-infected patients. J Antimicrob Chemother. 2014;69(2):491–9. [DOI] [PubMed] [Google Scholar]
- 31.Ribaudo HJ, Liu H, Schwab M, Schaeffeler E, Eichelbaum M, Motsinger-Reif AA, et al. Effect of CYP2B6, ABCB1, and CYP3A5 polymorphisms on efavirenz pharmacokinetics and treatment response: an AIDS Clinical Trials Group study. J Infect Dis [Internet]. 2010;202(5):717–22. Available from: http://www.pubmedcentral.nih.gov/articlerender.fcgi?artid=2919241&tool=pmcentrez&rendertype=abstract [DOI] [PMC free article] [PubMed] [Google Scholar]
- 32.Gatch MB, Kozlenkov A, Huang R-Q, Yang W, Nguyen JD, González-Maeso J, et al. The HIV antiretroviral drug efavirenz has LSD-like properties. Neuropsychopharmacology [Internet] 2013;38(12):2373–84. Available from: 10.1038/npp.2013.135 [DOI] [PMC free article] [PubMed] [Google Scholar]
- 33.Huang R, Chen Z, Dolan S, Schetz JA, Dillon GH. The dual modulatory effects of efavirenz on GABAA receptors are mediated via two distinct sites. Neuropharmacology. 2017;121:167–78. [DOI] [PMC free article] [PubMed] [Google Scholar]
- 34.Ford N, Shubber Z, Pozniak A, Vitoria M, Doherty M, Kirby C, et al. Comparative Safety and Neuropsychiatric Adverse Events Associated With Efavirenz Use in First-Line Antiretroviral Therapy: A Systematic Review and Meta-Analysis of Randomized Trials. J Acquir Immune Defic Syndr [Internet]. 2015;69(4):422–9. Available from: http://content.wkhealth.com/linkback/openurl?sid=WKPTLP:landingpage&an=00126334-900000000-97607%5Cnhttp://www.ncbi.nlm.nih.gov/pubmed/25850607 [DOI] [PubMed] [Google Scholar]
- 35.Journot V, Chene G, De Castro N, Rancinan C, Cassuto J-P, Allard C, et al. Use of efavirenz is not associated with a higher risk of depressive disorders: a substudy of the randomized clinical trial ALIZE-ANRS 099. Clin Infect Dis. 2006;42(12):1790–9. [DOI] [PubMed] [Google Scholar]
- 36.Poupard M, Gueye NFN, Thiam D, Ndiaye B, Girard PM, Delaporte E, et al. Quality of life and depression among HIV-infected patients receiving efavirenz- or protease inhibitor-based therapy in Senegal. HIV Med. 2007;8(2):92–5. [DOI] [PubMed] [Google Scholar]
- 37.Venter WDF, Clayden P, Serenata C, OPTIMIZE Consortium. The ADVANCE study. Curr Opin HIV AIDS [Internet]. 2017;12(4):351–4. Available from: http://www.ncbi.nlm.nih.gov/pubmed/28538284%5Cnhttp://www.pubmedcentral.nih.gov/articlerender.fcgi?artid=PMC5459583%5Cnhttp://Insights.ovid.com/crossref?an=01222929-201707000-00008 [DOI] [PMC free article] [PubMed] [Google Scholar]
Associated Data
This section collects any data citations, data availability statements, or supplementary materials included in this article.