

Abstract
IMPORTANCE
Autism spectrum disorder (ASD) is marked by social disability and is associated with dysfunction in brain circuits supporting social cue perception. The degree to which neural functioning reflects individual-level behavioral phenotype is unclear, slowing the search for functional neuroimaging biomarkers of ASD.
OBJECTIVE
To examine whether quantified neural function in social perception circuits may serve as an individual-level marker of ASD in children and adolescents.
DESIGN, SETTING, AND PARTICIPANTS
The cohort study was conducted at the Yale Child Study Center and involved children and adolescents diagnosed as having ASD and typically developing participants. Participants included a discovery cohort and a larger replication cohort. Individual-level social perception circuit functioning was assessed as functional magnetic resonance imaging brain responses to point-light displays of coherent vs scrambled human motion.
MAIN OUTCOMES AND MEASURES
Outcome measures included performance of quantified brain responses in affected male and female participants in terms of area under the receiver operating characteristic curve (AUC), sensitivity and specificity, and correlations between brain responses and social behavior.
RESULTS
Of the 39 participants in the discovery cohort aged 4to 17 years, 22 had ASD and 30 were boys. Of the 75 participants in the replication cohort aged 7 to 20 years, 37 had ASD and 52 were boys. A relative reduction in social perception circuit responses was identified in discovery cohort boys with ASD at an AUC of 0.75 (95% CI, 0.52–0.89; P = .01); however, typically developing girls and girls with ASD could not be distinguished (P = .54). The results were confirmed in the replication cohort, where brain responses were identified in boys with ASD at an AUC of 0.79 (95% CI, 0.64–0.91; P < .001) and failed to distinguish affected and unaffected girls (P = .82). Across both cohorts, boys were identified at an AUC of 0.77 (95% CI, 0.64–0.86) with corresponding sensitivity and specificity of 76% each. Additionally, brain responses were associated with social behavior in boys but not in girls.
CONCLUSIONS AND RELEVANCE
Quantified social perception circuit activity is a promising individual-level candidate neural marker of the male ASD behavioral phenotype. Our findings highlight the need to better understand effects of sex on social perception processing in relation to ASD phenotype manifestations.
Autism spectrum disorder (ASD) is a collection of potentially severe childhood neurodevelopmental conditions affecting 1 in 54 boys and 1 in 252 girls.1 Although ASD is characterized by a heterogeneous range of behavioral symptoms, including early-onset difficulties in communication and restricted repetitive behavior,2 difficulty with social interaction is a unifying feature of the condition.3
Typically developing (TD) children preferentially attend to point-light displays of biological motion in the form of a moving human within the first days of life.4 Two- and 3-year-old children diagnosed as having ASD, however, do not orient toward such point-light displays.5,6 This behavioral deficit remains in affected older children,7,8 adolescents, and young adults.8–10
Sensitivity to biological motion is underpinned by neural circuits prepared to benefit from species-typical input4,11,12 and plays a central role in the development of social engagement6 including the development of emotion perception13 and the attribution of intentions to others.14 Consistent with the ASD behavioral phenotype, brain responses to biological motion are reduced in regions supporting social perception, such as the fusiform gyrus and superior temporal sulcus, in affected children,15 adolescents, and adults.9,10,16 Moreover, unaffected siblings of children with ASD share regions of dysfunction with affected children,15,17 suggesting that social perception circuit functioning may reflect vulnerability rather an acute clinical behavioral manifestation. Taken together, the literature points to a pervasive dysfunction in social perception circuits associated with the social deficits characteristic of ASD. Indeed, dysfunction in brain circuits supporting social perception is among the most replicated functional brain differences between ASD and TD individuals across experimental paradigms.18
The identification of biomarkers is a key challenge in psychiatry.19 Biomarkers can inform diagnosis and prognosis, but also improve our understanding of pathogenesis and pathophysiological mechanisms, predicting disease progression and monitoring therapy.20 Despite the strong interest in neuroimaging markers of ASD, the degree to which quantified neural activity in social perception circuits reflects individual-level disorder state is unclear. We previously noted that the observed reduction in brain responses to biological motion in affected children may be sufficiently robust to potentially serve as an individual level marker of ASD.21 To examine the practical usefulness of this putative marker, we collected and examined brain responses in a larger replication cohort that included a relatively large number of affected girls (total n = 14).
Methods
Participants
Participants from a discovery cohort15 and a new, replication cohort were included in the study (Table 1). Written informed consent was obtained from each participant’s parent(s) or legal guardian according to the Declaration of Helsinki for a protocol that was approved by the Yale School of Medicine Human Investigations Committee. All children had normal or corrected-to-normal (via magnetic resonance imaging-compatible glasses) vision. Typically developing children were excluded based on (1) diagnosed, referred, or suspected ASD, schizophrenia, or other developmental or psychiatric disorder; (2) first- or second-degree relative with diagnosed, referred, or suspected ASD; (3) an individual education plan for special education services, including speech/language therapy, occupational therapy, and social skills therapy; (4) clinical impression suggesting ASD, other developmental delay/ disorder, or psychiatric disorder by the highly experienced multidisciplinary clinical team in the Child Study Center; (5) total t > 76 on the Social Responsiveness Scale (SRS) (discovery cohort only); and (6) low or moderately low score on any domain of the Vineland Adaptive Behavior Scale-II (discovery cohort only).
Table 1.
Characteristics of the Study Participantsa
| Mean (SD) [Range] |
||||||
|---|---|---|---|---|---|---|
| Discovery Cohort |
Replication Cohort |
|||||
| Characteristic | TD (n = 12) |
ASD (n = 18) |
P Value | TD (n = 25) |
ASD (n = 27) |
P Value |
| Boys | ||||||
| Age | 10.75 (2.82) [6.55–16.69] |
11.91 (3.85) [4.03–17.70] |
.38 | 11.52 (3.05) [7.08–17.83] |
11.45 (2.82) [7.08–17.67] |
.97 |
| DAS | 111.12 (16.15) [78.00–140.00] |
99.39 (20.85) [72.00–141.00] |
.12 | 105.46 (17.69) [76.00–137.00] |
91.33 (23.27) [41.00–132.00] |
.03 |
| SRS | 25.67 (16.32) [2.00–54.00] |
95.67 (22.00) [48.00–130.00] |
<.001 | 29.20 (23.50) [2.00–90.00] |
98.70 (30.21) [37.00–147.00] |
<.001 |
| ADOS | NA | 10.89 (2.65) [7.00–15.00] |
NA | NA | 12.85 (5.33) [5.00–25.00] |
NA |
| ADI-R | NA | 21.69 (4.16) [14.00–26.00] |
NA | NA | 22.15 (3.63) [13.00–29.00] |
NA |
| Movement, mmb | 0.84 (0.74) [0.34–2.96] |
1.30 (0.66) [0.24–2.36] |
.05 | 2.18 (1.99) [0.14–8.14] |
1.54 (1.70) [0.16–7.07] |
.21 |
| Boys matched on DAS | TD (n = 12) |
ASD (n = 18) |
TD (n = 19) |
ASD (n = 22) |
||
| Age | NA | NA | NA | 11.53 (3.16) [7.08–17.83] |
11.03 (2.66) [7.08–15.92] |
.59 |
| DAS | NA | NA | NA | 99.32 (14.12) [76.00–120.00] |
99.27 (16.62) [77.00–132.00] |
.99 |
| SRS | NA | NA | NA | 33.16 (24.84) [3.00–90.00] |
98.27 (30.19) [37.00–147.00] |
<.001 |
| ADOS | NA | NA | NA | NA | 12.20 (5.01) [5.00–21.00] |
NA |
| ADI-R | NA | NA | NA | NA | 22.41 (3.76) [13.00–29.00] |
NA |
| Movement, mmb | NA | NA | NA | 2.24 (1.98) [0.20–8.14] |
1.65 (1.83) [0.23–7.07] |
.34 |
| Girls | TD (n = 5) |
ASD (n = 4) |
TD (n = 13) |
ASD (n = 10) |
||
| Age | 11.35 (3.97) [4.56–13.75] |
11.58 (2.62) [9.02–14.50] |
.92 | 11.51 (2.75) [7.42–15.58] |
10.73 (4.61) [4.92–20.25] |
.62 |
| DAS | 122.25 (15.82) [101.00–137.00] |
94.00 (13.93) [84.00–114.00] |
.04 | 93.85 (12.75) [77.00–115.00] |
98.80 (14.41) [83.00–123.00] |
.39 |
| SRS | 20.80 (6.91) [10.00–28.00] |
95.50 (26.29) [66.00–121.00] |
.001 | 32.92 (25.11) [10.00–93.00] |
84.30 (27.53) [38.00–123.00] |
<.001 |
| ADOS | NA | 14.25 (5.56) [9.00–22.00] |
NA | NA | 10.80 (5.12) [4.00–22.00] |
NA |
| ADI-R | NA | 23.00 (4.69) [18.00–27.00] |
NA | NA | 18.60 (5.56) [9.00–27.00] |
NA |
| Movement, mmb | 1.17 (0.77) [0.46–2.10] |
1.30 (1.19) [0.45–3.05] |
.84 | 0.81 (0.75) [0.19–3.01] |
4.24 (5.20) [0.67–17.54] |
.03 |
Abbreviations: ADI-R, Autism Diagnostic Interview–Revised (total score); ADOS, Autism Diagnostic Observation Schedule (total score); ASD, autism spectrum disorder; DAS, Differential Ability Scale (global composite scores); NA, not applicable; SRS, Social Responsiveness Scale (total raw score); TD, typically developing.
Missing data: DAS in 1 replication TD child and 2 discovery TD children; SRS in 1 discovery ASD child; ADOS in 1 replication ASD child; ADI in 2 discovery ASD children; movement in 2 replication ASD children.
Maximum amount of movement in 6 planes of motion.
Clinical Measures
Autism spectrum disorder in children was diagnosed by an expert clinician, whose judgment was informed by the Autism Diagnostic Observation Schedule22 and the Autism Diagnostic Interview-Revised.23 Cognitive ability was assessed using the Differential Ability Scale.24 Social behavior was characterized using the SRS,25 and, in the discovery cohort, the Vineland Adaptive Behavior Scale-II.
Participant Matching
To exclude potential effects of cognitive ability differences in the replication cohort, we created subgroups matched on Differential Ability Scale scores. We alternated removal of the highest scoring TD male participant and the lowest scoring male participant with ASD until a group difference t test P > .90was obtained (Table 1).
Experimental Design
During scanning, children viewed coherent and scrambled point-light displays of animated biological motion created from motion-capture data with 16 different capture points. The coherent motion displays (12 individual, 3- to 4-second animations) featured an unfamiliar adult male actor performing movement sequences relevant to early childhood experiences such as playing pat-a-cake.6 Twelve scrambled motion animations were created by randomly selecting 16 points from across the 12 different biological motion animations and plotting their trajectories on a black background. Thus, the coherent and scrambled displays contained the same local motion information, but only the coherent displays contained the configuration of a person.26 Stimuli were presented using E-Prime 2.0 software (Psychological Software Tools). Six randomly selected coherent motion clips and 6 randomly chosen scrambled motion clips were presented once each in an alternating-block design (time per block, 24 seconds). The experiment began and ended with a 20-second fixation period (total time, 328 seconds). The movies were presented without audio. The children were asked to watch the videos and were reminded to remain still and alert.
Magnetic Resonance Imaging Data Acquisition
On a Siemens MAGNETOM Tim Trio 3T scanner system, Tl-weighted anatomical images were acquired using an MPRAGE sequence (repetition time, 1900 milliseconds; echo time, 2.96 milliseconds; field of view, 256 mm; image matrix, 256 mm2; voxel size, 1×1×1 mm; 160 slices). Functional runs consisted of 164 whole-brain functional images acquired using a single-shot gradient recalled echo planar pulse sequence sensitive to blood oxygenation level-dependent contrast (repetition time, 2000 milliseconds; echo time, 25 milliseconds; flip angle, 60°; field of view, 22 cm; image matrix, 64 mm2; voxel size, 3.4 × 3.4 × 4.0 mm; 34 slices).
Functional Magnetic Resonance Imaging Data Preprocessing
Data were preprocessed with BrainVoyager QX (BrainInnovation). All 10 volumes before the onset of the stimulus event were discarded to allow for T1 equilibrium. Preprocessing of the functional data included interleaved slice time correction using cubic spline interpolation, 3-dimensional motion correction using trilinear/sinc interpolation, linear trend removal, and temporal high-pass filtering to remove low-frequency nonlinear drifts. Estimated motion plots and cine loops were inspected for head motion greater than 2 mm of translation in any direction or 2° of rotation about any axis. To reduce potential unspecific effects owing to head motion, we removed volume acquisitions where movement between 2 consecutive volumes exceeded 1 mm or integrated movement across 4 volumes exceeded 2 mm. Functional data sets were coregistered to the Talairach-transformed,27 within-session, Tl-weighted anatomical images.
General Linear Model Analysis
A general linear model analysis was conducted for each participant on all voxels within a whole-brain mask defined on the Montreal Neurological Institute template brain normalized to Talairach space. Regressors were defined as boxcar functions with values of 1 during each condition and 0 otherwise, convolved with a double-gamma hemodynamic response function.28 Predictors depicting motion in all 6 parameters were included as predictors of no interest.
Group-Level Analyses
First, we defined the circuit involved in processing observed human motion as the set of regions of interest that were significantly activated for the contrast (coherent vs scrambled motion) in TD children and children with ASD combined. Second, a direct group comparison for ASD compared with TD of the coherent vs scrambled motion contrast was performed to assess group-level differences. Finally, to examine potential nonspecific visual effects, such as group differences in attending to the stimuli, we identified regions of interest associated with visual attention to movement29 based on the contrast (coherent + scrambled motion > baseline) in TD children and children with ASD combined. The results were assessed at conventional voxelwise uncorrected levels (P < .0001 or P < .01, as indicated) and corrected for multiple comparisons at the cluster level through the BrainVoyager QX cluster-level statistical threshold estimator plugin (1000 iterations, α < .05).30,31
All group-level random effects analyses were conducted in the replication cohort only because group-level differences have been examined in the discovery cohort previously.15 To limit bias toward any group, we performed the analyses in equal numbers of TD participants and participants with ASD combined (n = 74). To this end, we excluded 1 randomly selected ASD participant.
Individual-Level Analyses
Individual-level brain responses were assessed as the (coherent > scrambled motion) contrast β values averaged across all voxels within the set of the biological motion regions of interest. To limit any group-difference bias, we only examined regions of interest defined for the main effect of children with ASD and TD children combined. The average β values were then entered into a receiver operating characteristic curve analysis. We used permutation testing with 10 000 iterations to assess the likelihood of obtaining the results owing to chance. The analysis was conducted in both sexes combined and in girls and boys only.
Correlation Analysis
We computed the Pearson partial linear correlation coefficient between average β values in the biological motion perception circuit and SRS scores in TD children and children with ASD combined, while controlling for age, and assessed P values under the hypothesis of no correlation against the 1-sided alternative of a nonzero negative correlation. In children with ASD, we also examined correlations between average β values and motion, cognitive ability, and Autism Diagnostic Observation Schedule22 and the Autism Diagnostic Interview-Revised23 scores.
Results
Replication Cohort Group-Level Analyses
The random effects replication cohort group analysis for (coherent > scrambled motion) reproduced well-documented regional activations to biological motion, including large clusters in bilateral fusiform gyri (FG), extending into the posterior superior temporal sulcus in the right hemisphere, and the occipital gyrus (n = 74; P < .0001, k > 6; Table 2; Figure, A; eFigure in the Supplement).32,33
Table 2.
Group-Level Biological Motion (Coherent > Scrambled Biological) Perception Analyses
| Talairach Coordinates |
|||||||
|---|---|---|---|---|---|---|---|
| Group Contrasts | Region | x | y | z | t Value | P Value | Extent |
| ASD + TDa | Right FG/pSTS | 38 | −59 | −12 | 6.80 | <.001 | 169 |
| Left FG | −40 | −38 | −15 | 8.03 | <.001 | 168 | |
| Left OG | −25 | −96 | −9 | 5.34 | <.001 | 13 | |
| ASD vs TDb | Right FG | 41 | −56 | −9 | 4.47 | <.001 | 53 |
| Left FG | −37 | −53 | −9 | 4.36 | <.001 | 85 | |
| Left MTG | −34 | −2 | −27 | 4.68 | <.001 | 41 | |
| Left IFG | −34 | 34 | −6 | 3.53 | <.001 | 18 | |
| Left cerebellum | −19 | −65 | −24 | 4.09 | <.001 | 26 | |
| −34 | −50 | −24 | 3.88 | <.001 | 18 | ||
Abbreviations: ASD, autism spectrum disorder; FG, fusiform gyrus; IFG, inferior frontal gyrus; MTG, middle temporal gyrus; OG, occipital gyrus; pSTS, posterior superior temporal sulcus; TD, typically developing.
Group-level activations in all replication cohort children for main effect of coherent vs scrambled motion (P < .0001, k > 6).
Group-level coherent vs scrambled motion activation reductions in replication cohort children autism spectrum disorder relative to typically developing children (ASD vs TD; P < .01, k > 17).
Figure. Performance of Quantified Social Perception Circuit Activity in Detecting Autism Spectrum Disorder.
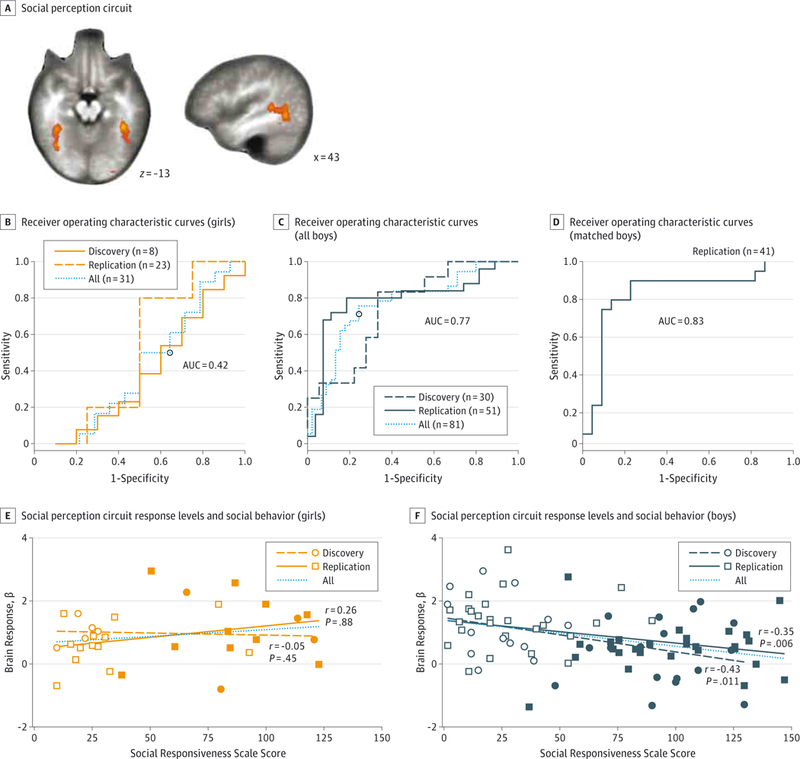
A, The social perception circuit defined in the replication cohort, autism spectrum disorder and typically developing combined, from the group-level main effect for the contrast (coherent>scrambled motion) (P < .0001, k > 6). Receiver operating characteristic curves for detecting children diagnosed as having autism spectrum disorder based on social perception circuit response levels for girls (B), all boys (C), and boys matched on cognitive ability (D). The association between social perception circuit response levels (average β values) and social behavior (Social Responsiveness Scale scores) for girls (E) and boys (F). The open squares and circles indicate typically developing responses, and the closed squares and circles indicate autism spectrum disorder responses. The r and P values indicate tests for negative partial correlations, corrected for age. AUC indicates area under the receiver operating characteristic curve.
The comparison of TD vs ASD confirmed previously observed hypoactivations in ASD in the right FG, left FG, inferior temporal gyrus, left middle temporal gyrus, and the left inferior frontal gyrus (P < .01; k > 17; Table 2).9,10,15,16 We found no significant results for the ASD > TD contrast.
We found no significant effects in regions associated with visual attention (eResults in the Supplement).There were some group differences in head motion (eResult in the Supplement); however, these likely had limited effects on the results (eDiscussion in the Supplement).
Reduced Individual-Level Responses in Social Perception Circuits in Affected Boys
Average biological motion circuit p values for the main effect of coherent vs scrambled motion and children with ASD and TD children combined identified individual discovery cohort ASD cases at a significant area under the receiver operating characteristic curve (AUC) of0.70 (95% CI, 0.51–0.84; P = .02). However, this effect was driven entirely by boys who were identified at an AUC of 0.75 (95% CI, 0.52–0.89; P = .01), whereas girls with ASD and TD girls could not be distinguished (AUC = 0.50; 95% CI, 0.00–1.00; P = .54)(Figure,B-D; Table 3). These results were confirmed in the replication cohort, where the AUC was significant in both sexes combined (AUC = 0.66; 95% CI, 0.52–0.78; P = .01),high in boys at(AUC = 0.79;95%CI, 0.64–0.86; P < .001), and at chance levels in girls (AUC = 0.39; 95% CI, 0.16–0.66; P = .82). In replication cohort boys, the results could not be explained by group differences in cognitive ability: when matched on Differential Ability Scale scores, the AUC was 0.83 (95% CI, 0.64–0.95; P < .001). In both cohorts combined, the overall AUC in boys remained high at 0.77 (95% CI, 0.64–0.86; P < .001) with a sensitivity of 76% and a specificity of 76%. Neither sample size nor motion explained the relatively low AUC in girls (eResults and eTables 1–3 in the Supplement).
Table 3.
Performance of Quantified Brain Activity in Detecting Autism Spectrum Disorder
| Whole Circuit |
Right FG/pSTS |
Left FG |
Left OG |
||||||
|---|---|---|---|---|---|---|---|---|---|
| Sex | Cohort | AUC | P Value | AUC | P Value | AUC | P Value | AUC | P Value |
| Boys | Discovery | .750 | .01 | .740 | .01 | .710 | .03 | .630 | .12 |
| Replication | .790 | <.001 | .800 | <.001 | .748 | .001 | .643 | .04 | |
| Replication matcheda | .825 | <.001 | .821 | <.001 | .806 | <.001 | .644 | .063 | |
| All | .770 | <.001 | .770 | <.001 | .730 | <.001 | .643 | .02 | |
| Girls | Discovery | .500 | .54 | .500 | .56 | .450 | .450 | .550 | .45 |
| Replication | .390 | .82 | .450 | .65 | .315 | .933 | .308 | .94 | |
| All | .421 | .79 | .488 | .56 | .361 | .907 | .369 | .89 | |
Abbreviations: AUC, area under the receiver operating characteristic curve; FG, fusiform gyrus; IPS, intraparietal sulcus; OG, occipital gyrus; pSTS, posterior superior temporal sulcus.
Matched on cognitive ability (Diffrential Ability Scale scores).
Post hoc analyses showed that the right FG and posterior superior temporal sulcus cluster contributed most in detecting boys with ASD in both the discovery and replication cohorts with AUCs of0.74 (95% CI, 0.50–0.89) and 0.79 (95% CI, 0.65–0.90), respectively, closely followed by the left FG, with AUCs of 0.71 (95% CI, .49–0.87) and 0.75 (95% CI, 0.57–0.87), respectively (Table 3). No region was significant in girls (all P > .50).
Association With Social Behavior
We found significant inverse correlations between average brain activity in the social perception circuit and social behavior difficulties (SRS scores), corrected for age, in discovery cohort boys (r = –0.43, P = .01), replication cohort boys (r = –0.35, P = .006), and boys of both cohorts combined (r = –0.36, P = .001). However, in girls, no significant correlations were identified (all P > .05) (Figure, E). Brain responses did not correlate with cognitive ability, motion, Autism Diagnostic Observation Schedule, or Autism Diagnostic Interview-Revised in any group (all P > .10).
Discussion
A simple 1-value measure of neural activity in social perception circuits identified boys affected by ASD with sensitivity and specificity of 76% across 2 cohorts; however, affected and TD girls could not be distinguished. Our results suggest that previously observed group-level hypoactivations in social perception brain regions are sufficiently robust and consistent to serve as a promising individual-level neural marker of social deficits associated with ASD in boys.
Social Perception in ASD
Impaired responses to social stimuli characterize the ASD behavioral phenotype and are among the most reproduced functional brain differences.3,18 The literature is largely based on studies in males, however, and our results support a potential sexually dimorphic neural reflection of the condition. Whether the observed sex differences are a consequence of methodological issues, such as relatively low number of girls or dissimilar disorder manifestations, is unclear. Nevertheless, posterior superior temporal sulcus responses to socioaffective stimuli increase in magnitude with age in TD girls but not in boys,34 suggesting an effect of sex in the development of social perception processing. Such differences in developmental patterns may also contribute to the lack of correlation between brain responses and SRS scores in girls. Further studies examining larger samples of girls diagnosed as having ASD and other disorders sharing sociocognitive behavioral pheno-types (eg, anorexia nervosa35) are required to elucidate the underlying mechanisms.
Methodological Issues and Limitations
By extracting only the average brain response from a pre-defined region of interest, we alleviated the problem of between-participants voxel-to-voxel mapping, which may be particularly detrimental in groups of varying head size. Nevertheless, more sophisticated approaches, eg, allowing simultaneous inclusion of regional responses across multiple brain regions, are likely to further improve both the power and robustness of the marker.
Our participants were not matched on cognitive ability. However, the results in a matched subsample of boys did not differ compared with the unmatched full sample, and β values did not correlate with Differential Ability Scale scores. Thus, brain responses to biological motion may be a robust marker in boys of varying cognitive ability. Similarly, we did not limit heterogeneity resulting from varying head sizes, ages, and puberty; factors that when appropriately accounted for may improve the sensitivity and specificity of the proposed marker. Finally, we did not exclude replication cohort children on the basis of social behavior alone: the replication cohort included TD children with high SRS scores and children with ASD with low SRS scores, resulting in an overlap between the 2 groups (Figure, E and F). Recognizing the phenotypic heterogeneity in both ASD and typical development, we allowed for a potentially more challenging but also more realistic task of identifying individual children fulfilling the criteria for ASD.
We did not examine participants’ eye movements or directly control for nonspecific effects related to visual attention. The lack of eye tracking is a potentially severe limitation because the broad alterations in visual attention associated with ASD36 may have contributed to social perception circuit hypoactivations. However, unaffected and affected participants did not differ in brain responses in visual attention regions, so it is unlikely that any unspecific visual attention deficits contributed significantly to the performance of the proposed marker.
Usefulness of a Functional Biomarker
The proposed marker fulfills proposed criteria for neuroimaging-based biomarkers (eDiscussion the Supplement). Nevertheless, the intense search for a viable ASD biomarker has hitherto been largely fruitless,37 and the heterogeneous nature of the condition likely renders identification of a single diagnostic marker intractable.38 A growing body of studies have highlighted the promise of resting-state functional brain imaging in developing candidate biomarkers of autism.39,40 The proposed marker may complement such markers by providing a quantified measure of evoked social perception circuit functionality. Brain function is actively shaped throughout life in an intricate interplay between genetics and the environment, and a functional marker may be used to monitor these plastic processes and to guide interventions targeted to improve function in specific circuits via behavioral treatments41 and pharmacological challenges.42
Conclusions
Functional markers are crucial in charting brain developmental trajectories and for early detection of deviations in vulnerable groups. A functional biomarker may be able to detect associated neural deviations before behavioral changes occur. In fact, the proposed paradigm targets low-level social perception stimuli relevant to all stages of development: 2-day-old infants preferentially attend to point-light displays of biological motion,4 and the posterior temporal cortex responds to social cues within days after birth.11 Moreover, infants and toddlers at risk for ASD show early-stage atypical behavioral and neural responses.43–45 Consequently, quantified function of social brain circuits should be a promising candidate neural marker of ASD across all age groups. The Yale Child Study group is committed to studying brain responses in young patients and control children, with designated facilities such as a mock scanner. Nonetheless, recognizing the challenges associated with scanning younger children, we are studying responses to biological motion using functional near infrared spectroscopy in toddlers. The present finding of robust individual-level differences pave the road toward refined studies specifically targeting such early neural markers.
Supplementary Material
Key Points.
Question
Can quantified neural function in social perception circuits identify autism spectrum disorder?
Findings
In this functional magnetic resonance imaging study that included 2 independent cohorts with a total of 114 children and adolescents, social perception circuit activity distinguished boys with and without autism spectrum disorder at a sensitivity and specificity of 76% each, whereas girls with and without autism could not be distinguished.
Meaning
Quantified social perception circuit function is a promising candidate for an individual-level neural marker of the male autism spectrum disorder behavioral phenotype.
Acknowledgments
Funding/Support: This work was supported by grants from the Simons Foundation Autism Research Initiative and the National Institute of Mental Health (Dr Pelphrey), Autism Speaks (Dr Kaiser), the Wenner-Gren Foundations (Dr Bjornsdotter), and the European Union Seventh Framework Programme under grant agreement PI0F-GA-2012–302896 (Dr Bjornsdotter).
Role of the Funder/Sponsor: The funding sources had no role in the design and conduct of the study; collection, management, analysis, and interpretation of the data; preparation, review, or approval of the manuscript; and decision to submit the manuscript for publication.
Previous Presentations: This study was presented at the Annual Meeting of the Society for Neuroscience, October 14,2012, New Orleans, Louisiana; Annual Meeting of the Organization for Human Brain Mapping, June13,2012, Beijing, China; and International Meeting for Autism Research, May 18,2012, Toronto, Ontario, Canada.
Footnotes
Supplemental content at jamapsychiatry.com
Conflict of Interest Disclosures: None reported.
Contributor Information
Malin Björnsdotter, Department of Clinical and Experimental Medicine, Center for Social and Affective Neuroscience, Linköping University, Linköping, Sweden, Institute of Neuroscience and Physiology, University of Gothenburg, Gothenburg, Sweden; Institute of Neuroscience and Physiology, University of Gothenburg, Gothenburg, Sweden.
Nancy Wang, Center for Translational Developmental Neuroscience, Child Study Center, Yale School of Medicine, New Haven, Connecticut.
Kevin Pelphrey, Autism And Neurodevelopment Disorders Institute, The George Washington University and Children’s National Medical Center, Washington, DC.
Martha D. Kaiser, Center for Translational Developmental Neuroscience, Child Study Center, Yale School of Medicine, New Haven, Connecticut
REFERENCES
- 1.Centers for Disease Control and Prevention. Prevalence of autism spectrum disorders–Autism and Developmental Disabilities Monitoring Network, 14sites, United States, 2008. MMWR Surveill Summ. 2012;61(3):1–19. [PubMed] [Google Scholar]
- 2.Lai M-C, Lombardo MV, Baron-Cohen S. Autism. Lancet. 2014;383(9920):896–910. [DOI] [PubMed] [Google Scholar]
- 3.Pelphrey KA, Yang DY-J, McPartland JC. Building a social neuroscience of autism spectrum disorder In: Andersen SL, Pine DS, eds. The Neurobiology of Childhood: Current Topics in Behavioral Neurosciences. Berlin, Germany: Springer; 2014:215–233. [DOI] [PubMed] [Google Scholar]
- 4.Simion F, Regolin L, Bulf H. A predisposition for biological motion in the newborn baby. Proc Natl Acad Sci U S A. 2008;105(2):809–813. [DOI] [PMC free article] [PubMed] [Google Scholar]
- 5.Falck-Ytter T, Rehnberg E, BölteS. Lack of visual orienting to biological motion and audiovisual synchrony in 3-year-olds with autism. PLoS One. 2013;8(7):e68816. [DOI] [PMC free article] [PubMed] [Google Scholar]
- 6.Klin A, Lin DJ, Gorrindo P, Ramsay G, Jones W. Two-year-olds with autism orient to non-social contingencies rather than biological motion. Nature. 2009;459(7244):257–261. [DOI] [PMC free article] [PubMed] [Google Scholar]
- 7.Blake R, Turner LM, Smoski MJ, Pozdol SL, Stone WL. Visual recognition of biological motion is impaired in children with autism. Psychol Sci. 2003; 14(2):151–157. [DOI] [PubMed] [Google Scholar]
- 8.Kaiser MD, Delmolino L,Tanaka JW, Shiffrar M. Comparison of visual sensitivity to human and object motion in autism spectrum disorder. Autism Res. 2010;3(4):191–195. [DOI] [PubMed] [Google Scholar]
- 9.Freitag CM, Konrad C, Häberlen M, et al. Perception of biological motion in autism spectrum disorders. Neuropsychologia. 2008;46(5):1480–1494. [DOI] [PubMed] [Google Scholar]
- 10.Koldewyn K, Whitney D, Rivera SM. Neural correlates of coherent and biological motion perception in autism. Dev Sci. 2011;14(5):1075–1088. [DOI] [PMC free article] [PubMed] [Google Scholar]
- 11.Farroni T, Chiarelli AM, Lloyd-Fox S, et al. Infant cortex responds to other humans from shortly after birth. Sci Rep. 2013;3:2851. [DOI] [PMC free article] [PubMed] [Google Scholar]
- 12.Vallortigara G, Regolin L, Marconato F. Visually inexperienced chicks exhibit spontaneous preference for biological motion patterns. PLoS Biol. 2005;3(7):e208. [DOI] [PMC free article] [PubMed] [Google Scholar]
- 13.Dittrich WH, Troscianko T, Lea SE, Morgan D. Perception of emotion from dynamic point-light displays represented in dance. Perception. 1996;25 (6):727–738. [DOI] [PubMed] [Google Scholar]
- 14.Frith CD, Frith U. Interacting minds–a biological basis. Science. 1999;286(5445):1692–1695. [DOI] [PubMed] [Google Scholar]
- 15.Kaiser MD, Hudac CM, Shultz S, et al. Neural signatures of autism. Proc Natl Acad Sci U S A. 2010; 107(49):21223–21228. [DOI] [PMC free article] [PubMed] [Google Scholar]
- 16.Herrington JD, Nymberg C, Schultz RT Biological motion task performance predicts superior temporal sulcus activity. Brain Cogn. 2011; 77(3):372–381. [DOI] [PubMed] [Google Scholar]
- 17.Ahmed AA, Vander Wyk BC. Neural processing of intentional biological motion in unaffected siblings of children with autism spectrum disorder: an fMRI study. Brain Cogn. 2013;83(3):297–306. [DOI] [PMC free article] [PubMed] [Google Scholar]
- 18.Philip RCM, Dauvermann MR, Whalley HC, Baynham K, Lawrie SM, Stanfield AC. A systematic review and meta-analysis of the fMRI investigation of autism spectrum disorders. Neurosci Biobehav Rev. 2012;36(2):901–942. [DOI] [PubMed] [Google Scholar]
- 19.Insel T, Cuthbert B, Garvey M, et al. Research domain criteria (RDoC): toward a new classification framework for research on mental disorders. Am J Psychiatry. 2010;167(7):748–751. [DOI] [PubMed] [Google Scholar]
- 20.Singh I, Rose N. Biomarkers in psychiatry. Nature. 2009;460(7252):202–207. [DOI] [PubMed] [Google Scholar]
- 21.Kaiser MD, Pelphrey KA. Disrupted action perception in autism: behavioral evidence, neuroendophenotypes, and diagnostic utility. Dev Cogn Neurosci. 2012;2(1):25–35. [DOI] [PMC free article] [PubMed] [Google Scholar]
- 22.Lord C, Rutter M, Le Couteur A. Autism Diagnostic Interview–Revised: a revised version of a diagnostic interview for caregivers of individuals with possible pervasive developmental disorders. J Autism Dev Disord. 1994;24(5):659–685. [DOI] [PubMed] [Google Scholar]
- 23.Lord C, Risi S, Lambrecht L, et al. The autism diagnostic observation schedule-generic: a standard measure of social and communication deficits associated with the spectrum of autism. J Autism Dev Disord. 2000;30(3):205–223. [PubMed] [Google Scholar]
- 24.Elliott C Differential Ability Scales. San Antonio, TX: The Psychological Corporation; 1990. [Google Scholar]
- 25.Constantino JN, Todd RD. Autistic traits in the general population: a twin study. Arch Gen Psychiatry. 2003;60(5):524–530. [DOI] [PubMed] [Google Scholar]
- 26.Bertenthal BI, Pinto J. Global Processing of Biological Motions. Psychol Sci. 1994;5(4):221–225. doi: 10.1111/j.1467-9280.1994.tb00504.x. [DOI] [Google Scholar]
- 27.Talairach J, Tournoux P. Co-Planar Stereotaxic Atlas of the Human Brain: 3-D Proportional System: An Approach to Cerebral Imaging. Stuttgart, Germany: Thieme; 1988. [Google Scholar]
- 28.Friston KJ, Holmes AP, Worsley KJ, Poline J-P, Frith CD, Frackowiak RSJ. Statistical parametric maps in functional imaging: a general linear approach. Hum Brain Mapp. 1994;2(4):189–210. doi: 10.1002/hbm.460020402. [DOI] [Google Scholar]
- 29.Kanwisher N, Wojciulik E. Visual attention: insights from brain imaging. Nat Rev Neurosci. 2000;1(2):91–100. [DOI] [PubMed] [Google Scholar]
- 30.Forman SD, Cohen JD, Fitzgerald M, Eddy WF, Mintun MA, Noll DC. Improved assessment of significant activation in functional magnetic resonance imaging (fMRI): use of a cluster-size threshold. Magn Reson Med. 1995;33(5):636–647 [DOI] [PubMed] [Google Scholar]
- 31.Goebel R, Esposito F, Formisano E. Analysis of functional image analysis contest (FIAC) data with brainvoyager QX: from single-subject to cortically aligned group general linear model analysis and self-organizing group independent component analysis. Hum Brain Mapp. 2006;27(5):392–401. [DOI] [PMC free article] [PubMed] [Google Scholar]
- 32.Grossman ED, Blake R. Brain areas active during visual perception of biological motion. Neuron. 2002;35(6):1167–1175. [DOI] [PubMed] [Google Scholar]
- 33.Grosbras M-H, Beaton S, Eickhoff SB. Brain regions involved in human movement perception: a quantitative voxel-based meta-analysis. Hum Brain Mapp. 2012;33(2):431–454. [DOI] [PMC free article] [PubMed] [Google Scholar]
- 34.Björnsdotter M, Gordon I, Pelphrey KA, Olausson H, Kaiser MD. Development of brain mechanisms for processing affective touch. Front Behav Neurosci. 2014;8:24. [DOI] [PMC free article] [PubMed] [Google Scholar]
- 35.Zucker NL, Losh M, Bulik CM, LaBar KS, Piven J, Pelphrey KA. Anorexia nervosa and autism spectrum disorders: guided investigation of social cognitive endophenotypes. Psychol Bull. 2007;133 (6):976–1006. [DOI] [PubMed] [Google Scholar]
- 36.Wang S, Jiang M, Duchesne XM, et al. Atypical Visual saliency in autism spectrum disorder quantified through model-based eye tracking. Neuron. 2015;88(3):604–616. [DOI] [PMC free article] [PubMed] [Google Scholar]
- 37.Walsh P, Elsabbagh M, Bolton P, Singh I. In search of biomarkers for autism: scientific, social and ethical challenges. Nat Rev Neurosci. 2011;12 (10):603–612. [DOI] [PubMed] [Google Scholar]
- 38.Anderson GM. Autism biomarkers: challenges, pitfalls and possibilities. J Autism Dev Disord. 2015;45(4):1103–1113. [DOI] [PubMed] [Google Scholar]
- 39.Uddin LQ, Supekar K, Lynch CJ, et al. Salience network-based classification and prediction of symptom severity in children with autism. JAMA Psychiatry. 2013;70(8):869–879. [DOI] [PMC free article] [PubMed] [Google Scholar]
- 40.Iidaka T Resting state functional magnetic resonance imaging and neural network classified autism and control. Cortex. 2015;63:55–67 [DOI] [PubMed] [Google Scholar]
- 41.Voos AC, Pelphrey KA, Tirrell J, et al. Neural mechanisms of improvements in social motivation after pivotal response treatment: two case studies. J Autism Dev Disord. 2013;43(1):1–10. [DOI] [PMC free article] [PubMed] [Google Scholar]
- 42.Gordon I, Vander Wyk BC, Bennett RH, et al. Oxytocin enhances brain function in children with autism. Proc Natl Acad Sci U S A. 2013;110(52): 20953–20958. [DOI] [PMC free article] [PubMed] [Google Scholar]
- 43.Lloyd-Fox S, Blasi A, Elwell CE, Charman T, Murphy D, Johnson MH. Reduced neural sensitivity to social stimuli in infants at risk for autism. Proc Biol Sci. 2013;280(1758):20123026. [DOI] [PMC free article] [PubMed] [Google Scholar]
- 44.Elsabbagh M, Mercure E, Hudry K, et al. ; BASIS Team. Infant neural sensitivity to dynamic eye gaze is associated with later emerging autism. Curr Biol. 2012;22(4):338–342. [DOI] [PMC free article] [PubMed] [Google Scholar]
- 45.Dinstein I, Pierce K, Eyler L, et al. Disrupted neural synchronization in toddlers with autism. Neuron. 2011;70(6):1218–1225. [DOI] [PMC free article] [PubMed] [Google Scholar]
Associated Data
This section collects any data citations, data availability statements, or supplementary materials included in this article.