

Abstract
Aims
There are several epidemiological studies on the association between statins and incident diabetes, but most of them lack details. In this study, we aimed to investigate the association of statin use with glycaemic traits and incident type 2 diabetes.
Methods
Using the prospective population‐based Rotterdam Study, we included 9535 individuals free from diabetes at baseline (>45 years) during the study period between 1997 and 2012. Linear regression analysis was applied to examine the cross‐sectional associations between statin use and glycaemic traits including fasting blood serum of glucose and insulin concentrations, and insulin resistance. In a longitudinal follow‐up study, we applied a Cox regression analysis to determine adjusted hazard ratios (HR) for incident type 2 diabetes in new users of statins.
Results
The mean age at baseline was 64.3 ± 10.1 years and 41.7% were men. In the fully adjusted model, compared to never users of statins, baseline use of statins was associated with higher concentrations of serum fasting insulin (β = 0.07; 95% CI: 0.02–0.13) and insulin resistance (β = 0.09; 95% CI: 0.03–0.14). Ever use of statins was associated with a 38% higher risk of incident type 2 diabetes (HR = 1.38; 95% CI: 1.09–1.74). This risk was more prominent in subjects with impaired glucose homeostasis and in overweight/obese individuals.
Conclusions
Individuals using statins may be at higher risk for hyperglycaemia, insulin resistance and eventually type 2 diabetes. Rigorous preventive strategies such as glucose control and weight reduction in patients when initiating statin therapy might help minimize the risk of diabetes.
Keywords: impaired fasting glucose, insulin resistance, statins, type 2 diabetes mellitus
What is already known about this subject
Several observational studies and trials have already reported an increased risk of incident type 2 diabetes in subjects treated with statins; however, most of them lack details.
The increased risk of incident type 2 diabetes associated with statin use is much higher (44%) in observational studies compared with trials (9–13%).
There are limited studies on the association of statin use with glycaemic traits.
What this study adds
Using fully adjusted regression models (adjusted for baseline/post‐baseline measurements of potential risk factors):
Compared to never statin users, baseline use of statin was associated with higher concentrations of serum fasting insulin (β = 0.07; 95% CI: 0.02–0.13) and insulin resistance (β = 0.09; 95% CI: 0.03–0.14).
Ever use of statins was associated with a 38% higher risk of incident type 2 diabetes (HR = 1.38; 95% CI: 1.09–1.74).
This risk was more prominent in subjects with impaired glucose homeostasis and in overweight/obese individuals.
1. INTRODUCTION
Although it is well known that statins significantly reduce the risk of cardiovascular disease (CVD) and CVD‐related mortality,1, 2 statin therapy may lead to increased risk of type 2 diabetes.3, 4 A recent meta‐analysis of 29 randomized clinical trials (RCTs) reported a 12% significantly increased risk of developing type 2 diabetes in the treated arm of statin therapy.5 However, use under everyday circumstances differs from use in a clinical trial setting with its homogeneous population and short follow‐up.6 Experimental studies suggest that statins may have a diabetogenic effect through beta‐cell dysfunction and glucose and insulin secretion/sensitivity7, 8; however, the data linking statins with glucose and insulin resistance to show the underlying mechanisms is limited. The literature so far on statin use and the risk of developing type 2 diabetes has been limited by several drawbacks: (i) underestimated cases of incident type 2 diabetes due to the inclusion of questionnaire‐based data, (ii) short follow‐up time not adequately taking into account the long‐term effects of statins, and (iii) lack of a direct comparison between different statin types, dosages and duration of use with respect to diabetes‐related outcomes.3, 9, 10
We hypothesized that statins have influence on serum blood glucose and insulin concentrations and insulin resistance, and lead to hyperglycaemia and hyperinsulinaemia as early markers of type 2 diabetes. In this study, exploring different aspects of statin therapy including type, dosages and durations of use, our objective was to assess the population‐based association of statins with concentrations of serum fasting glucose and insulin, insulin resistance and incident type 2 diabetes.
2. METHODS
2.1. Study setting
The Rotterdam Study is a prospective population‐based cohort study in Ommoord, a district of Rotterdam, the Netherlands. The design of the Rotterdam Study has been described in more detail elsewhere.11 Briefly, in 1989 all residents aged 45 years or older within the well‐defined study area were invited to participate, of whom 78% (7983 out of 10 275) agreed. In 2000, an additional 3011 participants were enrolled (RS‐II), consisting of all persons living in the study district who had become 55 years of age. A second extension of the cohort was initiated in 2006, in which 3932 participants aged 45 years or older were included (RSIII). The Rotterdam Study has been approved by the medical ethics committee according to the Population Screening Act: Rotterdam Study, executed by the Ministry of Health, Welfare and Sports of the Netherlands. All participants in the present analysis provided written informed consent to participate and to obtain information from their physicians.
2.2. Study design
We performed two analyses. First, a cross‐sectional analysis to test the association between statins and glycaemic traits and, second, a longitudinal follow‐up study to test the association of statins with incident type 2 diabetes.
2.3. Population for analysis
The present study used data from the third visit of the first cohort, RSI‐3 (March 1997–December 1999) and the baseline examinations of the second cohort, RSII‐1 (February 2000–December 2001) and third cohort, RSIII‐1 (February 2006–December 2008) (Figure S1). To study the association between statins and the outcomes of interest, we excluded prevalent type 2 diabetes cases at baseline (n = 1165), and included only participants with available data on statin use and baseline glycaemic values (n = 9535). To study the association of statins with incident type 2 diabetes, patients who used statins at baseline and prevalent cases of cardiovascular diseases (n = 968) were also excluded from the analysis. The end of follow‐up for incidence of type 2 diabetes was 1 January 2012 (Figure S1). A flowchart showing how we arrived at the population for the current study is presented in Figure 1.
Figure 1.
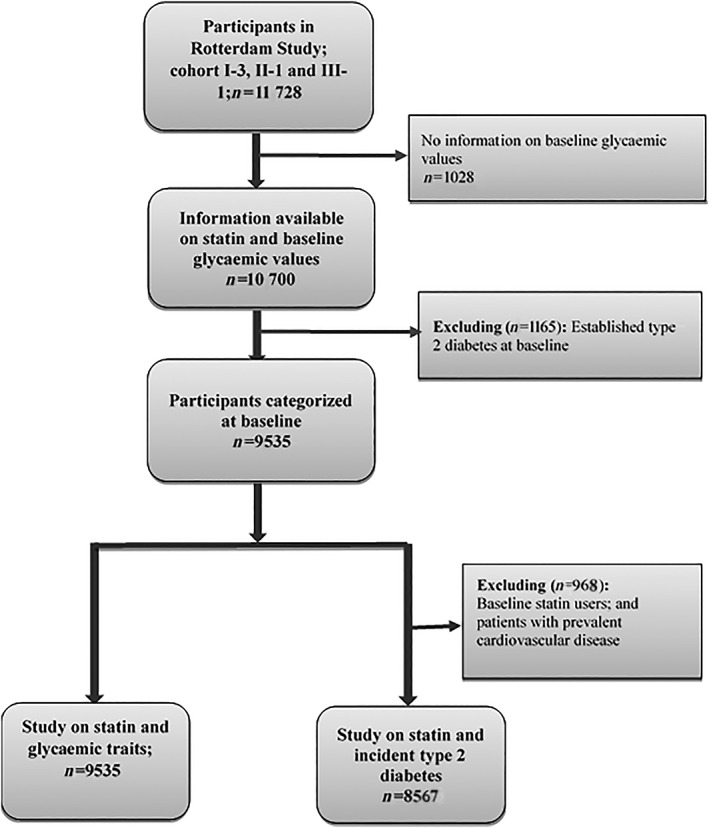
Flowchart of study population for the current study
2.4. Exposure measurement
All community pharmacies in the Rotterdam Study area store all information on drug dispensing on one common computer network. Information on statin treatment was obtained from the dispensing data using the Anatomical Therapeutical Chemical code (ATC code) (Table S1). On the baseline date, an individual was considered as a current statin user if this date fell within a prescription episode. During follow‐up, each participant was classified into one of the following mutually exclusive categories on the event date of type 2 diabetes (in non‐cases at the same day of follow‐up): “current use”, “past use” and “never use”. If the outcome measurement occurred within a prescription episode of statins, a person was classified as a current user and stratified by statin duration into one of three mutually exclusive groups: <30 days, 31–365 days or >365 days. If the participant had previously used statins but was no longer a current user on the event date, this was defined as past use. If the participant had not used statin during the study period, this was defined as “never use”, whereas any use (“current” or “past use”) during the study period was defined as “ever use”.
2.5. Outcomes' measurement
2.5.1. Fasting serum glucose concentrations, insulin and insulin resistance
Serum glucose (mmol/L) and insulin (pmol/L) concentrations were measured at the research centre after an overnight fast. For collecting serum specimens from the whole blood, fasting blood samples were centrifuged at 4°C at 1372× g, then serums were immediately frozen at −140°C and stored at −80°C in the clinical chemistry laboratory at Erasmus Medical Centre in Rotterdam. Glucose concentration was measured using glucose hexokinase method within 1 week after sampling12 and insulin concentration by metric assay (Biosource Diagnostics, Camarillo, CA). Homeostasis model assessment‐insulin resistance (HOMA‐IR) index as a surrogate marker for the degree of insulin resistance was calculated by the following formula: (fasting serum insulin (mU/L) × fasting serum glucose (mmol/L))/22.5.13
2.5.2. Type 2 diabetes diagnosis
From the date of baseline centre visit and during follow‐up, first incident type 2 diabetes cases were identified through active follow‐up and according to general practitioners' records, hospital discharge letters and glucose measurements. Type 2 diabetes was defined as a fasting serum glucose concentration of ≥7.0 mmol/L or a non‐fasting serum glucose concentration of ≥11.1 mmol/L (in case fasting serum samples were not available), or the use of blood glucose‐lowering medications.14
2.5.3. Covariates assessment
At baseline and during follow‐up, information was obtained on individuals' characteristics, health status, clinical data including medical and medication history, and behavioural/lifestyle factors. Physical activity levels were assessed using the Longitudinal Aging Study Amsterdam Physical Activity Questionnaire expressed in MET‐h/week15 and defined as number of hours per week that participants spent in each activity in the past year. Body mass index (BMI) was calculated as body weight (in kg) divided by the square of body height (in metres) included as a continuous variable. Baseline and postbaseline values (at the closest time to diabetes diagnosis) for BMIs were categorized as overweight/obesity defined as BMI ≥25 kg/m2 vs normal (BMI < 25 kg/m2). Hypertension was defined as an average value (of two measurements) of ≥140 mmHg for systolic and ≥90 mmHg for diastolic blood pressure after two measurements and/or a current prescription for an antihypertensive agent. Serum total cholesterol (TC) (mmol/L), high density lipoproteins‐cholesterol (HDL‐C) (mmol/L), and triglycerides (TG) (mmol/L) were all measured on the COBAS 8000 Modular Analyzer (Roche Diagnostics GmbH, Germany). We calculated low density lipoproteins‐cholesterol (LDL‐C) levels (mmol/L) indirectly from the measurements of TC, HDL‐C and TG using the Friedewald equation (TC − HDL‐C − TG/5).16 A family history of diabetes was defined as having a parent, sibling, or both with type 2 diabetes; the information on family history of diabetes was collected during home visits at RSI and RSII. All biochemical variables were assessed in serum samples taken after overnight fasting.
2.5.4. Statistical analyses
For comparison of baseline characteristics between statin users and never users in the first analysis, we used chi‐square statistics for dichotomous variables and independent sample t‐tests for normally distributed continuous variables. To achieve a symmetric distribution, non‐normally distributed data on BMI, TG, fasting serum insulin concentrations and the HOMA‐IR index were natural log transformed. Univariable and multivariable linear regression analyses were used to study the association between statins and glycaemic traits including serum fasting glucose and insulin concentrations and HOMA‐IR. Correlation coefficients to identify the magnitude of the linear association between serum fasting glucose and insulin concentrations and the HOMA‐IR index were studied with the Pearson test.
To study the association between statin use as a time‐varying exposure during the follow‐up and incident type 2 diabetes, we used multiple Cox regression analyses.17 The association was estimated by calculating hazard ratio (HR) and 95% confidence intervals (CI). All analyses show the effect estimates for ever, past or current vs never statin users as the reference group. Among ever statin users, in subgroup analyses, we analysed the risk of different outcomes in relation to statin type, dose and duration of use.
Because statins are often started in patients with type 2 diabetes, we performed two subgroup analyses to avoid confounding by indication. First, we subtracted one year from the event date in type 2 diabetes cases (in non‐cases one year from the same date of follow‐up) and studied the association with statin use until that date (cumulative statin use). Second, for those participants for whom we had an incident date of impaired fasting glucose (defined as a serum fasting glucose concentration between 6.1 and 6.9 mmol/L), we studied the association between statin use and incident impaired fasting glucose during follow‐up.
All regression analyses were adjusted for baseline/post‐baseline confounding factors using two models including: Model 1 adjusted for age and gender, cohort (RSI, II and III), smoking status, alcohol consumption, physical activity and education level, and Model 2 additionally adjusted for BMI and hypertension.
2.6. Sensitivity analyses for the association between statin and incident type 2 diabetes
In a sensitivity analysis, we examined the association between statins and risk of incident type 2 diabetes only in a subset of patients (n = 6787) with normal baseline fasting glucose concentrations <6.1 mmol/L by excluding cases of impaired fasting glucose cases (n = 2748). To exclude the likelihood of residual confounding, the association was further adjusted by postbaseline values of BMI. To explore whether biological risk factors could partly explain this association, Model 2 was further adjusted for (i) TC or (ii) HDL‐C, LDL‐C and TG. In another sensitivity analysis, Model 2 was further adjusted for family history of diabetes, and use of proton pump inhibitors (PPIs) at baseline.18 To test whether the association between statins and incident type 2 diabetes would be explained by the potential intermediate factors, serum glucose and insulin concentrations were added to Model 2. Using stratified analyses, we also checked the potential effect modification from age at baseline (≤65 years vs >65 years), gender and BMI at baseline (overweight/obese (BMI > 25) vs normal BMI individuals). We further tested an interaction between statin ever use and serum fasting glucose concentrations using a Cox regression model containing statin ever use, glucose concentrations and the product term of statin ever multiplied by glucose concentrations adjusted for potential confounders in Model 1.
A P‐value of .05 was used to assess the significance of main effect associations. All statistical analyses were carried out using IBM SPSS Statistics software (version 24.0, Chicago, IL, USA).
3. RESULTS
3.1. Baseline characteristics
A total of 9535 diabetes‐free individuals at baseline were included after exclusion of patients with prevalent type 2 diabetes (Table 1). The median follow‐up for the entire study population was 4 years (a follow‐up of up to 15 years). The mean age at baseline was 64.3 ± 10.1 years and the majority of patients included in this study were females (58.3%). Some 64.5% of individuals at baseline were overweight/obese. Median serum fasting glucose, insulin concentrations and HOMA‐IR index (interquartile range [IQR]) were 5.4 (5.0–5.8), 67.0 (46.0–97.0) and 2.3 (1.5–3.4), respectively.
Table 1.
Baseline characteristics of the study population
| Total (n = 9535) | Statin users (n = 968) | Never statin users (n = 8567) | P‐value | |
|---|---|---|---|---|
| Age, years, mean ± SD | 64.3 ± 10.1 | 64.9 ± 8.2 | 64.3 ± 10.2 | .04 |
| Gender (male), n (%) | 3977 (41.7) | 481 (49.7) | 3496 (40.8) | <.001 |
| BMI, kg/m2, mean ± SD | 27.0 ± 4.1 | 27.5 ± 3.9 | 26.9 ± 4.1 | <.001 |
| Family history of diabetes, n (%) | 524 (8.7) | 53 (5.5) | 471 (5.5) | 0.98 |
| Hypertension, n (%) | 3472 (36.5) | 651 (67.3) | 2821 (32.9) | <.001 |
| Total cholesterol, mmol/L, median (IQR) | 5.7 (5.1–6.4) | 5.1 (4.4–5.7) | 5.8 (5.2–6.5) | <.001 |
| HDL‐C, mmol/L, median (IQR) | 1.4 (1.1–1.7) | 1.3 (1.1–1.5) | 1.4 (1.2–1.7) | <.001 |
| LDL‐C, mmol/L, median (IQR) | 4.0 (3.4–4.6) | 3.4 (2.8–3.9) | 4.1 (3.5–4.7) | <.001 |
| Triglycerides, mmol/L, median (IQR) | 1.3 (1.0–1.8) | 1.5 (1.1–2.1) | 1.3 (0.97–1.7) | <.001 |
| Physical activity, MET‐h/week, mean ± SD | 75.6 ± 49.6 | 75.4 ± 47.2 | 75.7 ± 49.8 | .44 |
| Education status (High), n (%) | 1717 (18.0) | 153 (15.8) | 1564 (18.3) | .05 |
| Smoking status (ever), n (%) | 2040 (21.4) | 222 (22.9) | 1818 (21.2) | .28 |
| Alcohol consumption (ever), n (%) | 5443 (57.1) | 539 (55.7) | 4904 (57.2) | .32 |
| Glucose, mmol/L, median, IQR | 5.4 (5.0–5.8) | 5.5 (5.1–5.9) | 5.4 (5.0–5.8) | .02 |
| Insulin, pmol/L, median, IQR | 67.0 (46.0–97.0) | 78.0 (54.0–115.0) | 66.0 (46.0–96.0) | <.001 |
| HOMA‐IR index, median, IQR | 2.3 (1.5–3.4) | 2.7 (1.8–4.1) | 2.3 (1.5–3.4) | <.001 |
| Type of statins | ||||
| Simvastatin (C10AA01) | 529 (57.0) | – | – | – |
| Atorvastatin (C10AA05) | 237 (25.5) | – | – | – |
| Pravastatin (C10AA03) | 96 (10.3) | – | – | – |
| Fluvastatin (C10AA04) | 66 (7.1) | – | – | – |
| Average statin dose, mg | ||||
| Simvastatin (C10AA01) | 36 | – | – | – |
| Atorvastatin (C10AA05) | 42 | – | – | – |
| Pravastatin (C10AA03) | 33 | – | – | – |
| Fluvastatin (C10AA04) | 54 | – | – | – |
HDL‐C, high density lipoproteins‐cholesterol; HOMA‐IR, homeostasis model assessment‐insulin resistance; IQR, interquartile range; LDL‐C, low density lipoproteins‐cholesterol; SD, standard deviation.
Characteristics of the baseline statin users and never users are shown in Table 1. Compared to never users, statin users had significantly higher BMIs, TGs, fasting serum glucose and insulin concentrations and insulin resistance, and higher prevalence rates of hypertension. Statin users had significantly lower TC, HDL‐C and LDL‐C compared to never users. Serum glucose concentrations were weakly but significantly (P‐value < .001) correlated with both (ln) insulin concentrations (r = .14) and (ln) HOMA‐IR (r = .25).
After excluding patients who used statins at baseline (n = 968), the remaining study participants were subsequently followed for a period up to 15 years for incident type 2 diabetes. There were 716 cases of incident type 2 diabetes. In approximately 12.4% of the study population, statins were used during follow‐up. In the majority of current statin users, the duration of use was longer than 365 days (75.5%). The most frequently dispensed statins were simvastatin (57.0%), atorvastatin (25.5%), and pravastatin (10.3%).
3.2. The association of statin use with glycaemic traits
As shown in Table 2, in a cross‐sectional analysis, baseline statin use was statistically significantly associated with increased serum fasting insulin concentrations (β = 0.07; 95% CI: 0.02–0.13) and HOMA‐IR index (β = 0.09; 95% CI: 0.03–0.14). However, the association with serum fasting glucose concentrations was no longer significant after adding BMI and hypertension to Model 1 (β = 0.08; 95% CI: −0.03–0.18). Subgroup multiple linear regression analyses showed no role of statin type and dosage on these associations (Table 2).
Table 2.
Multivariate linear regression analysis on the association between statin therapy and serum fasting glucose/insulin concentrations and HOMA‐IR
| Crude effect | Model 1 | Model 2 | |
|---|---|---|---|
| Glucose concentration | β coefficient (SEM); 95% CI | β coefficient (SEM); 95% CI | β coefficient (SEM); 95% CI |
| Baseline statin users | 0.12 (0.07); −0.02–0.25 | 0.14 (0.06); 0.04–0.27 | 0.08 (0.06); −0.03–0.18 |
| Subgroup analyses | |||
| Statin type | |||
| Simvastatin | 0.03 (0.09); −0.14–0.20 | −0.01 (0.06); −0.14–0.11 | 0.01 (0.05); −0.08–0.11 |
| Atorvastatin | −0.10 (0.10); −0.29–0.10 | 0.02 (0.08); −0.13–0.18 | −0.06 (0.06); −0.17–0.06 |
| Othersa | Ref | ||
| Statin dose | −0.13 (0.07); −0.27–0.01 | 0.02 (0.06); −0.09–0.14 | −0.07 (0.04); −0.16–0.01 |
| (ln) Insulin concentration | |||
| Baseline statin users | 0.15 (0.02); 0.11–0.20 | 0.13 (0.03); 0.08–0.19 | 0.07 (0.03); 0.02–0.13 |
| Subgroup analyses | |||
| Statin type | |||
| Simvastatin | 0.01 (0.04); −0.07–0.09 | 0.08 (0.05); −0.02–0.18 | 0.05 (0.05); −0.04–0.15 |
| Atorvastatin | 0.11 (0.05); 0.01–0.20 | 0.05 (0.06); −0.08–0.17 | 0.05 (0.06); −0.07–0.16 |
| Othersa | Ref | ||
| Statin dose | 0.19 (0.03); 0.13–0.25 | 0.03 (0.05); −0.06–0.12 | −0.01 (0.04); −0.09–0.08 |
| (ln) HOMA‐IR | |||
| Baseline statin users | 0.19 (0.02); 0.14–0.23 | 0.16 (0.03); 0.10–0.21 | 0.09 (0.03); 0.03–0.14 |
| Subgroup analyses | |||
| Statin type | |||
| Simvastatin | 0.01 (0.04); −0.07–0.10 | 0.08 (0.05); −0.03–0.19 | 0.05 (0.05); −0.04–0.15 |
| Atorvastatin | 0.10 (0.05); −0.02–0.19 | 0.04 (0.07); −0.09–0.17 | 0.04 (0.06); −0.08–0.16 |
| Othersa | Ref | ||
| Statin dose | 0.19 (0.04); 0.12–0.25 | 0.03 (0.05); −0.07–0.13 | −0.02 (0.05); −0.11–0.07 |
CI, confidence interval; HOMA‐IR, homeostasis model assessment‐insulin resistance; ln, natural logarithm; SEM, standard error of the mean.
Model 1 adjusted for age, gender, cohort (I, II and III), smoking status, alcohol consumption, physical activity, and education level. Model 2 included all variables used in Model 1 and also body mass index and hypertension.
Others including pravastatin and fluvastatin.
3.3. The association of statin use with incident type 2 diabetes
In a longitudinal follow‐up study, compared with never statin users, ever statin use was associated with incident type 2 diabetes (crude HR = 1.64; 95% CI: 1.37–1.97). The observed association remained statistically significant even after adjusting for a range of potential confounders; Model 2: HR = 1.38; 95% CI: 1.09–1.74 (Table 3). Current but not past use of statins was associated with a greater risk of type 2 diabetes; Model 2: HR = 1.52; 95% CI: 1.15–2.00 vs HR = 1.18; 95% CI: 0.83–1.67.
Table 3.
Univariate and multivariate Cox regression analysis on the associations of statin use with incident type 2 diabetes
| Crude effect: HR; 95% CI | Model 1: HR; 95% CI | Model 2: HR; 95% CI | |
|---|---|---|---|
| Type 2 diabetes (n = 8567) | |||
| Ever statin users | 1.64; 1.37–1.97 | 1.49; 1.19–1.86 | 1.38; 1.09–1.74 |
| Past statin users | 1.44; 1.10–1.89 | 1.20; 0.85–1.68 | 1.18; 0.83–1.67 |
| Current statin users | 1.63; 1.32–2.02 | 1.61; 1.23–2.10 | 1.52; 1.15–2.00 |
| Subgroup analyses‐among ever statin users | |||
| Statin type | |||
| Simvastatin | 0.98; 0.65–1.50 | 0.92; 0.55–1.53 | 0.91; 0.54–1.55 |
| Atorvastatin | 1.09; 0.69–1.72 | 1.50; 0.88–2.56 | 1.73; 0.99–3.01 |
| Othersa | Ref | ||
| Statin dose | 1.04; 0.92–1.17 | 1.02; 0.85–1.23 | 1.01; 0.79–1.28 |
| Statin duration | |||
| <30 days | 1.04; 0.43–2.51 | 0.31; 0.04–2.21 | 0.29; 0.04–2.04 |
| 31–365 | 2.02; 1.48–2.74 | 1.66; 1.11–2.49 | 1.70; 1.13–2.56 |
| >365 days | 1.51; 1.21–1.89 | 1.51; 1.15–1.98 | 1.37; 1.04–1.81 |
| Never statin users | Ref |
CI, confidence interval; HR, hazard ratio.
Model 1 adjusted for age, gender, cohort (I, II and III), smoking status, alcohol consumption, physical activity, and education level. Model 2 included all variables used in Model 1 and also body mass index and hypertension.
Others including pravastatin and fluvastatin.
Among ever statin users, no statistically significant effect of statin type and dosage on risk of incident type 2 diabetes was found. However, we found a significant association of statin duration with incident type 2 diabetes in which longer duration of statin use was associated with a statistically significantly increased risk of incident type 2 diabetes (Table 3).
3.4. Subgroup analyses
3.4.1. The association of cumulative statin use with incident type 2 diabetes
In a fully adjusted model, cumulative exposure to statins was associated with a 35% higher risk of type 2 diabetes (HR = 1.35; 95% CI: 1.01–1.82). Among statin users, statin dose did not modify the association; HR = 1.12; 95% CI: 0.87–1.44.
3.4.2. The association of cumulative statins with incident impaired fasting glucose
In a Cox regression analysis, cumulative statin use was associated with a 9% higher risk of incident impaired fasting glucose; HR = 1.09; 95% CI: 1.08–1.10 after adjusting for multiple confounders (Model 2). Among statin users, in a fully adjusted model, the association between statin dose and incident impaired fasting glucose was statistically significant in which higher dosages were related to an increased risk of incident impaired fasting glucose; HR = 2.34; 95% CI: 2.32–2.36.
3.5. Sensitivity analyses for the association between statin use and incident type 2 diabetes
In a series of sensitivity analyses, when we excluded cases with impaired fasting glucose at baseline, the positive association did not change (crude HR = 1.58; 95% CI: 1.23–2.04); however, when we added BMI and hypertension to Model 1, the association was no longer statistically significant (HR = 1.28; 95% CI: 1.00–1.76). Using postbaseline values for BMIs did not change the effect estimates. Further adjustment for TC, PPIs, fasting serum glucose and insulin concentrations did not affect the association (Table 4). Substituting TC with other blood lipids (HDL‐C, LDL‐C and TG) attenuated the observed associations. Stratification by age resulted in a statistically significant association only in individuals >65 years (HR = 1.36; 95% CI: 1.02–1.83) but not in those younger than 65 years (HR = 1.25; 95% CI: 0.85–1.84). In gender‐stratified analyses, the association between statin use and risk of incident type 2 diabetes was only statistically significant in males (HR = 1.52; 95% CI: 1.07–2.16) but not in females (HR = 1.28; 95% CI: 0.93–1.74). When we stratified the analysis by baseline BMI, our findings showed a statistically significant association only in a subset of overweight/obese subjects (HR = 1.42; 95% CI: 1.10–1.83) but not in those with normal BMI (HR = 1.18; 95% CI: 0.69–2.02). The interaction term of statin ever use with serum fasting glucose concentrations was highly significant, exerting the highest odds of incident type 2 diabetes (HR = 3.51; 95% CI: 2.51–4.91).
Table 4.
Sensitivity analyses on the associations of statin ever use with incident type 2 diabetes
| Model 2: HR; 95% CI | |
|---|---|
| Excluding cases with impaired fasting glucose at baseline | 1.28; 1.00–1.76 |
| Model 2 + TC | 1.42; 1.12–1.80 |
| Model 2 + HDL‐C, LDL‐C and TG | 1.26; 0.99–1.61 |
| Model 2 + F.H.D | 1.26; 0.98–1.62 |
| Model 2 + PPIs | 1.30; 1.03–1.65 |
| Model 2 + fasting serum glucose and insulin concentrations | 1.41; 1.12–1.78 |
| Interaction between statin ever use and serum fasting glucose concentrations | 3.51; 2.51–4.91 |
CI, confidence interval; F.H.D, family history of diabetes; HDL‐C, high density lipoproteins‐cholesterol; HR, hazard ratio; PPIs; proton pump inhibitors; TC, total cholesterol; TG, triglycerides.
Model 2 adjusted for age, gender, cohort (I, II and III), smoking status, alcohol consumption, physical activity, education level, body mass index and hypertension.
4. DISCUSSION
To the best of our knowledge, this is the first detailed population‐based study to show the effect of statin use on incident type 2 diabetes in those free from diabetes at baseline. At baseline, statin use was associated with elevated values for several glycaemic traits. After excluding these baseline statin users, new ever statin users during a follow‐up of up to 15 years showed a 38% increased risk of incident type 2 diabetes independent of statin type and dosage. All observed associations between statin use and incident type 2 diabetes remained significant even after adjusting for several potential risk factors for diabetes, eg age, physical activity and education level. However, there was a steep decrease in the effect estimates corresponding to the adjusted models.
Impaired glycaemic traits are important hallmarks of incident diabetes in which impaired glucose metabolism and decreased insulin sensitivity are the two major pathophysiological disturbances required for the conversion to overt type 2 diabetes.19 Currently, limited evidence is available concerning the impact of statin use on glycaemic traits.20, 21 Elevated baseline serum glucose and insulin concentrations might be explained by a diabetogenic effect of statins. However, conclusions from previous studies on this effect is inconsistent.22, 23, 24 Theoretically, some potential underlying mechanisms for this effect in diabetes‐free individuals consist of (i) decreased insulin‐mediated cellular glucose uptake leading to glucose intolerance, (ii) decreased isoprenoids synthesis which causes downregulation of glucose transporter 4 and leads to hyperglycaemia and hyperinsulinaemia, and (iii) reduced factors such as coenzyme Q10, farnesyl pyrophosphate and dolichol leading to altered insulin secretion/resistance.25, 26, 27, 28 As the association of statin use and serum fasting glucose concentrations was no longer significant after including BMI and hypertension, our finding suggests that the association between statins and diabetes could be through insulin secretion/resistance.
In our study, the significantly higher risk of incident type 2 diabetes among statin users confirms and extends the results of previous studies.6, 24, 29 Several observational studies and RCTs have already reported an increased risk of incident type 2 diabetes in subjects treated with statins; the increased risk reported by observational studies is much higher (44%) compared with RCTs (9–13%).6, 24 Discrepant results might be explained by the much longer follow‐up time in observational studies than in RCTs and a relatively less healthy population as trials preferably enrol participants without multimorbidity. Longer time could result in an increased probability of developing adverse drug events such as diabetes.29 According to the findings of a previous study including over 2 million subjects in the UK, the statin‐associated diabetes risk (HR = 1.22) over a period of 3 years was increased with longer statin duration in which the strongest significant association was observed when patients were followed up for 15–20 years (HR = 3.63).30 The magnitude of the association between statins and incident type 2 diabetes is also partly dependent on different confounders such as lipid profile and family history of diabetes.31 In the three large RCTs, baseline fasting glucose concentrations and features of the metabolic syndrome, eg TG, were shown as predictive factors of incident type 2 diabetes among statin users.32 Similarly, we showed that the association between statin therapy and incident type 2 diabetes was partly dependent on lipid profiles including HDL‐C, LDL‐C and TG, though independent of several diabetes risk factors such as hypertension. Moreover, our result of the interaction between statin use and serum fasting glucose concentrations was highly significant, implying the greatest statin‐associated diabetes risk in the presence of baseline impaired glucose concentrations. Our finding here is consistent with the results of the JUPITER trial where the majority of statin users who developed diabetes during 5 years of follow‐up already had impaired fasting glucose. However, this study was restricted to rosuvastatin at a single dosage of 20 mg daily.33
In our study, the majority of patients were on lipid‐soluble statins (simvastatin, atorvastatin and fluvastatin), while the number of patients on water‐soluble statins (pravastatin) was low (10.3%). Therefore, due to different actions of specific molecules of statins on insulin resistance and metabolic risk profiles, further studies are required. Our findings concerning a significantly increased risk of incident type 2 diabetes independent of statin types and dosages are in line with a previous meta‐analysis.34 To date, limited evidence suggests that different statin therapy including different types, dose and duration might exert distinct effects on statin‐related outcomes and the results reported by previous studies are conflicting.6, 34 In line with our hypothesis of a cumulative effect of statins on impaired glucose and insulin resistance, the risk of incident diabetes was significantly higher in intermediate (31–365 days) and long‐term (>365 days) users of statins.
We showed a significantly increased risk of statin‐related type 2 diabetes only among overweight/obese but not in individuals with a normal BMI. Given the concern that BMI values above normal and dyslipidaemia are both associated with the onset of type 2 diabetes,35 it is important to focus on more effective prevention in individuals with a high risk taking this medication. This could also help improve their lipid profile, thereby reducing the risk of cardiovascular diseases.
Our study has some strengths and limitations. First, the population‐based and prospectively gathered information on disease outcome make selection and information bias unlikely. The long follow‐up, the availability of data on statin type, dose and duration of use along with the use of a series of adjusted regression models with a broad range of potential confounders are among the most important strengths of this study. Moreover, we were able to provide a comprehensive overview of the associations between statins and glycaemic traits and incident type 2 diabetes. However, our study also has some potential limitations that should be acknowledged. Most importantly, to study the association between statins and incident type 2 diabetes, we excluded prevalent type 2 diabetes cases at baseline (n = 1165), and included only participants with normal fasting glucose levels (<6.1 mmol/L) who were not on hypoglycaemic medication. Unfortunately, we did not have data on HbA1c at baseline, a marker with the ability to reflect the long‐term glycaemic history. Also, the association between statins and type 2 diabetes could suffer from reverse causation, in which high risk individuals, eg patients with obesity and fatty liver, were prescribed statins to prevent CVD. However, to decrease the effect of reverse causality on our findings, we performed two subgroup analyses including the associations of type 2 diabetes with cumulative statin use until 1 year before diabetes and an impaired fasting glucose, where the results still showed significant associations. Cumulative statin users during follow‐up showed a 9% increased risk of incident impaired fasting glucose in which the magnitude of increased risk was directly proportional to the statin dosage. Although we were able to adjust the associations for many measured confounding variables, the possibility remains that some factors, eg genetic ones, which we have not measured still modify the associations.36 Additionally, compared with never statin users, patients treated with statins tend to be sicker and are more prone to enhanced glucose and insulin concentrations, and to eventually develop diabetes.37 We cannot rule out the effect of detection bias in our study in which individuals treated with statins are more likely to be clinically evaluated. Finally, as our study included a population consisting of roughly 95% Caucasian individuals, ethnicity and race might be an important factor for the association between statin use and susceptibility to diabetes, so our findings cannot be easily generalized to other populations.
In summary, using multiple subgroup and sensitivity analyses, we found a consistent significant association between statin use and incident type 2 diabetes. Our analysis also highlights the greatest effect of statins in the presence of hyperglycaemia and overweight/obesity. This suggests that it is necessary to take statin diabetogenicity into consideration in clinical practice when statin is indicated, emphasizing the concomitant need for dietary measures and exercise.
COMPETING INTERESTS
There are no competing interests to declare.
CONTRIBUTORS
F.A. and T.M. are responsible for the study concept and design; B.H.S. composed the statistical dataset, F.A. performed the statistical analyses and wrote the manuscript; T.M., C.O.R., M.G., O.H.F. and B.H.S. critically revised/edited the manuscript for intellectual content.
Supporting information
FIGURE S1
RS, Rotterdam Study. For the purpose of the current study, data on individuals attending three Rotterdam Study examinations of RSI‐3 (visit 3, cohort 1), RSII‐1 (visit 1, cohort 2), and RSIII‐1 (visit 1, cohort 3) were used. Red squares show baseline examinations considered for the current investigation and in which information on all covariates and potential intermediate factors were collected. The red line shows the end of follow‐up for incidence of type 2 diabetes (1 January 2012), whereas the start of diabetes follow‐up initiated in the baseline examination is depicted with red squares.
TABLE S1 Codes used to identify statins (https://www.whocc.no/atc_ddd_index/?code=C10AAHMG CoA reductase inhibitors)
ACKNOWLEDGEMENTS
The contribution of the study participants, general practitioners and pharmacists of the Ommoord district to the Rotterdam Study is gratefully acknowledged.
Ahmadizar F, Ochoa‐Rosales C, Glisic M, Franco OH, Muka T, Stricker BH. Associations of statin use with glycaemic traits and incident type 2 diabetes. Br J Clin Pharmacol. 2019;85:993–1002. 10.1111/bcp.13898
The authors confirm that the PI for this paper is Prof. dr. Bruno H. Stricker.
REFERENCES
- 1. Baigent C, Landray M, Reith C, et al. Study of heart and renal protection (SHARP): Randomized trial to assess the effects of lowering low‐density lipoprotein cholesterol among 9,438 patients with chronic kidney disease. Am Heart J. 2010;160(5):785‐794. [DOI] [PubMed] [Google Scholar]
- 2. Cholesterol Treatment Trialists' (CTT) Collaborators , Kearney PM, Blackwell L, et al. Efficacy of cholesterol‐lowering therapy in 18,686 people with diabetes in 14 randomised trials of statins: A meta‐analysis. Lancet. 2008;371(9607):117‐125. [DOI] [PubMed] [Google Scholar]
- 3. Culver AL, Ockene IS, Balasubramanian R, et al. Statin use and risk of diabetes mellitus in postmenopausal women in the women's health initiative. Arch Intern Med. 2012;172(2):144‐152. [DOI] [PubMed] [Google Scholar]
- 4. Cederberg H, Stancakova A, Yaluri N, Modi S, Kuusisto J, Laakso M. Increased risk of diabetes with statin treatment is associated with impaired insulin sensitivity and insulin secretion: A 6 year follow‐up study of the METSIM cohort. Diabetologia. 2015;58(5):1109‐1117. [DOI] [PubMed] [Google Scholar]
- 5. Thakker D, Nair S, Pagada A, Jamdade V, Malik A. Statin use and the risk of developing diabetes: A network meta‐analysis. Pharmacoepidemiol Drug Saf. 2016;25(10):1131‐1149. [DOI] [PubMed] [Google Scholar]
- 6. Casula M, Mozzanica F, Scotti L, et al. Statin use and risk of new‐onset diabetes: A meta‐analysis of observational studies. Nutr Metab Cardiovasc Dis. 2017;27(5):396‐406. [DOI] [PubMed] [Google Scholar]
- 7. Chen YH, Chen YC, Liu CS, Hsieh MC. The different effects of atorvastatin and pravastatin on cell death and PARP activity in pancreatic NIT‐1 cells. J Diabetes Res. 2016;2016:1828071. [DOI] [PMC free article] [PubMed] [Google Scholar]
- 8. Lorza‐Gil E, Salerno AG, Wanschel AC, et al. Chronic use of pravastatin reduces insulin exocytosis and increases beta‐cell death in hypercholesterolemic mice. Toxicology. 2016;344–346:42‐52. [DOI] [PubMed] [Google Scholar]
- 9. Rajpathak SN, Kumbhani DJ, Crandall J, Barzilai N, Alderman M, Ridker PM. Statin therapy and risk of developing type 2 diabetes: A meta‐analysis. Diabetes Care. 2009;32(10):1924‐1929. [DOI] [PMC free article] [PubMed] [Google Scholar]
- 10. Sattar N, Preiss D, Murray HM, et al. Statins and risk of incident diabetes: A collaborative meta‐analysis of randomised statin trials. Lancet. 2010;375(9716):735‐742. [DOI] [PubMed] [Google Scholar]
- 11. Ikram MA, Brusselle GGO, Murad SD, et al. The Rotterdam Study: 2018 update on objectives, design and main results. Eur J Epidemiol. 2017;32(9):807‐850. [DOI] [PMC free article] [PubMed] [Google Scholar]
- 12. Neeley WE. Simple automated determination of serum or plasma glucose by a hexokinase‐glucose‐6‐phosphate dehydrogenase method. Clin Chem. 1972;18(6):509‐515. [PubMed] [Google Scholar]
- 13. Matthews DR, Hosker JP, Rudenski AS, Naylor BA, Treacher DF, Turner RC. Homeostasis model assessment: Insulin resistance and beta‐cell function from fasting plasma glucose and insulin concentrations in man. Diabetologia. 1985;28(7):412‐419. [DOI] [PubMed] [Google Scholar]
- 14. Ligthart S, van Herpt TT, Leening MJ, et al. Lifetime risk of developing impaired glucose metabolism and eventual progression from prediabetes to type 2 diabetes: A prospective cohort study. Lancet Diabetes Endocrinol. 2016;4(1):44‐51. [DOI] [PubMed] [Google Scholar]
- 15. Stel VS, Smit JH, Pluijm SM, Visser M, Deeg DJ, Lips P. Comparison of the LASA physical activity questionnaire with a 7‐day diary and pedometer. J Clin Epidemiol. 2004;57(3):252‐258. [DOI] [PubMed] [Google Scholar]
- 16. Friedewald WT, Levy RI, Fredrickson DS. Estimation of the concentration of low‐density lipoprotein cholesterol in plasma, without use of the preparative ultracentrifuge. Clin Chem. 1972;18(6):499‐502. [PubMed] [Google Scholar]
- 17. Stricker BH, Stijnen T. Analysis of individual drug use as a time‐varying determinant of exposure in prospective population‐based cohort studies. Eur J Epidemiol. 2010;25(4):245‐251. [DOI] [PMC free article] [PubMed] [Google Scholar]
- 18. Lin HC, Hsiao YT, Lin HL, et al. The use of proton pump inhibitors decreases the risk of diabetes mellitus in patients with upper gastrointestinal disease: A population‐based retrospective cohort study. Medicine (Baltimore). 2016;95(28):e4195. [DOI] [PMC free article] [PubMed] [Google Scholar]
- 19. Singh B, Saxena A. Surrogate markers of insulin resistance: A review. World J Diabetes. 2010;1(2):36‐47. [DOI] [PMC free article] [PubMed] [Google Scholar]
- 20. Sukhija R, Prayaga S, Marashdeh M, et al. Effect of statins on fasting plasma glucose in diabetic and nondiabetic patients. J Invest Med. 2009;57(3):495‐499. [DOI] [PubMed] [Google Scholar]
- 21. Parida S, Swain TR, Routray SN, Maiti R. Effect of atorvastatin on glycaemic parameters in normoglycaemic and prediabetic subjects: A prospective, panel study. J Clin Diagn Res. 2017;11(2):FC04‐FC09. [DOI] [PMC free article] [PubMed] [Google Scholar]
- 22. Kostapanos MS, Milionis HJ, Agouridis AD, Rizos CV, Elisaf MS. Rosuvastatin treatment is associated with an increase in insulin resistance in hyperlipidaemic patients with impaired fasting glucose. Int J Clin Pract. 2009;63(9):1308‐1313. [DOI] [PubMed] [Google Scholar]
- 23. Chan DC, Pang J, Watts GF. Pathogenesis and management of the diabetogenic effect of statins: A role for adiponectin and coenzyme Q10? Curr Atheroscler Rep. 2015;17(1):472. [DOI] [PubMed] [Google Scholar]
- 24. Millan Nunez‐Cortes J, Cases Amenos A, Ascaso Gimilio JF, et al. Consensus on the statin of choice in patients with impaired glucose metabolism: Results of the DIANA study. Am J Cardiovasc Drugs. 2017;17(2):135‐142. [DOI] [PMC free article] [PubMed] [Google Scholar]
- 25. Wang S, Cai R, Yuan Y, Varghese Z, Moorhead J, Ruan XZ. Association between reductions in low‐density lipoprotein cholesterol with statin therapy and the risk of new‐onset diabetes: A meta‐analysis. Sci Rep. 2017;7(1):39982. [DOI] [PMC free article] [PubMed] [Google Scholar]
- 26. Kanda M, Satoh K, Ichihara K. Effects of atorvastatin and pravastatin on glucose tolerance in diabetic rats mildly induced by streptozotocin. Biol Pharm Bull. 2003;26(12):1681‐1684. [DOI] [PubMed] [Google Scholar]
- 27. Andersson C, Lyass A, Larson MG, Robins SJ, Vasan RS. Low‐density‐lipoprotein cholesterol concentrations and risk of incident diabetes: Epidemiological and genetic insights from the Framingham Heart Study. Diabetologia. 2015;58(12):2774‐2780. [DOI] [PMC free article] [PubMed] [Google Scholar]
- 28. Chen WM, Sheu WH, Tseng PC, et al. Modulation of microRNA expression in subjects with metabolic syndrome and decrease of cholesterol efflux from macrophages via microRNA‐33‐mediated attenuation of ATP‐binding cassette transporter A1 expression by statins. PLoS One. 2016;11(5):e0154672. [DOI] [PMC free article] [PubMed] [Google Scholar]
- 29. Mansi I, Frei CR, Wang CP, Mortensen EM. Statins and new‐onset diabetes mellitus and diabetic complications: A retrospective cohort study of US healthy adults. J Gen Intern Med. 2015;30(11):1599‐1610. [DOI] [PMC free article] [PubMed] [Google Scholar]
- 30. Macedo AF, Douglas I, Smeeth L, Forbes H, Ebrahim S. Statins and the risk of type 2 diabetes mellitus: Cohort study using the UK clinical practice research datalink. BMC Cardiovasc Disord. 2014;14:85. [DOI] [PMC free article] [PubMed] [Google Scholar]
- 31. Wilson PW, Meigs JB, Sullivan L, Fox CS, Nathan DM, D'Agostino RB Sr. Prediction of incident diabetes mellitus in middle‐aged adults: The Framingham Offspring Study. Arch Intern Med. 2007;167(10):1068‐1074. [DOI] [PubMed] [Google Scholar]
- 32. Waters DD, Ho JE, DeMicco DA, et al. Predictors of new‐onset diabetes in patients treated with atorvastatin: Results from 3 large randomized clinical trials. J Am Coll Cardiol. 2011;57(14):1535‐1545. [DOI] [PubMed] [Google Scholar]
- 33. Ridker PM, Pradhan A, MacFadyen JG, Libby P, Glynn RJ. Cardiovascular benefits and diabetes risks of statin therapy in primary prevention: An analysis from the JUPITER trial. Lancet. 2012;380(9841):565‐571. [DOI] [PMC free article] [PubMed] [Google Scholar]
- 34. Navarese EP, Buffon A, Andreotti F, et al. Meta‐analysis of impact of different types and doses of statins on new‐onset diabetes mellitus. Am J Cardiol. 2013;111(8):1123‐1130. [DOI] [PubMed] [Google Scholar]
- 35. Pandey AK, Pandey D, Pandit A. Obesity and lipid profile study in type 2 diabetes patients with auditory and reaction time deficits and non‐diabetic control subjects. Adv Diabetes Metabol. 2017;5:1‐5. [Google Scholar]
- 36. Stančáková A, Kuulasmaa T, Kuusisto J, et al. Genetic risk scores in the prediction of plasma glucose, impaired insulin secretion, insulin resistance and incident type 2 diabetes in the METSIM study. Diabetologia. 2017;60(9):1722‐1730. [DOI] [PubMed] [Google Scholar]
- 37. Schrom JR, Caraballo PJ, Castro MR, Simon GJ. Quantifying the effect of statin use in pre‐diabetic phenotypes discovered through association rule mining. AMIA Annu Symp Proc. 2013;2013:1249‐1257. [PMC free article] [PubMed] [Google Scholar]
Associated Data
This section collects any data citations, data availability statements, or supplementary materials included in this article.
Supplementary Materials
FIGURE S1
RS, Rotterdam Study. For the purpose of the current study, data on individuals attending three Rotterdam Study examinations of RSI‐3 (visit 3, cohort 1), RSII‐1 (visit 1, cohort 2), and RSIII‐1 (visit 1, cohort 3) were used. Red squares show baseline examinations considered for the current investigation and in which information on all covariates and potential intermediate factors were collected. The red line shows the end of follow‐up for incidence of type 2 diabetes (1 January 2012), whereas the start of diabetes follow‐up initiated in the baseline examination is depicted with red squares.
TABLE S1 Codes used to identify statins (https://www.whocc.no/atc_ddd_index/?code=C10AAHMG CoA reductase inhibitors)