

Abstract
Based on SPME‐GC‐MS analysis, it could be found that the production of acetic acid, phenethyl acetate, and isoamyl acetate gradually increased in the apple vinegar fermentation broth with the fermentation time. Consequently, in order to systematically explore the dynamic changes of microbial diversity and metabolites in the process of apple vinegar fermentation, 16S rDNA were sequenced and analyzed in this work. The present results showed that bacterial diversity was rich and exhibited a certain variation during the dynamic fermentation process of apple vinegar. Furthermore, Lactococcus and Oenococcus were the predominant bacteria in the pre‐fermentation (alcoholic fermentation) of apple vinegar, while the dominant bacteria in the middle and late fermentation stages (acetic acid fermentation) were Lactococcus and Acetobacter. In addition, during the whole fermentation process of apple vinegar, Lactococcus was the most dominant bacteria, Oenococcus was the unique species in the stage of alcohol fermentation, and Acetobacter increased rapidly in the stage of acetic acid fermentation. In conclusion, our finding provided a theoretical basis for the processing technology of apple vinegar fermentation, and a theory evidence for the safety and health assessment of apple vinegar.
Keywords: 16S rDNA, apple vinegar, fermentation, microbial diversity, physiological and biochemical characteristics
1. INTRODUCTION
Currently, healthy and safe fruit vinegar beverage is more and more favored by consumers with the improvement of people's living standards. Furthermore, apple vinegar was produced with apple juice through alcohol fermentation and acetic acid fermentation. It is a low‐cost and good flavor acid seasoning fruit vinegar beverage with high nutritional values. Additionally, previous works reported that apple vinegar has various potential pharmacological functions, such as antifungal properties, oral inflammation improvement (Mota, de Castro, de Araújo Oliveira, & de Oliveira Lima, 2015), hyperlipidemia prevention (Budak et al., 2011), disaccharide activity inhibition, and diabetes reduction. Studies have also shown that many functions of fruit vinegar drinks closely related to the microbial diversity in the fermentation process.
The 16S rDNA, a gene encoding 16S rRNA (a subunit of ribosomal RNA), includes conserved regions and hypervariable regions. The conserved regions are not significantly different among microbial species, while the hypervariable regions showed species specificity which altered with the difference of affiliation. At present, 16S rDNA sequencing technology has been widely used in microbial diversity research on animal flora, such as nematodes (Razia, Karthikraja, Padmanaban, Chellapandi, & Sivaramakrishnan, 2011), pigs (Qin et al., 2016), planthoppers (Yeh, Yang, & Hui, 2005), shrimps (Li, Xu, & Kou, 2014), fish (Pandey & Rajagopal, 2016), cattle and sheep (Gamal, Ahmed, Ahmed, & Teleb, 2016), bacterial and fungal pathogens, such as Cucumber wilt (Du et al., 2017), bacteremia (Alfonso et al., 2013), otitis media (Priit & Jelena, 2012), as well as soil microbial (Rana, Nidhal, & Abed, 2014), acid mine (Xie et al., 2011), and biological desulfurization (Lv et al., 2016). Besides, 16S rDNA is also considered as an important indicator for the classification of microorganisms in fermented foods such as industrial vinegar (Trček, Lipoglavšek, & Avguštin, 2016; Trček, Mahnič, & Rupnik, 2016), Chinese cereal vinegar (Li et al., 2016), grain vinegar (Wang, Zhang, & Gui, 2015), coconut vinegar (Mohamad, Yeap, & Ky, 2017), wine‐soaked vinegar (Trček et al., 2016, 2016), apple vinegar (Štornik, Skok, & Trček, 2016), and other food microbial fermentation products. However, there are few researches about 16S rDNA analysis performed on the microbial diversity during apple vinegar fermentation.
In the present study, we constructed a high‐throughput sequencing library by 16S rDNA to identify the diversity of microbial flora during the dynamic fermentation of apple vinegar. Our results provided a theoretical basis for the processing technology of apple vinegar fermentation, and a theory evidence for the safety and health assessment of apple vinegar.
2. MATERIALS AND METHODS
2.1. Materials and strains
Fuji apples used in this research collected from Qingyang, Gansu province, China. Yeast strains Saccharomyces cerevisiae CICC1750 and acetic acid bacteria Acetobacter pasteurianus CICC20056 were purchased from China microbial culture preservation Center (Beijing, China).
2.2. Media preparation
Potato medium: potato 200 g, glucose 20 g, tap water 1,000 ml, pH 6; Liquid medium: glucose 1%, yeast powder 1%, anhydrous alcohol 3%, pH 4.5; Solid medium: glucose 1%, yeast powder 1%, absolute alcohol 3%, agar 2%, pH 4.5.
2.3. Bacterial activation
The dissolved bacteria suspension was transferred to a tube containing 4–5 ml liquid medium, mix, and take 100 μl transferred to a solid medium, a generation of bacteria to be the extension of training time, transfer to 2–3 generations to restore vitality.
2.4. Apple juice processing
Fuji apples were crushed after washing, and then, the apple juice was prepared and subsequently prepared by 0.04% pectinase. Then, the apple juice was digested at 45°C for 1 hr and sterilized at 90°C for 1.0 min.
2.5. Apple vinegar producing technology
After sterilization, the apple juice was filtrates. For the alcohol fermentation stage, 8% activated yeast liquids were added into 1,000 ml apple juice. Then, the mixture samples were fermented statically at 24°C. Then, the alcohol fermentation was stopped until the alcohol concentration was no longer changed (the alcohol content was determined as described in the following part of 2.5), and the acetic acid fermentation was started. The 10% activated acetic acid bacteria solution was added and shaking cultured with 120 rpm/min at 28°C, and the acetic acid fermentation was stopped until the concentration of acetic acid kept stable (the acetic acid content was determined as described in the following part of 2.5).
After 8 days of alcohol fermentation and 8 days of acetic acid concentration, the fermented fluids were filtrated and sterilized. Subsequently, the sterilized fermented fluids were placed statically in airtight container for approximately 7 days to afford the apple vinegar.
2.6. Alcohol and acetic acid determination using SPME‐GC‐MS assay
Contents of alcohol and acetic acid were determined by using headspace solid phase micro‐extraction gas chromatography–mass spectrometry (SPME‐GC‐MS) assays according to the method reported by Wang, Wang, Liu, Liu, and Fan, (2012). Briefly, volatile substances including alcohol and acetic acid were extracted by a DVB/CAR/PDMS probe of the TriPlus‐RSH‐Autosampler‐SPME system. A DB‐WAX capillary column (30 m × 0.25 mm × 0.25 μm) was used for the sample separation, and the temperature program carried out was as follows: the initial temperature was 40°C for 2 min, which was increased to 180°C at 5°C/min; then, the temperature increased to 230°C at 15°C/min. Helium (99.999%) was used as carrier gas kept at a flow rate of 1.2 ml/min. The split rate was set as 40:1, and inlet volume was set as 1.0 μl. Electron impact ionization (EI) was used, and the ion energy was set as 70 eV with the mass range scanned was 33.00–350.00 u in full‐scan acquisition mode. Alcohol and acetic acid were identified by comparing the mass spectra with the standard references and quantified using internal standard method.
2.7. MetaVx™ library construction and Illumina MiSeq sequencing
High‐throughput sequencing library construction and sequencing based on Illumina MiSeq platform was carried out by GENEWIZ Corporation (Suzhou, China). DNA samples were tested for concentration using the Qubit 2.0 Fluorometer, and a sequencing library was constructed using the MetaVx™ library construction kit. Using 30–50 ng of DNA as a template, the PCR primers used were “CCTACGGRRBGCASCKVRVGAAT” sequence and a downstream primer comprising the “GGACTACNVGGGTWTCTAATCC” sequence, and two highly variable regions including V3 and V4 on the 16S rDNA of the prokaryote were amplified, and the end of the PCR product of 16S rDNA Index linker for NGS sequencing. Library quality was detected using an Agilent 2100 bio‐analyzer, and library concentrations were detected by a Qubit 2.0 Fluorometer. After hybridization of DNA libraries, 2 × 300 bp double‐ended sequencing (PE) was performed by Illumina MiSeq and the sequence information was read by MiSeq's own MiSeq Control Software (MCS).
2.8. Biological information analysis
Based on the OTU analytical results, Shannon, Chao1, and other α‐diversity indices were analyzed for each sample separately to obtain the information of species richness and evenness of each sample. Based on taxonomic information, the statistical analysis of community structure was carried out at each classification level. Through the NMDS analysis, we constructed the clustering tree of UPGMA (Unweighted pair group method), which showed the difference of community structure between different samples or groups.
2.9. Statistical analysis
The experiments were repeated a minimum of three times. All data were expressed as means ± SD. Statistical differences between control and treated groups were evaluated using Student's t test, and differences between groups were considered statistically significant at p value <0.05.
3. RESULTS AND DISCUSSION
3.1. Results of biochemical and physiological factors assay during apple vinegar fermentation
Alcohol and acetic acid contents were determined in different periods during the fermentation of apple vinegar by CK (0d), S1 (3d), S2 (7d), S3 (9d), S4 (10d), S5 (12d), and S6 (14d). Results indicated that the highest alcohol content appeared at S1 and then declined sharply while the acetic acid concentration gradually increased and reached peak at S6, which showed that the alteration of alcohol concentration and acetic acid concentration showed a negative correlation during the fermentation of apple vinegar (Figure 1a). This phenomenon mainly caused by the interaction of various microorganisms in the process of apple vinegar fermentation, which regulated alcohol fermentation and acetic acid fermentation of the entire vinegar production phase by turning glucose into alcohol at first, and then oxidizing alcohol into acetic acid. We also found that phenylethyl acetate (Figure 1b) and iso‐amyl acetate (Figure 1c) production was significantly increased with the extension of fermentation time, indicating that S6 contains the most characteristic aroma components and flavors.
Figure 1.
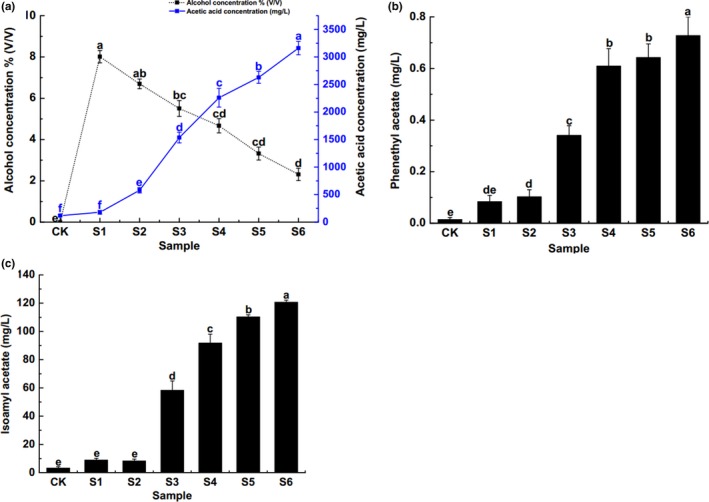
Physiological and biochemical detection during fermentation. (a) The relationship between alcohol concentration and concentration of acetic acid during the fermentation of apple vinegar. (b) The concentration of ethyl acetate during the fermentation of apple vinegar. (c) The concentration of isoamyl acetate during the fermentation of apple vinegar. Same a‐f indicates that there is no significant difference between different samples during the fermentation process (P > 0.05), while the difference is significant (P < 0.05)
3.2. 16S rDNA sequencing
Samples of CK, S1, S2, S3, S4, S5, and S6 in the fermentation process of apple vinegar were used to construct the 16S rDNA clone library for bioinformatics analysis. V3 and V4 regions of 16S rDNA gene during the fermentation of apple vinegar were sequenced and performed data amount and quality optimization statistics (Table 1). All sequences were clustered into 29 OTU, and all the OTU were classified as bacterial community by using Qiime (1.9.1) and Vsearch (1.9.6) analysis software (Table 2).
Table 1.
Sequencing raw data quality statistics
| Sample | Nucleic acid concentration | Reads | Nochimera | Sample | Nucleic acid concentration | Reads | Nochimera |
|---|---|---|---|---|---|---|---|
| CK_1 | 4.520 | 119476 | 53059 | S4_1 | 0.458 | 223438 | 101334 |
| CK_2 | 0.840 | 152638 | 67470 | S4_2 | 0.366 | 107226 | 47216 |
| CK_3 | 0.418 | 137928 | 60832 | S4_3 | 0.380 | 96456 | 42367 |
| S1_1 | 3.100 | 162776 | 73809 | S5_1 | 0.458 | 153152 | 68445 |
| S1_2 | 2.040 | 114578 | 50808 | S5_2 | 0.624 | 108450 | 47603 |
| S1_3 | 3.940 | 109658 | 48150 | S5_3 | 0.386 | 110232 | 48772 |
| S2_1 | 0.610 | 139038 | 60656 | S6_1 | 0.120 | 125710 | 56283 |
| S2_2 | 0.542 | 111092 | 48110 | S6_2 | 12.800 | 198876 | 91673 |
| S2_3 | 1.010 | 95896 | 41801 | S6_3 | 11.100 | 155922 | 71576 |
| S3_1 | 0.398 | 171454 | 75488 | ||||
| S3_2 | 0.390 | 131512 | 58123 | ||||
| S3_3 | 0.510 | 138950 | 61216 |
Table 2.
OTU table
| ID | Taxonomy |
|---|---|
| OTU01 | k__Bacteria; p__Firmicutes; c__Bacilli; o__Lactobacillales; f__Lactobacillaceae; g__Lactobacillus; s__Lactobacillus_farraginis |
| OTU02 | k__Bacteria; p__Proteobacteria; c__Gammaproteobacteria; o__Enterobacteriales; f__Enterobacteriaceae |
| OTU03 | k__Bacteria; p__Firmicutes; c__Bacilli; o__Lactobacillales; f__Lactobacillaceae; g__Lactobacillus; s__Lactobacillus_plantarum |
| OTU04 | k__Bacteria; p__Firmicutes; c__Bacilli; o__Lactobacillales; f__Lactobacillaceae; g__Lactobacillus; Ambiguous_taxa |
| OTU05 | k__Bacteria; p__Proteobacteria; c__Alphaproteobacteria; o__Rhodospirillales; f__Acetobacteraceae; g__Acetobacter; Ambiguous_taxa |
| OTU06 | k__Bacteria; p__Firmicutes; c__Bacilli; o__Lactobacillales; f__Leuconostocaceae; g__Oenococcus; Ambiguous_taxa |
| OTU07 | k__Bacteria; p__Proteobacteria; c__Gammaproteobacteria; o__Enterobacteriales; f__Enterobacteriaceae; g__Escherichia‐Shigella; Ambiguous_taxa |
| OTU08 | k__Bacteria |
| OTU09 | k__Bacteria; p__Firmicutes;c__Bacilli; o__Lactobacillales; f__Lactobacillaceae; g__Lactobacillus; s__Lactobacillus_casei |
| OTU10 | k__Bacteria; p__Proteobacteria; c__Gammaproteobacteria; o__Enterobacteriales; f__Enterobacteriaceae |
| OTU11 | k__Bacteria; p__Proteobacteria; c__Gammaproteobacteria; o__Enterobacteriales; f__Enterobacteriaceae |
| OTU12 | k__Bacteria; p__Firmicutes;c__Bacilli; o__Lactobacillales; f__Lactobacillaceae; g__Lactobacillus; s__Lactobacillus_salivarius |
| OTU13 | k__Bacteria; p__Proteobacteria; c__Betaproteobacteria; o__Burkholderiales; f__Comamonadaceae; g__Variovorax; Ambiguous_taxa |
| OTU14 | k__Bacteria; p__Firmicutes; c__Bacilli; o__Bacillales; f__Bacillaceae; g__Bacillus |
| OTU15 | k__Bacteria; p__Gemmatimonadetes; c__S0134_terrestrial_group; o__uncultured_Gemmatimonadetes_bacterium; f__uncultured_Gemmatimonadetes_bacterium; g__uncultured_Gemmatimonadetes_bacterium; s__uncultured_Gemmatimonadetes_bacterium |
| OTU16 | k__Bacteria; p__Chlorobi; c__Chlorobia; o__Chlorobiales; f__OPB56 |
| OTU17 | k__Bacteria; p__Actinobacteria; c__Actinobacteria; o__Frankiales; f__Sporichthyaceae; g__hgcI_clade |
| OTU18 | k__Bacteria; p__Proteobacteria; c__Betaproteobacteria; o__Burkholderiales; f__Burkholderiaceae; g__Limnobacter |
| OTU19 | k__Bacteria; p__Proteobacteria; c__Betaproteobacteria; o__Methylophilales; f__Methylophilaceae; g__Candidatus_Methylopumilus; s__uncultured_bacterium |
| OTU20 | k__Bacteria; p__Fusobacteria; c__Fusobacteriia;o__Fusobacteriales; f__Fusobacteriaceae; g__Cetobacterium |
| OTU21 | k__Bacteria; p__Proteobacteria;c__Gammaproteobacteria;o__Pseudomonadales;f__Moraxellaceae;g__Acinetobacter |
| OTU22 | k__Bacteria; p__Bacteroidetes; c__Flavobacteriia; o__Flavobacteriales; f__Flavobacteriaceae; g__Chryseobacterium; Ambiguous_taxa |
| OTU23 | k__Bacteria; p__Actinobacteria; c__Thermoleophilia; o__Solirubrobacterales |
| OTU25 | k__Bacteria; p__Bacteroidetes; c__Flavobacteriia; o__Flavobacteriales; f__Flavobacteriaceae; g__Myroides; s__uncultured_bacterium |
| OTU26 | k__Bacteria; p__Verrucomicrobia; c__Opitutae; o__Opitutales; f__Opitutaceae; g__Opitutus; Ambiguous_taxa |
| OTU27 | k__Bacteria; p__Proteobacteria; c__Alphaproteobacteria; o__Rickettsiales; f__Rickettsiales_Incertae_Sedis; g__Candidatus_Finniella;Ambiguous_taxa |
| OTU28 | k__Bacteria; p__Bacteroidetes; c__Bacteroidetes_Incertae_Sedis; o__Order_III; f__BIgi5; g__uncultured_bacterium; s__uncultured_bacterium |
| OTU29 | k__Bacteria; p__Bacteroidetes; c__Sphingobacteriia; o__Sphingobacteriales; f__NS11‐12_marine_group; g__uncultured_bacterium; s__uncultured_bacterium |
3.3. Species annotation
To obtain the taxonomic information of OTU, a representative sequence was selected for each OTU, and the representative sequence was annotated by species using RDP classifier. Then, the community composition of each sample was obtained by Qiime (1.9.1) software analysis. The result showed that the dominant bacteria in the dynamic fermentation of apple vinegar are Lactococcus, Oenococcus and Acetobacter. Among them, there are obvious differences in the composition of microbial community between the control group and the treatment group; however, there is also certain regularity (Figure 2). Compared to control CK, the main bacterial species in treatment groups S1, S2, S3, S4, S5, and S6 was Lactococcus, and its number tended gently with the increase in fermentation time, which showed that Lactococcus is the key microorganisms in the fermentation process of apple vinegar. However, Oenococcus, uniquely contained at S1, is also the dominant bacterium, indicating that the early fermentation of apple vinegar belongs to alcoholic fermentation.
Figure 2.

Heat map of species distribution. Column names as samples information, the name for the species name, the figure at the top of the tree as samples clustering, clustering tree species figure on the left, and the middle heat maps each grid corresponding to different color value for each row of the relative abundance of species
There is Acetobacter with strong acid‐producing ability in S2, S3, S4, S5, and S6 samples, which quantity increased sharply and then decreased slightly with the prolongation of fermentation time. Acetobacter was multiplied in the middle of acetic acid fermentation, indicated that it was the secondary dominant bacterium in the fermentation of apple vinegar. Specially, the species in S6 was the most abundant; which indicated that there are many kinds of microorganisms in the late fermentation of acetic acid, which is of great significance to the unique taste and scent of apple vinegar.
3.4. Sample complexity analysis
In community ecology, α‐diversity is mainly concerned with the single sample diversity analysis, which can reflect the number of species in the microbial communities. The species richness and diversity of environmental communities can be estimated by the analysis of Chao1, Shannon, Simpson, and good's coverage indices (Table 3). Compared with the control group, the Chao1 index of the S6 sample of apple vinegar was significantly higher than that of the other samples, while the Simpson index was significantly lower than that of the other samples, indicating that the microbial community differed greatly in the later stage of apple vinegar fermentation. The Shannon index of sample S2 was significantly higher than that of other samples, indicating that there was a great difference in microbial community in sample S2. These results were consistent with the results of subordinate level classification statistics and species distribution heat map analysis. The good's coverage index of all the samples is 1, that is, the coverage of the sample reaches 100%, indicating that the coverage of the sample library is very large, and the probability that the sample has not been detected in this sequence is very low, which indicates that this sequencing library has very good representation.
Table 3.
Collation of alpha diversity results
| Sample | Chao 1 | Shannon | Simpson | GC | Sample | Chao 1 | Shannon | Simpson | GC |
|---|---|---|---|---|---|---|---|---|---|
| CK_1 | 8.0 | 0.033 | 0.006 | 1 | S4_1 | 6.0 | 1.127 | 0.427 | 1 |
| CK_2 | 3.0 | 0.006 | 0.001 | 1 | S4_2 | 6.0 | 0.968 | 0.355 | 1 |
| CK_3 | 5.0 | 0.009 | 0.001 | 1 | S4_3 | 6.0 | 1.218 | 0.458 | 1 |
| S1_1 | 14.0 | 1.212 | 0.520 | 1 | S5_1 | 8.0 | 1.101 | 0.406 | 1 |
| S1_2 | 13.0 | 1.233 | 0.527 | 1 | S5_2 | 8.0 | 1.069 | 0.398 | 1 |
| S1_3 | 14.0 | 1.219 | 0.524 | 1 | S5_3 | 12.0 | 0.968 | 0.354 | 1 |
| S2_1 | 8.0 | 1.332 | 0.526 | 1 | S6_1 | 7.0 | 0.862 | 0.300 | 1 |
| S2_2 | 10.0 | 1.160 | 0.461 | 1 | S6_2 | 22.0 | 1.152 | 0.354 | 1 |
| S2_3 | 8.0 | 1.359 | 0.558 | 1 | S6_3 | 20.5 | 0.903 | 0.273 | 1 |
| S3_1 | 7.0 | 0.994 | 0.378 | 1 | |||||
| S3_2 | 15.0 | 0.865 | 0.314 | 1 | |||||
| S3_3 | 6.0 | 0.959 | 0.362 | 1 |
GC: good coverage.
3.5. Rarefaction curve
The rarefaction curve is widely used to determine whether sample size is adequate to estimate species richness. The results showed that as the depth of sequencing increases, the number of OTUs increases and the rarefaction curve tends to be flat and eventually reached the plateau which sequencing data can reflect the dynamic process of apple vinegar bacterial diversity (Figure 3).
Figure 3.
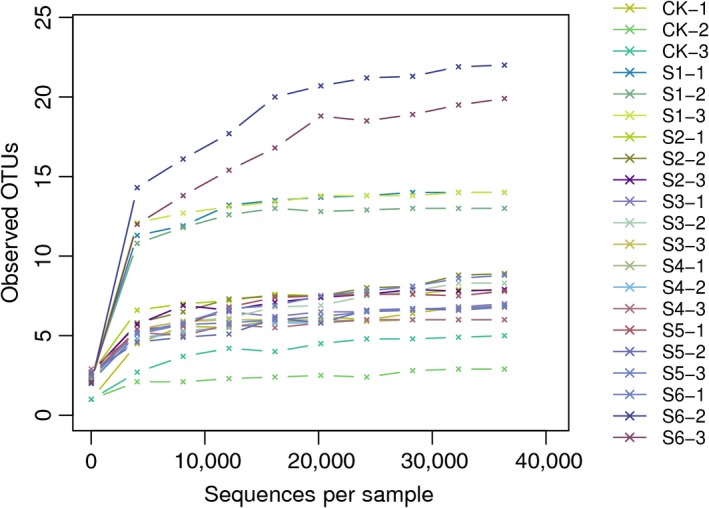
OTUs rarefaction curves. The x‐coordinate is the number of effective Sequences, and the ordinate is the number of OTU. Each curve in the graph represents a sample with different color marks; Sequence depth increase the number of OTU. When the curve flattens out, the number of OTU detected is no longer increased with the increase in the amount of data extracted, and the sequencing data are reasonable
3.6. Significant analysis of differences in the structure of community groups
Significant difference analysis of species composition among groups could be performed according to the community abundance data of different groups, and the strict statistical method can be used to detect the classification of abundance difference between the two microbial communities. The multiple hypothesis tests and false discovery of rare and the frequency data rate (FDR) analysis can assess the significance of the observed differences. From the Metastats difference map (Figure 4), we know that there are significant differences in the abundance of Lactococcus, Oenococcus and Acetobacter among the dominant species in all the samples compared with the control group. There are also insignificant differences in abundance, which is consistent with the results of species distribution heat map.
Figure 4.
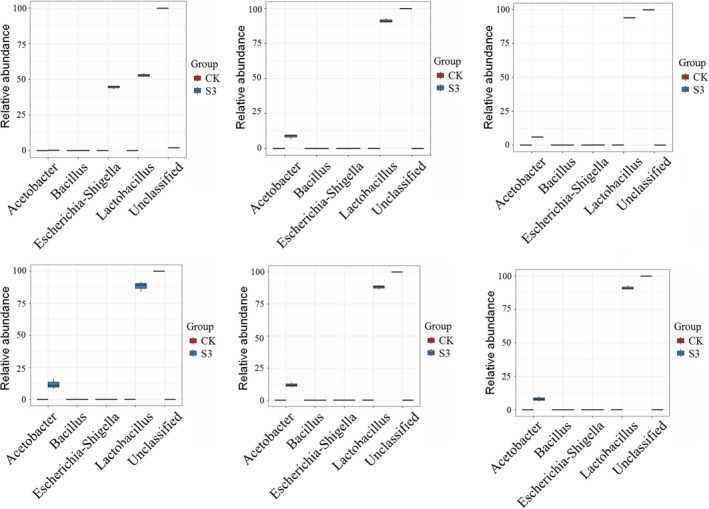
Differentially abundant features. In the figure, the abundance distribution of the five species with the largest difference in the two groups is shown, and the horizontal coordinates are the five species classification names with the largest difference between the two groups, and the vertical coordinates are the relative abundance of the species
3.7. Multi‐sample comparative analysis
Non‐metric multidimensional scaling (NMDS) method is a data analysis method that simplifies the research object in multidimensional space to location, analysis and classification in low‐dimensional space while preserving the original relationship between objects. Results indicated that the difference became larger with decreasing of the similarity. S2, S3, S4, S5, and S6 samples are almost stacked together, indicating that the similarity between them is higher and the difference is smaller. It shows that NMDS can accurately reflect the degree of difference between samples when stress < 0.2 (Figure 5a).
Figure 5.
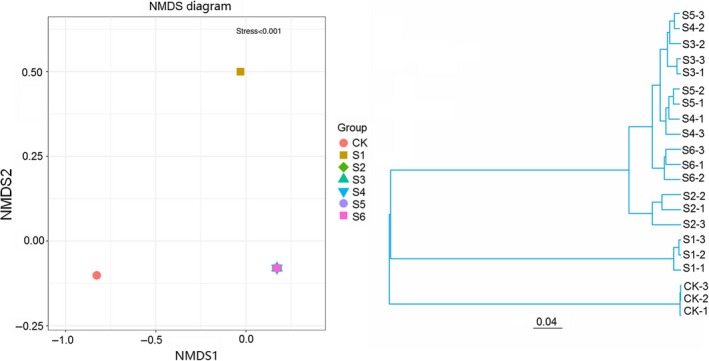
Multi‐sample comparative analysis. NMDS Plot. Each point in the graph represents a sample, the distance between the point and the point indicates the extent of the difference, and the sample of the same group uses the same color representation. When stress is less than 0.2, NMDS can accurately reflect the differences between samples. UPGMA tree. Each branch in the graph represents a sample, with different colored branches representing different groups
Based on the Bray‐Curtis distance matrix, samples were clustered using UPGMA to analyze microbial community differences. We found that all samples were copolymerized into two categories (Figure 5b). The first category is the control CK group, and the second category includes alcohol fermentation process of S1 and S2 and acetic acid fermentation process S3, S4, S5, and S6. Among the second category, S1 is clustered alone, indicating that the microorganisms diversity in the pre‐alcoholic fermentation are relatively high compared with other fermentation stages, and S2 was also clustered together, indicating that microbial diversity in the late stage of alcoholic fermentation was larger than that in the acetic fermentation stage. S2 and S6 are clustered together, indicating that the microorganisms in the group have low similarity and large difference. However, the branches in S4 and S5 groups are slightly interspersed, indicating that there is a high similarity between the microbial communities in acetic acid fermentation medium with a small difference.
4. CONCLUSION
The present results of SPME‐GC‐MS showed that the production of acetic acid, phenethyl acetate, and isoamyl acetate in the apple vinegar fermentation broth gradually increased with the fermentation time of apple vinegar. Analysis of microbial diversity in apple vinegar fermentation process, which performed through 16S rDNA high‐throughput sequencing, showed that the bacterial diversity of apple vinegar during the dynamic fermentation process is rich and has some changes. Lactococcus and Oenococcus were the predominant bacteria in the early stage of apple vinegar fermentation (alcoholic fermentation). The number of Lactococcus tended to be gentle after the rapid increase with the prolongation of fermentation. The main dominant bacteria in the middle and late stages of fermentation (acetic acid fermentation) were Lactococcus Acetobacter. In addition, the number of Lactococcus and Acetobacter decreased slightly after a sharp increase with the prolongation of fermentation. These findings explained the potential reasons of the gradual increase in acetic acid, phenethyl acetate, and isoamyl acetate during the dynamic fermentation of apple vinegar. Besides, we think the main reason might be that a variety of microorganisms synergistically formed the unique taste and flavor of the fermented vinegar products. In conclusion, our present study systematically investigated the microbial diversity during the dynamic fermentation of apple vinegar and provided some theoretical basis for the health and safety evaluation of the vinegar and its products.
CONFLICT OF INTEREST
The authors declare that they have no conflict of interest.
ETHICAL STATEMENT
The study did not involve any human or animal testing.
ACKNOWLEDGMENTS
This work was supported by Grants from the National Modern Agricultural Industry Technical System Construction Project of China (No. CARS ‐27), National Natural Science Foundation Regional Fund Project of China (No. 31460449), the Agricultural Science and Technology Innovation Fund Project of Gansu Agricultural Science Academy of China (No. 2016GAAS49), and the Gansu Agriculture and Animal Husbandry Department (GNKJ‐2018‐10).
Song J, Zhang J‐H, Kang S‐J, et al. Analysis of microbial diversity in apple vinegar fermentation process through 16s rDNA sequencing. Food Sci Nutr. 2019;7:1230–1238. 10.1002/fsn3.944
Contributor Information
Ji‐Hong Zhang, Email: zhangjihlz@sina.com.
San‐Jiang Kang, Email: Kang58503@163.com.
REFERENCES
- Alfonso, B. P. , Maximiliano, A. L. , Pedro, B. F. , Rubido, S. , Mira, A. , & Tomas, I. (2013). Detection of transient bacteraemia following dental extractions by 16S rDNA pyrosequencing: A pilot study. PLoS ONE, 8, 57782. [DOI] [PMC free article] [PubMed] [Google Scholar]
- Budak, N. H. , Kumbul‐Doguc, D. , Savas, C. M. , Seydim, A. C. , Kok‐Tas, T. , Ciris, M. I. , & Guzel‐Seydim, Z. B. (2011). Effects of apple cider vinegars produced with different techniques on blood lipids in high‐cholesterol‐fed rats. Journal of Agricultural and Food Chemistry, 59, 6638–6644. 10.1021/jf104912h [DOI] [PubMed] [Google Scholar]
- Du, N. , Shi, L. , Yuan, Y. , Yuan, Y. , Sun, J. , Shu, S. , & Guo, S. (2017). Isolation of a potential biocontrol agent Paenibacillus polymyxa NSY50 from vinegar wastecompost and its induction of host defense responses against Fusarium wilt of cucumber. Microbiological Research, 202, 1230–10. 10.1016/j.micres.2017.04.013 [DOI] [PubMed] [Google Scholar]
- Gamal, M. H. Z. , Ahmed, E. F. E. , Ahmed, E. A. , & Teleb, A. A. (2016). Rapid diagnosis of virulent Pasteurella multocida isolated from farm animals with clinical manifestation of pneumonia respiratory infection using 16S rDNA and KMT1 gene. Asian Pacific Journal of Tropical Disease, 6, 21–26. [Google Scholar]
- Li, P. , Lin, W. , Liu, X. , Liu, X. , Li, S. , Luo, L. , & Lin, W. T. (2016). Paenibacillus aceti sp. nov., isolated from the traditional solid‐state acetic acid fermentation culture of Chinese cereal vinegar. International Journal of Systematic and Evolutionary Microbiology, 66, 3426–3431. [DOI] [PubMed] [Google Scholar]
- Li, X. Z. , Xu, Y. , & Kou, Q. (2014). Molecular phylogeny of Parapenaeopsis Alcock, 1901(Decapoda: Penaeidae) based on chinese materials and 16S rDNA and COI sequence. Journal of Ocean University of China, 13, 104–114. 10.1007/s11802-014-2272-7 [DOI] [Google Scholar]
- Lv, Y. H. , Zhu, J. W. , Zhang, Y. Q. , Cai, X. Q. , Guo, K. , & Zhou, S. X. (2016). Genetic diversity analysis on Rep‐PCR genomic fingerprinting and 16S rDNA sequences of desulfurization bacteria. Journal of Donghua University, 33, 134–137. [Google Scholar]
- Mohamad, N. E. , Yeap, S. K. , & Ky, H. (2017). Dietary coconut water vinegar for improvement of obesity‐associated inflammation in high‐fat‐diet‐treated mice. Food and Nutrition Research, 61, 1368322 10.1080/16546628.2017.1368322 [DOI] [PMC free article] [PubMed] [Google Scholar]
- Mota, A. C. , de Castro, R. D. , de Araújo Oliveira, J. , & de Oliveira Lima, E. (2015). Antifungal activity of apple cider vinegar on candida species involved in denture stomatitis. Journal of Prosthodontics‐Implant Esthetic and Reconstructive Dentistry, 24, 296–302. [DOI] [PubMed] [Google Scholar]
- Pandey, N. , & Rajagopal, R. (2016). Molecular characterization and diversity analysis of bacterial communities associated with Dialeurolonga malleswaramensis (Hemiptera: Aleyrodidae) aduls using 16S rDNA amplicon pyrosequencing and FISH. Journal of Insect Science, 23, 704–711. 10.1111/1744-7917.12220 [DOI] [PubMed] [Google Scholar]
- Priit, K. , & Jelena, Š. (2012). Applicability of PCR‐DGGE and 16S rDNA sequencing for microbiological analysis of otitis media with effusion. International Journal of Otolaryngology Head Neck Surgery, 1, 71–76. [Google Scholar]
- Qin, Y. B. , He, P. P. , Lu, B. X. , He, Y. , Li, B. , Liang, J. X. , … Qianlian, S. . (2016). Isolation of swine corynebacteria and analysis of 16S rDNA gene. Animal Husbandry and Feed Science, 8, 339–343. [Google Scholar]
- Rana, A. H. , Nidhal, N. H. , & Abed, A. J. A. (2014). Diversity of 16S rDNA of indigenous iraqi sinorhizobium meliloti isolates differing in their ability to drought tolerance march. Journal of Life Science, 8, 223–229. [Google Scholar]
- Razia, M. , Karthikraja, R. , Padmanaban, K. , Chellapandi, P. , & Sivaramakrishnan, S. (2011). 16S rDNA‐based phylogeny of non‐Symbiotic bacteria of entomopathogenic nematodes from infected insect cadavers. Genomics Proteomics and Bioinformatics, 9, 104–112. 10.1016/S1672-0229(11)60013-2 [DOI] [PMC free article] [PubMed] [Google Scholar]
- Štornik, A. , Skok, B. , & Trček, J. (2016). Comparison of cultivable acetic acid bacterial microbiota in organic and conventional apple cider vinegar. Food Technology and Biotechnology, 54, 113–119. [DOI] [PMC free article] [PubMed] [Google Scholar]
- Trček, J. , Lipoglavšek, L. , & Avguštin, G. (2016). 16S rRNA in situ hybridization followed by flow cytometry for rapid identification of acetic Acid bacteria involved in submerged industrial vinegar production. Food Technology and Biotechnology, 54, 108–112. [DOI] [PMC free article] [PubMed] [Google Scholar]
- Trček, J. , Mahnič, A. , & Rupnik, M. (2016). Diversity of the microbiota involved in wine and organic apple cider submerged vinegar production as revealed by DHPLC analysis and next‐generation sequencing. International Journal of Food Microbiology, 16, 57–62. [DOI] [PubMed] [Google Scholar]
- Wang, Y. , Wang, J. , Liu, Y. Q. , Liu, Z. , & Fan, J. F. (2012). Determination of aroma components in distilled fermented apple pomace wine by head space solid phase microextraction (HS‐SPME) and GC‐MS. Food Science, 33, 205–209. [Google Scholar]
- Wang, C. Y. , Zhang, J. , & Gui, Z. Z. (2015). Acetobacter bacteria are found in Zhenjiang vinegar grains. Genetics and Molecular Research, 14, 5054–5064. 10.4238/2015.May.12.8 [DOI] [PubMed] [Google Scholar]
- Xie, J. P. , Jiang, H. C. , Liu, X. X. , Liu, X. D. , Zhou, J. Z. , & Qiu, G. Z. (2011). 16s rDNA based microbial diversity analysis of eleven acid mine drainages obtained from three Chinese copper mines. Journal of Central South University of Technology, 18, 1930–1939. 10.1007/s11771-011-0925-x [DOI] [Google Scholar]
- Yeh, W. B. , Yang, C. T. , & Hui, C. F. (2005). A molecular phylogeny of planthoppers (Hemiptera: Fulgoroidea) inferred from mitochondrial 16S rDNA sequences. Zoological Studies, 44, 519–535. [Google Scholar]