

Abstract
There have been little and conflicting data regarding the relationship between coronary artery calcification score (CACS) and myocardial ischemia on positron emission tomography myocardial perfusion imaging (PET MPI). The aims of this study were to investigate the relationship between myocardial ischemia on PET MPI and CACS, the frequency and severity of CACS in patients with normal PET MPI, and to determine the optimal CACS cutoff point for abnormal PET. This retrospective study included 363 patients who underwent same-setting stress PET perfusion imaging and CACS scan because of clinically suspected coronary artery disease (CAD). Fifty-five (55%) of the 363 patients had abnormal PET perfusion. There was an association between sex, diabetes mellitus (DM), smoking, and CACS and PET perfusion abnormities with P = 0.003, 0.05, 0.005, and 0.001, respectively. However, there was no association between PET perfusion abnormalities with age, body mass index, hypertension, and hypercholesterolemia. There was association between CACS and age, sex, and DM with P = 0.000, 0.014, and 0.052, respectively, and stepwise increase in the frequency of myocardial ischemia and CACS groups. Receiver-operating characteristic analysis showed that a CACS ≥304 is the optimal cutoff for predicting perfusion abnormalities with sensitivity of 64% and specificity of 69%. In conclusion, the frequency of CAC in patients with normal PET MPI is 49%, it is highly recommended to combine CACS with PET MPI in patients without a history of CAD. PET MPI identifies myocardial ischemia and defines the need for coronary revascularization, but CAC reflects the anatomic burden of coronary atherosclerosis. Combining CACS to PET MPI allows better risk stratification and identifies high-risk patients with PET, and it may change future follow-up recommendations. CACS scan is readily available and easily acquired with modern PET-computed tomography (CT) and single-photon emission CT (SPECT)-CT with modest radiation exposure.
Keywords: Coronary artery calcification score-coronary artery disease, myocardial ischemia, positron emission tomography myocardial perfusion, stress functional imaging
INTRODUCTION
Coronary artery calcification (CAC) is a strong predictor of cardiovascular disease and has an important role in cardiovascular risk stratification.[1] CAC score (CACS) may offer added diagnostic information over myocardial perfusion imaging (MPI) for identifying patients with suspected coronary artery disease (CAD). In the promise study, most stable patients with suspected CAC and experienced major cardiovascular events (MAC) have measurable CAC at baseline while less than half have any abnormalities on functional imaging.[2] CACS is a powerful prognostic value in predicting MACE in patients with suspected CAC and mild-to-moderate perfusion abnormities on MPI.[3] Furthermore, the absence of CAC is associated with low risk for major adverse cardiac events (MACEs).[4] Abnormal MPI is associated with high likelihood of higher CACS. However, normal MPS patients may have severely abnormal CACS; this observation indicates a potential role for CAC scoring in patients with normal MPS.[5] MPS with single-photon emission computed tomography (SPECT) is a well-established noninvasive technique for diagnosis, risk stratification, and management of CAD.[6] However, the diagnostic accuracy of PET is superior to SPECT.[7] The combined modality for PET/computed tomography (CT) increases the diagnostic accuracy of PET in CAD diagnosis.[8] Combined assessment of CACS and myocardial perfusion with single dual-modality study allows unique opportunity to assess myocardial ischemia and subclinical atherosclerosis. Combined assessment of functional ischemia with PET and coronary atherosclerosis severity with CACS may improve risk stratification and goal and intensity of medical therapy.[9] Several studies have demonstrated a stepwise increase of MACE with increasing CACS, with annualized MACE between 0.7%–2.4% and 3%–11% in patients with 0 to more than 400%, respectively.[10] Furthermore, it has been shown that CACS may increase the diagnostic performance of MPI for identifying patients with CAD and negative MPI.[11] The aims of this study were to investigate the relationship between PET myocardial perfusion and CACS, the prevalence, and severity of CACS in patients with normal MPI, and to determine the optimal CACS cutoff for abnormal PET results.
METHODS
Subjects
Between January 2014 and November 2017, 363 consecutive symptomatic patients who underwent same-setting PET MPI and CACS scan on PET/CT scan because of clinically suspected CAD as per referring physicians. Baseline patient characteristics are given in Table 1. Exclusion criteria include patient with known history of CAD as documented by previous abnormal coronary angiogram, post-coronary artery bypass surgery (CABG), postpercutaneous intervention, or previous abnormal MPI either SPECT or PET. The study was approved by the Intuitional Review Board.
Table 1.
Patient’s characteristics as predictors of positron emission tomography results
| PET | Total (n=363), n (%) | P | ||
|---|---|---|---|---|
| Negative (n=163; 45%) | Positive (n=200; 55%) | |||
| Sex | ||||
| Female | 91 | 70 | 161 (44.4) | 0.003 |
| Male | 106 | 96 | 202 (55.6) | |
| Age/years | 63±11 | 64±12 | 0.311 | |
| BMI | ||||
| <30 | 70 | 61 | 131 (36) | 0.810 |
| >30 | 127 | 105 | 232 (64) | |
| Hypertension | ||||
| Negative | 17 | 16 | 33 (9) | 0.303 |
| Positive | 180 | 150 | 333 (91) | |
| DM | ||||
| Negative | 66 | 40 | 106 (29) | 0.050 |
| Positive | 131 | 126 | 257 (71) | |
| Hypercholesterolemia | ||||
| Negative | 66 | 38 | 80 (22) | 0.719 |
| Positive | 131 | 128 | 283 (78) | |
| Smoking | ||||
| Negative | 136 | 136 | 272 (75) | 0.005 |
| Positive | 61 | 30 | 91 (25) | |
| CAC | ||||
| CAC=0 | 100 | 37 | 137 (38) | 0.001 |
| CAC >0 | 197 | 129 | 226 (62) | |
| ROC cut-off point of CAC of 304 | ||||
| CAC >304 | 163 | 92 | 255 (70) | 0.0001 |
| CAC >304 | 34 | 74 | 108 (30) | |
CAC: Coronary artery calcification; BMI: Body mass index; DM: Diabetes mellitus; PET: Positron emission tomography; ROC: Receiver-operating characteristic
Positron emission tomography/computed tomography image acquisition and analysis
Both rest and stress 13N-ammonia images were acquired in a same day protocol with adenosine stress test[12] with intravenous injection of 700–900 MBQ of 13N-ammonia followed by transmission scan for attenuation correction on a discovery (CVT or 710) scanner (GE Healthcare) as previously reported in details[13,14] PET studies interpretation was perfumed by two experienced nuclear medicine physicians, and diverging interpretations were resolved by consensus. The 17-segment model and semi-quantification scoring system (0 = normal, 1 = mildly abnormal, 2 = moderately abnormal, and 4 = completed defect) as recommended by the American Society of Nuclear Cardiology,[15] images were considered normal of summed stress score (SSS) <4, mildly abnormal of SSS 4–8, and moderately to severely abnormal if SSS 4–8 as previously described.[16]
Coronary calcium scoring
Prospective electrocardiographic gating was utilized on 64-slice PET/CT scanner. The CT was acquired with 120 KVP, 100 mAs, 0.6 mm collimation with approximately 10 s acquisition time, and 1–2 mSv radiation dose. All CT images were reconstructed with 3 mm thickness. CAC was scored using the Agatston methods.[17] The CACs were classifieds into four groups; group with total CACS of 0, Group 1 with total CACS 1–100, Group 3 with total CACS 101–400, and Group 4 with CACS more than 400.
Statistical analysis
Statistical analyses were performed using Statistical Package for the social sciensec (SPSS) SPSS version 20 (Armonk, New york, USA). Continuous variables were reported as means ± standard deviation, and categorical variables were reported as percentages. Group means were compared using t-test, and association between categorical variables was assessed by Chi-square test. Multiple linear regression was used to evaluate the effect of important covariates on CACSs. Cochran Armitage test for trend (with one degree of freedom) was used to test for trend. The P value was less than 0.0001. This shows that there was a significant trend (increasing probability of positive PET) with increasing CACS.
The receiver operating characteristic (ROC) was used to find the optimal cutoff point that classifies the subjects into normal and abnormal PET results. The Type I error rate was set at 5%.
RESULTS
Positron emission tomography myocardial perfusion results
Fifty-five (55%) of the 363 patients had abnormal PET perfusion (ischemia, infraction, and mixed defects), there were nondiagnostic studies. The relationship between PET results and CAD risk factors is given in Table 1. There was an association between sex, diabetes mellitus (DM), smoking, and CACS and myocardial ischemia with P = 0.003, 0.05, 0.005, and 0.001, respectively. However, there was no association between myocardial ischemia and age, body mass index, hypertension, and hypercholesterolemia.
Relationship between positron emission tomography myocardial perfusion imaging and coronary artery calcification score
Overall, 137 (38%) patients zero CACS and CACS score was one or greater in 226 (62%) patients of 363 of the study population. Table 2 shows the multiple regression model to CACS. There was association between CACS and age, sex, and DM with P = 0.000, 0.014, and 0.052, respectively. There was a strong association between PET myocardial perfusion abnormities and CACS (P = 0.0001).
Table 2.
Fitting multiple regression model to the coronary artery calcification score: The dependent variables are the coronary artery calcification score
| Parameters | Regression coefficient | SE | P |
|---|---|---|---|
| Age | 17.638 | 2.680 | 0.000 |
| Sex | −150.979 | 60.901 | 0.014 |
| Hypertension | 101.103 | 96.444 | 0.295 |
| DM | 130.909 | 67.231 | 0.052 |
| Hypercholesterolemia | −125.686 | 74.173 | 0.091 |
| Smoking | 24.188 | 68.865 | 0.726 |
| BMI grouping | 55.786 | 63.900 | 0.383 |
BMI: Body mass index; DM: Diabetes mellitus; SE: Standard error
Distribution of coronary artery calcification scores in patients with normal and abnormal positron emission tomography perfusion
Distribution of CACSs in patients with normal PET perfusion (197 patients) as follows: 100 patients had zero CACS, 41 patients had 1–100 CACS, 33 patients had 101–400 score, and 23 patients had CACS more than 400. Distribution of CACSs in patients with abnormal PET perfusion (166 patients) as follows: 17 patients had zero CACS, 34 had 1–100 CACS, 38 patients had CACS between 101 and 400, and 77 patients had CACS more than 400. There was a strong association between PET myocardial perfusion abnormities and CACS (P = 0.0001); furthermore, there was a strong association between PET MPI and CACS groups as shown in Figure 1.
Figure 1.
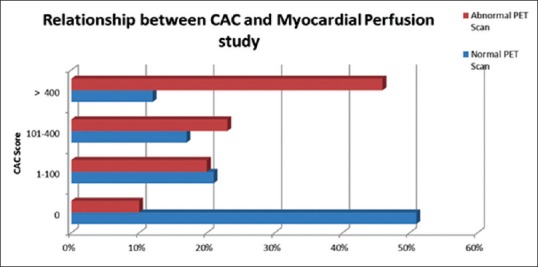
The relationship between coronary artery calcification score and positron emission tomography myocardial perfusion results
Figure 2 shows the ROC curve for detection of myocardial ischemia on PET MPI based on CACS. The optimal cutoff value of CACS to predict myocardial ischemia was 304 or greater with sensitivity of 64% and specificity of 69%.
Figure 2.
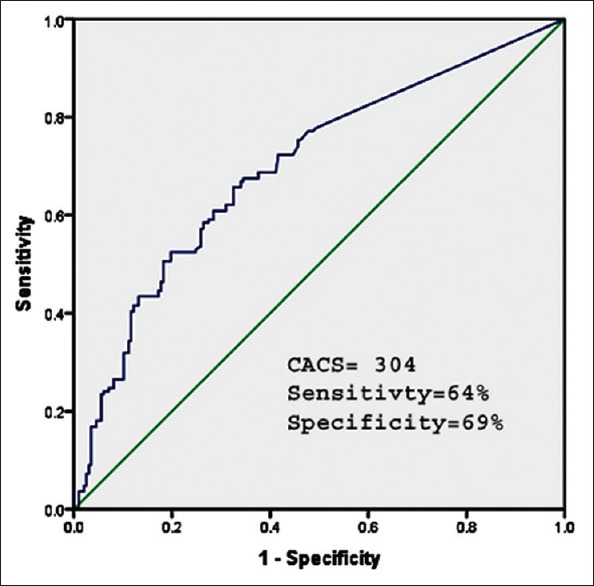
Receiver operating characteristic-curve for the detection for positron emission tomography perfusion abnormalities by coronary artery calcification score. The optimal cutoff for detecting positron emission tomography perfusion abnormalities was 304, with sensitivity 64% and specificity 69%
DISCUSSION
Our data showed several important observations; one of the most important observations is the high frequency of CAC in patients with normal PET MPI. Ninety-seven (49%) patients out of 197 patients with normal PET MPI had CAC. Severe CAC (CACS more than 400) was identified in 23 patients with normal PET MPI. In addition, patients with CACS of more than zero; there was stepwise increase of myocardial ischemia on PET perfusion with increasing CACS, especially, in patients with severe CAC (CACS more than 400) had 46% myocardial perfusion defects in PET MPI. This finding is consistent with several previous reported studies. In a retrospective study, Fathala et al. observed that 55% of patients with CACS of more than 400 had perfusion defect on SPECT MPI.[18] Furthermore, Anand et al. reported that patients with CACS of more than 400 had 45% myocardial ischemia on SPECT MPI.[19] Our patients are symptomatic with multiple risk factors for CAD; this probably explains the high prevalence of myocardial perfusion ischemia on PET MPI compared to previously published data. It is obvious from previous multiple studies; a significant number of patients with either normal SPECT MPI or PET MPI have subclinical atherosclerosis and nonobstructive CAD as evident by CAC detected by CACS scan. Nonobstructive CAD is considered as a preclinical stage with strong predictive value for the development of obstructive CAD.[20] Information about CACS cannot be obtained from PET imaging alone indicating added incremental value of combining CACS to PET functional imaging. CACS measures the anatomic burden of coronary atherosclerosis but does not help localizing or detecting the severity of myocardial ischemia. However, PET MPI identifies myocardial ischemia and defines the need for coronary revascularization. Most importantly, adding CACS to PET changes the diagnosis from no ischemia to ischemia despite the presence of CAC, this diagnosis has very serious implications in patients’ management as it changes the long-term prognosis, prevent miscommunication about meaning normal functional imaging, changes management, and future follow-up recommendations.[21] In addition to important prognostic information by adding CACS to PET functional imaging, CACS offers incremental diagnostic information. Schepis et al. observed that combining SPECT with CACS improved the sensitivity of SPECT from 76% to 86% for the detection of CAD without a significant decrease in specificity (from 91% to 88%).[11] The relationship between CACS and coronary artery stenosis has been investigated, it has been found by Henein et al. That CAC is more accurate in detecting high-grade stenosis than myocardial perfusion defect in patients with exertional dyspnea; furthermore, there was strong association between CACS and extent of myocardial perfusion defected.[22] In our study, the optimal cutoff point for CACS was 304 for detecting myocardial ischemia on PET MPI with sensitivity of 64% and specificity of 69% per ROC curve analysis. In addition to presence and severity of CAC, other factors such as sex, diabetes mellitus, and tobacco smoking are strong predictors for myocardial ischemia on PET functional imaging.
Frequency of myocardial ischemia in patients with zero coronary artery calcification score
In our study, the frequency of myocardial ischemia in patients with zero CACS is 10%. Patients with zero CACS are unlikely to have significant coronary stenosis by noncalcified plaques and/or microvascular dysfunction. Compared to previous studies, this frequency is considerably high. Alanazi et al. observed that the frequency of myocardial ischemia in low to intermediate-risk patients with <1%.[23] However, our current patients are symptomatic and having more CAD risk factors. In addition, SPECT was the techniques utilized to detect myocardial perfusion abnormalities, but in the current study, PET was used to asses myocardial perfusion, PET scan has more accurate compared to SPECT. On the other hand, the presence of normal myocardial perfusion in patients with high CAC has several explanations that may include extensive CAC can be present without hemodynamically significant CAD, false normal PET, or SPECT is well-known possibility in patients with extensive CAD and balanced ischemia, and Finally, the perfusion abnormalities could be related to attenuation artifacts.
Study limitations
Our study has some important limitations as it was a retrospective study. Study population was selected and has a higher likelihood of CAD and higher CACS; subsequently, selection bias may affect our study results. In addition, sample size is relatively small and larger number of study population needs to confirm the results. Finally, there was no follow-up with coronary angiography to test the diagnostic accuracy of PET MPI, but generally, PET MPI has high sensitivity, high positive and negative predictive values, and diagnostic accuracy compared to invasive coronary angiography.[24]
CONCLUSIONS
The frequency of CAC in patients with normal PET MPI is 49%; it is highly recommended to combine CACS with PET perfusion in patients without a history of CAD. PET MPI identifies myocardial ischemia and defines the need for coronary revascularization, but CAC reflects the anatomic burden of coronary atherosclerosis. Combining CACS to PET MPI may change the diagnosis from normal myocardial perfusion to normal perfusion despite the presence of coronary atherosclerosis, this diagnosis has very serious implications in patients management as provides clinicians with additional information to identify high-risk patients with normal functional imaging, it changes the long-term prognosis, prevents miscommunication about the meaning of normal functional imaging, and future follow-up recommendations. CAC is readily available and easily acquired with modern PET-CT and SPECT-CT with modest radiation exposure.
Financial support and sponsorship
Nil.
Conflicts of interest
There are no conflicts of interest.
REFERENCES
- 1.Carr JJ, Nelson JC, Wong ND, McNitt-Gray M, Arad Y, Jacobs DR, Jr, et al. Calcified coronary artery plaque measurement with cardiac CT in population-based studies: Standardized protocol of Multi-Ethnic Study of Atherosclerosis (MESA) and Coronary Artery Risk Development in Young Adults (CARDIA) study. Radiology. 2005;234:35–43. doi: 10.1148/radiol.2341040439. [DOI] [PubMed] [Google Scholar]
- 2.Budoff MJ, Mayrhofer T, Ferencik M, Bittner D, Lee KL, Lu MT, et al. Prognostic value of coronary artery calcium in the PROMISE study (Prospective multicenter imaging study for evaluation of chest pain) Circulation. 2017;136:1993–2005. doi: 10.1161/CIRCULATIONAHA.117.030578. [DOI] [PMC free article] [PubMed] [Google Scholar]
- 3.Barros MV, Nunes Mdo C, Braga G, Rabelo DR, Magalhães K, Scaramello F, et al. Role of coronary artery calcium score for risk stratification in patients with non significant perfusion defects by myocardial perfusion single photon emission computed tomography. Cardiol J. 2015;22:330–5. doi: 10.5603/CJ.a2014.0084. [DOI] [PubMed] [Google Scholar]
- 4.Nakanishi R, Li D, Blaha MJ, Whelton SP, Matsumoto S, Alani A, et al. The relationship between coronary artery calcium score and the long-term mortality among patients with minimal or absent coronary artery risk factors. Int J Cardiol. 2015;185:275–81. doi: 10.1016/j.ijcard.2015.03.146. [DOI] [PubMed] [Google Scholar]
- 5.Berman DS, Wong ND, Gransar H, Miranda-Peats R, Dahlbeck J, Hayes SW, et al. Relationship between stress-induced myocardial ischemia and atherosclerosis measured by coronary calcium tomography. J Am Coll Cardiol. 2004;44:923–30. doi: 10.1016/j.jacc.2004.06.042. [DOI] [PubMed] [Google Scholar]
- 6.Hachamovitch R, Hayes SW, Friedman JD, Cohen I, Berman DS. Comparison of the short-term survival benefit associated with revascularization compared with medical therapy in patients with no prior coronary artery disease undergoing stress myocardial perfusion single photon emission computed tomography. Circulation. 2003;107:2900–7. doi: 10.1161/01.CIR.0000072790.23090.41. [DOI] [PubMed] [Google Scholar]
- 7.Donati OF, Stolzmann P, Desbiolles L, Leschka S, Kozerke S, Plass A, et al. Coronary artery disease: Which degree of coronary artery stenosis is indicative of ischemia? Eur J Radiol. 2011;80:120–6. doi: 10.1016/j.ejrad.2010.07.010. [DOI] [PubMed] [Google Scholar]
- 8.Slomka PJ, Le Meunier L, Hayes SW, Acampa W, Oba M, Haemer GG, et al. Comparison of myocardial perfusion 82Rb PET performed with CT- and transmission CT-based attenuation correction. J Nucl Med. 2008;49:1992–8. doi: 10.2967/jnumed.108.056580. [DOI] [PubMed] [Google Scholar]
- 9.Di Carli MF, Murthy VL. Cardiac PET/CT for the evaluation of known or suspected coronary artery disease. Radiographics. 2011;31:1239–54. doi: 10.1148/rg.315115056. [DOI] [PMC free article] [PubMed] [Google Scholar]
- 10.Schenker MP, Dorbala S, Hong EC, Rybicki FJ, Hachamovitch R, Kwong RY, et al. Interrelation of coronary calcification, myocardial ischemia, and outcomes in patients with intermediate likelihood of coronary artery disease: A combined positron emission tomography/computed tomography study. Circulation. 2008;117:1693–700. doi: 10.1161/CIRCULATIONAHA.107.717512. [DOI] [PMC free article] [PubMed] [Google Scholar]
- 11.Schepis T, Gaemperli O, Koepfli P, Namdar M, Valenta I, Scheffel H, et al. Added value of coronary artery calcium score as an adjunct to gated SPECT for the evaluation of coronary artery disease in an intermediate-risk population. J Nucl Med. 2007;48:1424–30. doi: 10.2967/jnumed.107.040758. [DOI] [PubMed] [Google Scholar]
- 12.Perrone-Filardi P, Achenbach S, Möhlenkamp S, Reiner Z, Sambuceti G, Schuijf JD, et al. Cardiac computed tomography and myocardial perfusion scintigraphy for risk stratification in asymptomatic individuals without known cardiovascular disease: A position statement of the Working Group on Nuclear Cardiology and Cardiac CT of the European Society of Cardiology. Eur Heart J. 2011;32:1986–93. doi: 10.1093/eurheartj/ehq235. 1993a, 1993b. [DOI] [PubMed] [Google Scholar]
- 13.Herzog BA, Husmann L, Valenta I, Gaemperli O, Siegrist PT, Tay FM, et al. Long-term prognostic value of 13N-ammonia myocardial perfusion positron emission tomography added value of coronary flow reserve. J Am Coll Cardiol. 2009;54:150–6. doi: 10.1016/j.jacc.2009.02.069. [DOI] [PubMed] [Google Scholar]
- 14.Koepfli P, Hany TF, Wyss CA, Namdar M, Burger C, Konstantinidis AV, et al. CT attenuation correction for myocardial perfusion quantification using a PET/CT hybrid scanner. J Nucl Med. 2004;45:537–42. [PubMed] [Google Scholar]
- 15.Machac J, Bacharach SL, Bateman TM, Bax JJ, Beanlands R, Bengel F, et al. Positron emission tomography myocardial perfusion and glucose metabolism imaging. J Nucl Cardiol. 2006;13:e121–51. doi: 10.1016/j.nuclcard.2006.08.009. [DOI] [PubMed] [Google Scholar]
- 16.Chow BJ, Beanlands RS, Lee A, DaSilva JN, deKemp RA, Alkahtani A, et al. Treadmill exercise produces larger perfusion defects than dipyridamole stress N-13 ammonia positron emission tomography. J Am Coll Cardiol. 2006;47:411–6. doi: 10.1016/j.jacc.2005.09.027. [DOI] [PubMed] [Google Scholar]
- 17.Agatston AS, Janowitz WR, Hildner FJ, Zusmer NR, Viamonte M, Jr, Detrano R, et al. Quantification of coronary artery calcium using ultrafast computed tomography. J Am Coll Cardiol. 1990;15:827–32. doi: 10.1016/0735-1097(90)90282-t. [DOI] [PubMed] [Google Scholar]
- 18.Fathala AL, Bukhari SQ, Shoukri M, El Sergani H, Al-Ghamdi B, Al-Sugair A, et al. High prevalence of coronary artery calcification in Saudi patients with normal myocardial perfusion. Ann Saudi Med. 2017;37:154–60. doi: 10.5144/0256-4947.2017.154. [DOI] [PMC free article] [PubMed] [Google Scholar]
- 19.Anand DV, Lim E, Raval U, Lipkin D, Lahiri A. Prevalence of silent myocardial ischemia in asymptomatic individuals with subclinical atherosclerosis detected by electron beam tomography. J Nucl Cardiol. 2004;11:450–7. doi: 10.1016/j.nuclcard.2004.06.125. [DOI] [PubMed] [Google Scholar]
- 20.Budoff MJ, Achenbach S, Blumenthal RS, Carr JJ, Goldin JG, Greenland P, et al. Assessment of coronary artery disease by cardiac computed tomography: A scientific statement from the American Heart Association Committee on Cardiovascular Imaging and Intervention, Council on Cardiovascular Radiology and Intervention, and Committee on Cardiac Imaging, Council on Clinical Cardiology. Circulation. 2006;114:1761–91. doi: 10.1161/CIRCULATIONAHA.106.178458. [DOI] [PubMed] [Google Scholar]
- 21.Engbers EM, Timmer JR, Ottervanger JP, Mouden M, Knollema S, Jager PL, et al. Impact of gender on the prognostic value of coronary artery calcium in symptomatic patients with normal single-photon emission computed tomography myocardial perfusion. Am J Cardiol. 2016;118:1611–5. doi: 10.1016/j.amjcard.2016.08.037. [DOI] [PubMed] [Google Scholar]
- 22.Henein MY, Bengrid T, Nicoll R, Zhao Y, Johansson B, Schmermund A, et al. Coronary calcification compromises myocardial perfusion irrespective of luminal stenosis. Int J Cardiol Heart Vasc. 2017;14:41–5. doi: 10.1016/j.ijcha.2016.12.001. [DOI] [PMC free article] [PubMed] [Google Scholar]
- 23.Alanazi M, AlDuraibi A, Shoukri MM, Fathala A. The relationship between absence coronary artery calcification and myocardial perfusion single photon emission computed tomography. Cardiol Res. 2018;9:28–34. doi: 10.14740/cr659w. [DOI] [PMC free article] [PubMed] [Google Scholar]
- 24.Parker MW, Iskandar A, Limone B, Perugini A, Kim H, Jones C, et al. Diagnostic accuracy of cardiac positron emission tomography versus single photon emission computed tomography for coronary artery disease: A bivariate meta-analysis. Circ Cardiovasc Imaging. 2012;5:700–7. doi: 10.1161/CIRCIMAGING.112.978270. [DOI] [PubMed] [Google Scholar]