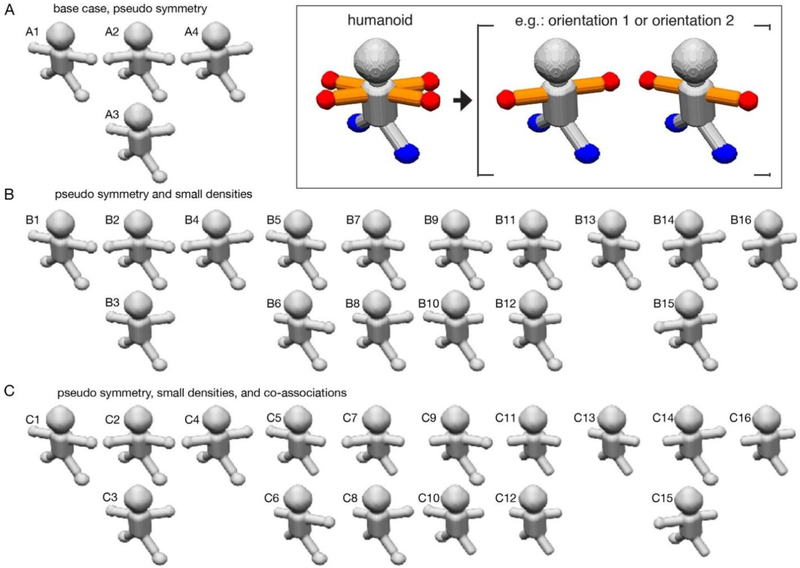
Figure 1-. humanoid datasets and distinct scenarios used to assess focused classification.
Different maps used to generate synthetic datasets described by the three scenarios are displayed. In each panel, A-C, two maps which are degenerate and related to one another by a 180° rotation are positioned vertically with respect to one another. The components used to generate the datasets are displayed in the inset, with the heterogeneous elements colored (arms, orange; hands, red; feet, blue). (A) For the base scenario, only the arms/hands are conformationally mobile. Four different combinations of maps lead to a dataset characterized by two different asymmetric units. Maps A2/A3 are related by a 180° rotation. (B) For the second scenario, in addition to the conformational mobility of the arms, the hands can be either present or absent. 16 different combinations of maps lead to a dataset characterized by four different asymmetric units. Maps B2/B3, B5/B6, B7/B8, B9/B10, B11/B12, and B14/B15 are related by a 180° rotation. (C) For the third scenario, in addition to the conformational mobility of the arms, the hands can be either present or absent, but their occupancy is always co-associated with a nearby foot. 16 different combinations of maps lead to a dataset characterized by four different asymmetric units. Maps C2/C3, C5/C6, C7/C8, C9/C10, C11/C12, and C14/C15 are related by a 180° rotation.

