

Abstract
Purpose:
Disorders of speech production may be accompanied by abnormal processing of speech sensory feedback. Here, we introduce a semi-automated analysis designed to assess the degree to which speakers use natural online feedback to decrease acoustic variability in spoken words. Because production deficits in aphasia have been hypothesised to stem from problems with sensorimotor integration, we investigated whether persons with aphasia (PWA) can correct their speech acoustics online.
Method:
Eight PWA in the chronic stage produced 200 repetitions each of three monosyllabic words. Formant variability was measured for each vowel in multiple time windows within the syllable, and the reduction in formant variability from vowel onset to midpoint was quantified.
Result:
PWA significantly decreased acoustic variability over the course of the syllable, providing evidence of online feedback correction mechanisms. The magnitude of this corrective formant movement exceeded past measurements in control participants.
Conclusion:
Vowel centering behavior suggests that error correction abilities are at least partially spared in speakers with aphasia, and may be relied upon to compensate for feedforward deficits by bringing utterances back on track. These proof of concept data show the potential of this analysis technique to elucidate the mechanisms underlying disorders of speech production.
Keywords: aphasia, speech production, speech error correction, auditory feedback
Introduction
Speech production impairments are common across communication disorders, but differ in their clinical manifestations; even when errors appear similar on the surface, they may be due to different underlying pathologies. For example, deficits that manifest as a pattern of phoneme substitutions may be due to impairments that concentrate at either the phonological or the phonetic level (Baum, Blumstein, Naeser, & Palumbo, 1990). Likewise, impaired neural mechanisms behind these deficits may be at the level of feedforward control, in which learned speech movements are driven by top-down motor commands, or at the level of feedback control, in which sensory feedback such as the sound of one’s own voice leads speakers to monitor and update their motor commands online while speaking (Perkell, 2012; Tourville & Guenther, 2011). Past studies have used theoretically-driven accounts to attempt to mechanistically separate these etiologies in individuals with aphasia, apraxia of speech, childhood apraxia of speech, and speech sound disorders, among others (Ballard, Tourville, & Robin, 2014; Buchwald & Miozzo, 2012; Iuzzini-Seigel, Hogan, Guarino, & Green, 2015; Jacks & Haley, 2015; Kurowski & Blumstein, 2016; Maas, Mailend, & Guenther, 2015; Terband, van Brenk, & van Doornik-van der Zee, 2014). These characterisations, based on acoustic properties of produced speech, are useful because they reveal differences in underlying etiology that may inform clinicians when to approach treatment differently. Our aim in the present study is to use an acoustic analysis of within-syllable speech dynamics to test predictions about the type of pathology underlying speech errors in aphasia. This analysis is intended to measure online changes to vowel acoustics that cannot be perceptually evaluated by speech-language pathologists. Specifically, we propose to use acoustic variability at syllable onset as a measure of feedforward impairment, and the within-syllable reduction of that variability, known as vowel centering, as a measure of successful feedback correction.
Here, we obtain these measures from persons with aphasia (PWA) in an effort to characterise the functional deficits underlying their speech sound errors. As a consequence of brain damage, many PWA have difficulties with phonological planning and articulatory implementation, causing them to struggle with errors in their spontaneous speech, e.g. making substitution errors like [pɪɫdɪŋ] for building, or vowel distortions like [sɚɫboʊt] for sailboat. Although segmental distortions are thought to originate from impairments to motor (rather than language) networks, traditionally reflecting comorbid disorders such as dysarthria and apraxia of speech, they can appear in the absence of these accompanying diagnoses (Haley, Jacks, & Cunningham, 2013). Furthermore, phonemic paraphasias, traditionally thought to reflect phonological selection impairments, may occur because of competition among phonetic articulatory plans (Kurowski & Blumstein, 2016), and do not cleanly dissociate based on lesion location or clinical diagnosis (Blumstein, Cooper, Goodglass, Statlender, & Gottlieb, 1980), implicating subtle motoric impairments even in “fluent” aphasia (Baum et al., 1990). Indeed, across a wide array of aphasic subtypes, the higher-level linguistic deficits that characterise aphasia, including difficulties in comprehension and verbal expression, are often accompanied by lower-level deficits in auditory perception (Robson, Grube, Lambon Ralph, Griffiths, & Sage, 2013) and in the stable production of consonants (Blumstein et al., 1980) and vowels (Haley, Ohde, & Wertz, 2001; Keller, 1975, 1978; Ryalls, 1986).
Furthermore, production deficits in aphasia are associated with abnormalities in feedback processing. For example, Boller and colleagues (Boller, Vrtunski, Kim, & Mack, 1978; Chapin, Blumstein, Meissner, & Boller, 1981) studied the speech of 20 PWA under conditions of delayed auditory feedback (DAF) in which speakers heard their own speech played back at a delay of 150–350 ms, an environment that reduces fluency and increases errors in typical speakers (Stuart, Kalinowski, Rastatter, & Lynch, 2002; Yates, 1963). They found a DAF effect in all subjects, but this effect was exaggerated in Broca’s aphasia and reduced in fluent aphasia, especially in the individuals with conduction aphasia (3 of the 20 PWA). In part because of these abnormal responses to feedback, the production and repetition deficits in conduction aphasia have been hypothesised to stem in part from problems with auditory-motor integration (Buchsbaum et al., 2011; Hickok & Poeppel, 2004). Additionally, accounts of error repair in Broca’s and Wernicke’s aphasia suggest impairments in auditory speech monitoring (Oomen, Postma, & Kolk, 2001; Schlenck, Huber, & Willmes, 1987). These findings make PWA a suitable population for objective acoustic study because it remains unclear how much of their impairments are due to feedback vs. feedforward speech processes, as well as whether these can be explained by low-level sensory or motor impairments. In particular, the proposed analysis helps to characterise aphasic speech by differentiating feedforward and feedback contributions to speech stability under natural conditions. Furthermore, because PWA are a heterogeneous sample, this method could be used to characterise speech abilities at the individual level for further diagnosis or treatment.
With this aim, the current study investigates the functional source of speech errors in aphasia by assessing the extent to which PWA use feedback to detect and correct deviations in their speech. Past research in healthy control speakers shows that the brain is sensitive to natural variability in one’s own speech: auditory cortical regions show a greater response when self-produced words deviate slightly from their prototypical acoustics (Niziolek, Nagarajan, & Houde, 2013). Moreover, this sensitivity is correlated with vowel centering, a corrective movement that reduces the acoustic deviation over the course of the syllable, bringing utterances back on target. Thirdly, vowel centering has been shown to be reduced under conditions of masking noise, suggesting that auditory feedback plays a role in the corrective behavior (Niziolek, Nagarajan, & Houde, 2015). Together, these results implicate an auditory-motor circuit of acoustic deviance detection and correction that is used to constantly monitor and modify ongoing speech. One possibility is that this feedback detection-correction circuit may be impaired in some PWA, resulting in a higher frequency of speech errors for individuals who cannot detect small deviations and correct them before they cross a phonetic boundary and are perceived as an unintended phoneme. If this is the case, we would predict a reduction or absence of vowel centering, such that acoustic variability would not decrease (or would decrease to a lesser degree than in control subjects) over the course of the syllable. Alternatively, a functioning detection-correction circuit could be coopted to compensate for an impairment in feedforward motor commands; in this case, we would predict increased variability at syllable onset, even in trials perceived as correct, but a preserved centering response that serves to decrease that variability. Given these contrasting hypotheses, we propose extending this paradigm to PWA in order to investigate whether speech production errors in aphasia could be ascribed to deficits in online feedback control.
Our approach using vowel centering confers two useful benefits of direct acoustic measurement that complement perceptual judgments by observers or clinicians: objectivity and precision. First, acoustic measurement profiles offer an objective metric of current production ability as well as change across different recording sessions. Second, these measurements can reveal subphonemic distinctions beyond the precision of the human ear, which tends to process vowels categorically (Altmann et al., 2014; Pisoni, 1975). Together with human judgments they can be a useful technique to test hypotheses about the mechanisms that underlie behavioral impairments, and once a disorder is characterised, have the potential to contribute to differential diagnosis.
Methods
Participants
Eight persons with aphasia took part in the experiment (see Table I). The participants were between 50–73 years of age (mean = 56.6, SD = 7.7) and had chronic aphasia (months post-stroke: mean = 68.6, SD = 28.3) secondary to a single left-hemisphere stroke of the middle cerebral artery, with a mix of aphasia subtypes (Anomic: 4; Broca’s: 3, Conduction: 1). These participants were recruited to collect feasibility data for a neuroimaging study with the same behavioral task. All study procedures, including recruitment and acquisition of informed consent, were approved by the Institutional Review Board of Boston University’s Charles River Campus.
Table I.
Participant characteristics.
| PWA | AGE | SEX | EDU | SUBTYPE | WAB AQ | PALPA7 (%) | PALPA8 (%) | PAL7 (%) | EXAMPLE ERROR |
|---|---|---|---|---|---|---|---|---|---|
| S01 | 59 | F | HS | Anomic | 97.2 | 100.0 | 76.7 | 87.5 | precipice → *prencipice |
| S02 | 59 | M | BA | Anomic | 81.5 | 95.8 | 66.7 | 70.0 | steak → *state |
| S03 | 52 | M | BA | Broca’sAOS | 63.6 | 73.3 | 43.3 | 72.5 | sailboat → *sailbout |
| S04 | 57 | M | BA | Anomic | 91.9 | 100.0 | 93.3 | 87.5 | flying → *flewing |
| S05 | 51 | M | MA | Broca’s | 36.2 | 87.5 | 53.3 | 55.0 | boat → *goat |
| S06 | 51 | M | HS | Anomic | 95.3 | 95.8 | 96.7 | 95.0 | branch → *bratch |
| S07 | 67 | F | BA | Conduction | 76.8 | 91.7 | 66.7 | 52.5 | toes → *does |
| S08 | 73 | M | PhD | Broca’s | 25.1 | 75.0 | 46.7 | 32.5 | branch → *bronch |
Comorbid apraxia of speech
Participants were assessed using the Western Aphasia Battery (WAB-R, Kertesz, 2007), Psycholinguistic Assessments of Language Processing in Aphasia (PALPA7, word repetition, and PALPA8, non-word repetition, Kay, Lesser, & Coltheart, 1992), Psycholinguistic Assessments of Language (PAL7, word and non-word repetition, Waters & Caplan, 1995), and the Screen for Dysarthria and Apraxia of Speech (S-DAOS) (Dabul, 2000). Because we were interested in the relationship between vowel centering and speech errors, we sought out PWA who made errors in repetition; specifically, our inclusion criteria required participants to make at least four errors across the PAL7, PALPA7, and PALPA8 (making errors such as “bratch” for “branch”). We also qualitatively assessed participants’ spontaneous speech from the WAB-R: the first author checked for the presence of errors in the conversational questions and picture description task (e.g. phonemic paraphasias such as [doʊz] for “toes” or [seɪɫbaʊt] for “sailboat”, and distortions such as [daɫg] for “dog”). Two participants presented with high scores on the WAB-R; both these individuals were included in our sample, as they had previously tested below 93.8 in the chronic phase (>6 months post-stroke), continued to report difficulty in communicating, and made errors that patterned with those of our other participants. One of the participants with Broca’s aphasia exhibited mild-to-moderate comorbid apraxia of speech as determined by the clinical judgment of a speech-language pathologist, who assessed his spontaneous speech and characterized it as having vowel and consonant distortions, abnormal prosody, slow rate of speech, and segmentation of syllables both within words and across words in phrases. This participant also exhibited impaired alternating motion rates on the S-DAOS (i.e. 5 and 0 productions of “puh-tuh” and “puh-tuh-kuh,” respectively). However, given his ability to perform the experiment task, he was included in the sample. All other participants were either judged to be nonapraxic (six participants) or did not produce enough fluent speech output for apraxia of speech to be evaluated (one participant who produced mostly verbal stereotypies; the speech he could produce was absent of apraxic features).
Procedure
The eight PWA completed a behavioral experiment in which they read aloud monosyllabic words. Participants were seated in a sound booth while their speech was recorded with a head-worn condenser microphone placed ~2 cm from the corner of the mouth. Recordings had a sampling rate of 44,100 Hz. On each trial, one of three monosyllabic words (“eat”, “Ed”, or “add”) was randomly chosen and displayed on the screen. These three words were selected to avoid effects of consonant coarticulation—all words began with a vowel and ended with consonants sharing a place of articulation—and for comparison with past studies using this stimulus set. Visual presentation of target words was chosen for maximal efficiency and for suitability for planned neuroimaging follow-up studies. The presentation rate was automatically adjusted to account for variable response time delays: produced sounds with a duration of at least 150 ms were detected by the custom-developed software as a vocal response (Niziolek & Mandel, 2017), and the following trial was displayed following a 500-ms delay from response offset. Participants completed 600 trials total with an optional break after each block of 30 trials (approximately every 60 seconds), for an average of 200 productions of each word.
Care was taken to ensure that all participants could perform the task. Before recording started, the participants practiced reading the three words. Of the eight participants, four (S01, S02, S04, S06) had mild aphasia and completed the task easily; however, they occasionally produced errors of mis-selection (producing one of the other words in the stimulus set, e.g. “eat” for “Ed”). For two of the participants with Broca’s aphasia (S03, S08) performance on the task was slower and clearly more effortful, but both completed it without issue, making some errors of mis-selection and some distortions or substitutions of other words not in the set (e.g. “head” for “Ed” or “odd”/”ate” for “add”). The third participant with Broca’s aphasia (S05) had difficulty reading the words when they were randomised, and instead performed a modified version of the task in which one single word was repeated for each block of 30 trials. The participant with conduction aphasia (S07) performed the task quickly but with visible effort, also producing both mis-selections and distortions (“ee-uh-Ed”/”ih-Ed’). These errors underscore the phonemic paraphasias and distortions in spontaneous speech and repetition measured by the diagnostic evaluations. Given that all participants read from a set of only three words and had ample training to ensure they could read them, we believe word retrieval problems to be minimal in this task.
Although we did not collect data from matched controls in the current study, we compare the PWA data with a previous data set of healthy speakers performing the same task with the same number of trials (Niziolek et al., 2013).
Acoustic analysis
The current study examined the ability of PWA to make small within-category adjustments to their speech online; therefore, we analysed the acoustics of vowel production across the time course of each spoken word to look for evidence of real-time correction. First, as we were interested in dynamics of formant movement in natural productions that would be comparable to control subjects, only correct trials were included in the acoustic analysis. All errors that changed the target into a perceptibly different form were discarded by listening to each utterance and excluding any nonresponses, vowel distortions, mis-selections (producing one of the other words in the stimulus set, e.g. saying “eat” for “Ed”), or other overt perceptible errors (e.g. saying “head” for “Ed”). A summary of observed error types is given in Table II.
Table II.
Summary of observed errors during the experimental production task.
| PWA | OMISSIONS | MIS-SELECTIONS | DISTORTIONS | OTHER | TOTAL ERROR COUNT |
|---|---|---|---|---|---|
| S01 | 6 | 3 | 0 | 0 | 9 |
| S02 | 0 | 1 | 1 | 0 | 2 |
| S03 | 18 | 18 | 1 | 0 | 37 |
| S04 | 0 | 6 | 0 | 0 | 6 |
| S05 | 2 | 3 | 1 | 7 | 13 |
| S06 | 1 | 1 | 1 | 1 | 4 |
| S07 | 1 | 3 | 5 | 1 | 10 |
| S08 | 1 | 2 | 2 | 2 | 7 |
For the remaining trials, the first and second formant frequencies (F1 and F2) for each utterance were tracked at each time point from vowel onset to vowel offset using the wave_viewer software package for Matlab (Niziolek & Houde, 2015; Fig. 1A). First, recordings were downsampled to a rate of 11,025 Hz, and syllable onset and offset were detected using an intensity threshold that was manually set per participant based on the first few utterances. Because all syllables were vowel-initial, the syllable onset corresponded to the onset of voicing. Formants in the spoken interval were estimated using an LPC analysis, with filter order chosen on a per-participant and per-vowel basis to most accurately model spectral peaks. A 36-ms (397-point) Hann window with a step size of 3 ms was used as the input to the formant estimation algorithm; pre-emphasis was set to a default of 1.95 and also adjusted on a per-participant and per-vowel basis when necessary to achieve stable tracking. Spoken intervals were inspected and onset and offset markers were manually corrected where necessary. Trials with errors in formant tracking, i.e. trials in which the formant estimates contained large (>100 Hz) discontinuities or implausibly low or high values (determined per vowel), were also removed from further analysis. Formant values were tracked in Hz and converted to the mel perceptual scale to better align with participants’ self-perception of their own speech acoustics.
Figure 1.
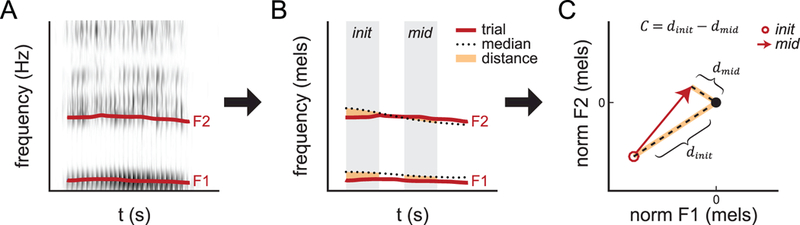
. Schematic of vowel centering analysis. A: Spectrogram of single trial with formants tracked. B: Formant tracks from single trial compared with vowel median. C: Distance from median plotted in 2D formant space. Open circle and arrowhead indicate formant values in initial and mid-utterance time windows, respectively. The median for both time windows is normalised to the black dot at (0,0).
As in Niziolek et al., 2013, two time windows were defined: an initial time window from 0 to 50 ms post-onset, and a mid-utterance time window consisting of the middle 50% of the vowel in each trial (Fig. 1B). Formant values for each trial were averaged within each of these two time windows. To give a measure of variability, each production of a given vowel was compared to the median for that vowel in 2D formant space (Fig. 1C). This was done separately for the initial and mid-utterance time windows: for each trial, the initial distance dinit was defined as the Euclidean distance to the median of this initial time window in F1–F2 space; that is, . The mid-utterance distance dinit for each trial was defined in the same manner, using the median from the mid-utterance time window: Finally, vowel centering was defined as the reduction in this distance between the initial and mid-utterance time windows: C = dinit − dmid . In other words, vowel centering is within-syllable formant movement toward the time-varying median, lessening variability over the time course of the syllable.
First, we assessed whether vowel centering caused a significant within-syllable decrease in variability for all trials on average. We compared the log-transformed distances dinit and dmid for all trials using a three-way ANOVA (factors of subject, vowel, and time window: init or mid). If PWA are able to employ online adjustments of their speech to better achieve a consistent phonetic target, we would expect distances to be smaller in the later mid-utterance time window.
Second, we assessed the degree to which variable (but still “correct”) trials were adjusted online. If observed centering behavior is due to a process that brings utterances closer to their phonetic targets, we would expect the most variable trials to exhibit the most centering, as they are most in need of correction. To test this hypothesis, we therefore defined “center” and “peripheral” trials, respectively, as the closest and farthest 20% of trials from each vowel’s median during the initial time window (Fig. 2A-C, green dots = center, red circles = periphery; approx. 100 center and 100 peripheral trials per participant). That is, the center trials were most acoustically similar to the median utterance during this initial time window (smallest dinit), and the peripheral trials were the most acoustically deviant from this median (largest dinit). We then quantified the magnitude of centering in peripheral trials.
Figure 2.
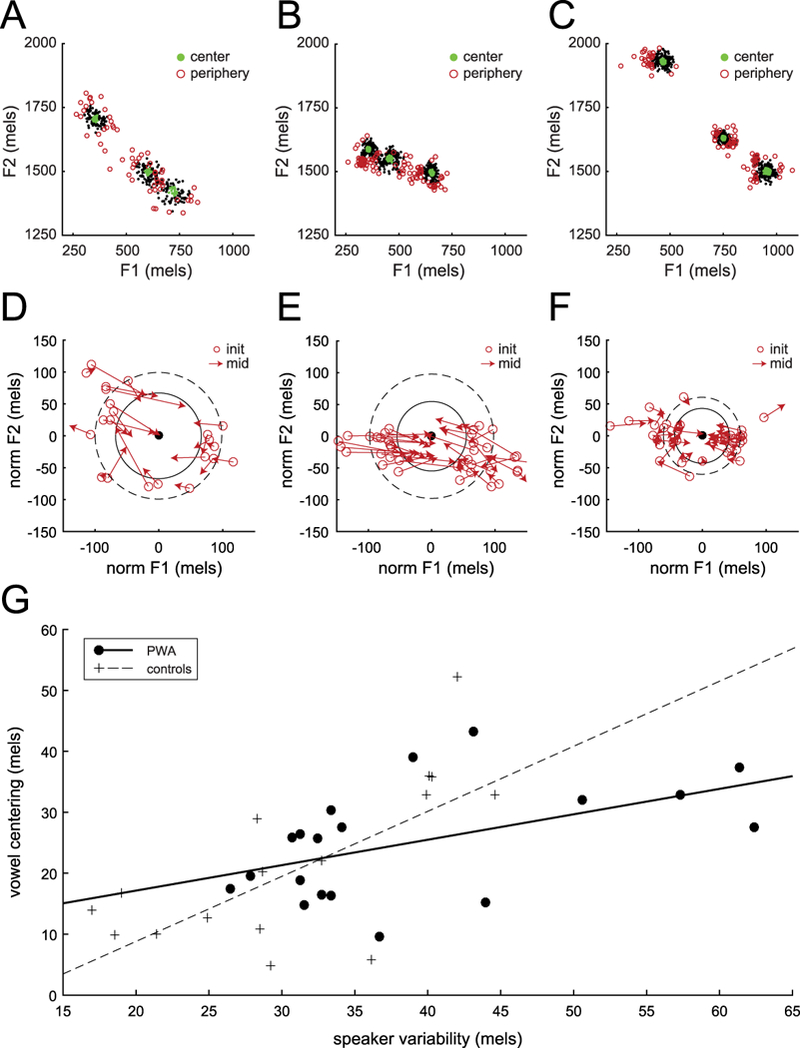
. A,B: Formant variability across repeated productions, representative participants with aphasia (S08,S02). Green dots show center trials and red circles show peripheral trials. C: Formant variability, control subject (Niziolek et al., 2013), as in A,B. D,E: Vowel centering, same representative participants with aphasia. Arrows show formant movement in individual speaking trials. F: Vowel centering, control subject (Niziolek et al., 2013), as in D,E. G: Correlation between initial variability and vowel centering. Each marker represents a single vowel in one speaker. Black dots show data from PWA in the current study; crosses show previously-reported data in a non-matched control sample (Niziolek et al., 2013) for comparison.
To ensure that this peripheral centering was not merely due to regression to the mean, we reran this same analysis in a time-reversed manner. That is, we redefined center and peripheral trials, respectively, as the closest and farthest 20% of trials from each vowel’s median during the mid-utterance time window. This gave a new set of “center” trials that had the smallest dmid, and a new set of “peripheral” trials that had the largest dmid. By measuring the time-reversed centering of these new sets of trials (Ctime−reversed=dmid−dinit), we aimed to quantify the degree to which trials with extreme measurements in a later time window “regressed” to less extreme measurements in an earlier time window, as regression to the mean would be expected to occur both forwards and backwards in time. Our goal here was to test whether changes in distance could be explained by random measurement error as opposed to true movement. To this end, we compared peripheral centering with time-reversed peripheral centering using a three-way ANOVA (factors of subject, vowel, and time direction).
In a similar vein, we also carried out a three-way ANOVA using the absolute Euclidean distance between the starting formants and the mid-trial formants for each trial, , as the dependent variable, and including factors of subject, vowel, and trial type (center vs. periphery).
Finally, we tested whether initial variability (the median of dinit over all trials) and vowel centering (C=dinit−dmid) correlated with each other across participants. We also tested both of these measures for correlations with standardised measures of aphasia severity (WAB-R AQ) and repetition accuracy (PALPA7, PALPA8, and PAL7).
Results
We examined vowel formant movement in the most acoustically deviant correct trials and calculated vowel centering: the degree to which this movement served to decrease the deviance of these trials within the syllable. All participants with aphasia exhibited vowel centering; that is, peripheral trials decreased their distance to the median from the beginning to the middle of the utterance over and above what would be expected from regression to the mean (three-way ANOVA, dependent variable: vowel centering (C), effect of time direction: F(1,7) = 256.49, p < 0.001), and over and above movement seen in center trials (three-way ANOVA, dependent variable: Euclidean distance (deqcl), effect of trial type: F(1,7) = 69.87, p < 0.001). The average distance from the median for all trials (not just peripheral trials) also decreased over time (three-way ANOVA, dependent variable: log-transformed distances to median, main effect of time window: F(1,7) = 99.62, p < 0.001); that is, peripheral centering was not canceled out by outward movements in center trials. There were also main effects of subject (F(1,7) = 2.95, p = 0.004) and vowel (F(1,7) = 11.64, p < 0.001)—that is, there was a significant difference in centering degree between participants and between the three different produced words. However, post-hoc comparisons of individual participants showed that each showed a significant centering effect (Tukey-Kramer corrected p < 0.05 for all individual PWA).
The vowel production spaces of two representative participants with aphasia (S08 and S02) are shown in Figure 2A-B, with each point representing an individual utterance. These participants were chosen because their formant variability was close to the group mean. Figure 2D-E shows only the utterances at the periphery of the distribution, normalised to the formant median. Participant S08’s peripheral utterances had an average initial formant deviance of 97 mels from the median (dashed line), but by mid-utterance this distance dropped to 68 mels (solid line), a decrease of 29 mels. Participant S02’s peripheral utterances had an average initial formant deviance of 98 mels from the median (dashed line), but by mid-utterance this distance dropped to 55 mels (solid line), a decrease of 43 mels. The average magnitude of this decrease across all vowels and all PWA was 28 mels, or 44 Hz. Peripheral trials showed more overall formant movement in Euclidean space than center trials (three-way ANOVA, effect of trial type: F(1,7) = 68.44, p < 0.001).
In PWA, acoustic variability significantly decreased over the course of the syllable. Though we did not collect data from a matched control group in the current study, these reductions in variability are quite remarkable relative to previously-reported data from typical speakers (Niziolek et al., 2013). As a group, PWA showed an even greater absolute centering effect: 28 mels in PWA vs. 18 mels in typical speakers. However, PWA had much more variability at onset (Fig. 2A-B vs. 2C): the average distance to the median across all trials was 34 mels, compared with 28 mels in the typical speaker dataset. Thus, despite the significant formant correction, the variability at mid-utterance in PWA remained slightly larger than that of previously-reported younger speakers (29 mels in PWA vs. 27 mels in typical speakers).
Furthermore, in PWA, the degree of vowel centering was correlated with initial acoustic variability (r = 0.502; p = 0.028). In other words, the greater the initial acoustic distance to the median, the greater the formant movement serves to lessen this distance. This pattern was also seen in past control subjects (Niziolek et al., 2013); however, for PWA, the slope is shallower, with the percent correction falling off for the most highly variable individuals (Fig. 1G).
Finally, no correlations between standardised measures and acoustic measures attained statistical significance (Table III). However, the trends were consistent: the higher the participants’ WAB AQ scores, and the higher their performance on word and nonword repetition measures, the smaller their initial formant variability and the smaller their magnitude of vowel centering.
Table III.
Correlations between acoustic measures and assessments.
| CORRELATES | PEARSON’S R | P |
|---|---|---|
| Initial variability, vowel centering | 0.581 | 0.005** |
| Initial variability, WAB AQ | −0.349 | 0.397 |
| Initial variability, PALPA7 | −0.538 | 0.169 |
| Initial variability, PALPA8 | −0.499 | 0.208 |
| Initial variability, PAL7 | −0.607 | 0.111 |
| Vowel centering, WAB AQ | −0.328 | 0.428 |
| Vowel centering, PALPA7 | −0.225 | 0.593 |
| Vowel centering, PALPA8 | −0.424 | 0.295 |
| Vowel centering, PAL7 | −0.216 | 0.608 |
Discussion
In this experiment, we examined whether the speech of eight individuals with aphasia showed evidence of within-syllable correction as measured by vowel centering, an effect previously documented in control subjects. Despite displaying a prevalence of speech errors in spontaneous and repeated speech, each individual in our sample of PWA exhibited vowel centering. There are likely multiple simultaneous drivers of this centering behavior: in addition to auditory feedback signals that alert the speaker to acoustic deviance, centering may alternatively be explained by contributions of rapid somatosensory feedback and the dynamics of motoric commands as they transition from onset to steady state. However, past work showing that centering is significantly reduced under noisy feedback conditions (Niziolek et al., 2015) suggests that auditory feedback is an important driver of the centering response. Thus, preserved vowel centering in PWA can be interpreted as evidence for a partially intact sensory feedback circuit for speech deviance detection and correction. That is, as in healthy controls (Niziolek et al., 2013), online feedback correction mechanisms appear to be at work even during “correct” syllable production in this sample of PWA.
This proof-of-concept finding suggests that phonemic errors in aphasia are not merely due to impaired feedback mechanisms; instead, feedforward deficits may contribute both to produced errors and to the increased acoustic variability found in non-error productions in this study. This is consistent with studies that hypothesise deficits in speech planning. However, as this study examined formant movement in “correct” trials only, further analysis of the acoustic distributions of error trials is warranted to validate whether feedback control is impaired during error processes. Furthermore, this study is preliminary and calls for further exploration of this phenomenon in larger, more homogenous samples, including specific subtypes within the larger population of PWA. If this account holds true for even a subset of PWA, successful monitoring of feedback may help these individuals compensate for feedforward impairments, helping to bring variable acoustics back on track.
This finding is in line with past studies that found relatively intact feedback compensation for articulatory constraints imposed by a bite block (Baum, 1999; Baum, Kim, & Katz, 1997; Jacks, 2008), even in PWA with apraxia. However, other studies do point to abnormalities in feedback processing, especially those employing delayed auditory feedback (DAF). In addition to group studies showing abnormally increased or decreased fluency under DAF relative to controls (Boller et al., 1978; Chapin et al., 1981), a case study of a patient with conduction aphasia (Boller & Marcie, 1978) showed evidence of improved speech fluency under conditions of feedback delay, similar to what has been found in persons who stutter (Kalinowski, Armson, Roland-Mieszkowski, Smart, & Gracco, 1993; Soderberg, 1969). In the current study, we only had one participant with conduction aphasia (S07); interestingly, she had the greatest mean formant variability in the group, and the third largest centering magnitude. It is possible that differences in feedback processing between PWA and healthy controls would be exacerbated under the adverse conditions of DAF.
These findings serve as a proof of concept that the vowel centering technique can be used to assess the integrity of online correction in disordered speakers. In the current study, we hypothesised that a feedforward impairment would be manifest in increased acoustic variability at syllable onset, and that successful feedback correction would result in a within-syllable reduction of that variability; this is consistent with our observations in this subset of PWA. Testing multiple time windows throughout vowel production allows for greater sensitivity in detecting differences between populations. Although abnormal vowel production has been observed both in PWA and in apraxia of speech (Haley et al., 2001), not all past studies have found differences in trial-to-trial variability in these individuals (Jacks, Mathes, & Marquardt, 2010). However, that study and others employed analyses that averaged formant values across time points to determine a single value for the entire utterance, which may have masked differences in variability that emerged only at vowel onset.
Additionally, by separating analyses of initial and mid-utterance variability, the current paradigm allows the two to be compared with each other. The correlation between variability in the initial time window and the reduction in that variability in the mid-utterance time window, significant in both PWA and controls, implies a correction mechanism that scales with the magnitude of the acoustic and articulatory deviance from the target sound. Interestingly, we did find some evidence for a decreased correlation slope in PWA relative to controls, reflective of less complete corrections in the most variable individuals: though their centering was larger in absolute frequency space, it was not enough to offset their abnormally wide initial variability, narrowing but not completely closing the variability gap between our PWA and control samples. Though we cannot directly compare these correlations across unmatched groups here, future work can assess whether the smaller centering gain in PWA significantly differentiates them from control speakers, demonstrating the limits of feedback processing in formant correction.
The chief limitation of the vowel centering analysis technique is the need for many spoken trials, enough to build up a vowel formant distribution that can be queried both at its center and its periphery (ideally at least 50–100 productions per vowel). However, these trials can be gathered relatively quickly under this paradigm: even setting their own pace, PWA in the current study averaged around 2 seconds per trial. While presenting the stimuli as visual text strings, as done here, is likely the most efficient paradigm, it is possible to elicit vowel production through other means, such as repetition or picture naming, for participants who are unable to read. Repetition of auditorily-presented words can also avoid confounding speech production deficits with difficulties in reading or naming; however, introducing an auditory model may alter the spoken target through processes of phonetic convergence (Goldinger, 1998; Sato, Grabski, Garnier, Schwartz, & Nguyen, 2013).
The vowel centering analysis also requires formant measurements to be fairly accurate, as noise in measurements near vowel onset would induce apparent (but spurious) centering behavior. In the current study, we minimised measurement errors by using vowel-initial words, which ensured no syllable-initial coarticulatory effects and which limited measurement noise at onset, as speakers could adopt the articulatory configuration for the vowel prior to speaking, often producing traces of visible formants even before modal voicing began. Additionally, limitations in formant estimation procedures can lead to measurements that are biased by the particular fundamental frequency (F0) exciting the formants; depending on the algorithm used to automatically derive formants, this bias can be of a comparable magnitude to the centering shown in the current study (Shadle, Nam, & Whalen, 2016), so care should be taken to test effects of F0 across the spoken sample.
Finally, as the control subjects from Niziolek et al., 2013 shown in Figure 2G were mostly in their twenties and thirties (there was one participant over age 50), the current study did not have an age-matched control group for comparisons at the population level, a limitation we plan to address in upcoming work. We are using magnetoencephalographic (MEG) imaging to analyse auditory error detection ability in both PWA and age-matched controls during the production of the same syllables from the current study, treating auditory cortical suppression as a measure of sensitivity to self-produced acoustic deviations. These complementary analyses will inform theories of error detection and correction in healthy speakers and models of error prevalence in persons with aphasia.
Acknowledgments
We thank Sara Beach for assisting in data collection and analysis and Erin Meier, Jeffrey Johnson, and Natalie Gilmore for helpful comments on the manuscript. This work was supported by the National Institutes of Health (NIDCD) under Grant K99DC014520.
Footnotes
Special issue: “Bringing advanced speech processing technology to the clinical management of speech disorders”
References
- Altmann CF, Uesaki M, Ono K, Matsuhashi M, Mima T, & Fukuyama H (2014). Categorical speech perception during active discrimination of consonants and vowels. Neuropsychologia, 64, 13–23. 10.1016/j.neuropsychologia.2014.09.006 [DOI] [PubMed] [Google Scholar]
- Ballard KJ, Tourville JA, & Robin DA (2014). Behavioral, computational, and neuroimaging studies of acquired apraxia of speech. Frontiers in Human Neuroscience, 8 10.3389/fnhum.2014.00892 [DOI] [PMC free article] [PubMed] [Google Scholar]
- Baum SR (1999). Compensation for jaw fixation by aphasic patients under conditions of increased articulatory demands: a follow-up study. Aphasiology, 13(7), 513–527. 10.1080/026870399401984 [DOI] [Google Scholar]
- Baum SR, Blumstein SE, Naeser MA, & Palumbo CL (1990). Temporal dimensions of consonant and vowel production: An acoustic and CT scan analysis of aphasic speech. Brain and Language, 39(1), 33–56. 10.1016/0093-934X(90)90003-Y [DOI] [PubMed] [Google Scholar]
- Baum SR, Kim JA, & Katz WF (1997). Compensation for Jaw Fixation by Aphasic Patients. Brain and Language, 56(3), 354–376. 10.1006/brln.1997.1734 [DOI] [PubMed] [Google Scholar]
- Blumstein SE, Cooper WE, Goodglass H, Statlender S, & Gottlieb J (1980). Production deficits in aphasia: A voice-onset time analysis. Brain and Language, 9(2), 153–170. 10.1016/0093-934X(80)90137-6 [DOI] [PubMed] [Google Scholar]
- Boller F, & Marcie P (1978). Possible role of abnormal auditory feedback in conduction aphasia. Neuropsychologia, 16(4), 521–524. 10.1016/0028-3932(78)90078-7 [DOI] [PubMed] [Google Scholar]
- Boller F, Vrtunski PB, Kim Y, & Mack JL (1978). Delayed Auditory Feedback and Aphasia. Cortex, 14(2), 212–226. 10.1016/S0010-9452(78)80047-1 [DOI] [PubMed] [Google Scholar]
- Buchsbaum BR, Baldo J, Okada K, Berman KF, Dronkers N, D’Esposito M, & Hickok G (2011). Conduction aphasia, sensory-motor integration, and phonological short-term memory – An aggregate analysis of lesion and fMRI data. Brain and Language, 119(3), 119–128. 10.1016/j.bandl.2010.12.001 [DOI] [PMC free article] [PubMed] [Google Scholar]
- Buchwald A, & Miozzo M (2012). Phonological and Motor Errors in Individuals With Acquired Sound Production Impairment. Journal of Speech, Language, and Hearing Research, 55(5), S1573–S1586. 10.1044/1092-4388(2012/11-0200) [DOI] [PubMed] [Google Scholar]
- Chapin C, Blumstein SE, Meissner B, & Boller F (1981). Speech production mechanisms in aphasia: A delayed auditory feedback study. Brain and Language, 14(1), 106–113. 10.1016/0093-934X(81)90068-7 [DOI] [PubMed] [Google Scholar]
- Dabul B (2000). Apraxia Battery for Adults: Examiner’s manual. Austin, TX: Pro-Ed. [Google Scholar]
- Goldinger SD (1998). Echoes of Echoes? An Episodic Theory of Lexical Access. Psychological Review, 105(2), 251–279. [DOI] [PubMed] [Google Scholar]
- Haley KL, Jacks A, & Cunningham KT (2013). Error Variability and the Differentiation Between Apraxia of Speech and Aphasia With Phonemic Paraphasia. Journal of Speech, Language, and Hearing Research, 56(3), 891–905. 10.1044/1092-4388(2012/12-0161) [DOI] [PubMed] [Google Scholar]
- Haley KL, Ohde RN, & Wertz RT (2001). Vowel quality in aphasia and apraxia of speech: Phonetic transcription and formant analyses. Aphasiology, 15(12), 1107–1123. 10.1080/02687040143000519 [DOI] [Google Scholar]
- Hickok G, & Poeppel D (2004). Dorsal and ventral streams: a framework for understanding aspects of the functional anatomy of language. Cognition, 92(1–2), 67–99. 10.1016/j.cognition.2003.10.011 [DOI] [PubMed] [Google Scholar]
- Iuzzini-Seigel J, Hogan TP, Guarino AJ, & Green JR (2015). Reliance on auditory feedback in children with childhood apraxia of speech. Journal of Communication Disorders, 54, 32–42. 10.1016/j.jcomdis.2015.01.002 [DOI] [PubMed] [Google Scholar]
- Jacks A (2008). Bite Block Vowel Production in Apraxia of Speech. Journal of Speech, Language, and Hearing Research, 51(4), 898–913. 10.1044/1092-4388(2008/066) [DOI] [PubMed] [Google Scholar]
- Jacks A, & Haley KL (2015). Auditory Masking Effects on Speech Fluency in Apraxia of Speech and Aphasia: Comparison to Altered Auditory Feedback. Journal of Speech, Language, and Hearing Research : JSLHR, 58(6), 1670–1686. 10.1044/2015_JSLHR-S-14-0277 [DOI] [PMC free article] [PubMed] [Google Scholar]
- Jacks A, Mathes KA, & Marquardt TP (2010). Vowel Acoustics in Adults With Apraxia of Speech. Journal of Speech, Language & Hearing Research, 53(1), 61–74. 10.1044/1092-4388(2009/08-0017) [DOI] [PubMed] [Google Scholar]
- Kalinowski J, Armson J, Roland-Mieszkowski M, Smart A, & Gracco VL (1993). Effects of Alterations in Auditory Feedback and Speech Rate on Stuttering Frequency. Language & Speech, 36(1), 1–16. [DOI] [PubMed] [Google Scholar]
- Kay J, Lesser R, & Coltheart M (1992). PALPA: Psycholinguistic Assessments of Language Processing in Aphasia. Hove, England: Lawrence Erlbaum Associates. [Google Scholar]
- Keller E (1975). Vowel Errors in Aphasia. University of Toronto. [Google Scholar]
- Keller E (1978). Parameters for vowel substitutions in Broca’s aphasia. Brain and Language, 5(3), 265–285. 10.1016/0093-934X(78)90026-3 [DOI] [PubMed] [Google Scholar]
- Kertesz A (2007). The Western Aphasia Battery–Revised. San Antonio, TX: Psych Corp. [Google Scholar]
- Kurowski K, & Blumstein SE (2016). Phonetic basis of phonemic paraphasias in aphasia: Evidence for cascading activation. Cortex, 75, 193–203. 10.1016/j.cortex.2015.12.005 [DOI] [PMC free article] [PubMed] [Google Scholar]
- Maas E, Mailend M-L, & Guenther FH (2015). Feedforward and Feedback Control in Apraxia of Speech: Effects of Noise Masking on Vowel Production. Journal of Speech, Language, and Hearing Research, 58(2), 185–200. 10.1044/2014_JSLHR-S-13-0300 [DOI] [PMC free article] [PubMed] [Google Scholar]
- Niziolek CA, & Houde JF (2015). wave_viewer: First release. 10.5281/zenodo.13839 [DOI]
- Niziolek CA, & Mandel JC (2017). audio-advance: First release. 10.5281/zenodo.803360 [DOI]
- Niziolek CA, Nagarajan SS, & Houde JF (2013). What Does Motor Efference Copy Represent? Evidence from Speech Production. The Journal of Neuroscience, 33(41), 16110–16116. 10.1523/JNEUROSCI.2137-13.2013 [DOI] [PMC free article] [PubMed] [Google Scholar]
- Niziolek CA, Nagarajan SS, & Houde JF (2015). The contribution of auditory feedback to corrective movements in vowel formant trajectories. In The Scottish Consortium for ICPhS 2015 (Ed.), Proceedings of the 18th International Congress of Phonetic Sciences Glasgow, UK: The University of Glasgow. [Google Scholar]
- Oomen CC, Postma A, & Kolk HH (2001). Prearticulatory and Postarticulatory Self-Monitoring in Broca’s Aphasia. Cortex, 37(5), 627–641. 10.1016/S0010-9452(08)70610-5 [DOI] [PubMed] [Google Scholar]
- Perkell JS (2012). Movement goals and feedback and feedforward control mechanisms in speech production. Journal of Neurolinguistics, 25(5), 382–407. 10.1016/j.jneuroling.2010.02.011 [DOI] [PMC free article] [PubMed] [Google Scholar]
- Pisoni DB (1975). Auditory short-term memory and vowel perception. Memory & Cognition, 3(1), 7–18. 10.3758/BF03198202 [DOI] [PMC free article] [PubMed] [Google Scholar]
- Robson H, Grube M, Lambon Ralph MA, Griffiths TD, & Sage K (2013). Fundamental deficits of auditory perception in Wernicke’s aphasia. Cortex, 49(7), 1808–1822. 10.1016/j.cortex.2012.11.012 [DOI] [PubMed] [Google Scholar]
- Ryalls JH (1986). An acoustic study of vowel production in aphasia. Brain and Language, 29(1), 48–67. 10.1016/0093-934X(86)90033-7 [DOI] [PubMed] [Google Scholar]
- Sato M, Grabski K, Garnier M, Schwartz J-L, & Nguyen N (2013). Converging toward a common speech code: imitative and perceptuo-motor recalibration processes in speech production. Frontiers in Cognitive Science, 4, 422 10.3389/fpsyg.2013.00422 [DOI] [PMC free article] [PubMed] [Google Scholar]
- Schlenck K-J, Huber W, & Willmes K (1987). “Prepairs” and repairs: Different monitoring functions in aphasic language production. Brain and Language, 30(2), 226–244. 10.1016/0093-934X(87)90100-3 [DOI] [PubMed] [Google Scholar]
- Shadle CH, Nam H, & Whalen DH (2016). Comparing measurement errors for formants in synthetic and natural vowels. The Journal of the Acoustical Society of America, 139(2), 713–727. 10.1121/1.4940665 [DOI] [PMC free article] [PubMed] [Google Scholar]
- Soderberg GA (1969). Delayed auditory feedback and the speech of stutterers: A review of studies. Journal of Speech & Hearing Disorders, 34(1), 20–29. 10.1044/jshd.3401.20 [DOI] [PubMed] [Google Scholar]
- Stuart A, Kalinowski J, Rastatter MP, & Lynch K (2002). Effect of delayed auditory feedback on normal speakers at two speech rates. The Journal of the Acoustical Society of America, 111(5), 2237–2241. 10.1121/1.1466868 [DOI] [PubMed] [Google Scholar]
- Terband H, van Brenk F, & van Doornik-van der Zee A (2014). Auditory feedback perturbation in children with developmental speech sound disorders. Journal of Communication Disorders, 51, 64–77. 10.1016/j.jcomdis.2014.06.009 [DOI] [PubMed] [Google Scholar]
- Tourville JA, & Guenther FH (2011). The DIVA model: A neural theory of speech acquisition and production. Language and Cognitive Processes, 26, 952–981. 10.1080/01690960903498424 [DOI] [PMC free article] [PubMed] [Google Scholar]
- Waters G, & Caplan D (1995). The Psycholinguistic Assessment of Language Battery: Preliminary Data. Presented at the The British Aphasiological Society, York, England. [Google Scholar]
- Yates AJ (1963). Delayed auditory feedback. Psychological Bulletin, 60(3), 213–232. 10.1037/h0044155 [DOI] [PubMed] [Google Scholar]