

Abstract
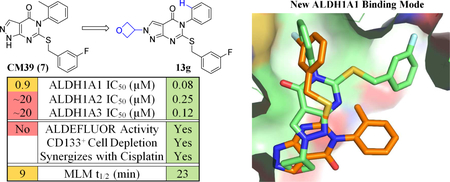
Aldehyde dehydrogenase (ALDH) activity is commonly used as a marker to identify cancer stem-like cells. The three ALDH1A isoforms have all been individually implicated in cancer stem-like cells and in chemoresistance; however, which isoform is preferentially expressed varies between cell lines. We sought to explore the structural determinants of ALDH1A isoform selectivity in a series of small molecule inhibitors in support of research into the role of ALDH1A in cancer stem cells. An SAR campaign guided by a co-crystal structure of the HTS hit CM39 (7) with ALDH1A1 afforded first-in-class inhibitors of the ALDH1A subfamily with excellent selectivity over the homologous ALDH2 isoform. We also discovered the first reported modestly selective single isoform 1A2 and 1A3 inhibitors. Two compounds, 13g and 13h, depleted the CD133+ putative cancer stem cell pool, synergized with cisplatin, and achieved efficacious concentrations in vivo following IP administration. 13h additionally synergized with cisplatin in a patient derived ovarian cancer spheroid model.
Graphical Abstract
INTRODUCTION
Currently, more than half of the 21,400 U.S. women diagnosed with epithelial ovarian cancer (EOC) annually are expected to succumb to the disease within 5 years.1 The first line therapy for the majority of EOC cases is surgical debulking of the primary tumor with adjuvant platinum- and taxane-based chemotherapeutics to treat the residual disease.2–3 Approximately 70% of EOC patients are initially responsive to chemotherapeutics; however, most relapse and ultimately become unresponsive to further chemotherapy.4
EOC tumors contain a hierarchy of heterogeneous cells consistent with the Cancer Stem Cell (CSC) hypothesis.5–8 New therapies which target these CSCs may improve patient outcomes alone or when combined with chemotherapy.9 In EOC, elevated aldehyde dehydrogenase (ALDH) activity is a marker of CSCs.5–7, 10–12 ALDHbright cells (the sub-population of cells with the greatest activity in the ALDEFLUOR assay) are more tumorigenic and chemoresistant than ALDHdim cells, are more prevalent in chemoresistant tumors following chemotherapy, and their presence within a tumor is predictive of poorer patient outcomes.6–8, 12
There are 19 distinct genes for ALDH super-family members in humans. The primary function of ALDH is to oxidize endogenous aldehydes generated through various cellular processes to the corresponding carboxylic acids. In addition to neutralization of these reactive species, the 3 members of the ALDH1A subfamily also function in cellular signaling by generating the nuclear hormone all-trans retinoic acid (ATRA) from retinal.13 In some solid tumors, ATRA has been shown to activate transcription of oncogenes such as c-MYC, PDK-1, and cyclin D1.14 Although the strongest body of evidence supports the role of ALDH1A1 (1A1) in CSCs, other isoforms of the ALDH1A family are often simultaneously expressed.15
Given that ALDH plays a potentially critical role in CSCs, inhibition of ALDH is a potential strategy to target CSC and reverse resistance to chemotherapy. Indeed, knockdown or inhibition of 1A1 increases chemosensitivity in ovarian and other cancers.5, 16–21 ALDH1A2 (1A2) and ALDH1A3 (1A3) have similarly been implicated in chemoresistance in other tumor types.22–23 Some ALDH isoforms, including 1A1, are able to divert cyclophosphamide metabolism, preventing generation of the active phosphoramide mustard; however, their ability to attenuate the effects of other chemotherapeutics such as cisplatin and paclitaxel is poorly understood.15
A panel of cell-permeable, single or dual isoform-selective inhibitors for 1A1, 1A2, and 1A3 could have utility as probes for dissecting the role of the various isoforms in any number of applications which currently rely on siRNA knockdown. Various tumors and cancer cell lines differ in which ALDH1A isoforms are highly expressed. Importantly, high grade serous ovarian tumors, the histologic subtype responsible for 70–80% of EOC deaths, show strong elevation of 1A3 expression but only modest elevation in 1A1 expression. Other histologic subtypes show significant elevation of both isoforms.24–25 The inability of existing 1A1 selective inhibitors to inhibit ALDEFLUOR in 1A3 high cell lines has previously been demonstrated.26
There are a number of small molecule ALDH inhibitors reported in the literature (Figure 1).13, 15 Many bear an electrophilic warhead and rely on reversible or irreversible covalent interaction with the ALDH catalytic cysteine to achieve potency. Design of highly isoform selective compounds employing these warheads is complicated by the presence of this critical cysteine throughout the ALDH family. One of most widely studied ALDH inhibitors, DEAB (1), inhibits at least 6 isoforms of ALDH with an IC50 <15 μM and is a substrate of at least 5 isoforms, including 1A1.27 Compound 1 requires concentrations of ~100 μM to induce chemosensitization of CSCs.28 Disulfiram (2), a non-selective covalent ALDH inhibitor approved for treatment of alcoholism, is rapidly metabolized into several covalent ALDH inhibitors with variable isoform selectivity.13 While 2 is also reported to deplete CSCs in combination with chemotherapy, this effect likely does not result from its action on ALDH.29–31 Win 18,446 (3) is a potent inhibitor of the ALDH1A subfamily (1A1, 1A2, 1A3 Ki = 285, 56, and 261 nM respectively).32 Unfortunately, 3 also inhibits ALDH2 and is a known teratogen due to its ability to chelate zinc, making it an imperfect tool for the study of ALDH1A biology.33 Hurley and colleagues disclosed the non-covalent 1A1 inhibitor high throughput screening (HTS) hits 4 and 5a along with co-crystal structures.34–35 Soon thereafter, compound 5b was disclosed elsewhere.36 Recently, a scaffold-hopping approach to improve the cell permeability of 5b yielded compound 6 and other similar analogs. Compound 6 exhibits potent and highly selective 1A1 inhibition (1A1 IC50 = 7 nM; 1A2, 1A3, ALDH2, ALDH3A1 IC50s > 1μM ) and potent inhibition of ALDEFLUOR in MIA PaCa-2 cells, which preferentially express 1A1. Furthermore, this series was able to sensitize a paclitaxel resistant ovarian cancer cell line to treatment with paclitaxel.37 To our knowledge there are no selective inhibitors of 1A2 or 1A3.13, 15
Figure 1.

Representative ALDH inhibitors 1 – 6 and lead compound 7 (CM39)
The high throughput screen which identified 4 and 5a also yielded the pyrazolopyrimidinone CM39 (7). This compound was an attractive lead for the development of ALDH1A subfamily inhibitors because it exhibited reasonably ligand-efficient inhibition of 1A1 (IC50 = 0.9 μM, LE = 0.32) and good selectivity (<20% inhibition of ALDH2 and 3A1 at 20uM).34 A further screen of selectivity showed ~50% inhibition of 1A2 and 1A3 at 20 μM and little activity against other ALDH isoforms (vide infra). Following our successful acquisition of an x-ray crystal structure of 7 bound in the 1A1 active site (vide infra), we undertook the rational design and synthesis of analogs. Herein we report the ability of these analogs to inhibit ALDH1A with widely varying selectivity profiles. We also examine the ability of selected compounds to inhibit cellular ALDH function using ALDEFLUOR, to deplete the CD133+ putative cancer stem cell pool, and to synergize with cisplatin in two ovarian cancer cell lines and in patient derived ovarian cancer spheroids. Aqueous solubility and metabolic stability were assessed for select compounds to guide future optimization of in vivo probes.
RESULTS and DISCUSSION
Chemistry
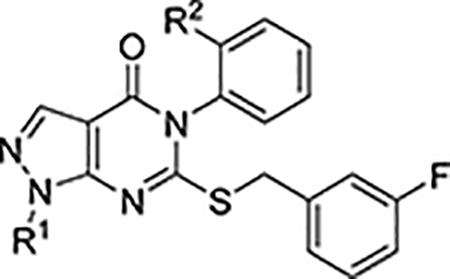
As shown in Scheme 1, synthesis of compounds 7, 11, 12a-d,f-h, and 13a-h began with the commercially available pyrazole 8a.38 Treatment of 8a with the appropriate aryl isothiocyanate in refluxing toluene afforded the thioureas 9a and 9b which precipitated from the reaction mixture upon cooling. Ring closure to generate thiopyrimidinones 10a and 10b proceeded in aqueous NaOH at reflux. Selective S-alkylation with 3-fluorobenzyl bromide yielded compounds 7 and 11. Subsequent N-alkylation resulted in a mixture of regioisomers 12a-d,f-h and 13a-h which were easily separated by flash chromatography on silica. Regioisomeric assignment was made by NOE; in all cases the 1-alkyl-pyrazoles 12 eluted before the corresponding 2-alkyl-pyrazoles 13.
Scheme 1.

Synthesis of compounds 7, 11, 12a-d,f-h, and 13a-h.a
aReagents and conditions: (a) ArNCS, toluene, reflux; (b) 1N NaOH, reflux; (c) 3-F-PhCH2Br, K2CO3, DMF, RT; (d) R1-X, K2CO3, DMF, 50°C X = Br, OMs
In a departure from our earlier synthetic strategy, we envisioned an alternative route to 12e and 15a-m that would use readily available amines rather than the corresponding isothiocyanates to introduce diverse R3 substituents as shown in Scheme 2. The synthesis of 14 has been previously accomplished by treating commercially available pyrazole 8b with thiophosgene under Schotten-Baumann conditions; however, we found the low yield, difficult purification, and use of noxious reagents to be unsatisfactory.39 After screening many reported isothiocyanate-forming conditions employing carbon disulfide as the thiocarbonyl source, we found that treatment of 8b with NaH and CS2 followed by the slow addition of I2 afforded 14 in good yield following a simple purification.40 Isothiocyanate 14 reacted with amines rapidly under mild conditions to form thioureas. Subsequent addition of NaH in the same pot facilitated cyclization to the thiopyrimidinone. For the majority of arylamines, adding 3-fluorobenzyl bromide at this point completed the transformation of 14 to 12e, 15a-i in one pot. For alkylamines and 2-aminopyridine (15j-l), an aqueous workup prior to S-alkylation with 3-fluorobenzyl bromide reduced the formation of several unidentified side products. The thiourea resulting from treatment of 14 with 8N ethanolic methylamine spontaneously cyclized to form the thiopyrimidinone. Following removal of volatiles, S-alkylation of this intermediate with 3-fluorobenzyl bromide under basic conditions afforded 15m.
Scheme 2.

Synthesis of analogs 12e, 15a-m.a
aReagents and conditions: (a) NaH, CS2, I2, THF, 0–40°C; (b) R3-NH2, 3-F-PhCH2Br, NaH, DMF, 0–20°C; (c) (i) R3-NH2, NaH, DMF, 0–20°C; (ii) 3-F-PhCH2Br, K2CO3, DMF, RT; (d) (i) MeNH2, EtOH; (ii) 3-F-PhCH2Br, K2CO3, DMF, RT
Characterization of lead 7
To establish a benchmark and guide design of new analogs, we further characterized compound 7. As shown in Figure 2A, 7 has excellent selectivity for 1A1 vs. 2, 1B1, 3A1, 4A1, Page 8 of 61 5A1, and 1L1 yet modestly inhibits 1A2, 1A3. Despite the presence of a potentially electrophilic isothiourea, 7-mediated inhibition of 1A1 was fully reversed following gel filtration, indicating it is non-covalent (Supplemental Figure S1). Similar to other non-covalent inhibitors of 1A1, 7 was found to be non-competitive with respect to the substrate acetaldehyde with a Ki = 0.38 ± 0.05 μM and uncompetitive with respect to NAD+.35 Liabilities of the lead with regard to its potential as a therapeutic included a half-life of 9 minutes in the presence of MLMs and poor aqueous solubility (2 μM), both of which could be attributed to high lipophilicity (cLogP of 5.2).41 As shown in Figure 2B, compound 7 was inferior to the widely-used ALDEFLUOR control compound DEAB (1) at reducing ALDHBright PEO1 cells at concentrations up to 30 μM. This result suggested that ALDH1A1 selective inhibition is not sufficient to inhibit ALDEFLUOR in this 1A3 high cell line. It is important to note that while DEAB is a 57nM 1A1 selective inhibitor, it only inhibits ALDEFLUOR above its 1A3 IC50 (3 μM).27 More potent ALDEFLUOR inhibition for DEAB in two 1A1 high cell lines, MIA PaCa-2 (IC50 3.4 μM) and HT-29 (IC50 1.7 μM), has previously been reported.26
Figure 2.

(A) Fraction of enzyme activity remaining for 9 ALDH isoforms in the presence of 20 μM 7. (B) Percent control ALDHBright cells remaining following treatment of PEO1 cells at the specified concentration with DEAB (1) or compound 7 (N=2).
Crystal structure of ALDH1A1 complexed with 7
To guide the design of new analogs, an X-ray crystal structure of 7 bound to N121S ALDH1A1 was obtained with a resolution of 2.1Å (PDB code 5TEI, Figure 3A, Table S1, Figure S2). The known single nucleotide polymorphism (NCBI rs1049981) resulting in the N121S missense mutation has been found in a small percentage of the HapMap-CEU population. There is no known clinical significance to the mutation and its structure is highly similar to the wild-type.34–35 The N121S enzyme crystallizes under identical conditions to the WT enzyme, but complexes with inhibitors are frequently easier to obtain, presumably due to dynamic fluctuations within the active site that are not detectable by crystallography and have little impact on observed potency. Furthermore, the IC50 of 7 was comparable for the WT and N121S (0.9 and 0.7 μM respectively, Table 1, Supplementary Figure S1) Similar to the complex with 5a (PDB code 4WP7), the bicyclic ring binds across the exterior 1/3 of the substrate binding pocket. The 3-fluorobenzyl group extends in towards the catalytic nucleophile (C303) and makes aromatic contacts with F171, W178 and F466. This binding mode is orthogonal to that for 4 (PDB code 4X4L), in which its tricyclic ring system extends toward both C303 and W178 (Figure 3B).35 The core heterocycle of 7 binds similarly to the substituted xanthine ring of 5a, binding beneath Y297 and occupying the additional active site volume afforded by the 1A1-specific residue, G458. Other ALDH½ isoenzymes have either an Asn or Asp residue at position 458 which may drive selectivity by prohibiting a similar binding mode in these isoforms. There appears to be room for small substitutions on the pyrazole at N-1 but not N-2, suggesting that larger substituents at these positions will not be tolerated without alteration of the binding pose. The lipophilic 2-methylphenyl ring binds near a relatively polar region of the 1A1 active site, suggesting that appropriate polar substituents could improve or maintain binding affinity while lowering cLogP. The 3-fluorobenzyl ring attached to the sulfur projects into the deepest section of the active site and maximizes contacts with the aromatic residues near the catalytic nucleophile, C303. The apparent goodness of fit of the 3-fluorobenzyl substituent, as well as its expected metabolic stability, encouraged us to retain it for the initial set of analogs based on 7.
Figure 3.

Structure of ALDH1A1 N121S with 7 (2.10 Å, PDB 5TEI). (A) The fluorophenyl of compound 7 projects into the lipophilic pocket towards the catalytic cysteine (C303). Key residues are labelled. (B) Overlay of Compounds 4 (Cyan, PDB entry 4WP7), 5a (Grey, PDB Entry 4X4L), and 7(Orange) bound in ALDH1A1.
Table 1.
Characterization of N-1 alkylated analogs
 |
|||||||||
|---|---|---|---|---|---|---|---|---|---|
| Cmpd No. | R1 | R2 | ALDH IC50a (μM) or % control at 20 μMb | cLogP | Aq. Sol.c(μM) | MLM t1/2(min) | |||
| 1A1 | 1A2 | 1A3 | 2 | (min) | |||||
| 7 | H | Me | 0.9 ± 0.2 | 53% | 53% | 85% | 5.2 | 2 | 9 |
| 11 | H | H | 0.45 ± 0.03 | 0.67 ± 0.08 | 0.39 ± 0.02 | 94% | 4.7 | ||
| 12a | Me | Me | 0.66 ± 0.06 | 52% | 4 ± 1 | 94% | 4.8 | 38 | |
| 12b | c-PrCH2 | Me | 0.18 ± 0.01 | >10 | >10 | 100% | 5.6 | ||
| 12c | 3-oxetanyl | Me | 0.26± 0.03 | 6 ± 1 | 60% | 96% | 4.7 | ||
| 12d | 3-oxetanyl-CH2 | Me | 0.42 ± 0.01 | 45% | 58% | 97% | 4.7 | ||
| 12e | Me | H | 0.08 ± 0.01 | 0.15 ± 0.01 | 0.09 ± 0.01 | 100% | 4.3 | <0.7 (BLQ)d | 8 |
| 12f | c-PrCH2 | H | 0.56 ± 0.03 | 1.26 ± 0.08 | 0.55 ± 0.02 | 83% | 5.1 | ||
| 12g | 3-oxetanyl | H | 0.13 ± 0.01 | 0.23 ± 0.01 | 0.17 ± 0.01 | 94% | 4.1 | 8 | |
| 12h | 3-oxetanyl-CH2 | H | 0.34 ± 0.07 | 1.1 ± 0.1 | 0.61 ± 0.09 | 96% | 4.1 | ||
Values are expressed as
Mean ± SEM (n=3)
Mean (n=3)
Thermodynamic solubility analysis was performed by Analiza Inc. using quantitative nitrogen detection.(www.analiza.com)
BLQ = below limit of quantitation.
Structure-Activity Relationships (SAR)
All new compounds were tested for inhibition of ALDH1A1, 1A2, 1A3, and 2. Selected compounds were also tested for thermodynamic aqueous solubility and stability in the presence of mouse liver microsomes (MLM).
We began our SAR campaign by generating N-alkylated analogs to fill the small lipophilic pocket adjacent to Ile304. We also hypothesized that eliminating the moderately acidic (pKa = 8.142) pyrazole N-H might improve cell permeability. Encouragingly, methylation at N-1 (Table 1, 12a) resulted in a modest improvement in 1A1 inhibition compared to 7. Consistent with a reduction in cLogP42 aqueous solubility was also improved. Installing the larger cyclopropyl-methyl substituent (12b) improved the 1A1 IC50 but did not improve potency against 1A2 or 1A3. The unfavorable cLogP (5.6) of 12b encouraged us to explore less lipophilic oxetanyl analogs 12c-d. 12c maintained comparable potency against 1A1 with substantially lower cLogP (4.7). The homologated oxetane 12d was 2-fold less potent against 1A1, suggesting that larger substituents would not be tolerated.
In an effort to pare down the CM39 scaffold to the key pharmacophore, we discovered that removing the R2 methyl markedly improved inhibition of 1A2 and 1A3 affording compound 11, which potently inhibited all three ALDH1A isoforms but retained excellent selectivity over ALDH2. We revisited the panel of N-1 substituents (12e-h) and observed different SAR trends. The small N-methyl substituent of 12e afforded the most potent of the four analogs tested but exhibited very poor solubility. Given the lower cLogP of 12e compared to 7 or 12a, we believe the poor solubility is best explained by the increased planarity of 12e. The MLM stability of 12e was unchanged relative to 7. The bulkier cyclopropyl-methyl and oxetanyl-methyl substituents of 12f and 12h both resulted in 4-fold or greater reduction in potency against the ALDH1A family relative to 12e. The smaller oxetanyl substituent of 12g was only slightly less potent than 12e and afforded a modest improvement in aqueous solubility. The divergent SAR trends for 12a-d compared to 12e-h suggested that, upon removal of the o-methyl, a new binding mode was accessible.
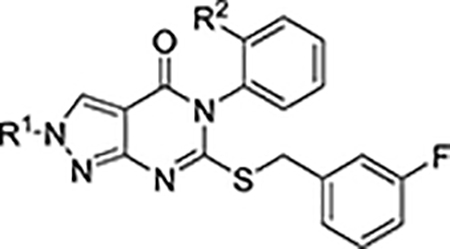
N-2 alkylated analogs were also tested to further probe the flexibility of the binding mode depicted in the CM39 crystal structure (Table 2). 13a exhibited a similar ALDH1A inhibition profile to 12a. Extending to bulkier substituents (13b-d) resulted in improved 1A1 potency with the cyclopropyl-methyl being optimal, providing strong evidence for an alternative binding mode. 13a-d were more potent against 1A3 than the corresponding N-1 regioisomers (12a-d), as exemplified by the modestly 1A1/1A3 selective cyclopropyl-methyl analog 13b. As we observed previously, removal of the o-methyl significantly improved the inhibition of 1A2 and 1A3 in analogs 13e-h. Oxetane was the optimal N-2 substituent to achieve inhibition of all three ALDH1A isoforms (13g), while cyclopropyl-methyl (13f) afforded a potent 1A1/1A3 inhibitor with >5-fold selectivity over 1A2. Despite having higher values for cLogP than the corresponding N-1 regioisomers, N-2 analogs were observed to be more polar by normal and reverse phase chromatography. Consistent with this observation, the solubility of N-2 methyl analog 13e was substantially improved over regioisomer 12e. 13e was also moderately more stable in the presence of MLMs, leading us to prioritize N-2 substituted analogs for further pharmacokinetic studies. Curiously, appending the oxetanyl substituent at N-2 (13g) was not favorable for solubility as was observed at N-1 (12g). Reasonable aqueous solubility was restored for the homologated analog 13h. Perhaps resulting from steric blocking of N-dealkylation, 13g and 13h were about 2-fold more stable in the MLM assay than 13e. Exquisite selectivity over the closely related ALDH2 isoform was maintained for all tested analogs, positioning the series as a useful set of tool compounds to probe the biological effect of ALDH1A inhibition.
Table 2.
Characterization of N-2 alkylated analogs
 |
|||||||||
|---|---|---|---|---|---|---|---|---|---|
| Cmpd No. | R1 | R2 | ALDH IC50a(μM) or % control at 20 μMb | cLogP | Aq. Sol.c(μM) | MLM t1/2 | |||
| 1A1 | 1A2 | 1A3 | 2 | (min) | |||||
| 13a | Me | Me | 0.67 ± 0.07 | 6 ± 1 | 2.2 ± 0.4 | 100% | 5.3 | ||
| 13b | c-Pr-CH2 | Me | 0.10 ± 0.01 | >10 | 1.0 ± 0.1 | 100% | 6.1 | ||
| 13c | 3-oxetanyl | Me | 0.44 ± 0.06 | 8 ± 1 | 3.9 ± 0.4 | 100% | 5.2 | ||
| 13d | 3-oxetanyl-CH2 | Me | 0.20 ± 0.03 | 3.9 ± 0.3 | 2.6 ± 0.3 | 98% | 5.2 | ||
| 13e | Me | H | 0.25 ± 0.01 | 0.34 ± 0.05 | 0.13 ± 0.01 | 94% | 4.8 | 69 | 13 |
| 13f | c-Pr-CH2 | H | 0.13 ± 0.03 | 1.1 ± 0.2 | 0.17 ± 0.03 | 87% | 5.6 | ||
| 13g | 3-oxetanyl | H | 0.08 ± 0.01 | 0.25 ± 0.04 | 0.12 ± 0.02 | 97% | 4.7 | 5 | 23 |
| 13h | 3-oxetanyl-CH2 | H | 0.27 ± 0.01 | 0.48 ± 0.04 | 0.13 ± 0.01 | 99% | 4.7 | 53 | 27 |
Values are expressed as
Mean ± SEM (n=3)
Mean (n=3)
Thermodynamic solubility analysis was performed by Analiza Inc. using quantitative nitrogen detection.(www.analiza.com)
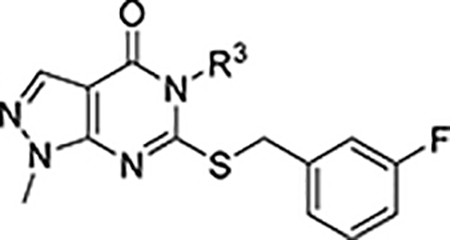
The substantial increase in inhibition across the ALDH1A subfamily upon removal of the o-methyl in R3 (12e) prompted us to further probe the effect of varied substitutions at this position as shown in Table 3. We retained the N-1 methyl substituent of 12e for synthetic ease. Although we had evidence to suggest the binding mode of 7 depicted in the crystal structure was flexible, we began by designing R3 analogs according to the crystal structure. The R3 region of 7 is flanked by a region of exposed peptide backbone (residues 458–460) and the sidechain of N121 (S121 in WT), suggesting that polar interactions in this region might improve binding over the lipophilic 2-methylphenyl. Additionally, as the R3 methyl-phenyl is partially solvent exposed, polar solubilizing moieties were expected to improve pharmacokinetic properties without substantial loss of potency. Unfortunately, all attempts to alter the phenyl present in 12e resulted in significant loss of activity across the ALDH1A subfamily. Nevertheless, interesting selectivity trends did emerge. Substituents other than methyl at the ortho position (Cl, OMe) also rendered compounds 1A1 selective, but decreased 1A1 potency (15a and 15e) relative to proteo analog 12e. Chloro analog 15a showed a twofold improvement in potency (1A1 IC50 = 250 nM) compared to 12a. Because of the comparable size of Cl and CH3, this difference suggested a preference for electron withdrawing groups; however, the electron-deficient fluorinated analog 15d was merely equipotent with 12e despite the similar size of the substituents. Electron-rich methoxy analog 15e was four-fold less potent against 1A1 than 15a. Meta substituents rendered analogs 15b and 15f modestly 1A2 selective. Consistent with our hypothesis that disruption of planarity is favorable for solubility in this series, 15b was considerably more soluble than 12e. Addition of a chlorine in the para position resulted in a 1A2/1A3-selective inhibitor vs 1A1 (15c), while para methoxy analog 15g exhibited very modest selectivity for 1A3. Pyridyl analogs 15h-j were substantially less potent across the ALDH1A family, perhaps reflecting a desolvation penalty without formation of productive hydrogen bonds within the active site. Benzyl analog 15k inhibited 1A1 and 1A2 with good selectivity over 1A3. Homologation to phenylethyl analog 15l resulted in potent inhibition of 1A3 (IC50 = 180 nM) with more than 5-fold selectivity over 1A1 and 1A2 and greater selectivity over other ALDH isoforms as shown in Figure 4. Replacing the phenyl of 12e with a methyl group led to a large decrease in potency (15m). The steep SAR at R3, inconsistent with partial solvent exposure, was further evidence that the binding mode depicted in the crystal structure of 7 was no longer relevant.
Table 3.
Characterization of N-phenyl modifications
 | ||||||
|---|---|---|---|---|---|---|
| Cmpd No. | R3 | IC50a (μM) or % control at 20 μMb |
Aq. Sol.d (μM) | |||
| ALDH | ||||||
| 1A1 | 1A2 | 1A3 | 2 | |||
| 12a | 2-Me-Ph | 0.66 ± 0.06 | 52% | 4 ± 1 | 94% | 38 |
| 12e | Ph | 0.08 ± 0.01 | 0.15 ± 0.01 | 0.09 ± 0.01 | 100% | <0.7 (BLQ)e |
| 15a | 2-Cl-Ph | 0.25 ±0.04 | 75% | 10 ± 2 | 100% | |
| 15b | 3-Cl-Ph | 4.1 ± 0.6 | 0.56 ± 0.06 | 2.6 ± 0.3 | 100% | 55 |
| 15c | 4-Cl-Ph | 69% | 1.1 ± 0.1 | 0.75 ± 0.05 | 100% | |
| 15d | 2-F-Ph | 0.11 ± 0.01 | 8%c | 1%c | 90% | |
| 15e | 2-OMe-Ph | 0.97 ± 0.10 | >10 | >10 | 100% | |
| 15f | 3-OMe-Ph | 41% | 1.3 ± 0.1 | 44% | 82% | |
| 15g | 4-OMe-Ph | 8.2 ± 0.7 | 1.77 ± 0.09 | 0.78 ± 0.09 | 86% | |
| 15h | 3-Pyridyl | 3.83 ± 0.03 | 45% | 117% | 99% | |
| 15i | 4-Pyridyl | 52% | 52% | 60% | 97% | |
| 15j | 2-Pyridyl | 2.4 ± 0.4 | 64% | 67% | 99% | |
| 15k | Bn | 0.89 ± 0.13 | 0.72 ± 0.04 | >10 | 100% | 5 |
| 15l | Ph-CH2CH2 | 1.4 ± 0.15 | 0.9 ± 0.1 | 0.18 ± 0.04 | 87% | 3 |
| 15m | Me | 4.1 ± 0.37 | 79% | 66% | 95% | |
Values are expressed as
Mean ± SEM (n=3)
Mean (n=3)
Dose response curves were not satisfactory for IC50 determination
Thermodynamic solubility analysis was performed by Analiza Inc. using quantitative nitrogen detection. (www.analiza.com)
BLQ = below limit of quantitation.
Figure 4.

Fraction of enzyme activity remaining for 9 ALDH isoforms in the presence of 20μM 15l.
Crystal structure of ALDH1A1 complexed with compound 13g
To elucidate the change in binding mode we suspected, we obtained a co-crystal structure of N121S ALDH1A1 with compound 13g resolved to 2.0Å (PDB code 6DUM) (Figure 5, Table S1, Figure S3). The structure revealed a dramatically different binding pose for 13g in which the R3 N-phenyl is situated near the catalytic cysteine. The N-phenyl is flanked by Phe171 and Phe466, potentially explaining why steric bulk and polarity are not tolerated at the ortho and meta positions (Table 3). It is more difficult to justify why para substituents are so poorly tolerated. In contrast to the binding pose of compound 7, there is room for fairly large N-2 pyrazole substituents to extend across the mouth of the active site. Consistent with this observation, larger substituents at N-2 improve 1A1 potency (13f and 13g) relative to methyl analog 13e. As expected, given that large substituents at N-1 would project into solvent, compounds 12f-h do not improve potency over methyl analog 12e.
Figure 5.

(A) X-Ray crystal structure of 13g bound to ALDH1A1 (PDB code 6DUM). (B) Overlay of compounds 7 (PDB code 5TEI) (Orange) and 13g (Green).
Homology Modeling
In order to better understand the SAR of these compounds, we performed a molecular docking study of select compounds against all isoforms of the ALDH1A class. At the time this manuscript was drafted, no high quality crystal structures were available for 1A2 and 1A3. Recently, Chen et al. disclosed high quality structures of 1A2 with small molecules bound in the active site (e.g. PDB code 6B5H).43 We opted for building our own homology models of 1A2 and 1A3 isoforms based on the PDB structure of ALDH1A1 reported here. Homology models were developed on Swiss-Model Workspace using ProMod3. The quality of the models was assessed by QMEAN scores as well as Ramachandran plots (Supplementary Figure S4,5). Furthermore, when comparing all residues in our 1A2 homology model with PDB:6B5H, the average RMSD was 0.76Å, indicative of an excellent homology model (Supplementary Figure S4). In order to prove robustness of our docking methods, we docked co-crystal ligands 7 and 13g into the binding site of ALDH1A1. The docked poses for both ligands were in good agreement with the crystal structures with RMSD values of 0.8 and 1.0 Å for 7 and 13g, respectively (Supplementary Figure S6).
The molecular docking study of compound 7 in ALDH1A2 (Figure 6B) and1A3 (Figure 6C) shows that the 2-methyl substituent on the phenyl ring would clash with non-conserved residues Leu477 (1A2) or Leu471 (1A3) if it adopted the same binding pose as in 1A1. The corresponding residue Val460 in ALDH1A1 (Figure 6A) avoids this steric clash with 2-methyl substituent. These observations agree with the observed 1A1 selectivity of 7.
Fig 6.

ALDH1A2 and 1A3 homology models provide rationale for isoform selectivity of Compound 7. (A) Val460 does not clash with o-methyl substituent of N-Phenyl in ALDH1A1- Compound 7 structure. (B, C) Docking poses of 7 in ALDH1A2 and ALDH1A3, respectively. Red arrow indicates that in both ALDH1A2 and A3, 2-methyl substituent at phenyl clashes with Leu477/471.
Des-methyl compound 11, which is active against all ALDH1A isoforms, docks well into the active site of all three ALDH1A proteins (Figure 7). For ALDH1A1, the 3-fluorobenzyl ring engages in pi-pi interactions with both Phe171 and Trp178. The bicyclic ring makes a pi-pi interaction with Tyr297 and van der Waals interactions with Gly458 and Tyr297, while the phenyl ring participates in van der Waals interactions with Val460 and Asn121. In the active site of ALDH1A2, the bicyclic ring forms pi-pi interaction with Phe314 and a van der Waals interaction with Asn475. The 3-fluorobenzyl ring makes a pi-pi interaction with Phe188 and van der Waals hydrophobic interactions with Trp195, while the phenyl ring engages in van der Waals hydrophobic interactions with Val138 and Leu477. In the case of ALDH1A3, the bicyclic ring of compound 11 makes a pi-pi interaction with Phe308 and a van der Waals interaction with Asn469. The 3-fluorobenzyl ring forms a pi-pi interaction with Phe182 and a van der Waals hydrophobic interaction with Trp189, while the phenyl ring makes van der Waals hydrophobic interactions with Ile132, Phe182 and Leu477.
Figure 7.

Compound 11 docks without clashes into the active sites of ALDH1A1, 1A2 and 1A3. (A) Structure and ligand interaction plot of Compound 11 docked into ALDH1A1 crystal structure. (B,C) Structure and ligand interaction plot of compound 11 docked into ALDH1A2, 1A3 homology models respectively.
When inhibitor 12g was docked, it adopted a similar pose to the crystal structure of the regioisomer 13g. The similar potency and isoform selectivity for these compounds is consistent with the relatively solvent exposed nature of the oxetane in both cases. The phenyl ring docks deep in the cavity and forms pi-pi interactions with Phe171 and Trp178 (1A1), Phe188(1A2), Phe182(1A3) and van der Waals interactions with Trp195(1A2), Trp189(1A3) as shown in Figure 8. The 3-fluorobenzyl ring makes van der Waals interactions with Val460 and Asn121 (1A1), Leu477 and Val138 (1A2), and Leu471 and Ile132(1A3). The bicyclic ring of 12g engages the same residues as 11 for the three isoforms. The predicted binding mode of Compound 13h (Supplementary Figure S7), which is also active against all three isoforms, is similar to that of 12g.
Figure 8.

Docking of compound 12g predicts a similar binding mode to the 13g crystal structure for ALDH1A1, 1A2, and 1A3. (A) Structure and ligand interaction plot of Compound 12g docked into ALDH1A1 crystal structure. (B,C) Structure and ligand interaction plot of compound 12g docked into ALDH1A2, 1A3 homology models respectively.
The modestly ALDH1A3 selective compound 15g, which has a methoxy group at the 4-position of the phenyl ring, is predicted to bind ALDH1A3 in a similar fashion to 7 (Figure 9). The positioning of the methoxy group near the ALDH1A3 specific residue Glu135, may explain the selectivity of 7 towards ALDH1A3. In contrast, ALDH1A1 bears Ala124 at this position which could not form a favorable polar contact with the methoxy.
Figure 9.

ALDH1A3 specific residue Glu135 may explain the observed selectivity of compound 15g. (A) 15g docked into the ALDH1A3 homology model. (B) Overlay of ALDH1A1 (pink) crystal structure with 15g docked in the 1A3 homology model (cyan).
Confirming activity in live cells
We next performed the ALDEFLUOR assay (Stem Cell Technologies) in PEO1 and OVCAR5 cells, to confirm ALDH inhibition in live cells (Figure 10A, B). Given the association between ALDH1A3 expression and the high grade serous histology we chose cell lines with high 1A3 activity (Supplementary Figure S8).24 PEO-1 is classified as a high grade serous ovarian cancer cell line.44 OVCAR5, a commonly used cell line originally classified as high grade serous ovarian, may be gastrointestinal in origin.45 The ALDH1A subfamily inhibitors 12g, 13g, and 13h all exhibited strong inhibition of ALDEFLUOR signal with significant activity in both cell lines at 1 μM and reductions of greater than 50% at 10 μM. While both compounds inhibited ALDEFLUOR to some extent, the 1A3 selective compound 15l was significantly better than 1A1 selective DEAB. The 1A2 selective inhibitor 15b showed little to no inhibition at 30 μM. Compound 15b is reasonably soluble and has a lower TPSA and molecular weight than the efficacious inhibitors, suggesting that this effect is indeed due to its isoform selectivity profile and not simply an inability to enter the cell. Despite having biochemical 1A3 IC50s (0.12–0.17 μM) that are very similar to 15l (0.18 μM), the inhibitors of all 3 ALDH1A isoforms, 12g, 13g, and 13h, were somewhat superior in the ALDEFLUOR assay (statistically significant differences at 3 μM are highlighted in Figures 10A and 10B). Although we cannot rule out variable cell penetration for the compounds as a potential cause, this may indicate that low levels of 1A1 and/or 1A2 expression in these cell lines slightly diminish the effective ALDEFLUOR inhibition of 1A3-selective 15l. Low levels of 1A1 and 1A2 mRNA were in fact detected in OVCAR5 but not PEO1 cells (Supplementary Figure S8).
Figure 10.

Compounds 15l, 12g, 13g, and 13h inhibit ALDH in cells and deplete cells bearing the putative CSC marker CD133. (A, B) Graphs showing changes in ALDEFLUOR activity in PEO1 (A) and OVCAR5 (B) cells following the specified treatment (N=3). (C, D) Graphs showing changes in the percent of CD133+ cells as determined by flow cytometry following 48 h drug treatment at the specified concentration (N=3–6) *p≤0.05, **p≤0.01, ***p≤0.0001.
In addition to ALDH, the surface glycoprotein CD133 has also been used as a marker of stemness in many cancers including ovarian cancer, and its expression is correlated with poorer patient outcomes in ovarian cancer.7, 46 Interestingly, treating PEO1 and OVCAR5 cells with inhibitors 12g, 13g, and 13h also elicited a dose dependent preferential reduction in the percentage of CD133+ cells (Figure 10C, D). The 1A1 selective DEAB was not effective in this assay, and the ALDH1A2 selective 15b had only a modest dose-independent effect. The 1A3 selective compound 15l depleted CD133+ cells at 30 μM, but had no effect at 10 μM.
Evaluation of synergy with Cisplatin
ALDH1A family members are known to play a role in resistance to multiple chemotherapy agents 47–50 and a reduction in their activity has been shown to restore sensitivity.16–22, 51–53 Therefore, we investigated the ability of our inhibitors with the best ALDEFLUOR activity to increase sensitivity to and potentially synergize with cisplatin in PEO1 and OVCAR5 cells. Using the Chou-Talalay method, we determined that 12g, 13g, and 13h are highly synergistic (Combination Index values <1 indicate synergy with smaller numbers indicating stronger synergy) with cisplatin (Fig. 11A, B, Supplemental Fig. S9).54 The observed synergy for 12g and 13g at 1 μM was already strong but it was improved by increasing the concentration of these compounds to 10 μM. While 12g and 13g alone did not show cytotoxicity at these doses, 13h did and, therefore, had to be tested at lower doses. Nonetheless, synergy with 13h was observed at concentrations as low as 0.3 μM. As a control, we included the ALDEFLUOR inactive 15b, which was somewhat synergistic but was overall the least effective compound, especially at the lower concentrations of cisplatin.
Figure 11.

Compounds 12g, 13g, and 13h synergistically enhance the effect of cisplatin on ovarian cancer cell lines and patient derived spheroids. (A, B) Representative heatmaps of combination indices for PEO1 (A) and OVCAR5 (B) cells cultured for 72 h in the presence of cisplatin and the indicated ALDH inhibitor at the concentrations shown. (N=3) (C) Normalized average viability as determined using Alamarblue dye following exposure to the specified compounds for 72 hours. (N=5–8) *p≤0.05, ****p≤0.0001 one way ANOVA compared to Control. Combination indices for the specified drug combinations calculated using CompuSyn software. (CI < 1 indicates synergy) (http://www.combosyn.com).54
We similarly evaluated synergy using primary patient derived samples in a 3-D tumor spheroid assay; a platform which mimics in vivo growth (Fig 11C).55–56 As 13h showed comparable synergy to 12g and 13g at 3-fold lower concentrations in the initial synergy studies, we tested this compound. Ovarian cancer spheroids, compared to 2D monolayer culture, are more resistant to standard therapies and express higher levels of ALDH1A1.20, 57 The sphereoids employed in this experiment express both 1A1 and 1A3 as determined by qRT-PCR (Supplementary Figure S10). Treatment of patient derived ovarian cancer spheroids with 0.3 μM 13h did not significantly reduce viability as monotherapy. However it was highly synergistic with all three concentrations of cisplatin tested (Fig 11C, Combination indices 0.08–0.27).54 Similar to our observations, Condello et al. report that concentrations of 4 below its ALDEFLUOR IC50 are able to potentiate the effects of cisplatin against ovarian cancer spheroids.20
In Vivo Murine Metabolic Stability
Given that 13g and 13h showed promising cellular activity and were the most stable in the presence of MLM among compounds tested, we assessed in vivo exposure following IP injection in mice (Table 6). Despite the two compounds having very similar MLM stability, the AUC for 13g was more than double that of 13h. Plasma concentration of 13g exceeded 1 μM, the concentration needed for 50% inhibition of ALDEFLUOR (Figure 10A,B), for nearly 7 hours. 13h exceeded 0.3 μM, an efficacious dose in the spheroid cisplatin synergy assay (Figure 11C), for almost 4 hours.
Table 6.
In Vivo exposure following IP injection in mice.
| Compound | Plasma Concentration (μM) | AUC0–7hobs | |||
|---|---|---|---|---|---|
| 0.5 h | 2 h | 4 h | 7 h | (hr·μM) | |
| 13g | 7.6 ± 0.8 | 5.2 ± 1.0 | 3.0 ± 1.3 | 0.9 ± 0.7 | 27.8 |
| 13h | 5.6 ± 0.2 | 2.6 ± 0.6 | 0.6 ± 0.2 | 0.1 ± 0.1 | 11 |
Compounds at the specified doses were administered by a single intraperitoneal injection of 10mg/kg to CD-1 mice. Values expressed as Mean ± S.D for 3 mice at each timepoint.
CONCLUSIONS
In order to explore the structural determinants of ALDH1A isoform selectivity, we generated a number of analogs of lead compound 7 guided by a co-crystal structure with 1A1. Expedient synthetic routes were developed to allow late-stage diversification at multiple sites. The observation that the ortho-methyl group on the N-phenyl was disfavorable to binding across the ALDH1A subfamily led to the first potent inhibitors of the three ALDH1A isoforms with excellent selectivity over ALDH2 (e.g. 12e). Small structural changes led to a new binding mode for compound 13g, explaining SAR trends which did not agree with the 1A1 crystal structure for lead compound 7. We demonstrated that remarkable changes in ALDH1A isoform-selectivity can be achieved by minor structural changes to the N-phenyl substituent, which binds in the narrow lipophilic region of the active site near the catalytic cysteine according to the 13g-1A1 structure. In the course of exploring SAR at this position we discovered the 1A2 selective compounds 15b and 15f, and the 1A3 selective compounds 15g and 15l. Although selectivity within the ALDH1A subfamily is modest, to our knowledge, these are the first examples of ALDH1A2 and ALDH1A3 selective inhibitors with excellent selectivity against ALDH2. Further efforts to create more potent and selective 1A2 and 1A3 inhibitors are underway.
Our preliminary data lead us to hypothesize that ALDEFLUOR activity will be improved by inhibiting multiple ALDH1A isoforms simultaneously as compared to an equipotent 1A3 selective compound (12g, 13g, 13h vs. 15l), even in cell lines which only express detectable levels of 1A3. This hypothesis will require more extensive cell testing to confirm our preliminary findings. Testing optimized compounds in an expanded panel of cell lines which express various ALDH1A isoforms will be necessary and is underway.
Interestingly 12g, 13g, and 13h depleted the CD133+ putative stem cell pool in a dose dependent manner, and synergized with cisplatin at a range of concentrations. 13h also showed synergy with cisplatin in patient derived ovarian cancer spheroids. Compound 13g furthermore shows promising PK properties for in Page 29 of 61 vivo studies, exceeding its efficacious cellular concentration in plasma for nearly 7 hours following 10mg/kg IP administration in a preliminary study. Xenograft studies on optimal compounds will be reported in due course. Future medicinal chemistry development of this series will focus on further improving enzymatic and cellular potency and pharmacokinetic properties, as well as tuning the selectivity profile among the ALDH1A isoforms in order to generate diverse probes for establishing the contribution of individual isoforms to cellular activity.
EXPERIMENTAL SECTION
Crystal Structure Determination
Crystals of ALDH1A1 N121S were grown by equilibrating 4–8 mg/mL ALDH1A1 N121S against 100 mM sodium BisTris, pH 6.2–6.5, 6–11% PEG3350, 200 mM NaCl, and 5–10 mM YbCl3. The crystal of ALDH1A1 N121S in complex with 7 was prepared by soaking approximately 2-week old apo crystals for 6 hr in crystallization solution containing 500 μM 7 with 1% (v/v) DMSO and 1 mM NAD. The crystal of ALDH1A1 N121S in complex with 13g was prepared by soaking apo crystals for 1 hr in crystallization solution containing 1 mM NAD followed by soaking overnight in crystallization solution containing 500 μM 13g with 2% (v/v) DMSO and 1 mM NAD. Cryoprotection for flash-freezing was 20% (v/v) ethylene glycol in ligand soaking solution. Diffraction data for 7 in complex with ALDH1A1 N121S was collected at Beamline 23-ID-D (GM/CA), National Institute of General Medicine Sciences and National Cancer Institute of the NIH at APS. Diffraction data for 13g in complex with ALDH1A1 N121S was collected at Beamline 19-ID operated by the Structural Biology Consortium at the Advance Photon Source (APS), Argonne National Laboratory. Diffraction data were indexed, integrated, and scaled using HKL3000.58 The CCP4 program suite was used for molecular replacement and refinement.59 The Coot molecular graphic application was used for model building.60 The TLSMD (translation/libration/screw motion determination) server was used to determine dynamic properties of ALDH1A1 N121S.61–62
Protein Purification and Enzymatic Assays
Human ALDH1A1, ALDH1A2, ALDH1A3, ALDH2, ALDH1B1, ALDH3A1, ALDH4A1, ALDH5A1 and rat ALDH1L1 were prepared and purified as previously described. 27, 63–66
Inhibition of ALDH activity by compounds and IC50 curves were determined by measuring the formation of NAD(P)H spectrophotometrically at 340 nm (molar extinction coefficient of 6200 M−1 cm−1) on the Beckman DU-640 and Spectramax 340PC spectrophotometers using purified recombinant enzyme. Reaction components for ALDH1A and ALDH2 assays consisted of 100–200 nM enzyme, 200 μM NAD+, 100 μM propionaldehyde, and 1% DMSO in 25 mM BES buffer, pH 7.5. For ALDH1B1, the assay included 500 μM NAD+ and 200μM propionaldehyde. For ALDH3A1, the assay included 300μM NADP+, 20nM enzyme, and 300μM benzaldehyde. For ALDH4A1 and ALDH5A1, the assay included 1.5mM NAD+, 100nM enzyme, with 20mM propionaldehyde for ALDH4A1 and 2mM propionaldehyde for ALDH5A1. For rat ALDH1L1, the assay included 0.5mM NADP+, 200nM enzyme ad 4mM propionaldehyde. All assays were performed at 25°C and were initiated by addition of substrate after a 2 min incubation period. IC50 curves were collected for compounds which substantially inhibited ALDH1A activity at 20 μM compound. Data were fit to the four parameter EC50 equation using SigmaPlot (v12) and the values represent the mean/SEM of three independent experiments (each n=3).
ALDEFLUOR assay
PEO1 and OVCAR5 cells were grown in RPMI 1640 media (Corning) containing 2mM glutamine, 2mM sodium pyruvate (PEO1 only, Gibco), 10% FBS (Sigma), and 1X Pen/Strep (Gibco). When the cells reached 80% confluency they were harvested by trypsinization and assayed for ALDH activity using the aldefluor assay (STEMCELL Technologies). Briefly, the cells were washed with PBS before being centrifuged and resuspended in ALDEFLUOR buffer. Once the cells were resuspended in ALDEFLUOR buffer, the ALDEFLUOR reagent was added. The cells were quickly mixed and evenly distributed into 1.5 mL Eppendorf tubes containing inhibitor or vehicle. The tubes were incubated for 30 minutes at 37 °C. Next, the tubes were centrifuged, the buffer containing the ALDEFLUOR reagent was removed, and the cells were resuspended in fresh ALDEFLUOR buffer that had been kept on ice. The tubes were kept on ice until they were analyzed on an Accuri C6 flow cytometer (BD). The percent of control values were calculated using the percentage of ALDEFLUOR positive cells for a particular sample and the percentage of ALDEFLUOR positive cells in the control sample (vehicle treated). The percentage of ALDEFLUOR positive cells was graphed in Prism 7 (GraphPad) and is displayed as mean ± SD. The Two-way ANOVA with Tukeys multiple comparison test within Prism 7 (GraphPad) was used to determine statistical significance between samples treated with compound or vehicle.
CD133+ cell assay
PEO1 and OVCAR5 cells were grown in RPMI 1640 media (Corning) containing 2mM glutamine, 2mM sodium pyruvate (PEO1 only, Gibco)10% FBS (Sigma), and 1X Pen/Strep (Gibco). When the cells reached 80% confluency they were harvested by trypsinization, washed with PBS, and reseeded in 6-well plates at 1 × 10⁵ cells/well. The cells were allowed to recover for 24 h, inhibitor or vehicle was added, and the cells were put back into the incubator for 48 h. Following the 48 h incubation, the cells were harvested and counted. An equal number of cells were isolated from each sample. The cells were washed with PBS and resuspended in fresh PBS. CD133/2-APC antibody (Miltenyi Biotec) was added at a dilution of 1:100. The cells were mixed and incubated at room temperature for 10 minutes. Next, ten times the volume of PBS was added and the cells were centrifuged. The cells were washed with PBS and resuspended in fresh PBS that had been kept on ice. The tubes were kept on ice until they could be analyzed on a Cytoflex S flow cytometer (BeckmanCoulter). The percentage of CD133 positive cells was graphed in Prism 7 (GraphPad) and is displayed as mean ± SD. The Two-way ANOVA with Tukeys multiple comparison test within Prism 7 (GraphPad) was used to determine statistical significance between samples treated with compound or vehicle.
Cell Viability and synergy assays
PEO1 and OVCAR5 cells were grown in RPMI 1640 media (Corning) containing 2mM glutamine, 2mM sodium pyruvate (PEO1 only, Gibco)10% FBS (Sigma), and 1X Pen/Strep (Gibco). When the cells reached 80% confluency they were harvested by trypsinization, washed with PBS, and reseeded in 96-well plates at 4000 cells/well (PEO1) or 1500 cells/well (OVCAR5). The cells were allowed to recover for 24 h, inhibitor or vehicle was added, cisplatin was added, and the cells were put back into the incubator for 72 h. Following the 72 h incubation, the media was removed and a 1X solution of Cell-Titer Glo 2.0 (Promega) was added. The plates were mixed and allowed to incubate at room temperature for 10 min before luminescence was read. Normalized viability was calculated by comparing the luminesence of drug-treated wells to vehicle treated wells and expressed as a percentage. The percentage of viable cells was graphed in Prism 7 and all data are displayed as mean ± SD. Synergy was assessed using Chou-Talalay method and the CompuSyn program. 54
Hanging drop culture for patient derived spheroid formation
Graded patient tumor samples (high grade epithelial stage IIIC or IV, obtained from IRB approved protocol, and collected from consented patients) were dissected, digested enzymatically using a mixture of Collagenase IV/Dispase, recovered by centrifugation and filtered through a 500μm mesh to remove large debris. Resulting patient cells were suspended in serum-free medium (SFM) supplemented with 5ng/ml FGF, 5ng/ml EGF, B27, 1X insulin-transferrin-selenium supplement, 1X nonessential amino acids, antibiotics and antimycotics. Cell counts were obtained using a hemocytometer and adjusted such that a 20μL volume contained 100 cells. Similar to previously established protocol, patient derived spheroids were initiated using 100 CD133+ ALDH+ cells per spheroid.55, 57, 67 Spheroids were maintained in SFM for a period of 10 days, and imaged using live phase contrast microscopy to follow spheroid formation and maintenance.
Drug treatment on patient derived spheroids in hanging drop array culture
Patient derived spheroids were initiated in 384-well hanging drop arrays using 100 cells per spheroid. Spheroids were allowed to aggregate and form a 3D microtissue over a period of 10 days. For drug treatment, a 10X stock of drug was prepared independently, and 2μL of drug was added to the 20μL hanging drop containing spheroids, to result in a final concentration of 1X. Several drug-dosing regimens were carried out, including cisplatin in the range of 1–50μM and ALDH inhibitor 13h in the range of 0.03–30μM.
The effect of drug was assayed on spheroids 72 hours, using the alamarBlue assay to determine viability after drug treatment. Control untreated spheroids were maintained for the same duration in culture. Cell viability after drug treatment was normalized to untreated controls, and quantified. At least 20 spheroids (technical replicates) were assayed per experiment, with 5 to 8 biological replicates. Drug-treated spheroids were imaged using phase-contrast microscopy to observe morphologic differences in spheroids exposed to drug compared with control untreated spheroids.
Metabolic activity in hanging drop ovarian cancer spheroids
AlamarBlue dye (Life Technologies, Carlsbad CA) was added in a 1:10 dilution to 100 cells/drop spheroids. Following 4 hours of alamarblue addition and incubation, the 384 hanging drop array was placed in a fluorescence plate reader (Synergy HT, BioTek Instruments, Winooski, VT). Alamarblue fluorescence readings were obtained at 530 nm excitation and 590 nm emission. To quantify viability within spheroids, alamarblue readings of treated as well untreated spheroids were obtained at Day 10, and compared to the untreated Control spheroids.
Statistical analysis
Drug viability data were determined and quantified using the alamarBlue assay, as outlined previously.55, 57 Briefly, normalized viability was calculated by comparing the alamarBlue fluorescence of drug-treated spheroids to control untreated spheroids and expressed as a percentage. Statistical analysis was performed using one-way ANOVAs and levels of statistical significance are indicated in the figures. All data are expressed as mean±SEM and are an average of at least 5 to 8 independent experiments.
Metabolic Stability in Mouse Liver Microsomes
The metabolic stability was assessed using CD-1 mouse liver microsomes. 1 μM of each compound was incubated with 0.5 mg/mL microsomes and 1.7 mM cofactor β-NADPH in 0.1 M phosphate buffer (pH = 7.4) containing 3.3 mM MgCl2 at 37 °C. The DMSO concentration was less than 0.1% in the final incubation system. At 0, 5, 10, 15, 30, 45, and 60 min of incubation, 40 μL of reaction mixture were taken out, and the reaction is quenched by adding 3-fold excess of cold acetonitrile containing 100 ng/mL of internal standard for quantification. The collected fractions were centrifuged at 15000rpm for 10 min to collect the supernatant for LC−MS/ MS analysis, from which the amount of compound remaining was determined. The natural log of the amount of compound remaining was plotted against time to determine the disappearance rate and the half-life of tested compounds.
Pharmacokinetic Studies in Mice
All animal experiments in this study were approved by the University of Michigan Committee on Use and Care of Animals and Unit for Laboratory Animal Medicine (ULAM). The abbreviated pharmacokinetics of compounds 13g and 13h were determined in female CD-1 mice following intraperitoneal (ip) injection of 10 mg/kg respectively. Compounds were dissolved in the vehicle containing 20% DMSO, 50% PEG-400, and 30% PBS. Four blood samples (50 μL) were collected over 7 h (at 0.5h, 2h, 4h, and 7h), centrifuged at 35 00 rpm for 10 min, and plasma was frozen at −80˚C for later analysis. Plasma concentrations of the compounds were determined by the LC−MS/MS method developed and validated for this study. The LC−MS/MS method consisted of a Shimadzu HPLC system, and chromatographic separation of tested compound which was achieved using a Waters Xbridge-C18 column (5 cm × 2.1 mm, 3.5 μm). An AB Sciex QTrap 4500 mass spectrometer equipped with an electrospray ionization source (ABI-Sciex, Toronto, Canada) in the positive-ion multiple reaction monitoring (MRM) mode was used for detection. All pharmacokinetic parameters were calculated by noncompartmental methods using WinNonlin, version 3.2 (Pharsight Corporation, Mountain View, CA, USA).
Molecular Modeling
Molecular modeling was performed on a Dell Precision T7400n Mini-Tower, Quad Core Xeon Proc X5450 dual processor with 32 nodes computer.
Homology Modeling
Homology models for ALDH1A2 and 1A3 were built on Swiss-Model Workspace (SMW) using ALDH1A1 PDB (PDB code 5TEI) as a template.68–69 The homology modeling on SMW can be briefly described as alignment of a target sequence and a template sequence using the “automated mode” since the similarity between ALDH1A isoforms are approximately 70%. The target/template alignment along with 3D coordinates of the template were used as input for generating an all-atom model for the target sequence using ProMod3, a comparative modelling engine. Side chains were remodeled using a backbone dependent rotamer library. Finally, the geometry of the resulting model was energy minimized by using the force field OpenMM.68–69
Global and per-residue quality of the model was assessed by the QMEAN scoring function, where several statistical potential terms, i.e., geometrical features of the model as well as each residue (pairwise atomic distances, torsion angles, solvent accessibility, etc.), are compared to statistical parameters obtained from experimental structures.68, 70 The local scores are linear combinations of the four statistical potential terms evaluated on a per residue basis. Each residue gets a score between 0 and 1, with 1 being the best. To assess the overall quality of the model, global QMEAN scores were calculated as a Z-score which compares the obtained values to scores calculated from a set of high-resolution X-ray structures. GMQE (Global Model Quality Estimation) is another global quality estimation which combines properties from the target-template alignment.70 The resulting GMQE score is between 0 and 1 and expresses the accuracy of a model built with that alignment and template. The quality of the model increases as the number approaches 1. Additionally, the model quality was evaluated by a Ramachandran plot within the PROCHECK server.71 PROCHECK assesses the stereo-chemical quality of a protein structure. A good quality model would be expected to have over 90% in the most favored regions.72
Molecular Docking
Molecular docking studies were performed using the HYBRID docking program from OpenEye Scientific, Santa Fe, NM against ALDH1A isoforms with co-crystal 7 (PDB code 5TEI) or 13g (PDB code 6DUM) as the reference ligands.73 Prior to docking, 500 different conformations were generated for each ligand using Omega (OpenEye Scientific, Santa Fe, NM), a systematic, knowledge-based conformer generator.74 HYBRID performs a systematic, exhaustive, non-stochastic examination of poses within the protein active site. However, HYBRID reduces this search space based on shape and chemical complementarity to reference bound ligands. It treats ligand conformers as rigid during the docking process, although ligand flexibility is implicitly included by docking multiple conformers of each ligand. The input for HYBRID is a protein structure and a multi-conformer representation of the ligand to be docked. In the exhaustive search using the Chemical Gaussian Overlay (CGO) scoring function, each ligand conformation is systematically rotated and translated within the active site at a resolution of 1 Å. Every pose that passes a bump check is scored.73
Chemistry
All reagents were used in the condition received from commercial sources. 1H NMR and 13C NMR were taken in CDCl3 or DMSO-d6 at room temperature on Varian Inova 400 or 500 MHz instruments. Reported chemical shifts are expressed in parts per million (ppm) on the δ scale from an internal standard of tetramethylsilane (0 ppm). Mass spectrometry data were obtained on either an Agilent TOF or Agilent Q-TOF. An Agilent 1100 series HPLC with an Agilent Zorbax Eclipse Plus−C18 column was used to determine purity of biologically tested compounds. All tested compounds were determined to be >95% pure using a 6 minute gradient of 10–90% acetonitrile in water followed by a 2 minute hold at 90% acetonitrile with detection at 254 nm. Flash chromatographic purifications were performed using a Teledyne ISCO Combiflash RF with Redisep Gold RF columns.
6-((3-Fluorobenzyl)thio)-5-(o-tolyl)-1H-pyrazolo[3,4-d]pyrimidin-4(5H)-one (7)
To a flask charged with potassium carbonate (1.56 g, 11.3 mmol), 9a (1.46 g, 5.7 mmol), and 10 mL DMF was added 3-fluorobenzyl bromide (0.69 mL, 5.7 mmol). After stirring under N2 for 16 h at RT the reaction was neutralized with sat. aq. NH4Cl and the mixture was diluted with water and extracted 2x with EtOAc. The combined organic portions were washed 3x with brine and then dried with sodium sulfate and the solvent removed. The crude was purified by flash (50% EtOAc in Hex) yielding the titled compound as a white solid (1.26g, 61% yield). HRMS (ESI): m/z 367.1022 [M+H]+. 1H NMR (500 MHz, CDCl3) δ 8.40 (br. s, 1H), 8.15 (s, 1H), 7.40 (t, J = 8.30 Hz, 1H), 7.34 (d, J = 7.83 Hz, 1H), 7.31 (t, J = 7.83 Hz, 1H), 7.21 (t, J = 7.80 Hz, 1H), 7.18 (d, J = 7.83 Hz, 1H), 7.07 (d, J = 7.34 Hz, 1H), 7.02 (d, J = 9.29 Hz, 1H), 6.90 (dt, J = 1.96, 8.56 Hz, 1H), 4.28 (d, J = 13.69 Hz, 1H), 4.31 (d, J = 13.69 Hz, 1H), 2.10 (s, 3H) 13C NMR (126 MHz, CDCl3) δ 162.59 (d, J = 246.5 Hz), 161.52, 157.71, 153.63, 138.25 (d, J = 7.5 Hz), 136.92, 135.62, 134.42, 131.40, 130.42, 130.01 (d, J = 8.2 Hz), 129.36, 127.37, 124.82 (d, J = 3.2 Hz), 116.08 (d, J = 21.9 Hz), 114.54 (d, J = 21.1 Hz), 102.86, 36.55, 17.28. HPLC Purity: 99%.
Method A: General Method for Synthesis of Pyrazolopyrimidinones 10a,b
A solution of the appropriate isothiocyanate (12.9 mmol), and ethyl 5-amino-1H-pyrazole-4-carboxylate (8a) (12.9 mmol) in 15 mL toluene was refluxed under N2 for 3 h. The thiourea intermediate, which precipitated upon cooling to RT, was collected and added to 10 mL 1N NaOH and refluxed for 3 h. The product was precipitated by the addition of concentrated HCl and collected by filtration.
6-Mercapto-5-(o-tolyl)-1H-pyrazolo[3,4-d]pyrimidin-4(5H)-one (10a)
Method A. White solid. 44% yield. 1H NMR (400 MHz, DMSO-d6) δ 13.77 (br. s., 1H), 13.41 (br. s., 1H), 8.57 (br. s., 1H), 7.19 – 7.31 (m, 3H), 7.09 (d, J = 5.87 Hz, 1H), 1.99 (s, 3H).
5-Phenyl-6-thioxo-6,7-dihydro-1H-pyrazolo[3,4-d]pyrimidin-4(5H)-one (10b)
Method A. White solid. 64% yield. 1H NMR (500 MHz, DMSO-d6) δ 13.73 (s, 1H), 13.37 (s, 1H), 8.58 (s, 1H), 7.44 (t, J = 7.6 Hz, 2H), 7.37 (t, J = 7.4 Hz, 1H), 7.20 (d, J = 7.7 Hz, 2H).
6-((3-Fluorobenzyl)thio)-5-phenyl-1H-pyrazolo[3,4-d]pyrimidin-4(5H)-one (11)
Starting from compound 9b the titled compound was synthesized and purified in a similar manner to compound 7 and obtained as a white solid. 69% yield. HRMS (ESI): m/z 353.0867 [M+H]+. 1H NMR (400 MHz, CDCl3) δ 12.54 (br. s., 1H), 8.08 (s, 1H), 7.47 (s, 3H), 7.30 (s, 2H), 7.14 – 7.22 (m, 1H), 7.06 (d, J = 7.83 Hz, 1H), 7.02 (d, J = 9.39 Hz, 1H), 6.89 (t, J = 8.60 Hz, 1H), 4.22 – 4.35 (m, 2H), 13C NMR (101 MHz, CDCl3) δ 162.46 (d, J = 246.6 Hz), 161.46, 158.34, 153.26, 138.12 (d, J = 7.6 Hz), 135.27, 135.13, 129.98, 129.91 (d, J = 9.0 Hz), 129.60, 129.27, 124.84 (d, J = 2.9 Hz), 116.07 (d, J = 21.8 Hz), 114.42 (d, J = 21.1 Hz), 102.73, 36.68. HPLC Purity: 99%.
Method B. General Method for Synthesis of N-alkylated Pyrazolopyrimidinones 12a-d, f-h, 13a-h
To a dry flask charged with 7 or 11 (0.27 mmol) and potassium carbonate (0.55 mmol) under N2 was added 2 mL DMF and the appropriate alkyl halide or mesylate (0.34 mmol) by syringe. The mixture was heated to 50 °C for 16 h at which point starting material was consumed by HPLC. The mixture was diluted with ethyl acetate and washed with water and 3x with brine. The organic portion was dried over sodium sulfate and the solvent removed. The regioisomers were separated by flash (EtOAc in Hex gradient). The 1-alkyl pyrazoles (12a-h) eluted more quickly than the 2-alkyl pyrazoles (13a-h). The alkylating reagents used are designated below for each compound. All were commercially available except for oxetan-3-ylmethyl methanesulfonate which was prepared as previously described.75
6-((3-Fluorobenzyl)thio)-1-methyl-5-(o-tolyl)-1H-pyrazolo[3,4-d]pyrimidin-4(5H)-one (12a)
Method B. Methyl iodide. White solid. 43% yield. HRMS (ESI): m/z 381.1179 [M+H]+ 1H NMR (400 MHz, DMSO-d6) δ 8.06 (s, 1H), 7.41 (dt, J = 1.20, 6.40 Hz, 2H), 7.31 – 7.38 (m, 2H), 7.23 – 7.31 (m, 3H), 7.06 (tt, J = 1.60, 8.60 Hz, 1H), 4.38 (d, J = 13.30 Hz, 1H), 4.43 (d, J = 13.30 Hz, 1H), 3.96 (s, 3H), 1.95 (s, 3H) 13C NMR (126 MHz, CDCl3) δ 162.63 (d, J = 246.5 Hz), 161.21, 157.07, 151.01, 138.62 (d, J = 7.4 Hz), 136.93, 135.40, 134.49, 131.41, 130.40, 130.01 (d, J = 8.4 Hz), 129.35, 127.37, 124.67 (d, J = 2.9 Hz), 116.05 (d, J = 22.0 Hz), 114.54 (d, J = 21.0 Hz), 102.86, 36.56 (d, J = 2.0 Hz), 34.09, 17.29. HPLC Purity: 97%.
1-(Cyclopropylmethyl)-6-((3-fluorobenzyl)thio)-5-(o-tolyl)-1H-pyrazolo[3,4-d]pyrimidin-4(5H)-one (12b)
Method B. Cyclopropylmethyl bromide. Colorless oil. 32% yield. HRMS (ESI): m/z 421.1493 [M+H]+ 1H NMR (500 MHz, CDCl3) δ 8.05 (s, 1H), 7.42 (t, J = 7.80 Hz, 1H), 7.31 – 7.39 (m, 2H), 7.21 – 7.28 (m, 1H), 7.17 (d, J = 7.34 Hz, 1H), 7.12 (d, J = 7.83 Hz, 1H), 7.07 (d, J = 9.78 Hz, 1H), 6.94 (dt, J = 2.20, 8.44 Hz, 1H), 4.32 (d, J = 13.69 Hz, 1H), 4.29 (d, J = 14.18 Hz, 1H), 4.19 (d, J = 7.20 Hz, 2H), 2.12 (s, 3H), 1.32 – 1.44 (m, 1H), 0.62 (td, J = 5.50, 7.80 Hz, 2H), 0.44 (dt, J = 4.80, 5.50 Hz, 2H) 13C NMR (126 MHz, CDCl3) δ 162.66 (d, J = 246.7 Hz), 160.99, 157.09, 150.50, 138.64 (d, J = 7.4 Hz), 136.96, 135.33, 134.53, 131.37, 130.36, 130.01 (d, J = 8.2 Hz), 129.34, 127.33, 124.45 (d, J = 2.7 Hz), 115.81 (d, J = 22.1 Hz), 114.47 (d, J = 21.0 Hz), 102.82, 52.05, 36.49 (d, J = 1.9 Hz), 17.33, 11.16, 3.97. HPLC Purity: 96%.
6-((3-Fluorobenzyl)thio)-1-(oxetan-3-yl)-5-(o-tolyl)-1H-pyrazolo[3,4-d]pyrimidin-4(5H)-one (12c)
Method B. 3-Bromooexetane. White solid. 18% yield. HRMS (ESI): m/z 423.1292 [M+H]+ 1H NMR (500 MHz, CDCl3) δ 8.14 (s, 1H), 7.41 – 7.46 (m, 1H), 7.32 – 7.39 (m, 2H), 7.24 – 7.29 (m, 1H), 7.11 – 7.17 (m, 2H), 7.06 – 7.10 (m, 1H), 6.95 (dt, J = 2.20, 8.44 Hz, 1H), 5.91 – 5.99 (m, 1H), 5.28 – 5.35 (m, 2H), 5.04 – 5.09 (m, 2H), 4.30 (d, J = 13.69 Hz, 1H), 4.34 (d, J = 13.69 Hz, 1H), 2.10 (s, 1H) 13C NMR (126 MHz, CDCl3) δ 162.71 (d, J = 246.9 Hz), 161.93, 156.91, 151.04, 138.31 (d, J = 7.6 Hz), 136.85, 136.37, 134.35, 131.51, 130.55, 130.10 (d, J = 8.4 Hz), 129.26, 127.47, 124.57 (d, J = 2.9 Hz), 115.92 (d, J = 22.0 Hz), 114.66 (d, J = 21.1 Hz), 103.38, 76.85, 50.69, 36.62, 17.32. HPLC Purity: 98%.
6-((3-Fluorobenzyl)thio)-1-(oxetan-3-ylmethyl)-5-(o-tolyl)-1H-pyrazolo[3,4-d]pyrimidin-4(5H)-one (12d)
Method B. Oxetan-3-ylmethyl methanesulfonate. White crystalline solid. 42% yield. HRMS (ESI): m/z 437.1449 [M+H]+ 1H NMR (500 MHz, CDCl3) δ 8.03 (s, 1H), 7.42 – 7.47 (m, 1H), 7.33 – 7.40 (m, 2H), 7.25 – 7.31 (m, 1H), 7.17 (d, J = 7.34 Hz, 1H), 7.14 (d, J = 7.34 Hz, 1H), 7.06 – 7.11 (m, 1H), 6.97 (dt, J = 2.45, 8.31 Hz, 1H), 4.86 (dt, J = 1.47, 7.09 Hz, 2H), 4.59 – 4.66 (m, 4H), 4.35 (d, J = 13.69 Hz, 1H), 4.31 (d, J = 14.18 Hz, 1H), 3.52 – 3.61 (m, 1H), 2.12 (s, 3H) 13C NMR (126 MHz, CDCl3) δ 162.68 (d, J = 246.7 Hz), 161.69, 156.89, 150.99, 138.43 (d, J = 7.5 Hz), 136.90, 135.82, 134.41, 131.44, 130.46, 130.08 (d, J = 8.2 Hz), 129.28, 127.40, 124.50 (d, J = 2.9 Hz), 115.86 (d, J = 22.0 Hz), 114.58 (d, J = 21.3 Hz), 102.85, 74.85, 74.77, 49.40, 36.64 (d, J = 1.9 Hz), 35.21, 17.32. HPLC Purity: 99%.
Method C. General Synthesis of substituted pyrazolothiopyrimidinones 12e, 15a-i from 14
To a dry flask under N2 charged with 14 (0.24 mmol) and 2 mL dry DMF was added the appropriate amine (0.24 mmol) by syringe. The reaction was stirred at RT for 1hr and then cooled to 0°C. 60 wt.% NaH in mineral oil(0.24 mmol) was added and the flask was stirred at 0C for 20min then allowed to warm to RT and stirred for 3 h. The flask was once again cooled to 0°C and 3-fluorobenzyl bromide (0.24 mmol) was added by syringe. The mixture was stirred at 0°C for 30 min at which point the reaction was complete by HPLC. The reaction was diluted with 10 mL water and extracted 2x with 10 mL EtOAc. The combined organic portion was washed 3x with brine, dried over sodium sulfate and the solvent removed. The crude product was purified by flash (0–100% EtOAc in Hexanes).
6-((3-Fluorobenzyl)thio)-1-methyl-5-phenyl-1H-pyrazolo[3,4-d]pyrimidin-4(5H)-one (12e)
Method C. White crystalline solid. 84 % yield. HRMS (ESI): m/z 367.1023 [M+H]+ 1H NMR (500 MHz, CDCl3) δ 8.03 (s, 1H), 7.47 – 7.58 (m, 3H), 7.22 – 7.30 (m, 3H), 7.13 (d, J = 7.83 Hz, 1H), 7.09 (d, J = 9.78 Hz, 1H), 6.95 (dt, J = 2.20, 8.44 Hz, 1H), 4.34 (s, 2H), 4.01 (s, 3H) 13C NMR (126 MHz, CDCl3) δ 162.67 (d, J = 246.6 Hz), 161.31, 157.68, 150.89, 138.47 (d, J = 7.4 Hz), 135.50, 135.42, 130.11, 130.06 (d, J = 8.3 Hz), 129.75, 129.36, 124.76 (d, J = 3.1 Hz), 116.15 (d, J = 21.9 Hz), 114.61 (d, J = 21.0 Hz), 102.95, 36.88, 34.12. HPLC Purity: 98%.
1-(Cyclopropylmethyl)-6-((3-fluorobenzyl)thio)-5-phenyl-1H-pyrazolo[3,4-d]pyrimidin-4(5H)-one (12f)
Method B. Cyclopropylmethyl bromide. White Solid. 47.7 % yield. HRMS (ESI): m/z 407.1335 [M+H]+ 1H NMR (400 MHz, CDCl3) δ 8.05 (s, 1H), 7.48 – 7.57 (m, 3H), 7.20 – 7.33 (m, 3H), 7.12 (d, J = 7.83 Hz, 1H), 7.08 (d, J = 9.39 Hz, 1H), 6.95 (t, J = 8.41 Hz, 1H), 4.31 (s, 2H), 4.19 (d, J = 7.04 Hz, 2H), 1.38 (s, 1H), 0.54 – 0.69 (m, 2H), 0.36 – 0.50 (m, 2H) 13C NMR (101 MHz, CDCl3) δ 162.69 (d, J = 246.7 Hz), 161.07, 157.71, 150.37, 138.46 (d, J = 7.6 Hz), 135.53, 135.35 (d, J = 3.7 Hz), 130.07, 130.05 (d, J = 8.1 Hz), 129.72, 129.35, 124.55 (d, J = 2.9 Hz), 115.92 (d, J = 21.9 Hz), 114.54 (d, J = 21.3 Hz), 102.91, 52.05, 36.82, 11.22, 3.98. HPLC Purity: 99%.
6-((3-Fluorobenzyl)thio)-1-(oxetan-3-yl)-5-phenyl-1H-pyrazolo[3,4-d]pyrimidin-4(5H)-one (12g)
Method B. 3-bromooexetane. White solid. 15.5 % yield. HRMS (ESI): m/z 409.1131 [M+H]+ 1H NMR (500 MHz, CDCl3) δ 8.13 (s, 1H), 7.50 – 7.57 (m, 3H), 7.21 – 7.31 (m, 3H), 7.12 (d, J = 7.83 Hz, 1H), 7.08 (d, J = 9.29 Hz, 1H), 6.92 – 6.99 (m, 1H), 5.94 (quin, J = 7.21 Hz, 1H), 5.30 (t, J = 6.36 Hz, 2H), 5.06 (t, J = 7.09 Hz, 2H), 4.33 (s, 2H) 13C NMR (126 MHz, CDCl3) δ 162.71 (d, J = 246.6 Hz), 161.98, 157.48, 150.90, 138.14 (d, J = 7.4 Hz), 136.33, 135.33, 130.22, 130.12 (d, J = 8.3 Hz), 129.82, 129.25, 124.64 (d, J = 2.9 Hz), 115.99 (d, J = 22.1 Hz), 114.69 (d, J = 21.1 Hz), 103.47, 76.81, 50.75, 36.91. HPLC Purity: 96%.
6-((3-Fluorobenzyl)thio)-1-(oxetan-3-ylmethyl)-5-phenyl-1H-pyrazolo[3,4-d]pyrimidin-4(5H)-one (12h)
Method B. Oxetan-3-ylmethyl methanesulfonate. White solid. 32.5 % yield. HRMS (ESI): m/z 423.1289 [M+H]+ 1H NMR (500 MHz, CDCl3) δ 8.00 (s, 1H), 7.48 – 7.56 (m, 3H), 7.23 – 7.31 (m, 3H), 7.14 (d, J = 7.83 Hz, 1H), 7.08 (d, J = 9.78 Hz, 1H), 6.92 – 6.98 (m, 1H), 4.83 (t, J = 7.09 Hz, 2H), 4.62 (d, J = 7.34 Hz, 2H), 4.60 (t, J = 6.10 Hz, 2H), 4.32 (s, 2H), 3.48 – 3.59 (m, 1H) 13C NMR (126 MHz, CDCl3) δ 162.59 (d, J = 246.6 Hz), 161.67, 157.39, 150.77, 138.22 (d, J = 7.6 Hz), 135.68, 135.34, 130.05, 130.2 (d, J = 7.6) 129.99, 129.67, 129.21, 124.51 (d, J = 3.0 Hz), 115.84 (d, J = 22.0 Hz), 114.52 (d, J = 21.0 Hz), 102.84, 74.67, 49.29, 36.85, 35.15. HPLC Purity: 99%.
6-((3-Fluorobenzyl)thio)-2-methyl-5-(o-tolyl)-2H-pyrazolo[3,4-d]pyrimidin-4(5H)-one (13a)
Method B. Methyl iodide. Colorless Oil. 27% yield. HRMS (ESI): m/z 381.1179 [M+H]+ 1H NMR (500 MHz, CDCl3) δ 8.03 (s, 1H), 7.40 (t, J = 7.58 Hz, 1H), 7.29 – 7.36 (m, 2H), 7.19 – 7.25 (m, 1H), 7.17 (d, J = 7.83 Hz, 1H), 7.13 (d, J = 7.83 Hz, 1H), 7.07 (d, J = 9.78 Hz, 1H), 6.91 (dt, J = 2.00, 8.30 Hz, 1H), 4.33 – 4.42 (m, 2H), 4.07 (s, 3H), 2.10 (s, 3H) 13C NMR (126 MHz, CDCl3) δ 162.61 (d, J = 246.1 Hz), 159.88, 158.40, 157.99, 138.73 (d, J = 7.4 Hz), 137.12, 134.53, 131.25, 130.26, 129.89 (d, J = 8.5 Hz), 129.59, 129.31, 127.20, 124.93 (d, J = 2.9 Hz), 116.09 (d, J = 21.6 Hz), 114.34 (d, J = 21.1 Hz), 104.89, 40.29, 36.60 (d, J = 2.1 Hz), 17.29. HPLC Purity: 99%.
2-(Cyclopropylmethyl)-6-((3-fluorobenzyl)thio)-5-(o-tolyl)-2H-pyrazolo[3,4-d]pyrimidin-4(5H)-one (13b)
Method B. Cyclopropylmethyl bromide. White Crystalline solid. 38% yield. HRMS (ESI): m/z 421.1492 [M+H]+ 1H NMR (500 MHz, CDCl3) δ 8.21 (s, 1H), 7.40 (t, J = 7.34 Hz, 1H), 7.28 – 7.36 (m, 2H), 7.19 – 7.25 (m, 1H), 7.17 (d, J = 7.83 Hz, 1H), 7.12 (d, J = 7.83 Hz, 1H), 7.06 (d, J = 9.78 Hz, 1H), 6.91 (t, J = 8.31 Hz, 1H), 4.41 (d, J = 14.18 Hz, 1H), 4.38 (d, J = 14.20 Hz, 1H), 4.13 (d, J = 6.85 Hz, 2H), 2.12 (s, 3H), 1.36 – 1.47 (m, 1H), 0.69 – 0.78 (m, 2H), 0.42 – 0.49 (m, 2H) 13C NMR (126 MHz, CDCl3) δ 162.58 (d, J = 246.2 Hz), 159.74, 158.16, 158.10, 138.60 (d, J = 7.3 Hz), 137.13, 134.55, 131.22, 130.21, 129.87 (d, J = 8.4 Hz), 129.58, 127.85, 127.17, 124.90 (d, J = 3.1 Hz), 116.08 (d, J = 21.9 Hz), 114.32 (d, J = 21.2 Hz), 104.54, 58.20, 36.64, 17.30, 10.71, 4.19. HPLC Purity: 97%.
6-((3-Fluorobenzyl)thio)-2-(oxetan-3-yl)-5-(o-tolyl)-2H-pyrazolo[3,4-d]pyrimidin-4(5H)-one (13c)
Method B. 3-Bromooexetane. White solid. 15% yield. HRMS (ESI): m/z 423.1295 [M+H]+ 1H NMR (500 MHz, CDCl3) δ 8.21 (s, 1H), 7.39 – 7.45 (m, 1H), 7.30 – 7.37 (m, 2H), 7.23 (dt, J = 5.87, 7.83 Hz, 1H), 7.15 – 7.19 (m, 1H), 7.12 (d, J = 7.83 Hz, 1H), 7.04 – 7.09 (m, 1H), 6.92 (dt, J = 1.96, 8.56 Hz, 1H), 5.53 – 5.62 (m, 1H), 5.23 (t, J = 6.60 Hz, 2H), 5.10 (t, J = 7.34 Hz, 2H), 4.38 – 4.46 (m, 2H), 2.11 (s, 3H) 13C NMR (126 MHz, CDCl3) δ 162.70 (d, J = 246.7 Hz), 160.89, 158.58, 157.91, 138.34 (d, J = 7.8 Hz), 137.11, 134.40, 131.36, 130.41, 130.00 (d, J = 8.2 Hz), 129.58, 128.09, 127.31, 124.97 (d, J = 3.2 Hz), 116.18 (d, J = 22.2 Hz), 114.51 (d, J = 21.0 Hz), 105.25, 76.81 (d, J = 2.7 Hz), 56.83, 36.87, 17.34. HPLC Purity: 96%.
6-((3-Fluorobenzyl)thio)-2-(oxetan-3-ylmethyl)-5-(o-tolyl)-2H-pyrazolo[3,4-d]pyrimidin-4(5H)-one (13d)
Method B. Oxetan-3-ylmethyl methanesulfonate. Colorless oil. 24.3 % yield. HRMS (ESI): m/z 437.1449 [M+H]+ 1H NMR (500 MHz, CDCl3) δ 8.07 (s, 1H), 7.38 – 7.44 (m, 1H), 7.29 – 7.37 (m, 2H), 7.22 (dt, J = 6.11, 7.95 Hz, 1H), 7.16 (d, J = 7.34 Hz, 1H), 7.10 (d, J = 7.83 Hz, 1H), 7.05 (dd, J = 1.96, 9.78 Hz, 1H), 6.91 (dt, J = 2.45, 8.31 Hz, 1H), 4.88 (t, J = 7.09 Hz, 2H), 4.59 (d, J = 7.83 Hz, 2H), 4.55 (t, J = 6.36 Hz, 2H), 4.35 – 4.43 (m, 2H), 3.62 – 3.71 (m, 1H), 2.11 (s, 3H) 13C NMR (126 MHz, CDCl3) δ 162.66 (d, J = 246.2 Hz), 160.42, 158.56, 157.96, 138.42 (d, J = 7.7 Hz), 137.13, 134.45, 131.32, 130.36, 129.96 (d, J = 8.3 Hz), 129.57, 128.70, 127.28, 124.95 (d, J = 2.6 Hz), 116.18 (d, J = 21.9 Hz), 114.45 (d, J = 21.1 Hz), 104.89, 74.48 (d, J = 2.7 Hz), 55.85, 36.79, 35.36, 17.35. HPLC Purity: 99%.
6-((3-Fluorobenzyl)thio)-2-methyl-5-phenyl-2H-pyrazolo[3,4-d]pyrimidin-4(5H)-one (13e)
Method B. Methyl Iodide. White solid. 24.0 % yield. HRMS (ESI): m/z 367.1021 [M+H]+ 1H NMR (500 MHz, CDCl3) δ 8.02 (s, 1H), 7.46 – 7.56 (m, 3H), 7.26 – 7.31 (m, 2H), 7.23 (q, J = 7.34 Hz, 1H), 7.14 (d, J = 7.83 Hz, 1H), 7.08 (d, J = 9.29 Hz, 1H), 6.92 (t, J = 8.07 Hz, 1H), 4.39 (s, 2H), 4.07 (s, 3H) 13C NMR (126 MHz, CDCl3) δ 162.64 (d, J = 246.3 Hz), 159.88, 158.52, 158.23, 138.61 (d, J = 7.6 Hz), 135.54, 129.91 (d, J = 8.3 Hz), 129.91, 129.57, 129.54, 129.25, 124.98 (d, J = 3.2 Hz), 116.17 (d, J = 21.9 Hz), 114.38 (d, J = 21.3 Hz), 104.95, 40.28, 36.90. HPLC Purity: 96%.
2-(Cyclopropylmethyl)-6-((3-fluorobenzyl)thio)-5-phenyl-2H-pyrazolo[3,4-d]pyrimidin-4(5H)-one (13f)
Method B. Cyclopropylmethyl bromide. White Solid. 36.8 % yield. HRMS (ESI): m/z 407.1334 [M+H]+ 1H NMR (400 MHz, CDCl3) δ 8.19 (s, 1H), 7.42 – 7.58 (m, 3H), 7.27 (d, J = 4.30 Hz, 2H), 7.16 – 7.24 (m, 1H), 7.11 (d, J = 7.43 Hz, 1H), 7.06 (d, J = 9.78 Hz, 1H), 6.90 (t, J = 8.41 Hz, 1H), 4.39 (s, 2H), 4.12 (d, J = 7.04 Hz, 2H), 1.34 – 1.49 (m, 1H), 0.72 (d, J = 7.83 Hz, 2H), 0.44 (d, J = 4.30 Hz, 2H) 13C NMR (101 MHz, CDCl3) δ 162.7, 159.8, 158.8, 158.0, 138.5, 135.6, 130.0, 129.9, 129.6, 129.6, 127.9, 125.0, 116.2, 114.4, 104.7, 58.3, 37.0, 10.5, 4.3. HPLC Purity: 99%.
6-((3-Fluorobenzyl)thio)-2-(oxetan-3-yl)-5-phenyl-2H-pyrazolo[3,4-d]pyrimidin-4(5H)-one (13g)
Method B. 3-bromooexetane. White solid. 21.6 % yield. HRMS (ESI): m/z 409.1130 [M+H]+ 1H NMR (500 MHz, CDCl3) δ 8.20 (s, 1H), 7.46 – 7.54 (m, 3H), 7.26 – 7.31 (m, 2H), 7.19 – 7.25 (m, 1H), 7.12 (d, J = 7.34 Hz, 1H), 7.06 (d, J = 9.78 Hz, 1H), 6.92 (dt, J = 1.71, 8.44 Hz, 1H), 5.56 (quin, J = 6.97 Hz, 1H), 5.21 (t, J = 6.60 Hz, 2H), 5.07 (t, J = 7.34 Hz, 2H), 4.42 (s, 2H) 13C NMR (126 MHz, CDCl3) δ 162.71 (d, J = 246.3 Hz), 160.83, 158.50, 158.42, 138.22 (d, J = 7.4 Hz), 135.42, 130.09, 130.02 (d, J = 6.8Hz), 129.68, 129.58, 128.18, 125.05 (d, J = 3.0 Hz), 116.26 (d, J = 21.9 Hz), 114.55 (d, J = 21.1 Hz), 105.26, 76.82, 56.81, 37.17. HPLC Purity: 96%.
6-((3-Fluorobenzyl)thio)-2-(oxetan-3-ylmethyl)-5-phenyl-2H-pyrazolo[3,4-d]pyrimidin-4(5H)-one (13h)
Method B. Oxetan-3-ylmethyl methanesulfonate. White solid. 22.5 % yield. HRMS (ESI): m/z 423.1286 [M+H]+ 1H NMR (500 MHz, CDCl3) δ 8.07 (s, 1H), 7.47 – 7.54 (m, 3H), 7.25 – 7.30 (m, 2H), 7.19 – 7.25 (m, 1H), 7.11 (d, J = 7.34 Hz, 1H), 7.05 (d, J = 9.29 Hz, 1H), 6.92 (dt, J = 1.47, 8.31 Hz, 1H), 4.86 (t, J = 7.09 Hz, 2H), 4.57 (d, J = 7.34 Hz, 2H), 4.54 (t, J = 6.11 Hz, 2H), 4.38 (s, 2H), 3.58 – 3.70 (m, 1H) 13C NMR (126 MHz, CDCl3) δ 162.63 (d, J = 246.5 Hz), 160.34, 158.48, 158.36, 138.26 (d, J = 7.5 Hz), 135.42, 129.98, 129.95 (d, J = 7.8 Hz), 129.59, 129.52, 128.68, 124.98 (d, J = 2.9 Hz), 116.21 (d, J = 21.9 Hz), 114.45 (d, J = 21.0 Hz), 104.90, 74.41, 55.76, 37.03, 35.31. HPLC Purity: 99%.
Ethyl 5-isothiocyanato-1-methyl-1H-pyrazole-4-carboxylate (14)
To a dry flask under N2 at 0°C charged with 60 wt.% NaH in mineral oil (296 mg, 7.39 mmol) and 8b (500 mg, 2.96 mmol) was added 10 mL THF. The mixture was stirred for 10 min at which point CS2 (1.8 mL, 29.6 mmol) was added by syringe. The mixture was allowed warm to room temperature then heated to 40°C and stirred for 3 h. After cooling the flask to 0°C, iodine was added portion-wise over 10 min. The mixture was stirred for 1 h at 0°C then 30 mL diethyl ether was added and the precipitate was filtered off. The filtrate was washed 3x with 1N HCl, 1x with brine and the organic portion was dried over sodium sulfate and the solvent removed yielding a reddish black solid. The crude product was purified by flash (0–30% EA in Hex) yielding the titled compound as a yellow solid (460 mg, 2.18 mmol, 74% yield). MS (ESI): m/z 212.0 [M+H]+ 1H NMR (400 MHz, CDCl3) δ 7.81 (s, 1H), 4.25 – 4.44 (m, 2H), 3.80 (s, 3H), 1.30 – 1.44 (m, 3H).
5-(2-Chlorophenyl)-6-((3-fluorobenzyl)thio)-1-methyl-1H-pyrazolo[3,4-d]pyrimidin-4(5H)-one (15a)
Method C. White crystalline solid. 83% yield. HRMS (ESI): m/z 401.0629 [M+H]+ 1H NMR (500 MHz, CDCl3) δ 8.04 (s, 1H), 7.58 (dd, J = 1.47, 7.83 Hz, 1H), 7.48 (dt, J = 1.71, 7.70 Hz, 1H), 7.43 (dt, J = 1.47, 7.58 Hz, 1H), 7.33 (d, J = 7.83 Hz, 1H), 7.23 – 7.30 (m, 1H), 7.15 (d, J = 7.34 Hz, 1H), 7.10 (d, J = 9.78 Hz, 1H), 6.95 (dt, J = 1.96, 8.31 Hz, 1H), 4.32 – 4.42 (m, 2H), 4.01 (s, 3H) 13C NMR (126 MHz, CDCl3) δ 162.67 (d, J = 246.8 Hz), 160.82, 156.77, 150.91, 138.29 (d, J = 7.3 Hz), 135.54, 133.78, 133.22, 131.56, 131.21, 130.73, 130.05 (d, J = 8.5 Hz), 128.07, 124.69 (d, J = 2.9 Hz), 116.07 (d, J = 22.1 Hz), 114.63 (d, J = 21.0 Hz), 102.72, 36.59, 34.15. HPLC Purity: 99%.
5-(3-Chlorophenyl)-6-((3-fluorobenzyl)thio)-1-methyl-1H-pyrazolo[3,4-d]pyrimidin-4(5H)-one (15b)
Method C. White crystalline solid. 44% yield. HRMS (ESI): m/z 401.0629 [M+H]+ 1H NMR (500 MHz, CDCl3) δ 8.03 (s, 1H), 7.51 (td, J = 1.60, 8.00 Hz, 1H), 7.47 (t, J = 8.00 Hz, 1H), 7.26 – 7.32 (m, 2H), 7.18 (td, J = 1.53, 7.70 Hz, 1H), 7.15 (d, J = 7.83 Hz, 1H), 7.11 (td, J = 2.08, 9.54 Hz, 1H), 6.98 (dt, J = 2.69, 8.44 Hz, 1H), 4.32 – 4.41 (m, 2H), 4.02 (s, 3H) 13C NMR (126 MHz, CDCl3) δ 162.70 (d, J = 246.8 Hz), 160.84, 157.42, 150.77, 138.20 (d, J = 7.6 Hz), 136.53, 135.47, 135.27, 130.66, 130.47, 130.15 (d, J = 8.1 Hz), 129.77, 127.77, 124.78 (d, J = 3.2 Hz), 116.19 (d, J = 21.7 Hz), 114.74 (d, J = 21.0 Hz), 102.80, 36.93, 34.18. HPLC Purity: 98%.
5-(4-Chlorophenyl)-6-((3-fluorobenzyl)thio)-1-methyl-1H-pyrazolo[3,4-d]pyrimidin-4(5H)-one (15c)
Method C. White crystalline solid. 44% yield. HRMS (ESI): m/z 401.0629 [M+H]+ 1H NMR (500 MHz, CDCl3) δ 8.02 (s, 1H), 7.49 (d, J = 8.31 Hz, 2H), 7.24 – 7.30 (m, 1H), 7.20 (d, J = 8.31 Hz, 2H), 7.13 (d, J = 7.34 Hz, 1H), 7.09 (d, J = 9.78 Hz, 1H), 6.96 (dt, J = 2.45, 8.31 Hz, 1H), 4.34 (s, 2H), 4.01 (s, 3H) 13C NMR (126 MHz, CDCl3) δ 162.69 (d, J = 246.7 Hz), 160.96, 157.53, 150.81, 138.22 (d, J = 7.6 Hz), 136.33, 135.44, 133.89, 130.75, 130.17, 130.11, 124.76 (d, J = 2.9 Hz), 116.16 (d, J = 22.1 Hz), 114.73 (d, J = 21.0 Hz), 102.81, 36.92, 34.16. HPLC Purity: 99%.
6-((3-Fluorobenzyl)thio)-5-(2-fluorophenyl)-1-methyl-1H-pyrazolo[3,4-d]pyrimidin-4(5H)-one (15d)
Method C. White crystalline solid. 70% yield. HRMS (ESI): m/z 385.0932 [M+H]+ 1H NMR (500 MHz, CDCl3) δ 8.03 (s, 1H), 7.57 – 7.49 (m, 1H), 7.36 – 7.20 (m, 4H), 7.14 (d, J = 7.6 Hz, 1H), 7.10 (d, J = 9.5 Hz, 1H), 6.96 (td, J = 8.4, 2.5 Hz, 1H), 4.40 (d, J = 13.7 Hz, 1H), 4.34 (d, J = 13.6 Hz, 1H), 4.01 (s, 3H). 13C NMR (126 MHz, CDCl3) δ 162.70 (d, J = 247.0 Hz), 161.09, 158.28 (d, J = 253.4 Hz), 156.94, 150.92, 138.20 (d, J = 7.6 Hz), 135.52, 132.33 (d, J = 8.0 Hz), 131.24, 130.12 (d, J = 8.5 Hz), 125.05 (d, J = 3.9 Hz), 124.75 (d, J = 3.1 Hz), 123.11 (d, J = 14.1 Hz), 117.03 (d, J = 19.5 Hz), 116.15 (d, J = 22.2 Hz), 114.71 (d, J = 21.0 Hz), 102.69, 36.73, 34.18. HPLC Purity: 98%.
6-((3-Fluorobenzyl)thio)-5-(2-methoxyphenyl)-1-methyl-1H-pyrazolo[3,4-d]pyrimidin-4(5H)-one (15e)
Method C. White crystalline solid. 19% yield. HRMS (ESI): m/z 397.1127 [M+H]+ (400 MHz, CDCl3) δ 8.02 (s, 1H), 7.49 (t, J = 8.02 Hz, 1H), 7.22 – 7.29 (m, 1H), 7.19 (d, J = 7.83 Hz, 1H), 7.02 – 7.16 (m, 4H), 6.94 (t, J = 8.22 Hz, 1H), 4.33 (s, 2H), 3.99 (s, 3H), 3.78 (s, 3H) 13C NMR (101 MHz, CDCl3) δ 162.64 (d, J = 246.3 Hz), 161.76, 157.31, 155.40, 151.04, 138.76 (d, J = 7.6 Hz), 135.39, 131.80, 130.64, 129.92 (d, J = 8.4 Hz), 124.70 (d, J = 2.9 Hz), 123.89, 121.08, 116.00 (d, J = 21.9 Hz), 114.44 (d, J = 21.0 Hz), 112.34, 102.95, 55.82, 36.48, 34.06. HPLC Purity: 99%.
6-((3-Fluorobenzyl)thio)-5-(3-methoxyphenyl)-1-methyl-1H-pyrazolo[3,4-d]pyrimidin-4(5H)-one (15f)
Method C. White Solid. 80% yield. HRMS (ESI): m/z 397.1125 [M+H]+ 1H NMR (400 MHz, CDCl3) δ 7.99 (s, 1H), 7.41 (t, J = 8.22 Hz, 1H), 7.21 – 7.30 (m, 1H), 7.07 – 7.17 (m, 2H), 7.04 (dd, J = 2.35, 8.22 Hz, 1H), 6.90 – 6.98 (m, 1H), 6.85 (dd, J = 0.78, 7.83 Hz, 1H), 6.80 (d, J = 1.96 Hz, 1H), 4.33 (s, 2H), 3.99 (s, 3H), 3.80 (s, 3H) 13C NMR (101 MHz, CDCl3) δ 162.55 (d, J = 246.6 Hz), 161.20, 160.39, 157.50, 150.73, 138.41 (d, J = 7.5 Hz), 136.38, 135.24, 130.29, 129.97 (d, J = 8.3 Hz), 124.72 (d, J = 3.0 Hz), 121.31, 116.06 (d, J = 21.8 Hz), 115.82, 114.83, 114.48 (d, J = 21.1 Hz), 102.79, 55.39, 36.74, 34.04. HPLC Purity: 97%.
6-((3-Fluorobenzyl)thio)-5-(4-methoxyphenyl)-1-methyl-1H-pyrazolo[3,4-d]pyrimidin-4(5H)-one (15g)
Method C. White needles. 47% yield. HRMS (ESI): m/z 397.1123 [M+H]+ 1H NMR (400 MHz, CDCl3) δ 8.01 (s, 1H), 7.22 – 7.30 (m, 1H), 7.07 – 7.19 (m, 4H), 6.98 – 7.04 (m, 2H), 6.95 (dt, J = 2.35, 8.41 Hz, 1H), 4.32 (s, 2H), 4.00 (s, 3H), 3.85 (s, 3H) 13C NMR (101 MHz, CDCl3) δ 162.64 (d, J = 246.4 Hz), 161.92, 160.63, 157.91, 150.86, 138.52 (d, J = 7.4 Hz), 135.38, 130.40, 130.00, 127.75, 124.76 (d, J = 2.7 Hz), 116.16 (d, J = 22.6 Hz), 114.96, 114.56 (d, J = 21.0 Hz), 102.91, 55.45, 36.93, 34.14. HPLC Purity: 96%.
6-((3-Fluorobenzyl)thio)-1-methyl-5-(pyridin-3-yl)-1H-pyrazolo[3,4-d]pyrimidin-4(5H)-one (15h)
Method C. White solid. 64 % yield. HRMS (ESI): m/z 368.0972 [M+H]+ (500 MHz, CDCl3) δ 8.72 (d, J = 4.40 Hz, 1H), 8.52 (s, 1H), 7.97 (s, 1H), 7.63 (d, J = 8.31 Hz, 1H), 7.45 (dd, J = 4.89, 7.83 Hz, 1H), 7.21 – 7.30 (m, 1H), 7.12 (d, J = 7.34 Hz, 1H), 7.07 (d, J = 9.78 Hz, 1H), 6.94 (t, J = 8.30 Hz, 1H), 4.37 (d, J = 14.18 Hz, 1H), 4.33 (d, J = 14.18 Hz, 1H), 4.00 (s, 3H) 13C NMR (126 MHz, CDCl3) δ 162.54 (d, J = 246.9 Hz), 160.65, 157.29, 150.83, 150.64, 150.08, 137.96 (d, J = 7.6 Hz), 137.13, 135.25, 132.31, 130.05 (d, J = 8.2 Hz), 124.66 (d, J = 3.2 Hz), 124.07, 116.02 (d, J = 21.9 Hz), 114.64 (d, J = 21.0 Hz), 102.54, 36.80, 34.09. HPLC Purity: 99%.
6-((3-Fluorobenzyl)thio)-1-methyl-5-(pyridin-4-yl)-1H-pyrazolo[3,4-d]pyrimidin-4(5H)-one (15i)
Method C. Off white solid. 62% yield. HRMS (ESI): m/z 368.0974 [M+H]+ 1H NMR (500 MHz, CDCl3) δ 8.82 (d, J = 4.89 Hz, 2H), 8.00 (s, 1H), 7.26 – 7.32 (m, 1H), 7.25 (d, J = 5.38 Hz, 2H), 7.13 (d, J = 7.83 Hz, 1H), 7.09 (d, J = 9.78 Hz, 1H), 6.96 (dt, J = 2.45, 8.31 Hz, 1H), 4.37 (s, 2H), 4.01 (s, 3H) 13C NMR (101 MHz, CDCl3) δ 162.48 (d, J = 246.8 Hz), 162.30, 159.50, 156.74, 151.49, 150.51, 143.30, 137.86 (d, J = 7.5 Hz), 135.19, 130.03 (d, J = 8.3 Hz), 124.62 (d, J = 3.0 Hz), 124.20, 115.96 (d, J = 22.1 Hz), 114.63 (d, J = 21.0 Hz), 102.45, 36.28, 34.06 (d, J = 4.9 Hz). HPLC Purity: 99%.
Method D. General Synthesis of substituted pyrazolothiopyrimidinones 15j-l from 14
To a dry flask under N2 charged with 14 (0.24 mmol) and 2 mL dry DMF was added the appropriate amine (0.24 mmol) by syringe. The reaction was stirred at RT for 1 h and then cooled to 0°C. 60 wt. % NaH in mineral oil (0.71 mmol) was added and the flask was stirred at 0°C for 20 min then allowed to warm to RT and stirred for 3 h. The reaction was quenched with sat. aq. NH4Cl and extracted 2x with ethyl acetate. The combined organics were dried with sodium sulfate and the solvent removed. The residue was dissolved in 2 mL DMF and 3-fluorobenzyl bromide (0.03 mL, 0.24 mmol), sodium bicarbonate (80 mg, 0.95 mmol) were added. The mixture was stirred at RT overnight at which point the reaction was complete by HPLC. The mixture was diluted with water and extracted 2x with EtOAc. The combined organics were washed 3x with brine, dried over sodium sulfate, and the solvent removed. The crude product was purified by flash chromatography (0–100% EtOAc in Hex) yielding the titled compounds.
6-((3-Fluorobenzyl)thio)-1-methyl-5-(pyridin-2-yl)-1H-pyrazolo[3,4-d]pyrimidin-4(5H)-one (15j)
Method D. White needles. 40% yield. HRMS (ESI): m/z 368.0977 [M+H]+ 1H NMR (500 MHz, CDCl3) δ 8.69 (dd, J = 1.47, 4.89 Hz, 1H), 8.03 (s, 1H), 7.92 (dt, J = 1.96, 7.58 Hz, 1H), 7.44 – 7.49 (m, 1H), 7.38 (d, J = 7.83 Hz, 1H), 7.21 – 7.29 (m, 1H), 7.13 (d, J = 7.83 Hz, 1H), 7.06 – 7.11 (m, 1H), 6.95 (dt, J = 2.20, 8.44 Hz, 1H), 4.38 (s, 2H), 4.01 (s, 3H) 13C NMR (126 MHz, CDCl3) δ 162.70 (d, J = 246.7 Hz), 160.19, 157.59, 150.88, 150.26, 149.38, 138.83, 138.17 (d, J = 7.6 Hz), 135.52, 130.10 (d, J = 8.5 Hz), 125.06, 124.86, 124.81 (d, J = 3.1 Hz), 116.19 (d, J = 22.0 Hz), 114.70 (d, J = 21.4 Hz), 102.96, 36.66, 34.18. HPLC Purity: 98%.
5-Benzyl-6-((3-fluorobenzyl)thio)-1-methyl-1H-pyrazolo[3,4-d]pyrimidin-4(5H)-one (15k)
Method D. White crystalline solid. 57% yield. HRMS (ESI): m/z 381.1180 [M+H]+ 1H NMR (500 MHz, CDCl3) δ 8.02 (s, 1H), 7.22 – 7.35 (m, 6H), 7.16 (d, J = 7.83 Hz, 1H), 7.11 (d, J = 9.78 Hz, 1H), 6.97 (t, J = 8.31 Hz, 1H), 5.36 (br. s., 2H), 4.43 (s, 2H), 3.96 (s, 3H) 13C NMR (126 MHz, CDCl3) δ 162.69 (d, J = 246.9 Hz), 160.36, 157.77, 150.44, 138.33 (d, J = 7.5 Hz), 135.33, 135.20, 130.09 (d, J = 8.3 Hz), 128.57, 127.67, 127.28, 124.70 (d, J = 3.1 Hz), 116.09 (d, J = 22.0 Hz), 114.70 (d, J = 21.0 Hz), 102.58, 46.60, 36.51, 33.97. HPLC Purity: 99%.
6-((3-Fluorobenzyl)thio)-1-methyl-5-phenethyl-1H-pyrazolo[3,4-d]pyrimidin-4(5H)-one (15l)
Method D. White Needles. 72% yield. HRMS (ESI): m/z 395.1341 [M+H]+ 1H NMR (500 MHz, CDCl3) δ 8.00 (s, 1H), 7.27 – 7.36 (m, 5H), 7.23 (t, J = 7.58 Hz, 2H), 7.17 (d, J = 9.78 Hz, 1H), 7.00 (dt, J = 2.20, 8.44 Hz, 1H), 4.48 (s, 2H), 4.24 – 4.31 (m, 2H), 3.96 (s, 3H), 2.97 – 3.04 (m, 2H) 13C NMR (126 MHz, CDCl3) δ 162.76 (d, J = 246.8 Hz), 159.65, 157.37, 150.47, 138.42 (d, J = 7.6 Hz), 137.64, 135.00, 130.18 (d, J = 8.3 Hz), 128.90, 128.65, 126.81, 124.76 (d, J = 2.9 Hz), 116.19 (d, J = 22.0 Hz), 114.78 (d, J = 21.2 Hz), 102.75, 45.68, 36.34, 34.23, 33.98. HPLC Purity: 99%.
6-((3-Fluorobenzyl)thio)-1,5-dimethyl-1H-pyrazolo[3,4-d]pyrimidin-4(5H)-one (15m)
Compound 14 (100mg, 0.47 mmol) was dissolved in 1 mL 8N methylamine in ethanol and stirred at RT for 1 h. The volatiles were removed and the residue was dissolved in 1 mL DMF to which sodium bicarbonate (80 mg, 0.947 mmol) and 3-fluorobenzyl bromide (70 μl, 0.57 mmol) were added. The reaction was stirred for 1 h at which point the product was precipitated out by the addition of water. The precipitate was collected by filtration, washed with water and then hexanes. The precipitate was then taken up in dichloromethane and dried with sodium sulfate. The solvent was removed to yield the titled compound as a white crystalline solid (122mg, 0.40 mmol, 85 % yield). HRMS (ESI): m/z 305.0864 [M+H]+ 1H NMR (500 MHz, CDCl3) δ 7.99 (s, 1H), 7.29 – 7.35 (m, 1H), 7.24 (d, J = 7.83 Hz, 1H), 7.19 (d, J = 9.78 Hz, 1H), 7.00 (dt, J = 2.45, 8.56 Hz, 1H), 4.49 (s, 2H), 3.96 (s, 3H), 3.55 (s, 3H) 13C NMR (126 MHz, CDCl3) δ 162.74 (d, J = 246.7 Hz), 160.32, 157.62, 150.46, 138.42 (d, J = 7.5 Hz), 134.95, 130.17 (d, J = 8.2 Hz), 124.75 (d, J = 2.9 Hz), 116.17 (d, J = 22.0 Hz), 114.77 (d, J = 21.0 Hz), 102.44, 36.28, 33.95, 29.70. HPLC Purity: 99%.
Supplementary Material
ACKNOWLEDGEMENTS
Results shown in this report are derived from work performed at Argonne National Laboratory, Structural Biology Center at the Advanced Photon Source. Argonne is operated by UChicago Argonne, LLC, for the U.S. Department of Energy, Office of Biological and Environmental Research under contract DE-AC02-06CH11357. This work was supported by grants from the Center for the Discovery of New Medicines, University of Michigan (RJB), the Michigan Ovarian Cancer Alliance (GM), the Rivkin Center for Ovarian Cancer (GM), NIH R01 CA214567-01 (SDL and RJB), and DOD OCRP Early Career Investigator Award W81XWH-13-1-0134 (GM).
ABBREVIATIONS USED
- ALDH
aldehyde dehydrogenase
- ATRA
all-trans retinoic acid
- CI
combination index
- CSC
cancer stem cell
- DEAB
diethylamino benzoic acid
- EOC
epithelial ovarian cancer
- EtOAc
ethyl acetate
- FACS
fluorescence-activated cell sorting
- FBS
fetal bovine serum
- Hex
Hexanes
- NCS
isothiocyanate
- MLM
mouse liver microsomes
- SEM
standard error of the mean
- SFM
serum free medium
Footnotes
Disclosure of financial interests: The authors declare no competing financial interest.
Supporting Information:
Additional information regarding the reversible inhibition assay, inhibition of the N121S mutant used for crystallography, crystallographic data collection and refinement, electron density maps, validation of ALDH1A2 and 1A3 homology models, additional docking studies, and additional cytotoxicity data, and ALDH expression for cell lines. (PDF)
Molecular Formula Strings (CSV)
Coordinates for ALDH1A2 and ALDH1A3 homology models (PDB)
Accession Codes:
Atomic coordinates of ALDH1A1 bound to compounds 7 (PDB code 5TEI), 13g (PDB code 5WDV) have been deposited with the Protein Data Bank. The authors will release the atomic coordinates and experimental data upon article publication.
REFERENCES
- 1.Cancer Facts & Figures. American Cancer Society 2015. [Google Scholar]
- 2.Ozols RF; Bundy BN; Greer BE; Fowler JM; Clarke-Pearson D; Burger RA; Mannel RS; DeGeest K; Hartenbach EM; Baergen R Phase III Trial of Carboplatin and Paclitaxel Compared With Cisplatin and Paclitaxel in Patients With Optimally Resected Stage III Ovarian Cancer: A Gynecologic Oncology Group Study. Journal of Clinical Oncology 2003, 21 (17), 3194–3200. [DOI] [PubMed] [Google Scholar]
- 3.Thigpen T; duBois A; McAlpine J; DiSaia P; Fujiwara K; Hoskins W; Kristensen G; Mannel R; Markman M; Pfisterer J; Quinn M; Reed N; Swart AM; Berek J; Colombo N; Freyer G; Gallardo D; Plante M; Poveda A; Rubinstein L; Bacon M; Kitchener H; Stuart GC First-line Therapy in Ovarian Cancer Trials. Int J Gynecol Cancer 2011, 21 (4), 756–762. [DOI] [PubMed] [Google Scholar]
- 4.Cannistra SA Cancer of the Ovary. New England Journal of Medicine 2004, 351 (24), 2519–2529. [DOI] [PubMed] [Google Scholar]
- 5.Landen CN Jr.; Goodman B; Katre AA; Steg AD; Nick AM; Stone RL; Miller LD; Mejia PV; Jennings NB; Gershenson DM; Bast RC Jr.; Coleman RL; Lopez-Berestein G; Sood AK Targeting Aldehyde Dehydrogenase Cancer Stem Cells in Ovarian Cancer. Mol Cancer Ther 2010, 9 (12), 3186–3199. [DOI] [PMC free article] [PubMed] [Google Scholar]
- 6.Steg AD; Bevis KS; Katre AA; Ziebarth A; Dobbin ZC; Alvarez RD; Zhang K; Conner M; Landen CN, Stem Cell Pathways Contribute to Clinical Chemoresistance in Ovarian Cancer. Clin Cancer Res February 1, 2012, pp 869–881. [DOI] [PMC free article] [PubMed] [Google Scholar]
- 7.Silva IA; Bai S; McLean K; Yang K; Griffith K; Thomas D; Ginestier C; Johnston C; Kueck A; Reynolds RK; Wicha MS; Buckanovich RJ Aldehyde Dehydrogenase in Combination with CD133 Defines Angiogenic Ovarian Cancer Stem Cells that Portend Poor Patient Survival. Cancer Res 2011, 71 (11), 3991–4001. [DOI] [PMC free article] [PubMed] [Google Scholar]
- 8.Choi Y-J; Ingram PN; Yang K; Coffman L; Iyengar M; Bai S; Thomas DG; Yoon E; Buckanovich RJ Identifying an Ovarian Cancer Cell Hierarchy Regulated by Bone Morphogenetic Protein 2. Proceedings of the National Academy of Sciences 2015, 112 (50), E6882–E6888. [DOI] [PMC free article] [PubMed] [Google Scholar]
- 9.Yoshida GJ; Saya H Therapeutic Strategies Targeting Cancer Stem Cells. Cancer Sci 2016, 107 (1), 5–11. [DOI] [PMC free article] [PubMed] [Google Scholar]
- 10.Kryczek I; Liu S; Roh M; Vatan L; Szeliga W; Wei S; Banerjee M; Mao Y; Kotarski J; Wicha MS; Liu R; Zou W Expression of Aldehyde Dehydrogenase and CD133 Defines Ovarian Cancer Stem Cells. Int J Cancer 2011, 130 (1), 29–39. [DOI] [PMC free article] [PubMed] [Google Scholar]
- 11.Deng S; Yang X; Lassus H; Liang S; Kaur S; Ye Q; Li C; Wang LP; Roby KF; Orsulic S; Connolly DC; Zhang Y; Montone K; Butzow R; Coukos G; Zhang L Distinct Expression Levels and Patterns of Stem Cell Marker, Aldehyde Dehydrogenase Isoform 1 (ALDH1), in Human Epithelial Cancers. PLoS ONE 2010, 5 (4), e10277. [DOI] [PMC free article] [PubMed] [Google Scholar]
- 12.Pal D; Kolluru V; Chandrasekaran B; Baby BV; Aman M; Suman S; Sirimulla S; Sanders MA; Alatassi H; Ankem MK; Damodaran C Targeting Aberrant Expression of Notch-1 in ALDH(+) Cancer Stem Cells in Breast Cancer. Mol Carcinog 2017, 56 (3), 1127–1136. [DOI] [PMC free article] [PubMed] [Google Scholar]
- 13.Koppaka V; Thompson DC; Chen Y; Ellermann M; Nicolaou KC; Juvonen RO; Petersen D; Deitrich RA; Hurley TD; Vasiliou V Aldehyde Dehydrogenase Inhibitors: a Comprehensive Review of the Pharmacology, Mechanism of Action, Substrate Specificity, and Clinical Application. Pharmacological Reviews 2012, 64 (3), 520–539. [DOI] [PMC free article] [PubMed] [Google Scholar]
- 14.Xu X; Chai S; Wang P; Zhang C; Yang Y; Wang K Aldehyde Dehydrogenases and Cancer Stem Cells. Cancer Lett 2015, 369 (1), 50–57. [DOI] [PubMed] [Google Scholar]
- 15.Pors K; Moreb JS Aldehyde Dehydrogenases in Cancer: an Opportunity for Biomarker and Drug Development? Drug Discovery Today 2014, 19 (12), 1953–1963. [DOI] [PubMed] [Google Scholar]
- 16.Moreb JS; Baker HV; Chang LJ; Amaya M; Lopez MC; Ostmark B; Chou W ALDH Isozymes Downregulation Affects Cell Growth, Cell Motility and Gene Expression in Lung Cancer Cells. Mol Cancer 2008, 7, 87. [DOI] [PMC free article] [PubMed] [Google Scholar]
- 17.Luo Y; Dallaglio K; Chen Y; Robinson WA; Robinson SE; McCarter MD; Wang J; Gonzalez R; Thompson DC; Norris DA; Roop DR; Vasiliou V; Fujita M ALDH1A Isozymes are Markers of Human Melanoma Stem Cells and Potential Therapeutic Targets. Stem Cells 2012, 30 (10), 2100–2113. [DOI] [PMC free article] [PubMed] [Google Scholar]
- 18.Li Z; Xiang Y; Xiang L; Xiao Y; Li F; Hao P ALDH Maintains the Stemness of Lung Adenoma Stem Cells by Suppressing the Notch/CDK2/CCNE Pathway. PLoS One 2014, 9 (3), e92669. [DOI] [PMC free article] [PubMed] [Google Scholar]
- 19.Duong HQ; Hwang JS; Kim HJ; Kang HJ; Seong YS; Bae I Aldehyde Dehydrogenase 1A1 Confers Intrinsic and Acquired Resistance to Gemcitabine in Human Pancreatic Adenocarcinoma MIA PaCa-2 Cells. Int J Oncol 2012, 41 (3), 855–861. [DOI] [PMC free article] [PubMed] [Google Scholar]
- 20.Condello S; Morgan CA; Nagdas S; Cao L; Turek J; Hurley TD; Matei D Beta-Catenin-Regulated ALDH1A1 is a Target in Ovarian Cancer Spheroids. Oncogene 2015, 34 (18), 2297–2308. [DOI] [PMC free article] [PubMed] [Google Scholar]
- 21.Yokoyama Y; Zhu H; Lee JH; Kossenkov AV; Wu SY; Wickramasinghe JM; Yin X; Palozola KC; Gardini A; Showe LC; Zaret KS; Liu Q; Speicher D; Conejo-Garcia JR; Bradner JE; Zhang Z; Sood AK; Ordog T; Bitler BG; Zhang R BET Inhibitors Suppress ALDH Activity by Targeting ALDH1A1 Super-Enhancer in Ovarian Cancer. Cancer Res 2016, 76 (21), 6320–6330. [DOI] [PMC free article] [PubMed] [Google Scholar]
- 22.Chen MH; Weng JJ; Cheng CT; Wu RC; Huang SC; Wu CE; Chung YH; Liu CY; Chang MH; Chiang KC; Yeh TS; Su Y; Yeh CN ALDH1A3, the Major Aldehyde Dehydrogenase Isoform in Human Cholangiocarcinoma Cells, Affects Prognosis and Gemcitabine Resistance in Cholangiocarcinoma Patients. Clin Cancer Res 2016, 22 (16), 4225–4235. [DOI] [PubMed] [Google Scholar]
- 23.Cortes-Dericks L; Froment L; Boesch R; Schmid RA; Karoubi G Cisplatin-Resistant Cells in Malignant Pleural Mesothelioma Cell Lines Show ALDH(high)CD44(+) Phenotype and Sphere-Forming Capacity. BMC cancer 2014, 14, 304. [DOI] [PMC free article] [PubMed] [Google Scholar]
- 24.Saw Y-T; Yang J; Ng S-K; Liu S; Singh S; Singh M; Welch WR; Tsuda H; Fong W-P; Thompson D; Vasiliou V; Berkowitz RS; Ng S-W Characterization of Aldehyde Dehydrogenase Isozymes in Ovarian Cancer Tissues and Sphere Cultures. BMC cancer 2012, 12 (1), 329. [DOI] [PMC free article] [PubMed] [Google Scholar]
- 25.Bowtell DD; Böhm S; Ahmed AA; Aspuria P-J; Bast RC Jr; Beral V; Berek JS; Birrer MJ; Blagden S; Bookman MA; Brenton JD; Chiappinelli KB; Martins FC; Coukos G; Drapkin R; Edmondson R; Fotopoulou C; Gabra H; Galon J; Gourley C; Heong V; Huntsman DG; Iwanicki M; Karlan BY; Kaye A; Lengyel E; Levine DA; Lu KH; McNeish IA; Menon U; Narod SA; Nelson BH; Nephew KP; Pharoah P; Powell DJ Jr; Ramos P; Romero IL; Scott CL; Sood AK; Stronach EA; Balkwill FR Rethinking Ovarian Cancer II: Reducing Mortality From High-grade Serous Ovarian Cancer. Nature Reviews Cancer 2015, 15, 668. [DOI] [PMC free article] [PubMed] [Google Scholar]
- 26.Yasgar A; Titus SA; Wang Y; Danchik C; Yang S-M; Vasiliou V; Jadhav A; Maloney DJ; Simeonov A; Martinez NJ Correction: A High-Content Assay Enables the Automated Screening and Identification of Small Molecules with Specific ALDH1A1-Inhibitory Activity. PLOS ONE 2018, 13 (5), e0197292. [DOI] [PMC free article] [PubMed] [Google Scholar]
- 27.Morgan CA; Parajuli B; Buchman CD; Dria K; Hurley TDN,N-Diethylaminobenzaldehyde (DEAB) as a Substrate and Mechanism-Based Inhibitor for Human ALDH Isoenzymes. Chemico-Biological Interactions 2015, 234 (0), 18–28. [DOI] [PMC free article] [PubMed] [Google Scholar]
- 28.Croker AK; Allan AL Inhibition of Aldehyde Dehydrogenase (ALDH) Activity Reduces Chemotherapy and Radiation Resistance of Stem-Like ALDHhiCD44+ Human Breast Cancer Cells. Breast Cancer Research and Treatment 2012, 133 (1), 75–87. [DOI] [PubMed] [Google Scholar]
- 29.Liu P; Brown S; Goktug T; Channathodiyil P; Kannappan V; Hugnot JP; Guichet PO; Bian X; Armesilla AL; Darling JL; Wang W Cytotoxic Effect of Disulfiram/Copper on Human Glioblastoma Cell Lines and ALDH-Positive Cancer-Stem-Like Cells. Br J Cancer 2012, 107 (9), 1488–1497. [DOI] [PMC free article] [PubMed] [Google Scholar]
- 30.Nechushtan H; Hamamreh Y; Nidal S; Gotfried M; Baron A; Shalev YI; Nisman B; Peretz T; Peylan-Ramu N A Phase IIb Trial Assessing the Addition of Disulfiram to Chemotherapy for the Treatment of Metastatic Non-Small Cell Lung Cancer. Oncologist 2015, 20 (4), 366–367. [DOI] [PMC free article] [PubMed] [Google Scholar]
- 31.Skrott Z; Mistrik M; Andersen KK; Friis S; Majera D; Gursky J; Ozdian T; Bartkova J; Turi Z; Moudry P; Kraus M; Michalova M; Vaclavkova J; Dzubak P; Vrobel I; Pouckova P; Sedlacek J; Miklovicova A; Kutt A; Li J; Mattova J; Driessen C; Dou QP; Olsen J; Hajduch M; Cvek B; Deshaies RJ; Bartek J Alcohol-Abuse Drug Disulfiram Targets Cancer Via p97 Segregase Adaptor NPL4. Nature 2017, 552, 194. [DOI] [PMC free article] [PubMed] [Google Scholar]
- 32.Arnold SL; Kent T; Hogarth CA; Schlatt S; Prasad B; Haenisch M; Walsh T; Muller CH; Griswold MD; Amory JK; Isoherranen N Importance of ALDH1A Enzymes in Determining Human Testicular Retinoic Acid Concentrations. J Lipid Res 2015, 56 (2), 342–357. [DOI] [PMC free article] [PubMed] [Google Scholar]
- 33.Oster G; Kilburn KH; Siegal FP Chemically Induced Congenital Thymic Dysgenesis in the Rat: a Model of the DiGeorge Syndrome. Clin Immunol Immunopathol 1983, 28 (1), 128–134. [DOI] [PubMed] [Google Scholar]
- 34.Morgan CA; Hurley TD Development of a High-Throughput In Vitro Assay to Identify Selective Inhibitors for Human ALDH1A1. Chemico-Biological Interactions 2015, 234 (0), 29–37. [DOI] [PMC free article] [PubMed] [Google Scholar]
- 35.Morgan CA; Hurley TD Characterization of Two Distinct Structural Classes of Selective Aldehyde Dehydrogenase 1A1 Inhibitors. J Med Chem 2015, 58 (4), 1964–1975. [DOI] [PMC free article] [PubMed] [Google Scholar]
- 36.Yang SM; Yasgar A; Miller B; Lal-Nag M; Brimacombe K; Hu X; Sun H; Wang A; Xu X; Nguyen K; Oppermann U; Ferrer M; Vasiliou V; Simeonov A; Jadhav A; Maloney DJ Discovery of NCT-501, a Potent and Selective Theophylline-Based Inhibitor of Aldehyde Dehydrogenase 1A1 (ALDH1A1). J Med Chem 2015, 58 (15), 5967–5978. [DOI] [PMC free article] [PubMed] [Google Scholar]
- 37.Yang SM; Martinez NJ; Yasgar A; Danchik C; Johansson C; Wang Y; Baljinnyam B; Wang AQ; Xu X; Shah P; Cheff D; Wang XS; Roth J; Lal-Nag M; Dunford JE; Oppermann U; Vasiliou V; Simeonov A; Jadhav A; Maloney DJ Discovery of Orally Bioavailable, Quinoline-Based Aldehyde Dehydrogenase 1A1 (ALDH1A1) Inhibitors with Potent Cellular Activity. J Med Chem 2018, 61 (11), 4883–4903. [DOI] [PMC free article] [PubMed] [Google Scholar]
- 38.Liu J; Mao L; Wang X; Xu X; Zhao L Pyrazolopyrimidine Derivatives and Uses as Anticancer Agents. WO2012097196A1, 2012.
- 39.Guccione S; Russo F; Raffaelli A; Barretta GU; Pucci S; Scolaro LM Potential of Alkyl Orthoformates as Alkylating Agents of Non-Electron Rich Nitrogen Heterocycles. Journal of Heterocyclic Chemistry 1995, 32 (4), 1149–1158. [Google Scholar]
- 40.Nath J; Ghosh H; Yella R; Patel BK Molecular Iodine Mediated Preparation of Isothiocyanates from Dithiocarbamic Acid Salts. European Journal of Organic Chemistry 2009, 2009 (12), 1849–1851. [Google Scholar]
- 41.Kinzler K; Nilbert M; Su L; Vogelstein B; Bryan T; Levy D; Smith K; Preisinger A; Hedge P; McKechnie D Identification of FAP Locus Genes from Chromosome 5q21. Science 1991, 253 (5020), 661–665. [DOI] [PubMed] [Google Scholar]
- 42.MarvinSketch Calculator Plugins were used for ADME predictions, Marvin 15.6.15, 2015, ChemAxon http://www.chemaxon.com (accessed: 06/05/2018).
- 43.Chen Y; Zhu JY; Hong KH; Mikles DC; Georg GI; Goldstein AS; Amory JK; Schonbrunn E Structural Basis of ALDH1A2 Inhibition by Irreversible and Reversible Small Molecule Inhibitors. ACS chemical biology 2018, 13 (3), 582–590. [DOI] [PMC free article] [PubMed] [Google Scholar]
- 44.Beaufort CM; Helmijr JCA; Piskorz AM; Hoogstraat M; Ruigrok-Ritstier K; Besselink N; Murtaza M; van Ijcken WFJ; Heine AAJ; Smid M; Koudijs MJ; Brenton JD; Berns EMJJ; Helleman J Ovarian Cancer Cell Line Panel (OCCP): Clinical Importance of In Vitro Morphological Subtypes. PLOS ONE 2014, 9 (9), e103988. [DOI] [PMC free article] [PubMed] [Google Scholar]
- 45.Blayney JK; Davison T; McCabe N; Walker S; Keating K; Delaney T; Greenan C; Williams AR; McCluggage WG; Capes-Davis A; Harkin DP; Gourley C; Kennedy RD Prior Knowledge Transfer Across Transcriptional Data Sets and Technologies Using Compositional Statistics Yields New Mislabelled Ovarian Cell Line. Nucleic Acids Res 2016, 44 (17), e137. [DOI] [PMC free article] [PubMed] [Google Scholar]
- 46.Zhou Q; Chen A; Song H; Tao J; Yang H; Zuo M Prognostic Value of Cancer Stem Cell Marker CD133 in Ovarian Cancer: a Meta-Analysis. International Journal of Clinical and Experimental Medicine 2015, 8 (3), 3080–3088. [PMC free article] [PubMed] [Google Scholar]
- 47.Okita K; Matsumura Y; Sato Y; Okada A; Morizane A; Okamoto S; Hong H; Nakagawa M; Tanabe K; Tezuka K; Shibata T; Kunisada T; Takahashi M; Takahashi J; Saji H; Yamanaka S A More Efficient Method to Generate Integration-Free Human iPS Cells. Nature methods 2011, 8 (5), 409–412. [DOI] [PubMed] [Google Scholar]
- 48.Bretz N; Noske A; Keller S; Erbe-Hofmann N; Schlange T; Salnikov AV; Moldenhauer G; Kristiansen G; Altevogt P CD24 Promotes Tumor Cell Invasion by Suppressing Tissue Factor Pathway Inhibitor-2 (TFPI-2) in a c-Src-Dependent Fashion. Clin Exp Metastasis 2012, 29 (1), 27–38. [DOI] [PubMed] [Google Scholar]
- 49.Dylla SJ; Beviglia L; Park IK; Chartier C; Raval J; Ngan L; Pickell K; Aguilar J; Lazetic S; Smith-Berdan S; Clarke MF; Hoey T; Lewicki J; Gurney AL Colorectal Cancer Stem Cells are Enriched in Xenogeneic Tumors Following Chemotherapy. PLoS ONE 2008, 3 (6), e2428. [DOI] [PMC free article] [PubMed] [Google Scholar]
- 50.Wheeler AR; Throndset WR; Whelan RJ; Leach AM; Zare RN; Liao YH; Farrell K; Manger ID; Daridon A Microfluidic Device for Single-Cell Analysis. Analytical chemistry 2003, 75 (14), 3581–3586. [DOI] [PubMed] [Google Scholar]
- 51.Canino C; Luo Y; Marcato P; Blandino G; Pass HI; Cioce M A STAT3-NFkB/DDIT3/CEBPβ Axis Modulates ALDH1A3 Expression in Chemoresistant Cell Subpopulations. Oncotarget 2015, 6 (14), 12637–12653. [DOI] [PMC free article] [PubMed] [Google Scholar]
- 52.Golubovskaya V; O’Brien S; Ho B; Heffler M; Conroy J; Hu Q; Wang D; Liu S; Cance WG Down-Regulation of ALDH1A3, CD44 or MDR1 Sensitizes Resistant Cancer Cells to FAK Autophosphorylation Inhibitor Y15. Journal of cancer research and clinical oncology 2015, 141 (9), 1613–1631. [DOI] [PMC free article] [PubMed] [Google Scholar]
- 53.Raha D; Wilson TR; Peng J; Peterson D; Yue P; Evangelista M; Wilson C; Merchant M; Settleman J The Cancer Stem Cell Marker Aldehyde Dehydrogenase is Required to Maintain a Drug-Tolerant Tumor Cell Subpopulation. Cancer Res 2014, 74 (13), 3579–3590. [DOI] [PubMed] [Google Scholar]
- 54.Chou TC; Talalay P Quantitative Analysis of Dose-Effect Relationships: the Combined Effects of Multiple Drugs or Enzyme Inhibitors. Adv Enzyme Regul 1984, 22, 27–55. [DOI] [PubMed] [Google Scholar]
- 55.Raghavan S; Ward MR; Rowley KR; Wold RM; Takayama S; Buckanovich RJ; Mehta G Formation of Stable Small Cell Number Three-Dimensional Ovarian Cancer Spheroids Using Hanging Drop Arrays for Preclinical Drug Sensitivity Assays. Gynecologic Oncology 2015, 138 (1), 181–189. [DOI] [PMC free article] [PubMed] [Google Scholar]
- 56.Shield K; Ackland ML; Ahmed N; Rice GE Multicellular Spheroids in Ovarian Cancer Metastases: Biology and Pathology. Gynecologic Oncology 2009, 113 (1), 143–148. [DOI] [PubMed] [Google Scholar]
- 57.Raghavan S; Mehta P; Ward MR; Bregenzer ME; Fleck EMA; Tan L; McLean K; Buckanovich RJ; Mehta G Personalized Medicine-Based Approach to Model Patterns of Chemoresistance and Tumor Recurrence Using Ovarian Cancer Stem Cell Spheroids. Clin Cancer Res 2017, 23 (22), 6934–6945. [DOI] [PMC free article] [PubMed] [Google Scholar]
- 58.Otwinowski Z; Minor W Processing of X-ray Diffraction Data Collected in Oscillation Mode. Methods Enzymol 1997, 276, 307–326. [DOI] [PubMed] [Google Scholar]
- 59.The CCP4 Suite: Programs for Protein Crystallography. Acta Crystallogr D Biol Crystallogr 1994, 50 (Pt 5), 760–763. [DOI] [PubMed] [Google Scholar]
- 60.Emsley P; Cowtan K Coot: Model-Building Tools for Molecular Graphics. Acta Crystallogr D Biol Crystallogr 2004, 60 (Pt 12 Pt 1), 2126–2132. [DOI] [PubMed] [Google Scholar]
- 61.Painter J; Merritt EA Optimal Description of a Protein Structure in Terms of Multiple Groups Undergoing TLS Motion. Acta Crystallogr D Biol Crystallogr 2006, 62 (Pt 4), 439–450. [DOI] [PubMed] [Google Scholar]
- 62.Painter J; Merritt EA A Molecular Viewer for the Analysis of TLS Rigid-Body Motion in Macromolecules. Acta Crystallogr D Biol Crystallogr 2005, 61 (Pt 4), 465–471. [DOI] [PubMed] [Google Scholar]
- 63.Hammen PK; Allali-Hassani A; Hallenga K; Hurley TD; Weiner H Multiple Conformations of NAD and NADH when Bound to Human Cytosolic and Mitochondrial Aldehyde Dehydrogenase. Biochemistry 2002, 41 (22), 7156–7168. [DOI] [PubMed] [Google Scholar]
- 64.Parajuli B; Kimble-Hill AC; Khanna M; Ivanova Y; Meroueh S; Hurley TD Discovery of Novel Regulators of Aldehyde Dehydrogenase Isoenzymes. Chem Biol Interact 2011, 191 (1–3), 153–158. [DOI] [PMC free article] [PubMed] [Google Scholar]
- 65.Parajuli B; Georgiadis TM; Fishel ML; Hurley TD Development of Selective Inhibitors for Human Aldehyde Dehydrogenase 3A1 (ALDH3A1) for the Enhancement of Cyclophosphamide Cytotoxicity. Chembiochem 2014, 15 (5), 701–712. [DOI] [PMC free article] [PubMed] [Google Scholar]
- 66.Buchman CD; Hurley TD Inhibition of the Aldehyde Dehydrogenase ½ Family by Psoralen and Coumarin Derivatives. J Med Chem 2017, 60 (6), 2439–2455. [DOI] [PMC free article] [PubMed] [Google Scholar]
- 67.Raghavan S; Mehta P; Horst EN; Ward MR; Rowley KR; Mehta G; Raghavan S; Mehta P; Horst EN; Ward MR; Rowley KR; Mehta G Comparative Analysis of Tumor Spheroid Generation Techniques for Differential In Vitro Drug Toxicity. Oncotarget 2016, 7 (13), 16948–16961. [DOI] [PMC free article] [PubMed] [Google Scholar]
- 68.Biasini M; Bienert S; Waterhouse A; Arnold K; Studer G; Schmidt T; Kiefer F; Gallo Cassarino T; Bertoni M; Bordoli L; Schwede T SWISS-MODEL: Modelling Protein Tertiary and Quaternary Structure Using Evolutionary Information. Nucleic Acids Res 2014, 42 (Web Server issue), W252–258. [DOI] [PMC free article] [PubMed] [Google Scholar]
- 69.Arnold K; Bordoli L; Kopp J; Schwede T The SWISS-MODEL Workspace: a Web-Based Environment for Protein Structure Homology Modelling. Bioinformatics 2006, 22 (2), 195–201. [DOI] [PubMed] [Google Scholar]
- 70.Benkert P; Biasini M; Schwede T Toward the Estimation of the Absolute Quality of Individual Protein Structure Models. Bioinformatics 2011, 27 (3), 343–350. [DOI] [PMC free article] [PubMed] [Google Scholar]
- 71.Walther C; Guenet JL; Simon D; Deutsch U; Jostes B; Goulding MD; Plachov D; Balling R; Gruss P Pax: a Murine Multigene Family of Paired Box-Containing Genes. Genomics 1991, 11 (2), 424–434. [DOI] [PubMed] [Google Scholar]
- 72.Laskowski RA; MacArthur MW; Moss DS; Thornton JM PROCHECK - a Program to Check the Stereochemical Quality of Protein Structures. J. App. Cryst 1993, 26, 283–291. [Google Scholar]
- 73.McGann M FRED and HYBRID Docking Performance on Standardized Datasets. J Comput Aided Mol Des 2012, 26 (8), 897–906. [DOI] [PubMed] [Google Scholar]
- 74.Hawkins PC; Skillman AG; Warren GL; Ellingson BA; Stahl MT Conformer Generation with OMEGA: Algorithm and Validation Using High Quality Structures from the Protein Databank and Cambridge Structural Database. J Chem Inf Model 2010, 50 (4), 572–584. [DOI] [PMC free article] [PubMed] [Google Scholar]
- 75.Kehler J; Rasmussen LK; Jessing M Triazolopyrazinones as PDE1 Inhibitors. Patent: WO2016055618 A1 2016.
Associated Data
This section collects any data citations, data availability statements, or supplementary materials included in this article.