

Abstract
Recently, Weber et al. published a thorough investigation of the age-dependency of oxidative stress (OS) determined by the steady state concentrations of different compounds - oxidation products and antioxidants - that are in common use as biomarkers of OS in 2207 healthy individuals of the cross-sectional MARK-AGE Project. The correlations among biomarkers were significant but weak. These findings may indicate different manifestations of OS and must further be evaluated. Here, we report a refined analysis of OS based on the above-mentioned original data. We show that malondialdehyde (MDA) appears to be sensitive to both gender and age. It is significantly lower and shows a greater age-dependence in women than in men. The age-dependency of MDA in women arises in a stepwise fashion. The age-dependent slope of the steady state concentration is maximal at the age between 50 and 55 years, indicating that it may be attributed to the change of metabolism in the post-menopause. Interestingly, total glutathione (GSH) decreased with age simultaneously with the increase in MDA.
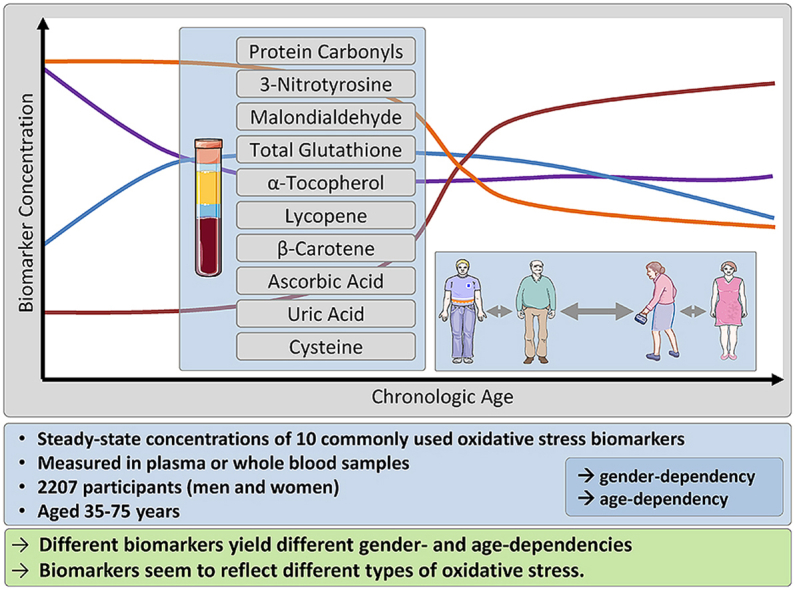
Different biomarkers yield different gender- and age-dependencies. Unlike the concentration of MDA, the concentrations of the other two oxidation products, i.e. protein carbonyls and 3-nitrotyrosine were similar in men and women and appeared to be independent of age in the healthy study population. The analyzed antioxidants exhibited different gender- and age-dependencies. In conclusion, it appears that all the biomarkers assessed here reflect different types of OS and that MDA and GSH reflect the same type of OS.
Keywords: Oxidative stress, Age-dependency, Gender-associated differences, Biomarkers
Graphical abstract
Highlights
-
•
Analysis of 10 biomarkers in 2207 healthy men and women of the MARK-AGE Project.
-
•
Different oxidative stress biomarkers yield different gender- and age-dependencies.
-
•
Different types of oxidative stress seem to exist.
-
•
Malondialdehyde and glutathione seem to be of the same type of oxidative stress.
Abbreviations
- (D-)ROM
(derivatives of) reactive oxygen metabolites
- GSH
(total) glutathione
- MDA
malondialdehyde
- NT
3-nitrotyrosine
- OS
oxidative stress
- PC
protein carbonyls
- ROS
reactive oxygen species
- T2DM
Type 2 Diabetes mellitus
- UA
uric acid
1. Introduction
Human desire to live forever in good health drew tremendous interest in Harman's free radical theory of aging [1] and later on in the age-dependency of “oxidative stress” (OS), a term introduced originally to describe the concept that excess of pro-oxidative compounds over antioxidants is associated with many diseases [2,3]. Accordingly, a common approach is to evaluate OS and treat people under high OS with antioxidants [[4], [5], [6]]. Only recently, the physiological importance of the normal redox state and the complex mechanisms of its control have been appreciated [7]. Unfortunately, measured OS values for the same biomarkers determined by different analysis methods are not similar [8]. Quantitation in terms of a universal criterion therefore seems impossible and categorizing people as being under “OS” is problematic, being dependent not only on the method of its evaluation.
The most commonly used biomarkers for OS are lipid peroxidation products, particularly hydroperoxides and aldehydes. Steady state concentrations of low molecular weight antioxidants are difficult to interpret in terms of OS, whereas the activity of antioxidative enzymes is more reliable and being used more frequently [9]. The steady state redox status of a person, as evaluated based on concentrations of one of the many different biomarkers, may reflect different manifestations of the well-defined factor OS. However, under such conditions, we would expect that the results obtained by different biomarkers correlate with each other. We therefore proposed that the lack of such correlations probably reflects the existence of different types of OS that differ either in their mechanisms or in their induction [8,10]. Given the very large number of reactive (oxygen) species (ROS) and the huge differences in their reactivity towards different targets [11,12], the concentration of a single biomarker alone cannot be used to evaluate the overall capacity of an individual to resist oxidative damage [10].
This communication presents refined analyses of the recent investigation on the age-dependency of OS in a large cohort of middle-aged subjects enrolled in the cross-sectional MARK-AGE Project. This consortium, funded by the European Commission, already yielded better understanding of OS, based on different biomarkers measured in one large age-stratified cohort [[13], [14], [15], [16], [17], [18], [19], [20], [21]].
Relating to the age-dependency of OS, the authors determined the steady state concentrations of various compounds, oxidation products and antioxidants that are often used as biomarkers of OS. Most biomarkers correlated significantly (p < 0.05) with almost all other biomarkers but the correlations were rather weak (r < 0.3) [10].
Our working hypothesis was that there is a gender-specific age-dependency of OS biomarkers and, that this heterogeneity is at least partially caused by the different types of OS (i.e. sources, targets, reactivity, and stability). Accordingly, we analyzed the steady state concentrations of redox biomarkers as functions of age for both men and women, separately.
2. Methods
This work described has been carried out in accordance with Declaration of Helsinki. Informed consent was obtained for experimentation with human subjects. The study was approved by the respective ethics committee of each recruiting center (for details see Refs. [14,16]). The MARK-AGE Project included 2207 participants recruited from the general population in an age- and gender-stratified manner. In these analyses we included a total of 1139 women and 1068 men between the ages of 35–75 years. Participants were from Germany, Belgium, Poland, Greece, Austria, Italy and Finland. Steady state concentrations of the various biomarkers have been determined and published by Weber et al. [13]. Details on analytical methods and sample preparation have been described elsewhere [13,20].
The 10 biomarkers described in this study were cysteine (μM) and total glutathione (GSH, μM) measured in whole blood, ascorbic acid (mg/l), lycopene (μM), β-carotene (μM), α-tocopherol (μM), uric acid (UA, mg/l), MDA (μM), protein carbonyls (PC, nmol/mg) and 3-nitrotyrosine (3NT, pmol/mg) all analyzed in plasma. Since the biomarkers were not normally distributed, they were transformed as follows to achieve normal distribution for all statistical analyses: square-root for cysteine, GSH, ascorbic acid, lycopene, uric acid, MDA and NT; logarithmic for β-carotene and α-tocopherol and inverse for PC.
Demographic characteristics (Table 1) were described using geometric means and 95% confidence intervals for continuous variables (age (years)), body mass index (BMI (kg/m2)) and frequencies (%) for categorical variables (gender, current smoker (yes/no)). Dietary information consisted of self-reported frequencies (food frequency questionnaire (FFQ)) for food items (fruit, vegetables, French fries, and meat): ≥2/day, 1/day, 4–6/week, 1–3/week, 1–3/month, and never.
Table 1.
Comparison of geometric means (95% confidence intervals) of participant's characteristics and different OS indices in women and men.
| Women (n = 1139) | Men (n = 1068) | p-value | |
|---|---|---|---|
| Age (years) | 55.2 (11.3) | 55.4 (11.4) | 0.642 |
| BMI (kg/m2) | 25.6 (5.07) | 26.8 (3.78) | <0.001 |
| Current smoker % (n) | 15 (178) | 21.5 (230) | <0.001 |
| Cysteine (μM) | 142.17 (140.31; 144.04) | 135.30 (133.30; 137.31) | <0.001 |
| Total GSH (μM) | 1090.5 (1079.4; 1101.8) | 1108.8 (1096.9; 1120.9) | 0.029 |
| Ascorbic Acid (mg/l) | 5.023 (4.823; 5.226) | 3.634 (3.466; 3.805) | <0.001 |
| Lycopene (μM) | 0.673 (0.652; 0.695) | 0.708 (0.683; 0.734) | 0.039 |
| β-Carotene (μM) | 0.645 (0.622; 0.668) | 0.451 (0.433; 0.469) | <0.001 |
| α-Tocopherol (μM) | 28.31 (27.88; 28.74) | 27.34 (26.92; 27.76) | 0.002 |
| Uric Acid (mg/l) | 39.00 (38.44; 39.56) | 50.65 (50.00; 51.30) | <0.001 |
| MDA (μM) | 0.284 (0.273; 0.295) | 0.330 (0.318; 0.342) | <0.001 |
| Protein Carbonyls (nmol/mg) | 0.580 (0.576; 0.585) | 0.582 (0.577; 0.587) | 0.659 |
| 3-Nitrotyrosine (pmol/mg) | 3.967 (3.814; 4.123) | 3.853 (3.709; 3.999) | 0.294 |
Significant differences are marked in bold.
Mean biomarker concentrations and age-dependencies were assessed in men and women separately. Differences in continuous variables and biomarker concentrations between women and men were determined by t-test/post-hoc and Chi-square test were used for differences in categorical variables.
Age and gender as predictors for biomarkers (Table 2) were assessed in linear regression analyses with biomarker concentrations as dependent variables (Model 1) and age and gender as independent variables (enter mode) showing the regression coefficient β for gender (age-adjusted), and age (gender-adjusted). In a second, multiple-factor adjusted model (Model 2) age, gender, BMI, current smoking status, self-reported frequency of consumption of fruit, vegetables, French fries and meat were applied as independent variables, again showing the regression coefficient β for gender and age separately.
Table 2.
Age and gender as predictors for biomarkers.
| Model 1 |
Model 2 |
Estimated Geometric Mean (95% CI)c |
|||||
|---|---|---|---|---|---|---|---|
| Beta (95%CI) | p-value | Beta (95%CI) | p-value | women | men | ||
| Cysteine (μM) | Male (=1)a | −0.299 (−0.411; 0.186) | 0.000 | −0.293 (−0.411; −0.176) | 0.000 | 142.3 (140.3; 144.2) | 135.3 (133.3; 137.2) |
| Age (yrs)b | 0.030 (0.025; 0.035) | 0.000 | 0.029 (0.023; 0.034) | 0.000 | |||
| Total GSH (μM) | Male (=1)a | −0.004 (−0.024; 0.015) | 0.659 | 0.295 (0.038; 0.553) | 0.025 | 1090 (1078; 1101) | 1110 (1098; 1122.) |
| Age (yrs)b | −0.744 (−1.471; −0.018) | 0.045 | −0.006 (−0.017; 0.006) | 0.319 | |||
| Ascorbic Acid (mg/l) | Male (=1)a | −0.335 (−0.398; −0.272) | 0.000 | −0.246 (−0.309; −0.183) | 0.000 | 4.831 (4.646; 5.021) | 3.810 (3.641; 3.985) |
| Age (yrs)b | 0.001 (−0.002; 0.004) | 0.549 | 0.000 (−0.003; 0.003) | 0.967 | |||
| Lycopene (μM) | Male (=1)a | 0.022 (0.003; 0.041) | 0.023 | 0.034 (0.014; 0.053) | 0.001 | 0.663 (0.640; 0.684) | 0.721 (0.697; 0.744) |
| Age (yrs)b | −0.006 (−0.007; −0.005) | 0.000 | −0.005 (−0.006; −0.004) | 0.000 | |||
| β-Carotene (μM) | Male (=1)a | −0.357 (−0.303; −0.411) | 0.000 | −0.202 (−0.153; −0.251) | 0.000 | 0.264 (0.231; 0.300) | 0.514 (0.466; 0.564) |
| Age (yrs)b | −0.003 (−0.005; 0.000) | 0.024 | −0.003 (−0.005; −0.001) | 0.008 | |||
| α-Tocopherol (μM) | Male (=1)a | −0.036 (−0.057; −0.015) | 0.001 | −0.040 (−0.062; −0.017) | 0.000 | 11.19 (11.09; 11.29) | 10.93 (10.83; 11.03) |
| Age (yrs)b | 0.005 (0.004; 0.006) | 0.000 | 0.005 (0.004; 0.006) | 0.000 | |||
| Uric Acid (mg/l) | Male (=1)a | 0.870 (0.807; 0.933) | 0.000 | 0.785 (0.723; 0.847) | 0.000 | 39.55 (39.02; 40.08) | 49.97 (49.36; 50.60) |
| Age (yrs)b | 0.011 (0.008; 0.013) | 0.000 | 0.007 (0.004; 0.010) | 0.000 | |||
| MDA (μM) | Male (=1)a | 0.041 (0.027; 0.056) | 0.000 | 0.045 (0.030; 0.060) | 0.000 | 0.282 (0.271; 0.293) | 0.332 (0.320; 0.344) |
| Age (yrs)b | 0.001 (0.000; 0.001) | 0.022 | 0.001 (0.000; 0.002) | 0.011 | |||
| Protein Carbonyls (nmol/mg) | Male (=1)a | −0.004 (−0.024; 0.015) | 0.659 | −0.008 (−0.028; 0.012) | 0.451 | 2.976 (2.928; 3.022) | 2.948 (2.899; 2.996) |
| Age (yrs)b | 0.000 (−0.001; 0.001) | 0.973 | 0.000 (−0.001; 0.001) | 0.953 | |||
| 3-Nitrotyrosine (pmol/mg) | Male (=1)a | −0.029 (−0.082; 0.025) | 0.295 | −0.036 (−0.092; 0.020) | 0.207 | 3.984 (3.832; 4.136) | 3.838 (3.683; 3.992) |
| Age (yrs)b | 0.000 (−0.003; 0.002) | 0.807 | −0.001 (−0.004; 0.001) | 0.263 | |||
Model 1: Multiple linear regression with age and gender as independent variables predicting biomarker concentrations.
Model 2: Multiple regression with biomarker as dependent variables and with gender, age, BMI, current smoking status and self-reported frequency of consumption of fruit, vegetables, French fries and meat as independent variables.
Age-adjusted.
Gender-adjusted.
Estimated marginal means of the biomarkers in Model 2.
Gender-specific relationships of age with biomarker concentrations were assessed by linear regression models for men and women separately (Table 3). Model 1 shows regression coefficient β for age in the unadjusted models and Model 2 shows regression coefficient β for age in the models adjusted for BMI, current smoking status, self-reported frequency of consumption of fruit, vegetables, French fries and meat.
Table 3.
Gender-specific relationships of age with biomarker concentrations.
| Model 1 |
Model 2 |
||||
|---|---|---|---|---|---|
| Beta (95%CI) | p-value | Beta (95%CI) | p-value | ||
| Cysteine | Men | 0.026 (0.019; 0.034) | 0.000 | 0.025 (0.017; 0.033) | 0.000 |
| Women | 0.034 (0.028; 0.041) | 0.000 | 0.033 (0.026; 0.040) | 0.000 | |
| Total GSH | Men | 0.001 (−0.015; 0.017) | 0.873 | 0.006 (−0.011; 0.022) | 0.496 |
| Women | −0.024 (−0.039; −0.009) | 0.002 | −0.019 (−0.035; −0.004) | 0.016 | |
| Ascorbic Acid | Men | 0.001 (−0.003; 0.005) | 0.479 | −0.001 (−0.004; 0.003) | 0.764 |
| Women | 0.000 (−0.004; 0.004) | 0.873 | 0.000 (−0.004; 0.004) | 0.884 | |
| Lycopene | Men | −0.007 (−0.008; −0.006) | 0.000 | −0.007 (−0.009; −0.006) | 0.000 |
| Women | −0.004 (−0.006; −0.003) | 0.000 | −0.004 (−0.005; −0.003) | 0.000 | |
| β-Carotene | Men | −0.003 (−0.006; 0.001) | 0.109 | −0.006 (−0.010; −0.003) | 0.000 |
| Women | −0.003 (−0.006; 0.001) | 0.113 | 0.000 (−0.003; 0.003) | 0.811 | |
| α-Tocopherol | Men | 0.002 (0.001; 0.004) | 0.001 | 0.002 (0.001; 0.004) | 0.001 |
| Women | 0.007 (0.006; 0.009) | 0.000 | 0.007 (0.006; 0.009) | 0.000 | |
| Uric Acid | Men | 0.002 (−0.002; 0.006) | 0.378 | 0.001 (−0.003; 0.005) | 0.639 |
| Women | 0.019 (0.015; 0.023) | 0.000 | 0.013 (0.010; 0.017) | 0.000 | |
| MDA | Men | 0.000 (−0.001; 0.001) | 0.834 | 0.000 (−0.001; 0.001) | 0.835 |
| Women | 0.001 (0.000; 0.002) | 0.003 | 0.002 (0.001; 0.003) | 0.001 | |
| Protein Carbonyls | Men | 0.000 (−0.001; 0.001) | 0.836 | 0.000 (−0.001; 0.001) | 0.767 |
| Women | 0.000 (−0.001; 0.001) | 0.877 | 0.000 (−0.001; 0.001) | 0.974 | |
| 3-Nitrotyrosine | Men | −0.001 (−0.005; 0.002) | 0.372 | −0.002 (−0.006; 0.001) | 0.158 |
| Women | 0.001 (−0.003; 0.004) | 0.637 | 0.000 (−0.004; 0.003) | 0.839 | |
Linear regression model.
Model 1: crude association of age with biomarkers.
Model 2: multiple regression with age as covariate, fully adjusted for BMI, current smoking status, self-reported frequency of consumption of fruit, vegetables, French fries and meat.
To better visualize age-dependencies of selected biomarkers in women and men, biomarker concentrations were plotted against age (Fig. 1) and 5-year age groups (Fig. 2, Fig. 3). Slope m of the age-dependencies was extracted from these plots using the linear equation (y = mx + b). Non-linear fitting of data to sigmoidal function was applied in figures.
Fig. 1.

MDA concentration as a function of age in women (Panel A, n = 1139) and men (Panel B, n = 1068) (mean values for all subjects of given age and SEM are depicted). Fitted dependencies are depicted as lines. All available data points were used for fitting.
Fig. 2.

MDA and total GSH age-dependencies in women (Panel A) and men (Panel B) (5-year averaged mean, SEM and fitted curves are given).
Fig. 3.

Age-dependency of uric acid concentration in plasma as mean and SEM.
The significance level was set at p < 0.05 for all analyses. Data was analyzed using Origin (OriginLab Corp., Northampton, Massachusetts, USA), JMP (SAS Institute, Cary, North Carolina, USA), Microsoft Excel (Microsoft Corp., Redmond, Washington, USA), and SPSS (SPSS Inc., Chicago, IL, USA; Version 20) software.
3. Results
The mean concentrations of OS biomarkers are differently associated with gender and age. Mean concentrations of the ten studied biomarkers in women and men and their gender-related differences are shown in Table 1.
Table 2 shows age and gender as predictors for biomarker concentrations and Table 3 shows gender-specific associations of age with biomarker concentrations. MDA is lower in women than in men (Table 1), but the MDA concentration in women, not in men, is significantly associated with age (Table 2). MDA is lower in women than in men (Table 1), shows significant associations with gender and age (Table 2), but only the MDA concentration in women, not in men, is significantly associated with age (Table 3). Hence, the age-dependency of MDA, depends on gender and the effect of gender on OS depends on age. Fig. 1 depicts the concentration of MDA as a function of age for men and for women. The MDA concentration in men appears to be independent of age (Fig. 1). In contrast, the MDA concentration of women increases at the age of around 50 years (Fig. 1, Fig. 2). Notably, the average MDA concentration in women aged 50–75 years remains significantly lower than that observed in men of the same age (p < 0.001, not shown). The stepwise increase of MDA in women is more visible when averaging its concentrations to 5-year groups (Fig. 2). Non-linear fitting of data to a sigmoidal curve allows for a more accurate evaluation of the age of transition (i.e. age, at which the slope of MDA is highest) as 53 ± 2 years.
Notably, the concentrations of the other two classical redox biomarkers, PC and NT, were similar in men and women and both appear to be independent of age and gender (Table 1, Table 2, Table 3). There were no qualitative differences (i.e. the direction of the biomarker's association with age) in antioxidants' age-dependencies between men and women except for GSH and UA (Table 3).
Total GSH was independent of age in men, whereas in women it was inversely associated with age, and this appeared simultaneously with the increase of MDA (Table 3 and Fig. 2). This inverse association of GSH with age in women was also sigmoidal, with a transition age at 56 ± 5 years. Notably, GSH, just like MDA, was higher in men than in women and independent of age in men (Table 1, Table 2, Table 3).
The steady state concentration of UA in women of age 35–50 years does not change significantly, whereas in women older than 50 years, the UA concentration increases with age, similar to MDA (Fig. 3). Unlike MDA, which reaches apparently constant levels after the age of about 55 years, UA continues to increase. Moreover, the slope is an increasing function of age. The age-independent average concentration of UA is higher in men than in women (Fig. 3).
The concentration of the water-soluble ascorbic acid is independent of age in both men and women (Table 3) and is higher in women than in men (Table 1). Cysteine concentration in women as well as β of women is higher than those in men (Table 1 and Table 3).
The three lipophilic dietary antioxidants also vary considerably concerning the direction of their correlation with age. α-Tocopherol is higher in women than in men (Table 1) is significantly associated with gender and age (Table 2). β-Carotene is significantly higher in women (Table 1), is also associated with gender and age (Table 2). By contrast, lycopene is lower in women, but shows similar relationships with age in men and women.
4. Discussion
The MARK-AGE Project yielded a large base of knowledge. Thorough analyses of the available data will likely further deepen our understanding of the redox status in the plasma. The present study is a step in this direction. It yields information on three issues: (i) the concentrations of most of commonly used biomarkers are significantly different in men and women, (ii) age is associated with changes of the different biomarkers, and (iii) different biomarkers are likely to reflect different physiological and pathological processes linked to OS, in agreement with the hypothesized existence of different types of OS. One possibility is that different biomarkers reflect different, thus far unidentified, types of OS, and that MDA and GSH reflect the same type of OS, whereas PC and NT are markers of another type (or types) of OS. The antioxidants also exhibited different gender-and age-dependencies. Again, it appears that different biomarkers reflect different types of OS.
4.1. Different types of OS
In their textbook “Free Radicals in Biology and Medicine” [3] Halliwell & Gutteridge proposed that chemistries of different reactive oxygen species (ROS) entities are distinct. This means that OS can be divided into sub-groups of different ROS. However, classification of OS may also be based on other factors including mechanistic aspects, sources, targets, reactivity, sites of occurrence.
In a study of biomarkers to assess OS in hemodialysis patients in comparison to healthy people [22], the authors concluded that the variability of results obtained using different assays “should be taken into account when interpreting data from clinical studies of OS”, in agreement with the hypothesis of different types of OS [8]. This is “especially (true) in complex pathologies” [22], which can be attributed to the association of different types of OS to different pathologies. In another study, the same authors showed that the inter-assay correlations between different antioxidant assays were difficult to interpret, since some assays showed nice correlation while others showed no correlation [23]. In addition, antioxidant status did not correlate with OS biomarkers just as the total oxidant status did not correlate with reactive oxygen metabolites (ROM). Perhaps a combination of different biomarkers would yield more results but only when they are not representing different types of OS.
In addition to the problems arising from different types of OS, there are influencing factors such as smoking [24], weight changes [25] or other characteristics [26,27] indicating different sensitivity towards different types of OS. We and others [24] agree that a gold standard method is required to evaluate OS biomarker result in human studies. However, no such biomarker of OS is available or likely to become available before we identify the various subgroups. The role of non-radical reactions in different peroxidation reactions can neither be ignored nor directly measured, particularly when free radicals and non-radical oxidants are present in the medium, as in biologic systems. Nonetheless, distinction between radical and non-radical mechanisms of injury is possible, and based on their results, Liang et al. suggested that application of their approach could “enhance understanding of the contribution of the various subgroups to the overall redox state” [28].
4.2. Biomarkers and OS
In theory, OS biomarkers may reflect different manifestations of one general factor, i.e. OS. Alternatively, the different biomarkers reflect different types of OS, which are thus far unidentified. Regardless of the identification of types of OS, MDA and GSH reflect the same type of OS, whereas the PC and NT may be markers of another type (or types) of OS. We believe that the different biomarkers reflect different sources, targets, and reactivity of OS in agreement with the idea that different types of OS exist [8,28,29].
Depending on the biomarker, a comparison of biomarker concentrations between men and women shows higher (cysteine, ascorbic acid, β-carotene, α-tocopherol), lower (total GSH, lycopene, UA, MDA) or similar values (PC and NT) in women (Table 1). Similarly, aging may be associated either with increase or decrease or no change of OS.
The gender- and age-related levels of MDA are sufficiently different to conclude that the steady state concentration of MDA is the most sensitive marker of the type of OS in the participants studied. This is consistent with the capability to use MDA levels to differentiate between different health-states, e.g. smokers and non-smokers [24]. The other studied oxidation products that serve as biomarkers (PC, NT) may be indicators of another type of OS. In other words, the different biomarkers may yield divergent results, as suggested by Dotan et al. [8] and as demonstrated by our previous report of only a small overlap of subjects under OS according to different biomarkers [10].
The impact of estrogen on human antioxidative capacity is not fully understood, it is clear that estrogens upregulate mitochondrial antioxidant defense and that the gender differences can be abolished by ovariectomy and restored by estrogen replacement therapy after ovariectomy [[30], [31], [32]]. The steady state concentrations of the studied antioxidants reflect this complex nature [33]. Specifically, several antioxidants correlate negatively with MDA, as expected for antioxidants, but others correlate positively, which may have different reasons. This issue deserves more attention.
4.3. Uric acid
UA (urate in body pH), which is an end product of purine catabolism in humans but not in lower animals, mice and rats [34], is a major contributor to the antioxidative capacity of plasma. Hence, as hypothesized earlier, gender differences in measurements of antioxidant capacity such as FRAP (fluorescence recovery after photo bleaching) are mostly due to higher UA levels in men [35]. The association between UA steady state concentration and several diseases is still “incompletely understood”, as described by Ndrepepa et al. for cardiovascular diseases [36]. Yet, in their meta-analysis the latter authors concluded that “elevated levels of UA are an independent predictor of 1-year mortality across the whole spectrum of patients with acute coronary syndromes treated with percutaneous coronary intervention”. Furthermore, a meta-analysis of prospective studies revealed that the baseline level of serum UA is an independent predictor for future cardiovascular and overall mortality in men, but not in women [37]. Whether low UA levels are predictors of mortality is still inconclusive. Yang et al. claimed that there is no statistically significant gender difference in the relationship between the level of UA and the subsequent risk of mortality [38].
In a recent publication, Lamacchia et al. investigated the association between high UA and the increased mortality risk in mice with Type 2 Diabetes mellitus (T2DM) and found a J-shaped relationship between UA levels and mortality rate [39]. Their conclusion is that UA was not linearly associated with the all-cause mortality rate in patients with T2DM. The results of the present study accord with the conclusion that “well-designed prospective studies are needed to evaluate gender-specific relation between UA level and cardiovascular and all-cause mortality risk” [38].
4.4. OS and gender
Life expectancy of women is significantly higher than that of men. To assess the possible association between the difference in life expectancy and the difference in OS, our refined analysis of the previously published results from the MARK-AGE Project for each of many biomarkers, yielded clear answers regarding the gender- and age-dependencies. However, different biomarkers yielded different answers, in agreement with our earlier studies [8,10]. The steady state concentrations of MDA and GSH are independent of age in men (Table 1). In contrast, in women the concentrations of both MDA and GSH depend on age in a complex fashion, as depicted in Fig. 2. In our opinion the age-dependency of the levels of biomarkers in women (only) is due to menopause. Menopause is associated with substantial biochemical alterations, including a significant decline in plasma concentrations of sex hormones, and an increase in the concentrations of gonadotrophins and other hormones [40]. Estrogen has antioxidant effects at high concentrations by inhibiting DNA oxidation but at low concentrations it acts like a pro-oxidant due to its catechol structure [41]. This supports the hypothesis that menopause is regarded as risk factor for OS [42,43].
4.5. OS and aging
Aging is associated with changes in different biomarkers of (per) oxidation. Data on enhanced OS and aging have been documented [44]. There are numerous publications describing associations between OS and aging in different cellular models and animal tissues. For humans the situation looks different especially since the human aging process is influenced by extrinsic factors such as diet, lifestyle factors, diseases, medication etc. and therefore cannot be considered without taking different these aspects into account. Therefore, literature is not unambiguous, in addition longitudinal data is missing.
We observed that the slopes of the age-dependencies are different for different biomarkers. Specifically, in men, only the levels of cysteine, α-tocopherol and lycopene change significantly upon aging. Notably, the concentration of the latter antioxidant (lycopene) is inversely associated with age, whereas the concentrations of both, cysteine and α-tocopherol are positively associated with age.
The age-dependent OS, as estimated based on the levels of both MDA and GSH (Fig. 2), may become higher because of the decrease in estrogens. In our study, unlike previous reports [42,43], the MDA concentration of 66 women that were treated with hormone replacement therapy did not differ significantly from the MDA level in controls (not shown). This result may be understood based on the complex redox activity of estrogens. At high concentrations, estrogens are antioxidative, whereas at low concentrations they act like a pro-oxidant [41]. Whether or not this explains the increased susceptibility to metabolic diseases has yet to be evaluated.
Different types of OS, if characterized may differ in their interactions with different antioxidants, which would lead to improvements in the treatment of OS. In addition, different types of OS may be involved in different diseases.
In conclusion, OS is still an ill-defined and misused term, being dependent on the source, target, reactivity, stability and method used to evaluate it, the sample type used and participants’ characteristics e.g. gender and age. Thus, using the steady state concentration of MDA as a biomarker, the average OS is higher and relatively independent of age in men but not in women. By contrast, if the steady state concentration of PC reflects OS, the OS “values” are independent of gender and aging. We still do not know what the differences are between the alleged OS types, but we believe that further analyses of the large data base, formed by the MARK-AGE Project data, is likely to further deepen our understanding of the redox status in the plasma.
Conflicts of interest
The authors have no competing interests.
Acknowledgment
The authors thank all the participants from the various recruitment centers and the European Commission for the financial support through the European Union's 7th Framework Programme Research and Innovation funding 2014-2020 large-scale integrating project “European Study to Establish Biomarkers of Human Ageing” (MARK-AGE; Grant Agreement no. 200880).
Footnotes
Supplementary data to this article can be found online at https://doi.org/10.1016/j.redox.2019.101204.
Contributor Information
Ilya Pinchuk, Email: ilyap@tauex.tau.ac.il.
Daniela Weber, Email: Daniela.Weber@dife.de.
Bastian Kochlik, Email: Bastian.Kochlik@dife.de.
Wolfgang Stuetz, Email: Wolfgang.Stuetz@uni-hohenheim.de.
Florence Debacq-Chainiaux, Email: florence.chainiaux@unamur.be.
Martijn E.T. Dollé, Email: Martijn.Dolle@rivm.nl.
Eugène H.J.M. Jansen, Email: eugene.jansen@rivm.nl.
Efstathios S. Gonos, Email: sgonos@eie.gr.
Ewa Sikora, Email: e.sikora@nencki.gov.pl.
Nicolle Breusing, Email: breusing@uni-hohenheim.de.
Daniela Gradinaru, Email: danielagrdnr@yahoo.com.
Thilo Sindlinger, Email: Thilo.Sindlinger@uni-konstanz.de.
María Moreno-Villanueva, Email: maria.moreno-villanueva@uni-konstanz.de.
Alexander Bürkle, Email: alexander.buerkle@uni-konstanz.de.
Tilman Grune, Email: scientific.director@dife.de.
Dov Lichtenberg, Email: physidov@tauex.tau.ac.il.
Appendix A. Supplementary data
The following is the Supplementary data to this article:
References
- 1.Harman D. Aging: a theory based on free radical and radiation chemistry. J. Gerontol. 1956;11(3):298–300. doi: 10.1093/geronj/11.3.298. [DOI] [PubMed] [Google Scholar]
- 2.Sies H. In: Sies H., editor. vol. 1. Academic Press London; 1985. (Oxidative Stress: Introductory Remarks). [Google Scholar]
- 3.Halliwell B., Gutteridge J.M.C. vol. 1. Oxford University Press; 1985. p. 346. (Free Radicals in Biology and Medicine). [Google Scholar]
- 4.Witztum J.L. To E or not to E--how do we tell? Circulation. 1998;98(25):2785–2787. doi: 10.1161/01.cir.98.25.2785. [DOI] [PubMed] [Google Scholar]
- 5.Palmieri B., Sblendorio V. Oxidative stress tests: overview on reliability and use. Part I. Eur. Rev. Med. Pharmacol. Sci. 2007;11(5):309–342. [PubMed] [Google Scholar]
- 6.Palmieri B., Sblendorio V. Oxidative stress tests: overview on reliability and use. Part II. Eur. Rev. Med. Pharmacol. Sci. 2007;11(6):383–399. [PubMed] [Google Scholar]
- 7.Sies H. Oxidative stress: a concept in redox biology and medicine. Redox Biol. 2015;4:180–183. doi: 10.1016/j.redox.2015.01.002. [DOI] [PMC free article] [PubMed] [Google Scholar]
- 8.Dotan Y., Lichtenberg D., Pinchuk I. Lipid peroxidation cannot be used as a universal criterion of oxidative stress. Prog. Lipid Res. 2004;43(3):200–227. doi: 10.1016/j.plipres.2003.10.001. [DOI] [PubMed] [Google Scholar]
- 9.Mates J.M., Perez-Gomez C., Nunez de Castro I. Antioxidant enzymes and human diseases. Clin. Biochem. 1999;32(8):595–603. doi: 10.1016/s0009-9120(99)00075-2. [DOI] [PubMed] [Google Scholar]
- 10.Lichtenberg D., Pinchuk I., Weber D. Oxidative stress, as assayed by a single test, cannot be used as a diagnostic tool. Biofactors. 2018;44(3):222–223. doi: 10.1002/biof.1420. [DOI] [PubMed] [Google Scholar]
- 11.Sies H. Hydrogen peroxide as a central redox signaling molecule in physiological oxidative stress: oxidative eustress. Redox Biol. 2017;11:613–619. doi: 10.1016/j.redox.2016.12.035. [DOI] [PMC free article] [PubMed] [Google Scholar]
- 12.Sies H., Berndt C., Jones D.P. Oxidative stress. Annu. Rev. Biochem. 2017;86:715–748. doi: 10.1146/annurev-biochem-061516-045037. [DOI] [PubMed] [Google Scholar]
- 13.Weber D. Associations between specific redox biomarkers and age in a large European cohort: the MARK-AGE project. Oxid. Med. Cell Longev. 2017;2017:1401452. doi: 10.1155/2017/1401452. [DOI] [PMC free article] [PubMed] [Google Scholar]
- 14.Burkle A. MARK-AGE biomarkers of ageing. Mech. Ageing Dev. 2015;151:2–12. doi: 10.1016/j.mad.2015.03.006. [DOI] [PubMed] [Google Scholar]
- 15.Capri M. MARK-AGE population: from the human model to new insights. Mech. Ageing Dev. 2015;151:13–17. doi: 10.1016/j.mad.2015.03.010. [DOI] [PubMed] [Google Scholar]
- 16.Moreno-Villanueva M. MARK-AGE standard operating procedures (SOPs): a successful effort. Mech. Ageing Dev. 2015;151:18–25. doi: 10.1016/j.mad.2015.03.007. [DOI] [PubMed] [Google Scholar]
- 17.Moreno-Villanueva M. The MARK-AGE phenotypic database: structure and strategy. Mech. Ageing Dev. 2015;151:26–30. doi: 10.1016/j.mad.2015.03.005. [DOI] [PubMed] [Google Scholar]
- 18.Jansen E. Quality control data of physiological and immunological biomarkers measured in serum and plasma. Mech. Ageing Dev. 2015;151:54–59. doi: 10.1016/j.mad.2015.06.004. [DOI] [PubMed] [Google Scholar]
- 19.Gradinaru D. Oxidized LDL and NO synthesis–Biomarkers of endothelial dysfunction and ageing. Mech. Ageing Dev. 2015;151:101–113. doi: 10.1016/j.mad.2015.03.003. [DOI] [PubMed] [Google Scholar]
- 20.Stuetz W. Plasma carotenoids, tocopherols, and retinol in the age-stratified (35-74 Years) general population: a cross-sectional study in six European countries. Nutrients. 2016;8(10) doi: 10.3390/nu8100614. [DOI] [PMC free article] [PubMed] [Google Scholar]
- 21.Moreno-Villanueva M., Burkle A. Epigenetic and redox biomarkers: novel insights from the MARK-AGE Study. Mech Ageing Dev. 2019 Jan;177:128–134. doi: 10.1016/j.mad.2018.06.006. Epub 2018 Jun 30. [DOI] [PubMed] [Google Scholar]
- 22.Ruskovska T., Jansen E.H., Antarorov R. Evaluation of assays for measurement of serum (anti)oxidants in hemodialysis patients. BioMed Res. Int. 2014;2014:843157. doi: 10.1155/2014/843157. [DOI] [PMC free article] [PubMed] [Google Scholar]
- 23.Jansen E.H., Ruskovska T. Comparative analysis of serum (Anti)oxidative status parameters in healthy persons. Int. J. Mol. Sci. 2013;14(3):6106–6115. doi: 10.3390/ijms14036106. [DOI] [PMC free article] [PubMed] [Google Scholar]
- 24.Cighetti G. Oxidative status in different settings and with different methodological approaches compared by Receiver Operating Characteristic curve analysis. Clin. Biochem. 2015;48(1–2):73–78. doi: 10.1016/j.clinbiochem.2014.09.025. [DOI] [PubMed] [Google Scholar]
- 25.Vassalle C. A biomarker of oxidative stress as a nontraditional risk factor in obese subjects. Biomark. Med. 2013;7(4):633–639. doi: 10.2217/bmm.13.49. [DOI] [PubMed] [Google Scholar]
- 26.Schottker B. Evidence for the free radical/oxidative stress theory of ageing from the CHANCES consortium: a meta-analysis of individual participant data. BMC Med. 2015;13:300. doi: 10.1186/s12916-015-0537-7. [DOI] [PMC free article] [PubMed] [Google Scholar]
- 27.Schottker B. Oxidative stress markers and all-cause mortality at older age: a population-based cohort study. J. Gerontol. A Biol. Sci. Med. Sci. 2015;70(4):518–524. doi: 10.1093/gerona/glu111. [DOI] [PubMed] [Google Scholar]
- 28.Liang Y. Determination of ebselen-sensitive reactive oxygen metabolites (ebROM) in human serum based upon N,N'-diethyl-1,4-phenylenediamine oxidation. Clin. Chim. Acta. 2012;414:1–6. doi: 10.1016/j.cca.2012.06.003. [DOI] [PMC free article] [PubMed] [Google Scholar]
- 29.Jones D.P. Radical-free biology of oxidative stress. Am. J. Physiol. Cell Physiol. 2008;295(4):C849–C868. doi: 10.1152/ajpcell.00283.2008. [DOI] [PMC free article] [PubMed] [Google Scholar]
- 30.Bellanti F. Sex hormones modulate circulating antioxidant enzymes: impact of estrogen therapy. Redox Biol. 2013;1:340–346. doi: 10.1016/j.redox.2013.05.003. [DOI] [PMC free article] [PubMed] [Google Scholar]
- 31.Priyanka H.P. Menstrual cycle and reproductive aging alters immune reactivity, NGF expression, antioxidant enzyme activities, and intracellular signaling pathways in the peripheral blood mononuclear cells of healthy women. Brain Behav. Immun. 2013;32:131–143. doi: 10.1016/j.bbi.2013.03.008. [DOI] [PubMed] [Google Scholar]
- 32.Priyanka H.P. Estrogen modulates beta2-adrenoceptor-induced cell-mediated and inflammatory immune responses through ER-alpha involving distinct intracellular signaling pathways, antioxidant enzymes, and nitric oxide. Cell. Immunol. 2014;292(1–2):1–8. doi: 10.1016/j.cellimm.2014.08.001. [DOI] [PubMed] [Google Scholar]
- 33.Lushchak V.I. Free radicals, reactive oxygen species, oxidative stress and its classification. Chem. Biol. Interact. 2014;224:164–175. doi: 10.1016/j.cbi.2014.10.016. [DOI] [PubMed] [Google Scholar]
- 34.Chen C., Lu J.M., Yao Q. Hyperuricemia-related diseases and xanthine oxidoreductase (XOR) inhibitors: an overview. Med. Sci. Mon. Int. Med. J. Exp. Clin. Res. 2016;22:2501–2512. doi: 10.12659/MSM.899852. [DOI] [PMC free article] [PubMed] [Google Scholar]
- 35.Benzie I.F., Chung W.Y. Total antioxidant power of plasma: male-female differences and effect of anticoagulant used. Ann. Clin. Biochem. 1999;36(Pt 1):104–106. doi: 10.1177/000456329903600116. [DOI] [PubMed] [Google Scholar]
- 36.Ndrepepa G. Prognostic value of uric acid in patients with acute coronary syndromes. Am. J. Cardiol. 2012;109(9):1260–1265. doi: 10.1016/j.amjcard.2011.12.018. [DOI] [PubMed] [Google Scholar]
- 37.Zhao G. Baseline serum uric acid level as a predictor of cardiovascular disease related mortality and all-cause mortality: a meta-analysis of prospective studies. Atherosclerosis. 2013;231(1):61–68. doi: 10.1016/j.atherosclerosis.2013.08.023. [DOI] [PubMed] [Google Scholar]
- 38.Yang Y. Serum uric acid as a predictor for cardiovascular and all-cause mortality in women versus men. Int. J. Cardiol. 2015;185:125–128. doi: 10.1016/j.ijcard.2015.03.121. [DOI] [PubMed] [Google Scholar]
- 39.Lamacchia O. On the non-linear association between serum uric acid levels and all-cause mortality rate in patients with type 2 diabetes mellitus. Atherosclerosis. 2017;260:20–26. doi: 10.1016/j.atherosclerosis.2017.03.008. [DOI] [PubMed] [Google Scholar]
- 40.Honour J.W. Biochemistry of the menopause. Ann. Clin. Biochem. 2018;55(1):18–33. doi: 10.1177/0004563217739930. [DOI] [PubMed] [Google Scholar]
- 41.Doshi S.B., Agarwal A. The role of oxidative stress in menopause. J Midlife Health. 2013;4(3):140–146. doi: 10.4103/0976-7800.118990. [DOI] [PMC free article] [PubMed] [Google Scholar]
- 42.Sanchez-Rodriguez M.A. Effects of hormone therapy on oxidative stress in postmenopausal women with metabolic syndrome. Int. J. Mol. Sci. 2016;17(9) doi: 10.3390/ijms17091388. [DOI] [PMC free article] [PubMed] [Google Scholar]
- 43.Bednarek-Tupikowska G. Serum lipid peroxides and total antioxidant status in postmenopausal women on hormone replacement therapy. Gynecol. Endocrinol. 2004;19(2):57–63. doi: 10.1080/09513590412331272328. [DOI] [PubMed] [Google Scholar]
- 44.Mendoza-Nunez V.M. Aging-related oxidative stress in healthy humans. Tohoku J. Exp. Med. 2007;213(3):261–268. doi: 10.1620/tjem.213.261. [DOI] [PubMed] [Google Scholar]
Associated Data
This section collects any data citations, data availability statements, or supplementary materials included in this article.